
Will the Adoption of Early Fertigation Techniques Hinder Famers’ Technology Renewal? Evidence from Fresh Growers in Shaanxi, China


Abstract
:1. Introduction
2. Model and Deduction
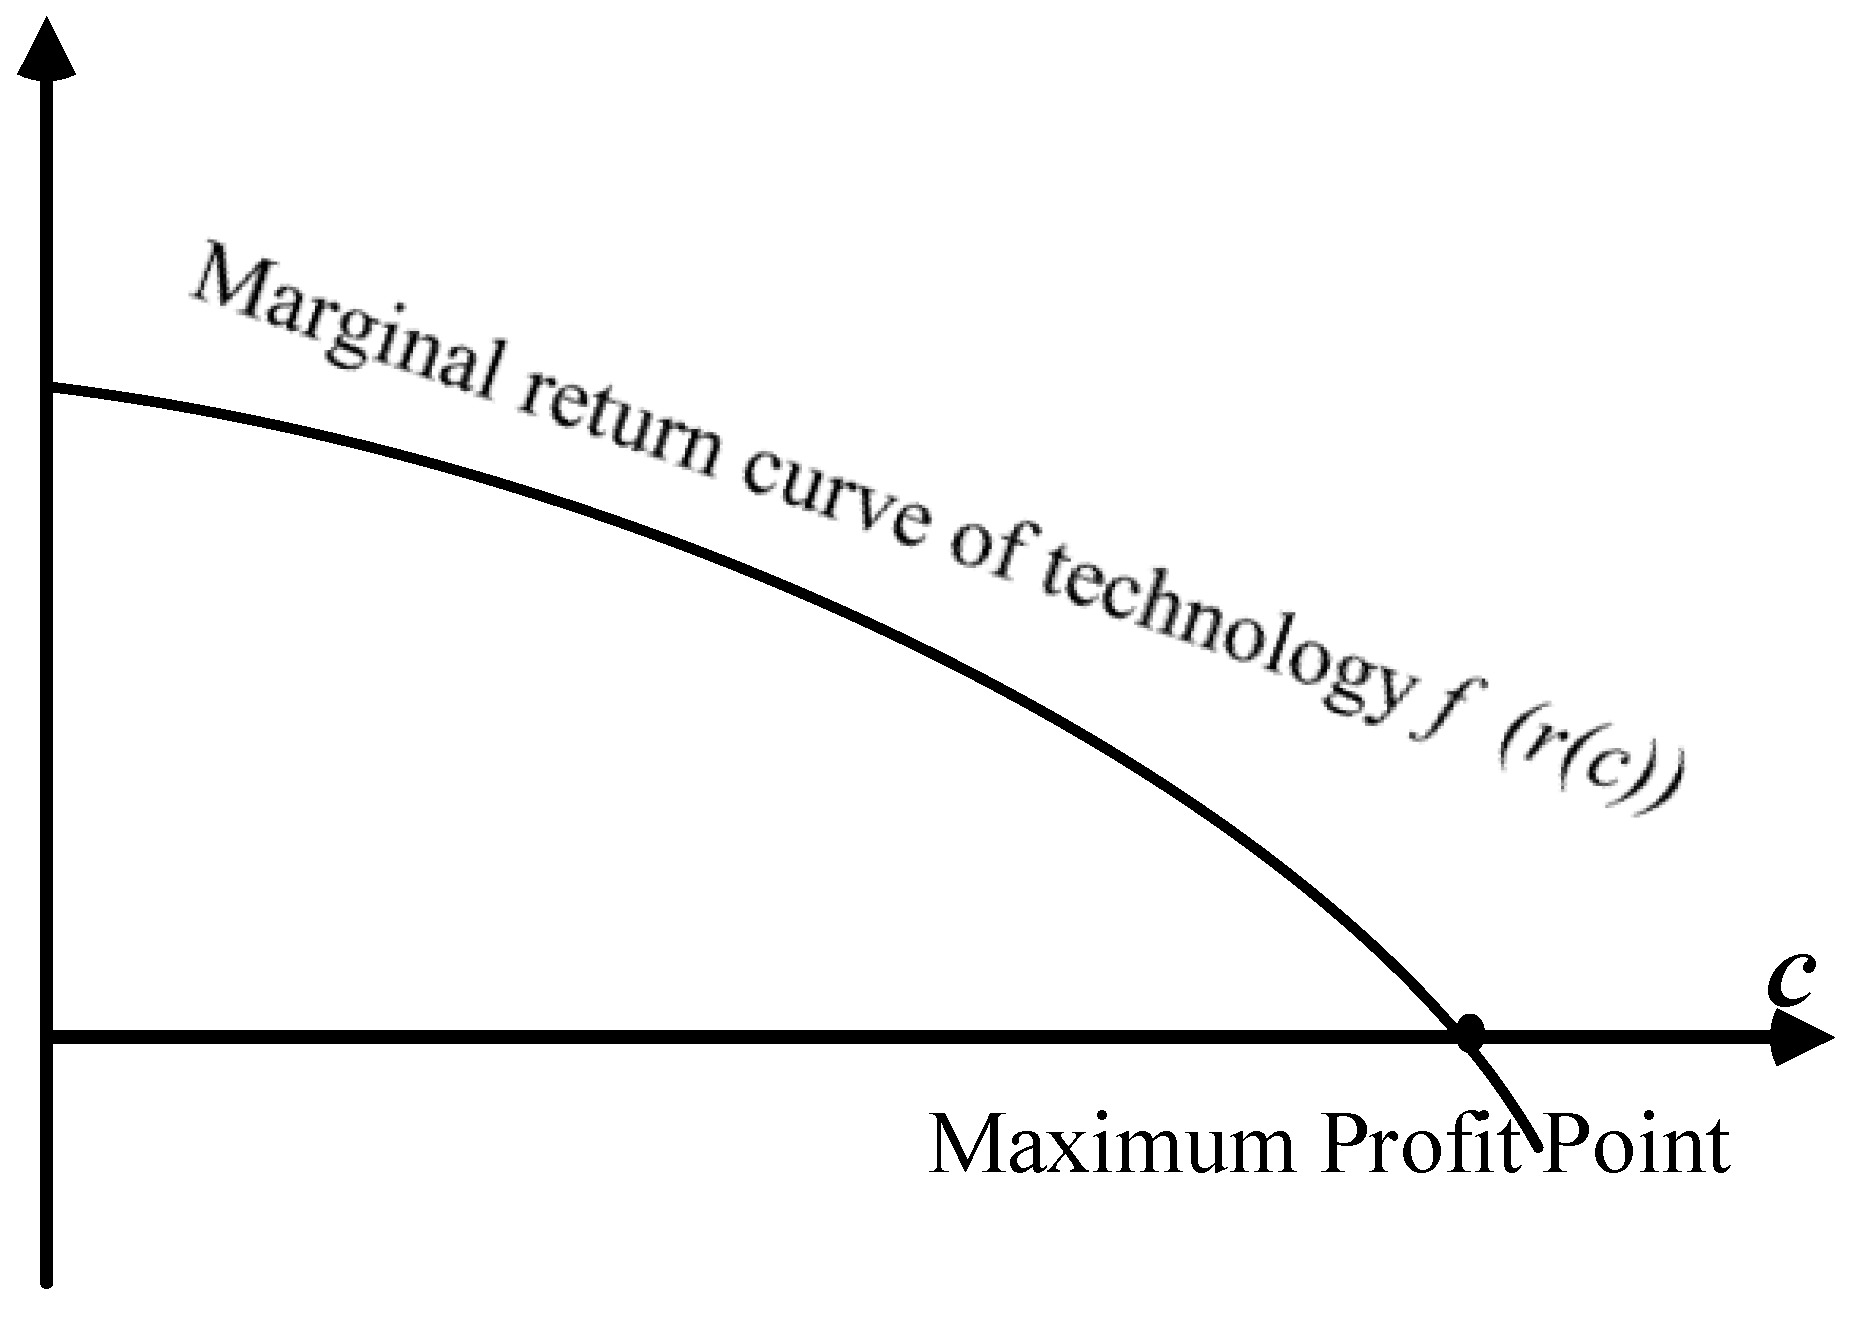
2.1. Investment Return Curve of Technology Adoption
2.2. The Role of Borrowed Funds
2.3. The Role of Famers’ Understanding
2.4. Impact of Early Technology Adoption
3. Data
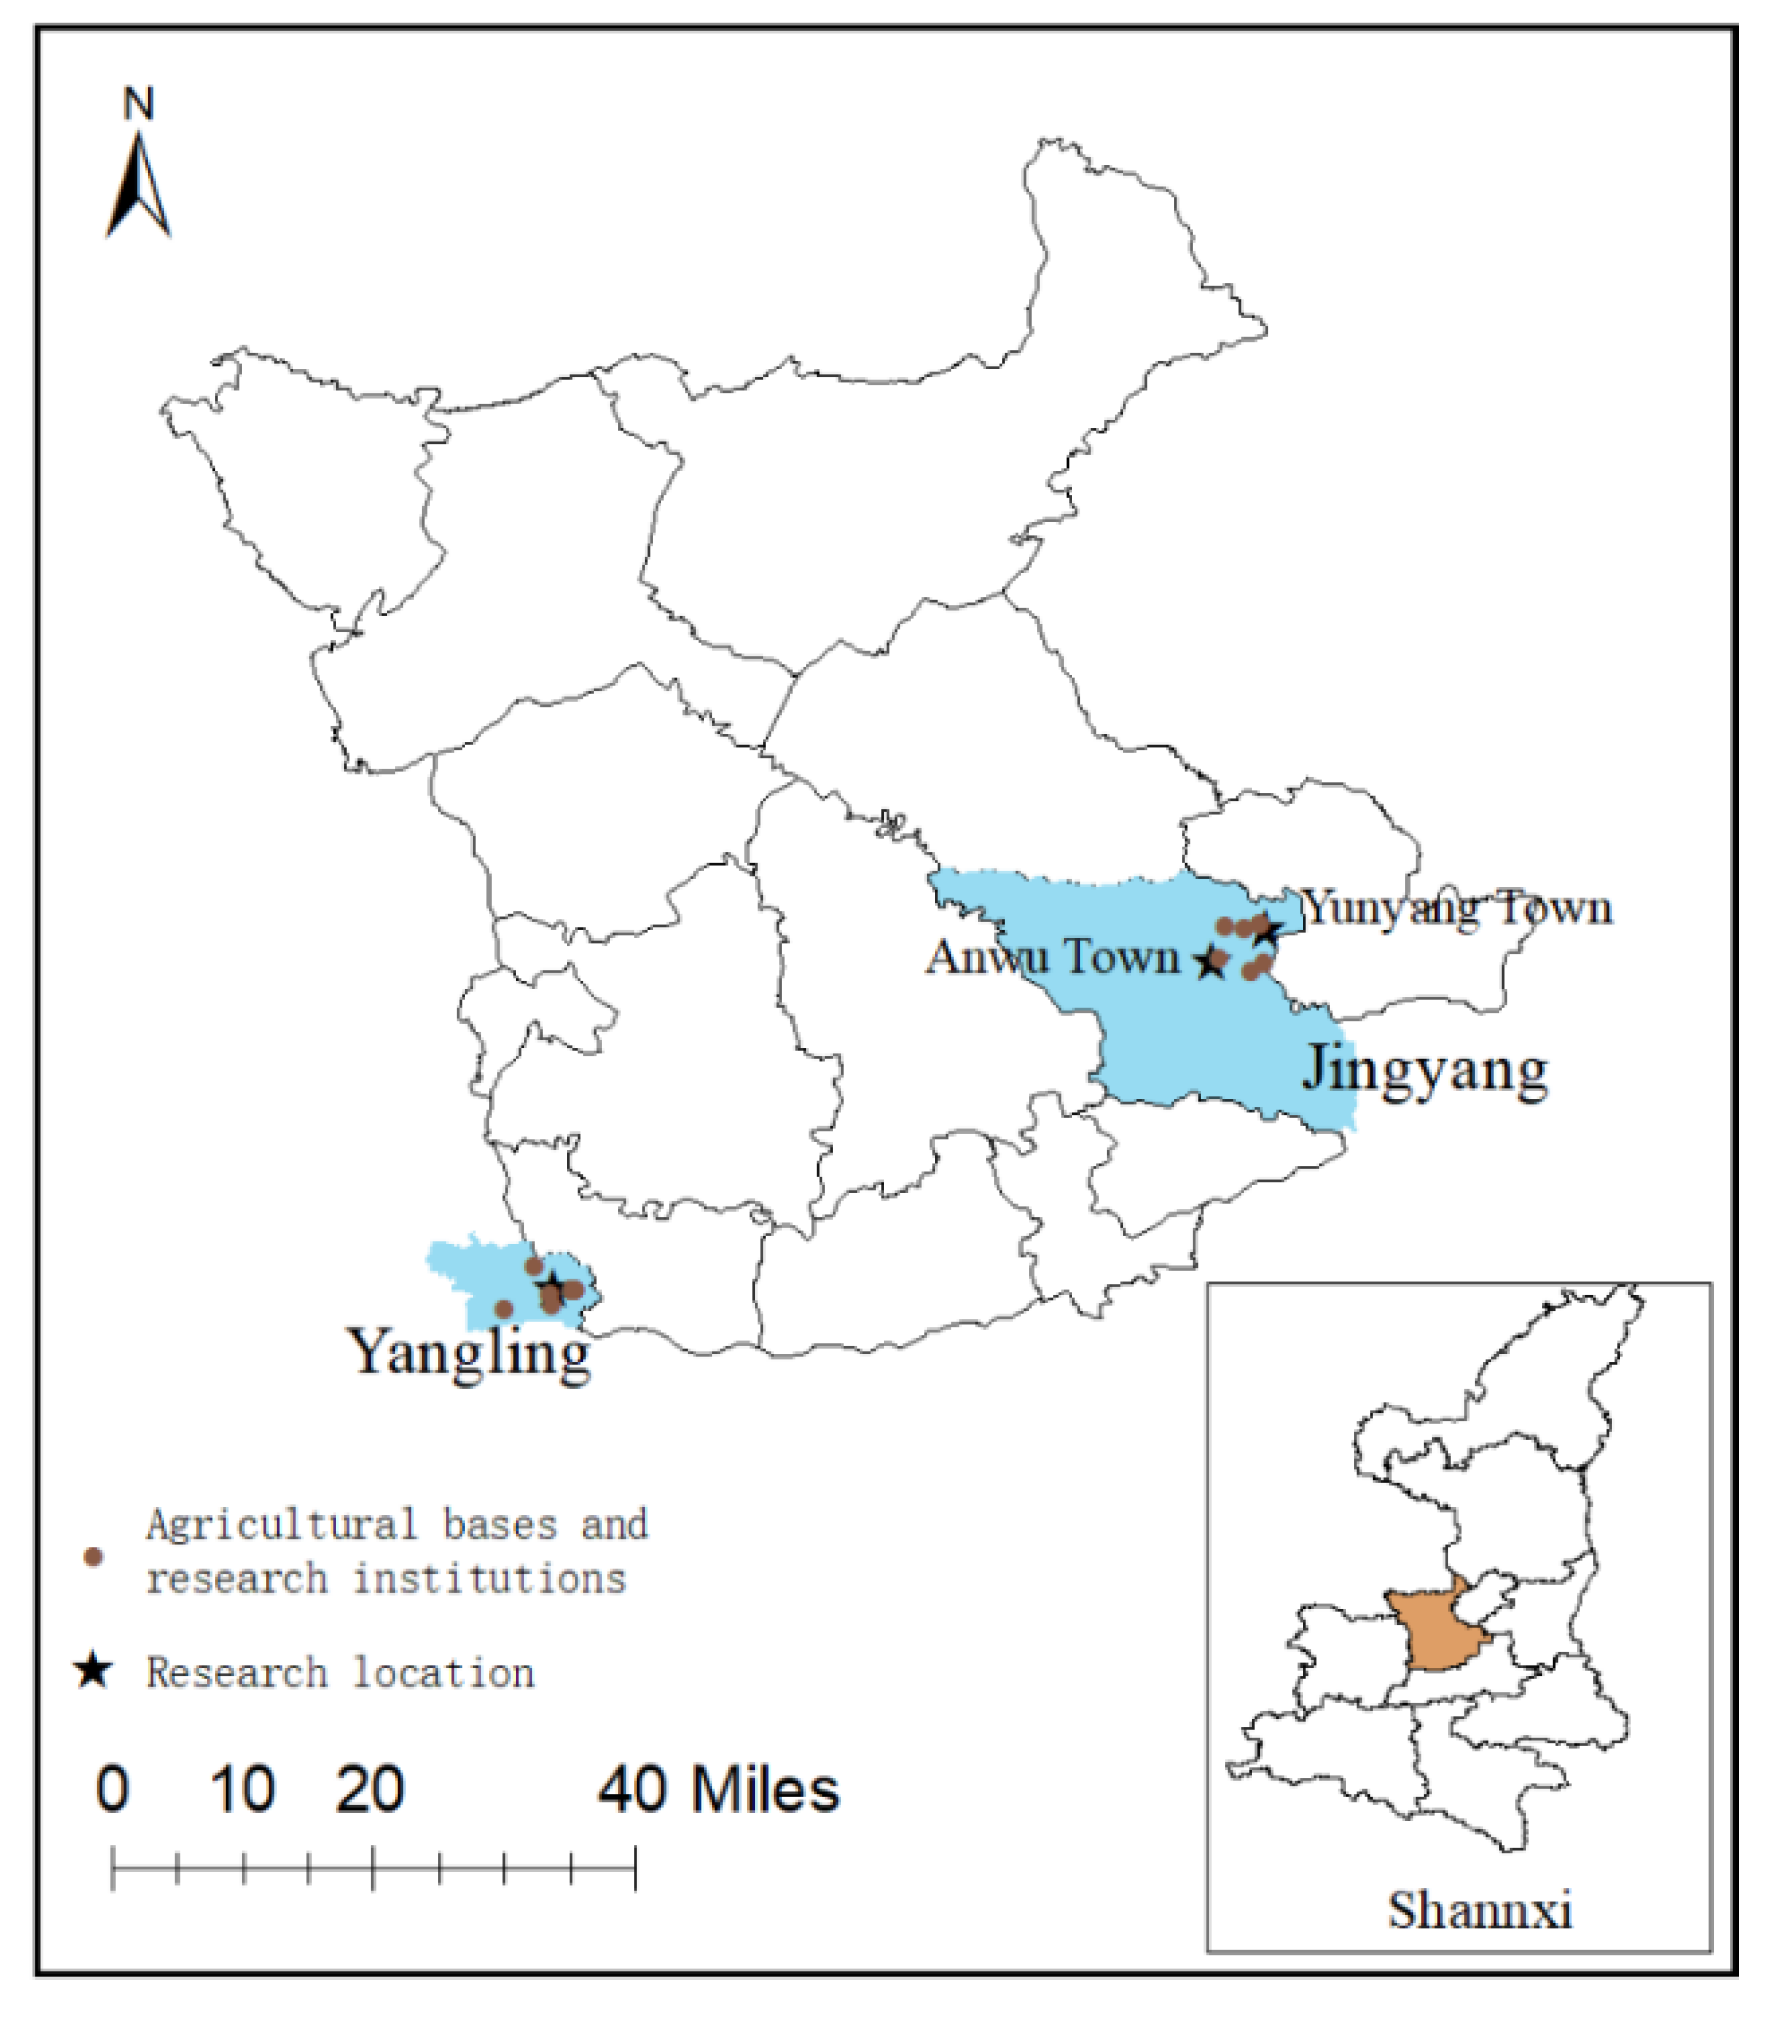
3.1. Research Area
3.2. Sampling Survey
3.3. Econometric Models
3.3.1. Logit Model
3.3.2. Propensity Score Matching
4. Results and Discussion
4.1. Logit Model for Deducation 1 and 2
4.1.1. Collinearity Test and Data Distribution Test
4.1.2. Estimation Results of Logit Model
4.2. Propensity Score Matching for Deducation 3
4.3. Discussion
4.4. Robustness Test
5. Conclusions
Supplementary Materials
Author Contributions
Funding
Institutional Review Board Statement
Informed Consent Statement
Data Availability Statement
Conflicts of Interest
References
- Ma, L.; Ni, J.; Fleskens, L.; Wang, H.; Xuan, Y. Modelling Fertilizer Use in Relation to Farmers’ Household Characteristics in Three. Agriculture 2021, 11, 472. [Google Scholar] [CrossRef]
- Azad, N.; Behmanesh, J.; Rezaverdinejad, V.; Abbasi, F.; Navabian, M. Developing an optimization model in drip fertigation management to consider environmental issues and supply plant requirements. Agric. Water Manag. 2018, 208, 344–356. [Google Scholar] [CrossRef]
- Fan, J.; Lu, X.; Gu, S.; Guo, X. Improving nutrient and water use efficiencies using water-drip irrigation and fertilization tech-nology in Northeast China. Agric. Water Manag. 2020, 241, 106352. [Google Scholar] [CrossRef]
- Cui, Y.; Meng, J.; Lu, C. Recent developments in China’s labor market: Labor shortage, rising wages and their implications. Rev. Devel. Econ. 2018, 22, 1217–1238. [Google Scholar] [CrossRef]
- Lu, H.; Xie, H. Impact of changes in labor resources and transfers of land use rights on agricultural non-point source pollution in Jiangsu Province, China. J. Environ. Manag. 2018, 207, 134–140. [Google Scholar] [CrossRef]
- Xu, D.-D.; Cao, S.; Wang, X.-X.; Liu, S.-Q. Influences of labor migration on rural household land transfer: A case study of Sichuan Province, China. J. Mt. Sci. 2018, 15, 2055–2067. [Google Scholar] [CrossRef]
- Xu, Y.; Huang, X.; Bao, H.X.H.; Ju, X.; Zhong, T.; Chen, Z.; Zhou, Y. Rural land rights reform and agri-environmental sustainability: Empirical evidence from China. Land Use Policy 2018, 74, 73–87. [Google Scholar] [CrossRef]
- Bamurigire, P.; Vodacek, A.; Valko, A.; Ngoga, S.R. Simulation of Internet of Things Water Management for Efficient Rice Irrigation in Rwanda. Agriculture 2020, 10, 431. [Google Scholar] [CrossRef]
- Li, H.; Tang, P.; Chen, C.; Zhang, Z.; Xia, H. Research status and development trend of fertilization equipment used in fertigation in China. J. Drain. Irrig. Machin. Eng. 2021, 39, 200–209. (In Chinese) [Google Scholar]
- Ruan, J.; Jiang, H.; Li, X.; Shi, Y.; Chan, F.T.S.; Rao, W. A Granular GA-SVM Predictor for Big Data in Agricultural Cyber-Physical Systems. IEEE Trans. Ind. Inform. 2019, 15, 6510–6521. [Google Scholar] [CrossRef]
- Yang, Q.; Zhu, Y.; Wang, J. Adoption of drip fertigation system and technical efficiency of cherry tomato farmers in Southern China. J. Clean. Prod. 2020, 275, 123980. [Google Scholar] [CrossRef]
- Magruder, J.R. An Assessment of Experimental Evidence on Agricultural Technology Adoption in Developing Countries. Annu. Rev. Resour. Economics 2018, 10, 299–316. [Google Scholar] [CrossRef]
- Yang, Q.; Zhu, Y.; Wang, F. Exploring Mediating Factors between Agricultural Training and Farmers’ Adoption of Drip Fer-tigation System: Evidence from Banana Farmers in China. Water 2021, 13, 1364. [Google Scholar] [CrossRef]
- Suvedi, M.; Ghimire, R.; Kaplowitz, M. Farmers’ participation in extension programs and technology adoption in rural Nepal: A logistic regression analysis. J. Agric. Educ. Ext. 2017, 23, 351–371. [Google Scholar] [CrossRef]
- Moges, D.M.; Taye, A.A. Determinants of farmers’ perception to invest in soil and water conservation technologies in the North-Western Highlands of Ethiopia. Int. Soil Water Conserv. Res. 2017, 5, 56–61. [Google Scholar] [CrossRef]
- Bramley, R.G.V.; Ouzman, J. Farmer attitudes to the use of sensors and automation in fertilizer decision-making: Nitrogen fertilization in the Australian grains sector. Precis. Agric. 2019, 20, 157–175. [Google Scholar] [CrossRef]
- Kaliyeva, S.; Areal, F.; Gadanakis, Y. Would Kazakh Citizens Support a Milk Co-Operative System? Agriculture 2021, 11, 642. [Google Scholar] [CrossRef]
- Miller, N.J.; Griffin, T.W.; Bergtold, J.; Ciampitti, I.A.; Sharda, A. Farmers’ Adoption Path of Precision Agriculture Technology. Adv. Anim. Biosci. 2017, 8, 708–712. [Google Scholar] [CrossRef]
- Abro, Z.A.; Jaleta, M.; Teklewold, H. Does Intensive Tillage Enhance Productivity and Reduce Risk Exposure? Panel Data Evidence from Smallholders’ Agriculture in Ethiopia. J. Agric. Econ. 2018, 69, 756–776. [Google Scholar] [CrossRef]
- Mao, H.; Luo, X.; Tang, L.; Huang, Y. Adoption decisions of multiple agricultural green production technologies: Explanatory factors and correlation analysis. J. China Agric. Univ. 2021, 26, 231–244. (In Chinese) [Google Scholar]
- Garcia, R.; Calantone, R. A critical look at technological innovation typology and innovativeness terminology: A literature review. J. Prod. Innov. Manag. 2002, 19, 110–132. [Google Scholar] [CrossRef] [Green Version]
- Hasler, K.; Olfs, H.-W.; Omta, O.; Bröring, S. Drivers for the Adoption of Different Eco-Innovation Types in the Fertilizer Sector: A Review. Sustainability 2017, 9, 2216. [Google Scholar] [CrossRef] [Green Version]
- Nadia, A.; Shahrina, M.; Mohamad, A.B.; Ahmad, H. A state-of-the-art review on facilitating sustainable agriculture through green fertilizer technology adoption: Assessing farmers behavior. Trends Food Sci. Technol. 2019, 86, 439–452. [Google Scholar]
- Zerssa, G.; Feyssa, D.; Kim, D.-G.; Eichler-Löbermann, B. Challenges of Smallholder Farming in Ethiopia and Opportunities by Adopting Climate-Smart Agriculture. Agriculture 2021, 11, 192. [Google Scholar] [CrossRef]
- Bukchin, S.; Kerret, D. The role of self-control, hope and information in technology adoption by smallholder farmers—A moderation model. J. Rural. Stud. 2020, 74, 160–168. [Google Scholar] [CrossRef]
- Emerick, K.; Dar, M.H. Farmer Field Days and Demonstrator Selection for Increasing Technology Adoption. Rev. Econ. Stat. 2021, 103, 1–14. [Google Scholar] [CrossRef]
- Nakano, Y.; Tsusaka, T.; Aida, T.; Pede, V.O. Is farmer-to-farmer extension effective? The impact of training on technology adoption and rice farming productivity in Tanzania. World Dev. 2018, 105, 336–351. [Google Scholar] [CrossRef] [Green Version]
- Baumgart-Getz, A.; Prokopy, L.S.; Floress, K. Why farmers adopt best management practice in the United States: A meta-analysis of the adoption literature. J. Environ. Manag. 2012, 96, 17–25. [Google Scholar] [CrossRef] [Green Version]
- Wassie, A.; Pauline, N. Evaluating smallholder farmers’ preferences for climate smart agricultural practices in Tehuledere District, northeastern Ethiopia. Singap. J. Trop. Geogr. 2018, 39, 300–316. [Google Scholar] [CrossRef]
- Mishra, B.; Gyawali, B.R.; Paudel, K.P.; Poudyal, N.C.; Simon, M.F.; Dasgupta, S.; Antonious, G. Adoption of Sustainable Agriculture Practices among Farmers in Kentucky, USA. Environ. Manag. 2018, 62, 1060–1072. [Google Scholar] [CrossRef]
- Takahashi, K.; Muraoaka, R.; Otsuka, K. Technology adoption, impact, and extension in developing countries’ agriculture: A review of the recent literature. Agric. Econ. 2019, 51, 31–45. [Google Scholar] [CrossRef]
- Atanu, S.; Love, H.A.; Schwart, R.; Saha, A. Adoption of Emerging Technologies Under Output Uncertainty. Am. J. Agric. Econ. 1994, 76, 836–846. [Google Scholar] [CrossRef]
- Kong, X.; Fang, S.; Pang, X.; Ma, J. Analysis of the effect of household endowments on the agricultural technology adoption decision in west China. Econ. Res. J. 2004, 12, 122–195. (In Chinese) [Google Scholar]
- Mas-Colell, A.; Michael, W.; Jerry, G. Microeconomic Theory; Oxford University Press: Oxford, UK, 1995. [Google Scholar]
- Wossen, T.; Abdoulaye, T.; Alene, A.; Haile, M.G.; Feleke, S.; Olanrewaju, A.; Manyong, V. Impacts of extension access and cooperative membership on technology adoption and household welfare. J. Rural. Stud. 2017, 54, 223–233. [Google Scholar] [CrossRef]
- Dumortier, J.; Kauffman, N.; Hayes, D.J. Production and spatial distribution of switchgrass and miscanthus in the United States under uncertainty and sunk cost. Energy Econ. 2017, 67, 300–314. [Google Scholar] [CrossRef] [Green Version]
- Sawut, R.; Kasim, N.; Maihemuti, B.; Hu, L.; Abliz, A.; Abdujappar, A.; Kurban, M. Pollution characteristics and health risk assessment of heavy metals in the vegetable bases of northwest China. Sci. Total. Environ. 2018, 642, 864–878. [Google Scholar] [CrossRef] [PubMed]
- 2019 Jingyang Vegetable Industry Development Report. Available online: http://www.snjingyang.gov.cn/gk/wuxianggongkai/jieguogongkai/79128.htm (accessed on 27 June 2021).
- Lu, H.; Hu, L.; Zheng, W.; Yao, S.; Qian, L. Impact of household land endowment and environmental cognition on the willing-ness to implement straw incorporation in China. J. Clean. Prod. 2020, 262, 121479. [Google Scholar] [CrossRef]
- Dill, M.D.; Emvalomatis, G.; Saatkamp, H.; Rossi, J.A.; Pereira, G.; Barcellos, J. Factors affecting adoption of economic management practices in beef cattle production in Rio Grande do Sul state, Brazil. J. Rural. Stud. 2015, 42, 21–28. [Google Scholar] [CrossRef]
- Lundström, C.; Lindblom, J. Considering farmers’ situated knowledge of using agricultural decision support systems (AgriDSS) to Foster farming practices: The case of CropSAT. Agric. Syst. 2018, 159, 9–20. [Google Scholar] [CrossRef]
- McCord, P.F.; Cox, M.; Schmitt-Harsh, M.; Evans, T. Crop diversification as a smallholder livelihood strategy within semi-arid agricultural systems near Mount Kenya. Land Use Policy 2015, 42, 738–750. [Google Scholar] [CrossRef]
- Madhava, C.; Pillai, U.S. Effect on Crop Yield and Perceptions of Farmers on Drip Fertigation: Study From Kerala State, India. Inter. J. Sci. Res. 2015, 4, 10. [Google Scholar]
- Zeweld, W.; Van Huylenbroeck, G.; Tesfay, G.; Speelman, S. Smallholder farmers’ behavioural intentions towards sustainable agricultural practices. J. Environ. Manag. 2017, 187, 71–81. [Google Scholar] [CrossRef] [PubMed] [Green Version]
- Van Winsen, F.; de Mey, Y.; Lauwers, L.; van Passel, S.; Vancauteren, M.; Wauters, E. Cognitive mapping: A method to elucidate and present farmers’ risk perception. Agric. Syst. 2013, 122, 42–52. [Google Scholar] [CrossRef]
- Ma, W.; Renwick, A.; Yuan, P.; Ratna, N. Agricultural cooperative membership and technical efficiency of apple farmers in China: An analysis accounting for selectivity bias. Food Policy 2018, 81, 122–132. [Google Scholar] [CrossRef]
- Benedetto, U.; Head, S.J.; Angelini, G.D.; Blackstone, E.H. Statistical primer: Propensity score matching and its alternatives. Eur. J. Cardio-Thoracic Surg. 2018, 53, 1112–1117. [Google Scholar] [CrossRef] [Green Version]
- Rosenbaum, P.R.; Rubin, D.B. The Central Role of the Propensity Score in Observational Studies for Causal Effects. Biometrika 1983, 70, 41–55. [Google Scholar] [CrossRef]
- Yongnam, K.; Peter, S. Quasi-Experimental Designs for Causal Inference. Educ. Psychol. 2016, 51, 395–405. [Google Scholar]
- Norton, E.C.; Dowd, B.E. Log Odds and the Interpretation of Logit Models. Health Serv. Res. 2018, 53, 859–878. [Google Scholar] [CrossRef]
- Caliendo, M.; Kopeinig, S. Some Practical Guidance for The Implementation of Propensity Score Matching. J. Econ. Surv. 2008, 22, 31–72. [Google Scholar] [CrossRef] [Green Version]
- Jayne, T.; Snapp, S.; Place, F.; Sitko, N. Sustainable agricultural intensification in an era of rural transformation in Africa. Glob. Food Secur. 2019, 20, 105–113. [Google Scholar] [CrossRef]
- Brown, B.; Nuberg, I.; Llewellyn, R. Negative evaluation of conservation agriculture: Perspectives from African smallholder farmers. Int. J. Agric. Sustain. 2017, 15, 467–481. [Google Scholar] [CrossRef]
- Wu, H.; Ge, Y. Excessive Application of Fertilizer, Agricultural Non-Point Source Pollution, and Farmers’ Policy Choice. Sustainability 2019, 11, 1165. [Google Scholar] [CrossRef] [Green Version]
- Ahmad, N. Descriptive Study of Cucumber Farmers’ Awareness and Perception in ‘Jordan Valley’ Toward Fertigation Technology. Am. Eurasian J. Agric. Environ. Sci. 2011, 11, 857–862. [Google Scholar]
- Genius, M.; Koundouri, P.; Nauges, C.; Tzouvelekas, V. Information Transmission in Irrigation Technology Adoption and Dif-fusion: Social Learning, Extension Services, and Spatial Effects. Am. J. Agric. Econ. 2014, 96, 328–344. [Google Scholar] [CrossRef] [Green Version]
- Duflo, E.; Kremer, M.; Robinson, J. Nudging Farmers to Use Fertilizer: Theory and Experimental Evidence from Kenya. Am. Econ. Rev. 2009, 101, 2350–2390. [Google Scholar] [CrossRef] [Green Version]
- Williams, R. Using Heterogeneous Choice Models to Compare Logit and Probit Coefficients Across Groups. Sociol. Methods Res. 2009, 37, 531–559. [Google Scholar] [CrossRef] [Green Version]


| Classification | Variables | Types | Frequency (n) | Percentage (%) |
|---|---|---|---|---|
| Information processing capacity | Age | 20–40 years old | 40 | 12.12 |
| 41–60 years old | 229 | 69.39 | ||
| Over 60 years old | 61 | 18.48 | ||
| Education | Under 6 years | 87 | 26.36 | |
| Primary school | 92 | 27.87 | ||
| Junior high school | 120 | 36.36 | ||
| High school education or Higher | 31 | 9.39 | ||
| Information Channels | Computer | Computer | 166 | 50.30 |
| Training | Technical training | 62 | 18.79 | |
| Contract | Contract farming | 93 | 28.18 | |
| Relatives | Expert relatives or friends | 70 | 21.21 | |
| Production characteristics | Land Area | <5 mu | 93 | 28.18 |
| 5–10 mu | 197 | 59.70 | ||
| 10–20 mu | 35 | 10.61 | ||
| >20 mu | 5 | 1.51 | ||
| Labor | <3 people | 72 | 21.81 | |
| 3–5 people | 194 | 58.78 | ||
| >5 people | 64 | 19.39 | ||
| Gross household income | <10,000 yuan | 11 | 3.33 | |
| 10,000–50,000 yuan | 113 | 34.24 | ||
| 50,000–100,000 yuan | 100 | 30.30 | ||
| >100,000 yuan | 106 | 32.12 | ||
| Technology Adoption | Adoption Intention to IICS | Negative: 1–2 | 117 | 35.45 |
| Undefined: 3 | 95 | 28.79 | ||
| Positive: 4–5 | 118 | 35.76 | ||
| Adoption of early techniques | Venturi injector | 52 | 15.76 | |
| Differential pressure tank | 20 | 6.06 | ||
| Others | 8 | 2.42 |
| Variables | Tolerance | VIF |
|---|---|---|
| Labor | 0.95 | 1.06 |
| Income | 0.95 | 1.05 |
| Age | 0.88 | 1.14 |
| Education | 0.86 | 1.17 |
| Computer | 0.93 | 1.08 |
| Train | 0.98 | 1.02 |
| Contract | 0.98 | 1.02 |
| Relative | 0.97 | 1.03 |
| rho | Early Techniques | IICS |
| Train | 0.433 | 0.830 |
| Contract | 0.586 | 0.219 |
| Variables | Early Techniques | IICS | ||||
|---|---|---|---|---|---|---|
| Estimate | p-Value | Std. E | Estimate | p-Value | Std. E | |
| Labor | 1.463 | 0.102 | 0.895 | 12.736 *** | 0.000 | 0.929 |
| Income | 1.107 * | 0.059 | 0.586 | 11.681 *** | 0.000 | 1.098 |
| Age | −1.341 * | 0.078 | 0.761 | −1.792 ** | 0.027 | 0.797 |
| Education | 2.199 ** | 0.025 | 0.980 | 2.356 ** | 0.041 | 0.951 |
| Computer | 0.628 ** | 0.032 | 0.292 | 0.576 ** | 0.048 | 0.289 |
| Train | 0.935 *** | 0.004 | 0.328 | 0.739 ** | 0.041 | 0.354 |
| Contract | 0.897 *** | 0.003 | 0.297 | 0.594 ** | 0.037 | 0.315 |
| Relative | 0.727 ** | 0.026 | 0.326 | 0.731 ** | 0.043 | 0.341 |
| Sample | Ps R2 | LR chi2 | p > chi2 | Mean Bias | Med Bias |
|---|---|---|---|---|---|
| Unmatched | 0.128 | 46.75 | 0.000 | 30.6 | 32.8 |
| Matched | 0.016 | 3.50 | 0.899 | 9.0 | 8.2 |
| Variables | Matching Status | Mean | Std Dev | Change of Std Dev | Student’s t Test | ||
|---|---|---|---|---|---|---|---|
| Treated | Control | t-Value | p-Value | ||||
| Labor | Unmatched | 0.259 | 0.245 | 8.76% | 81.53% | 0.656 | 0.513 |
| Matched | 0.259 | 0.256 | 1.62% | 0.102 | 0.919 | ||
| Income | Unmatched | 0.473 | 0.419 | 22.06% | 41.58% | 1.687 | 0.094 |
| Matched | 0.473 | 0.503 | −12.89% | −0.815 | 0.416 | ||
| Age | Unmatched | 0.596 | 0.666 | −36.29% | 84.42% | −2.771 | 0.006 |
| Matched | 0.596 | 0.585 | 5.65% | 0.358 | 0.721 | ||
| Education | Unmatched | 0.412 | 0.329 | 52.79% | 90.43% | 4.274 | 0 |
| Matched | 0.412 | 0.405 | 5.05% | 0.319 | 0.75 | ||
| Computer | Unmatched | 0.525 | 0.496 | 5.78% | 100.00% | 0.45 | 0.654 |
| Matched | 0.525 | 0.525 | 0.00% | 0 | 1 | ||
| Training | Unmatched | 0.2 | 0.184 | 4.05% | −123.03% | 0.312 | 0.755 |
| Matched | 0.2 | 0.238 | −9.02% | −0.571 | 0.569 | ||
| Contract | Unmatched | 0.263 | 0.196 | 15.80% | 6.52% | 1.198 | 0.233 |
| Matched | 0.263 | 0.2 | 14.77% | 0.934 | 0.352 | ||
| Realtives | Unmatched | 0.262 | 0.288 | −5.69% | 49.97% | −0.446 | 0.657 |
| Matched | 0.262 | 0.25 | 2.85% | 0.18 | 0.857 | ||
| Sample | Treated | Control | ATT | t-Value |
|---|---|---|---|---|
| Unmatched | 2.025 | 1.728 | 0.297 | 3.07 |
| Matched | 2.025 | 2.0375 | −0.0125 | −0.09 |
| Variables | Heterogeneity Variables Investigated for Early Techniques | |||||||
|---|---|---|---|---|---|---|---|---|
| Labor | Income | Age | Education | Computer | Train | Contract | Relative | |
| Labor | 1.49 | 0.999 | 0.293 | 1.8 | 1.763 ** | 1.109 * | 1.535 ** | 1.165 ** |
| Income | 1.98 ** | 1.591 ** | 0.357 | 2.045 | 1.822 * | 1.465 | 1.382 | 1.269 |
| Age | −1.34 | −1.193 | 0.183 | −2.328 | −2.42 * | −1.346 * | −1.165 | −1.264 * |
| Education | 2.01 ** | 2.072 ** | 0.662 * | 1.311 | 2.577 * | 2.2 ** | 3.622 ** | 1.689 * |
| Computer | 1.76 * | 0.58 * | 0.189 * | 0.918 * | 0.044 | 0.629 ** | 0.725 ** | 0.453 |
| Train | 2 ** | 0.855 ** | 0.312 ** | 1.325 ** | 1.187 *** | 0.93 ** | 1.022 *** | 0.867 *** |
| Contract | 2.26 ** | 0.833 ** | 0.236 * | 1.537 * | 1.219 *** | 0.898 *** | 0.252 | 0.816 *** |
| Relative | 1.84 * | 0.673 * | 0.205 * | 1.117 * | 1.012 ** | 0.727 ** | 0.719 * | 0.933 *** |
| Lnsigma | 0.868 | −0.326 | −2.243 | 1.105 | 0.579 | 0.008 | 0.785 | −0.511 |
| p-value | 0.224 | 0.798 | 0.042 | 0.309 | 0.145 | 0.985 | 0.189 | 0.191 |
| Log likelihood | −159.09 | −159.83 | −157.44 | −159.23 | −158.76 | −159.85 | −158.63 | −159.08 |
| Variables | Heterogeneity Variables Investigated for IICS | |||||||
|---|---|---|---|---|---|---|---|---|
| Labor | Income | Age | Education | Computer | Train | Contract | Relative | |
| Labor | 12.913 *** | 11.69 *** | 11.669 *** | 7.58 *** | 13.994 *** | 11.062 *** | 12.981 *** | 11.07 *** |
| Income | 13.916 *** | 12.68 *** | 12.657 *** | 8.145 *** | 14.823 *** | 12.06 *** | 13.958 *** | 11.922 *** |
| Age | −1.982 ** | −1.765 ** | −1.761 * | −1.05 ** | −2.157 ** | −1.73 ** | −1.855 ** | −1.643 ** |
| Education | 2.478 ** | 2.332 ** | 2.327 ** | 1.896 *** | 2.886 ** | 2.046 ** | 2.808 ** | 2.243 ** |
| Computer | 0.654 * | 0.571 * | 0.57 * | 0.329 * | 0.564 * | 0.479 * | 0.616 * | 0.591 ** |
| Train | 0.798 ** | 0.722 ** | 0.721 * | 0.406 * | 0.954 ** | 0.762 *** | 0.792 ** | 0.66 ** |
| Contract | 0.743 ** | 0.656 ** | 0.655 * | 0.355 * | 0.764 ** | 0.624 ** | 0.631 * | 0.625 ** |
| Relative | 0.743 * | 0.689 * | 0.687 * | 0.461 ** | 0.727 * | 0.634 ** | 0.748 ** | 0.727 ** |
| Lnsigma | 0.367 | 0.681 | 0.435 | 0.474 | 0.172 | 0.235 | 0.180 | 0.211 |
| p-value | 0.534 | 0.997 | 0.993 | 0.007 | 0.090 | 0.127 | 0.082 | 0.148 |
| Log likelihood | −175.00 | −175.20 | −175.20 | −171.38 | −173.77 | −174.04 | −173.64 | −174.16 |
| Variables | Early Techniques | IICS | ||||
|---|---|---|---|---|---|---|
| Estimate | p-Value | Std. E | Estimate | p-Value | Std. E | |
| Labor | 1.494 * | 0.096 | 0.897 | 12.876 *** | 0.000 | 1.483 |
| Income | 1.122 * | 0.059 | 0.587 | 11.769 *** | 0.000 | 1.056 |
| Age | −1.335 * | 0.080 | 0.762 | −1.817 ** | 0.023 | 0.798 |
| Education | 2.129 ** | 0.030 | 0.983 | 2.251 ** | 0.018 | 0.952 |
| Computer | 0.637 ** | 0.029 | 0.293 | 0.590 ** | 0.042 | 0.290 |
| Train | 0.930 *** | 0.005 | 0.328 | 0.719 ** | 0.041 | 0.352 |
| Contract | 0.904 *** | 0.002 | 0.298 | 0.676 ** | 0.033 | 0.316 |
| Relative | 0.745 ** | 0.023 | 0.327 | 0.706 ** | 0.038 | 0.340 |
| Location 1 | −0.215 | 0.487 | 0.310 | 0.283 ** | 0.346 | 0.301 |
| Variables | Early Techniques | IICS | ||||
|---|---|---|---|---|---|---|
| Estimate | p-Value | Std. E | Estimate | p-Value | Std. E | |
| Labor | 1.562 * | 0.085 | 0.907 | 12.652 *** | 0.000 | 1.462 |
| Income | 1.221 * | 0.056 | 0.639 | 11.645 *** | 0.000 | 1.072 |
| Age | −1.092 | 0.204 | 0.861 | −1.764 ** | 0.042 | 0.869 |
| Education | 2.427 ** | 0.017 | 1.017 | 2.230 ** | 0.020 | 0.959 |
| Computer | 0.699 ** | 0.022 | 0.304 | −0.678 ** | 0.021 | 0.294 |
| Train | 0.854 ** | 0.012 | 0.339 | −0.691 * | 0.057 | 0.362 |
| Contract | 1.007 *** | 0.001 | 0.309 | −0.607 * | 0.058 | 0.320 |
| Relative | 0.719 ** | 0.036 | 0.343 | −0.694 ** | 0.044 | 0.345 |
Publisher’s Note: MDPI stays neutral with regard to jurisdictional claims in published maps and institutional affiliations. |
© 2021 by the authors. Licensee MDPI, Basel, Switzerland. This article is an open access article distributed under the terms and conditions of the Creative Commons Attribution (CC BY) license (https://creativecommons.org/licenses/by/4.0/).
Share and Cite
Yuan, J.; Li, X.; Sun, Z.; Ruan, J. Will the Adoption of Early Fertigation Techniques Hinder Famers’ Technology Renewal? Evidence from Fresh Growers in Shaanxi, China. Agriculture 2021, 11, 913. https://doi.org/10.3390/agriculture11100913
Yuan J, Li X, Sun Z, Ruan J. Will the Adoption of Early Fertigation Techniques Hinder Famers’ Technology Renewal? Evidence from Fresh Growers in Shaanxi, China. Agriculture. 2021; 11(10):913. https://doi.org/10.3390/agriculture11100913
Chicago/Turabian StyleYuan, Jiahong, Xiaoyu Li, Zilai Sun, and Junhu Ruan. 2021. "Will the Adoption of Early Fertigation Techniques Hinder Famers’ Technology Renewal? Evidence from Fresh Growers in Shaanxi, China" Agriculture 11, no. 10: 913. https://doi.org/10.3390/agriculture11100913