
Participatory Mapping of Demand for Ecosystem Services in Agricultural Landscapes

 , and
, and
Abstract
:1. Introduction
1.1. Mapping & PGIS Approaches
1.2. Demand and Supply Assessments and Trade-Offs
1.3. Assessment of Regulatory Services
2. Materials and Methods
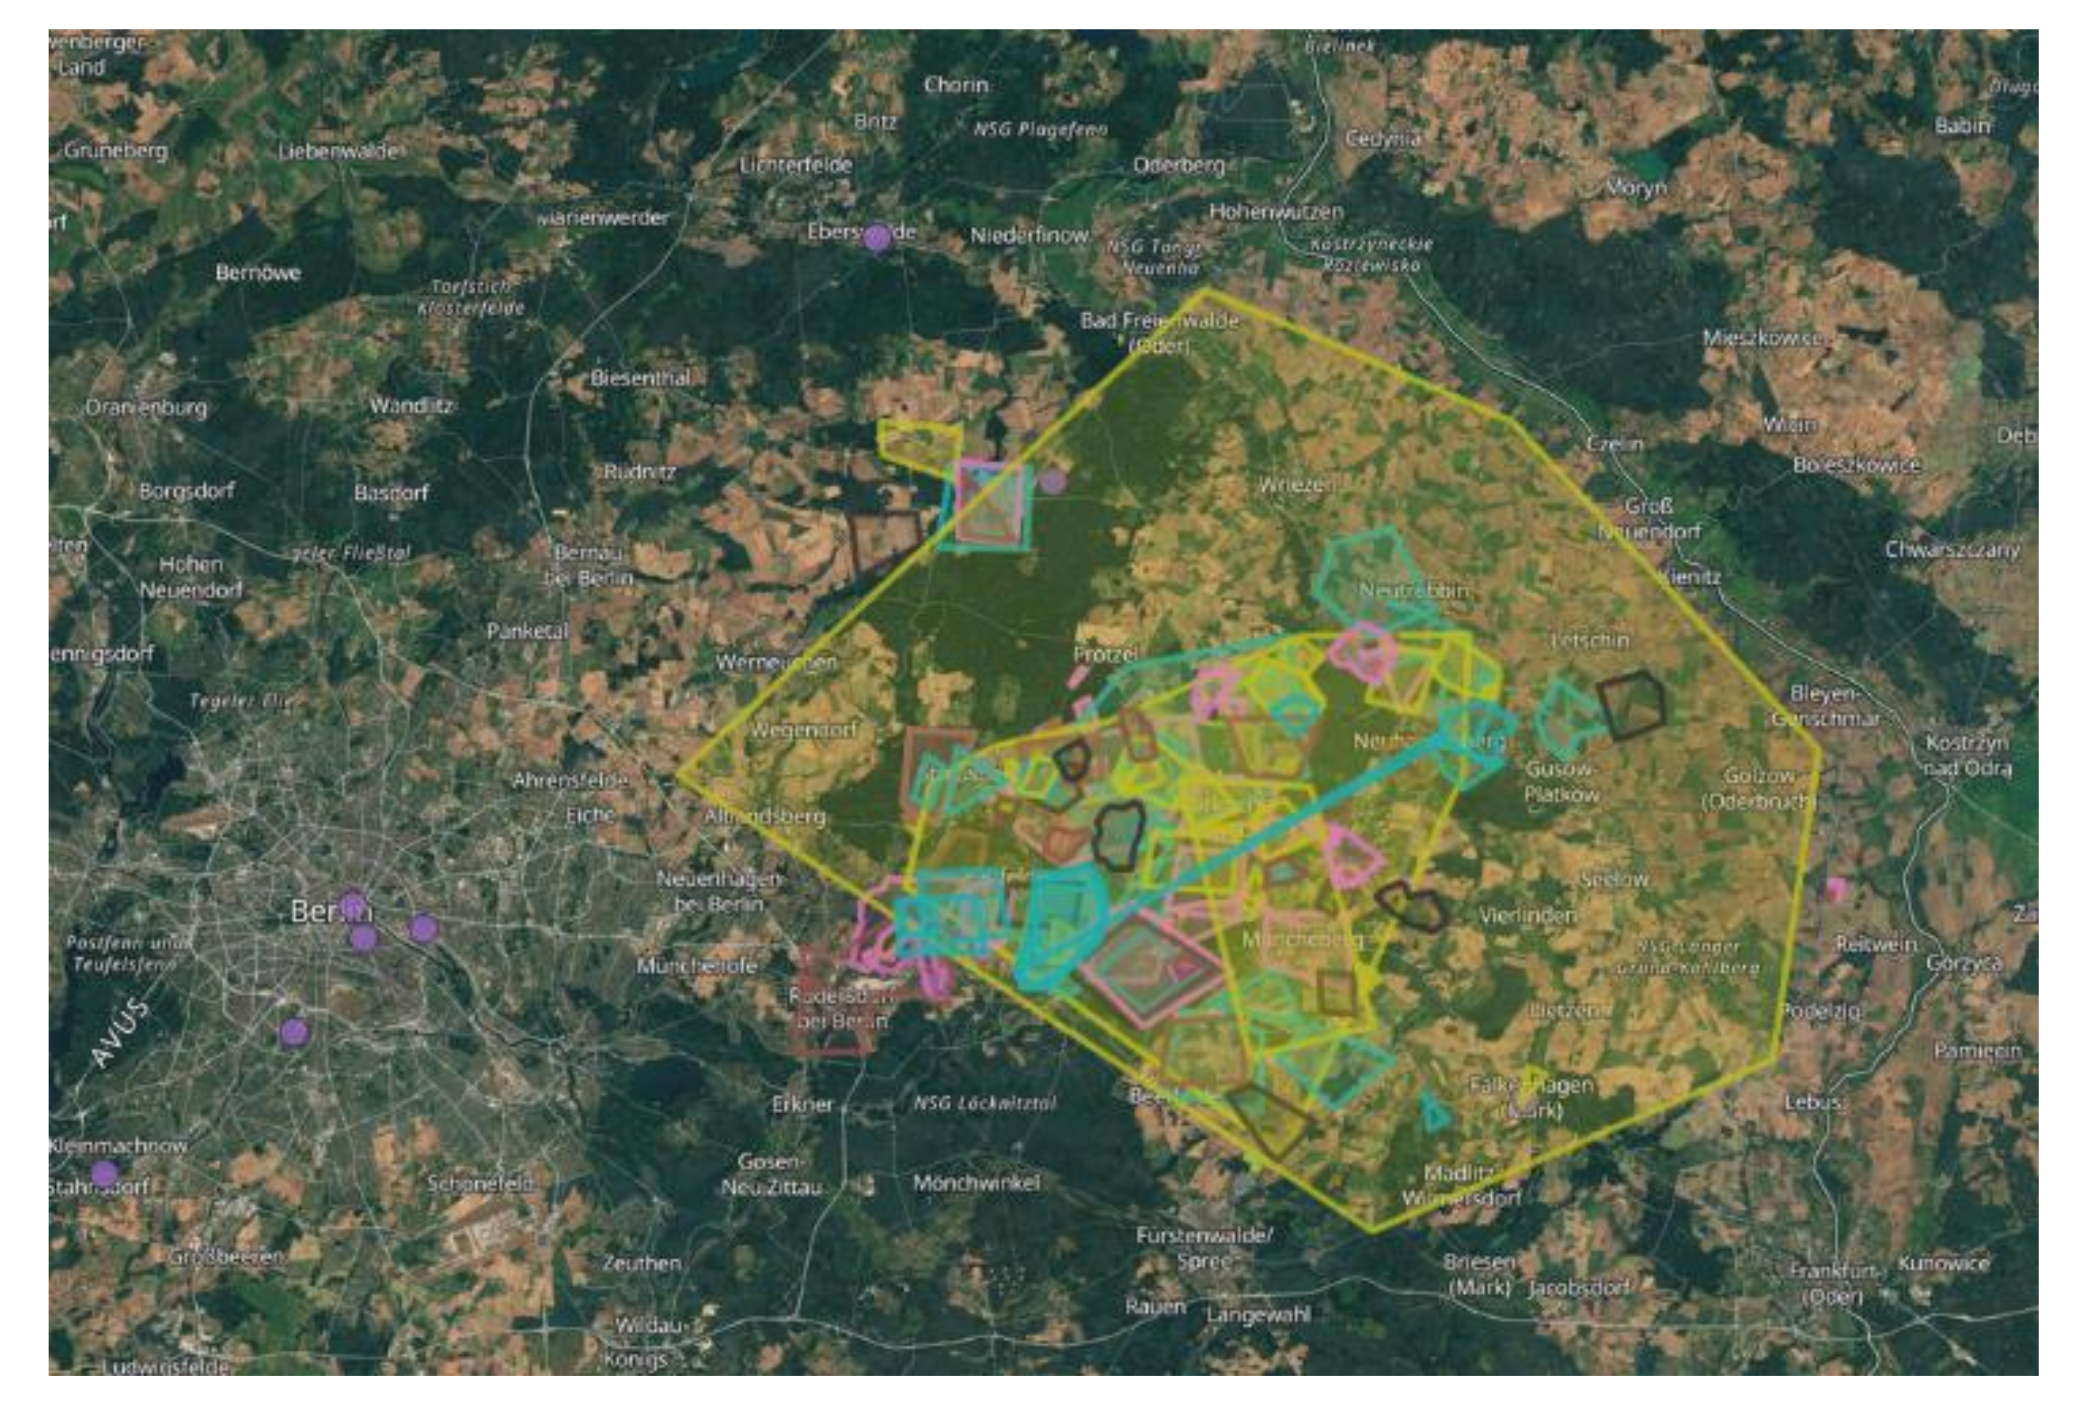
2.1. Study Regions
2.2. Questionnaire Design
2.3. Survey Dissemination and Scope of Sampling
2.4. Data Analysis
2.4.1. Statistical Analysis
| Example of the code: |
| intraclasscc <- ICC::ICCest(Stakeholder_category,Water_Perceived_supply_average, data = NULL, alpha = 0.05,CI.type = c(“THD”)) write.table(intraclasscc, ‘cor.txt’) |
2.4.2. Spatial Analysis
2.5. Stakeholder Workshop
3. Results
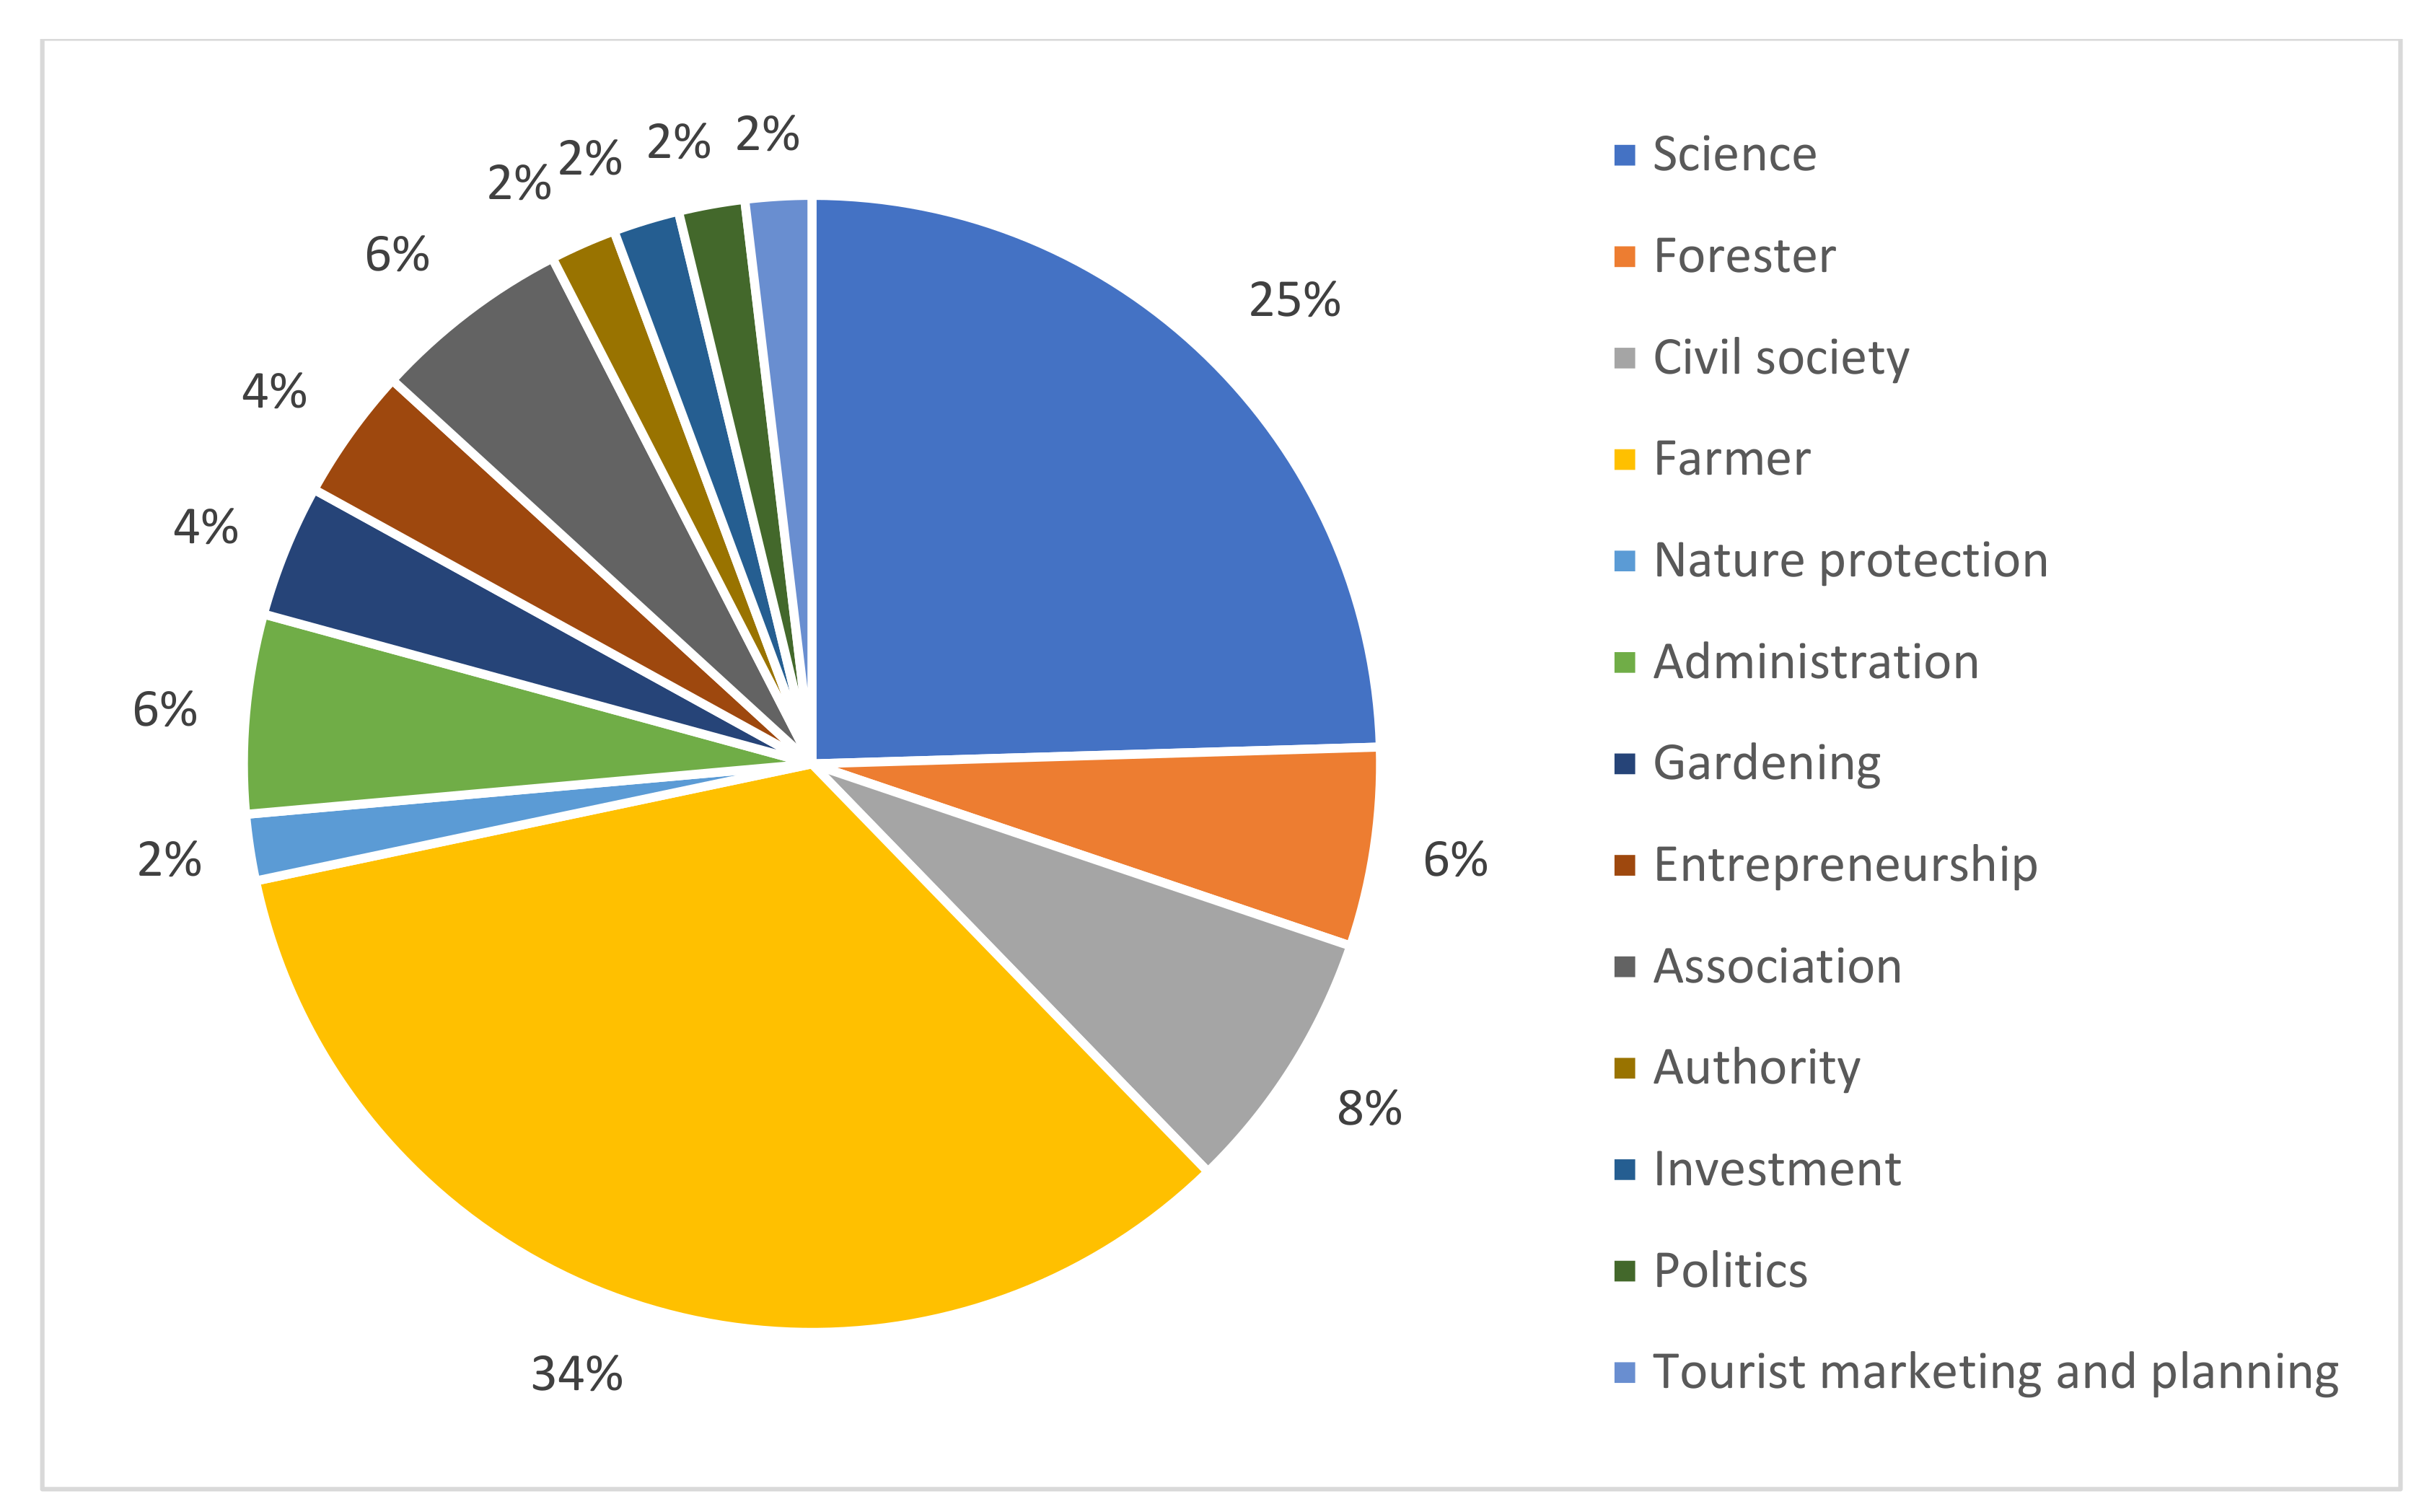
3.1. Respondents and Background
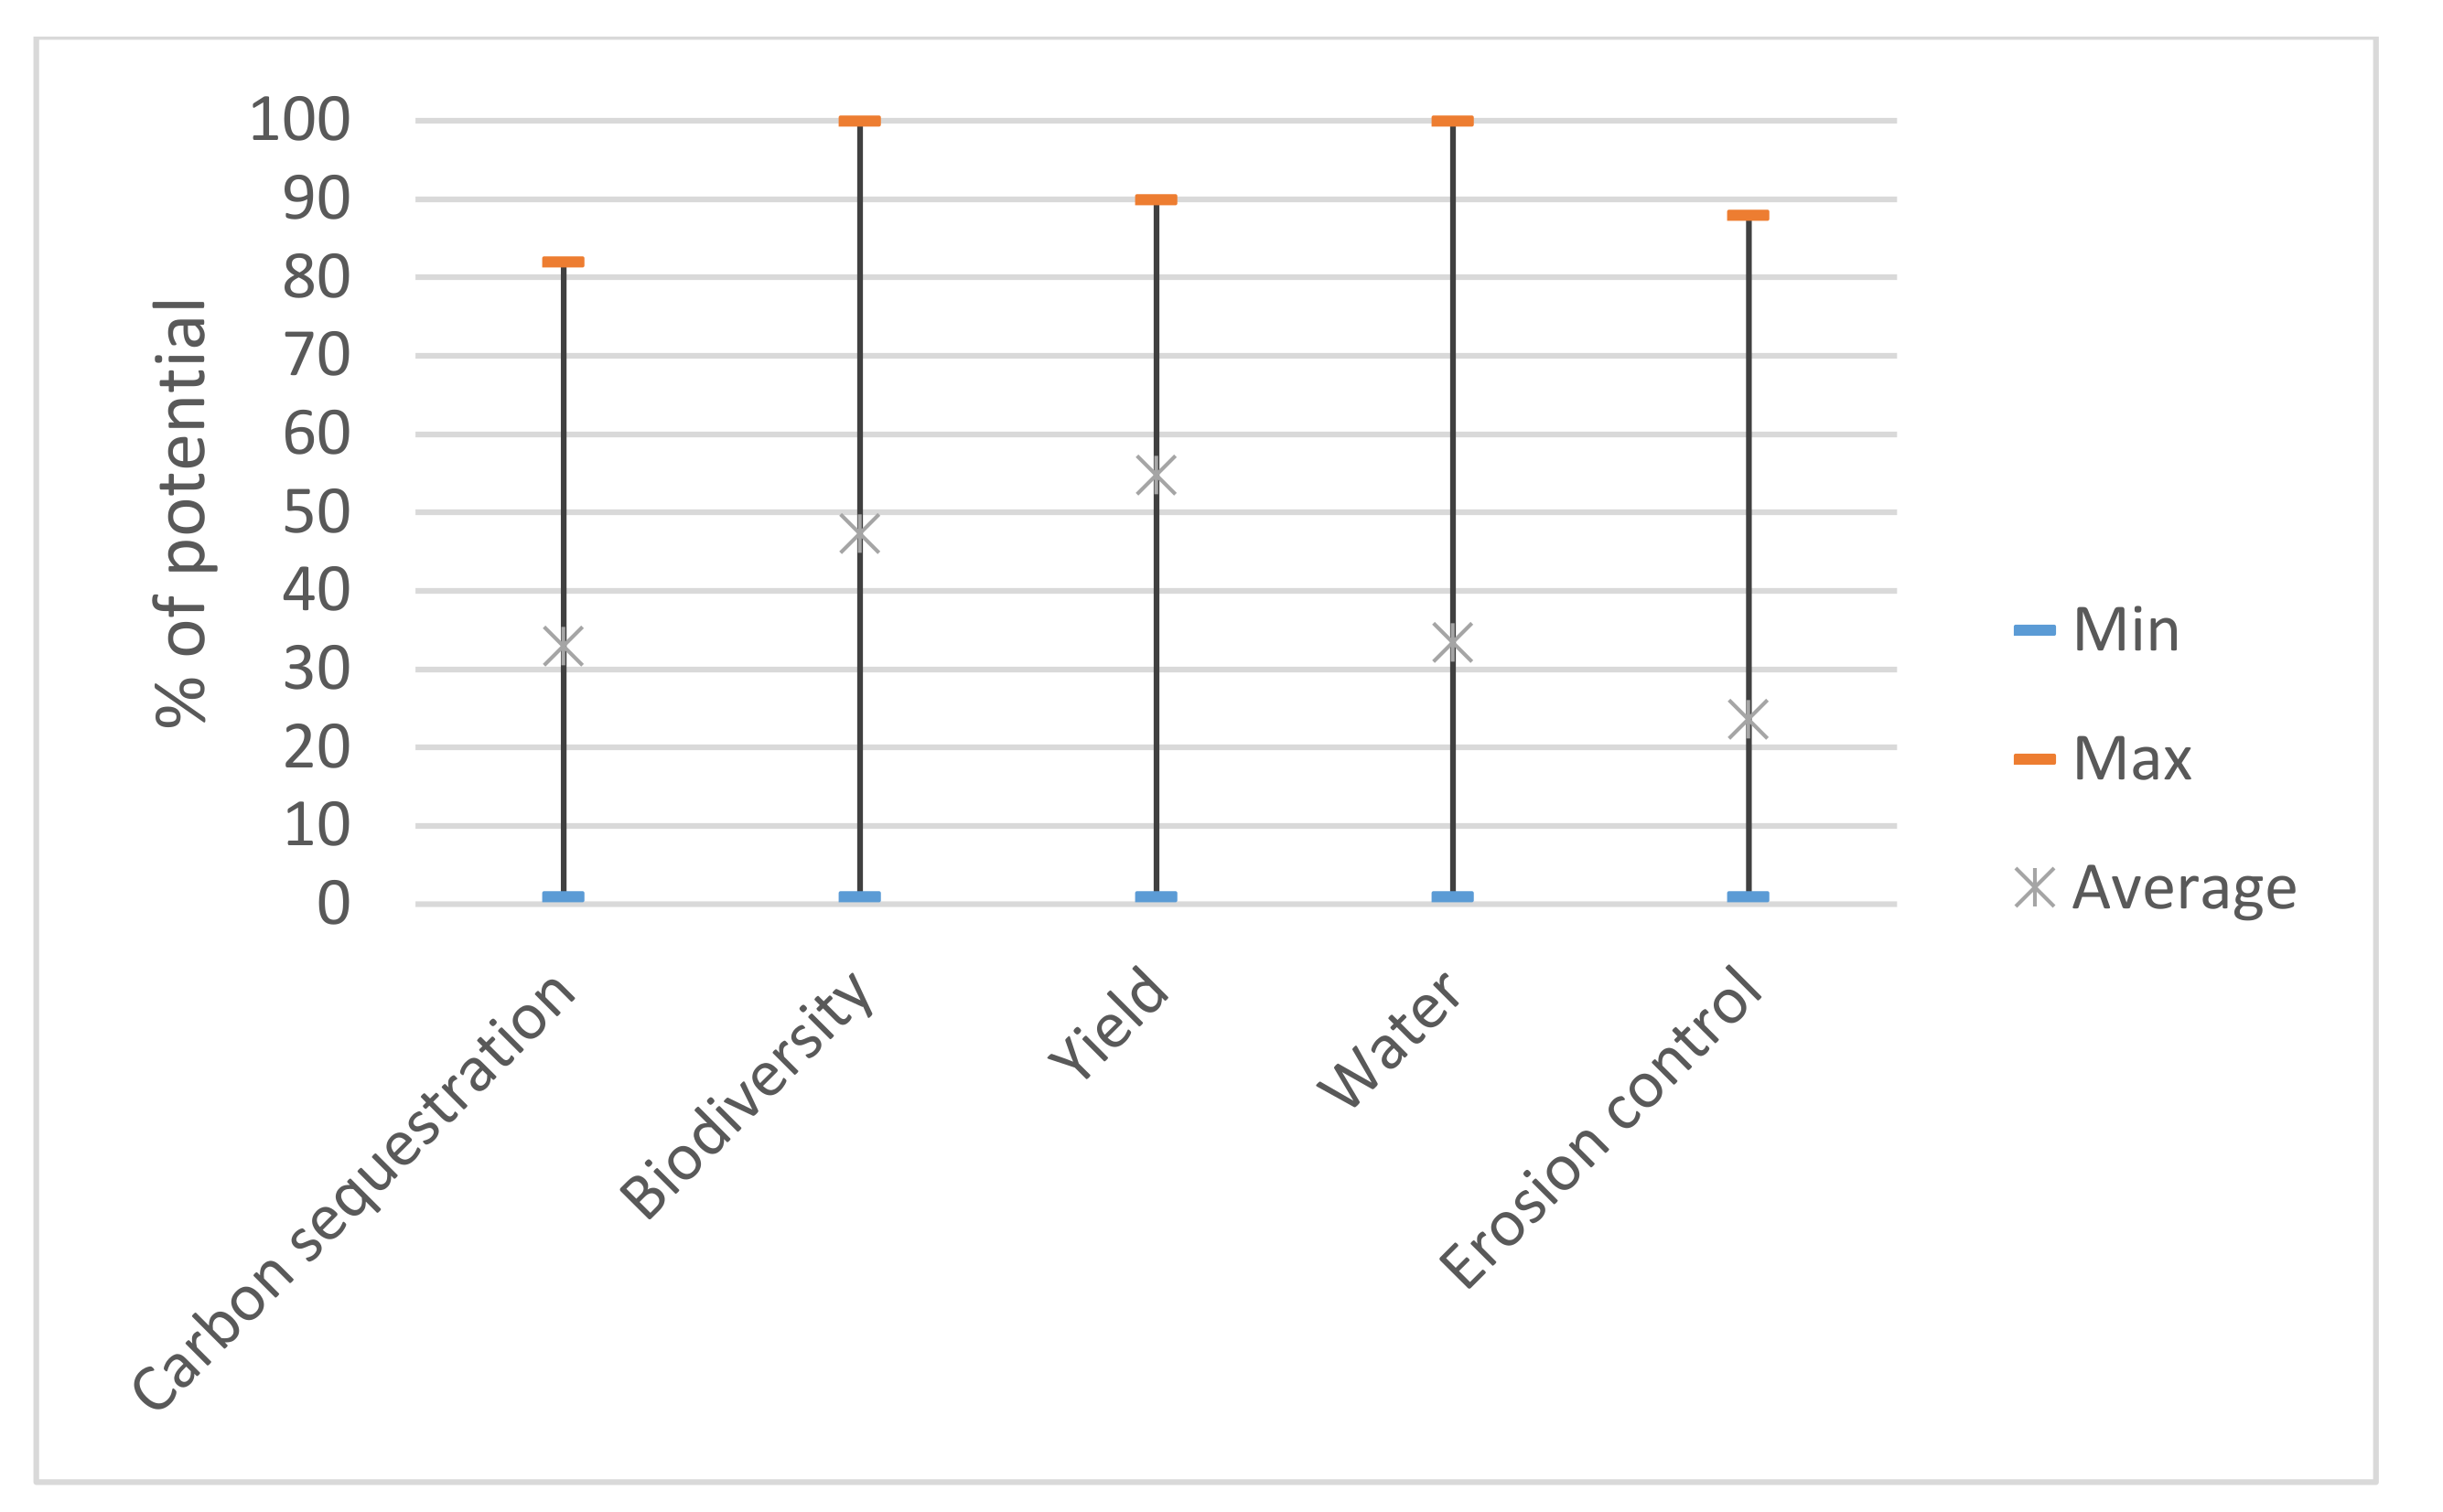
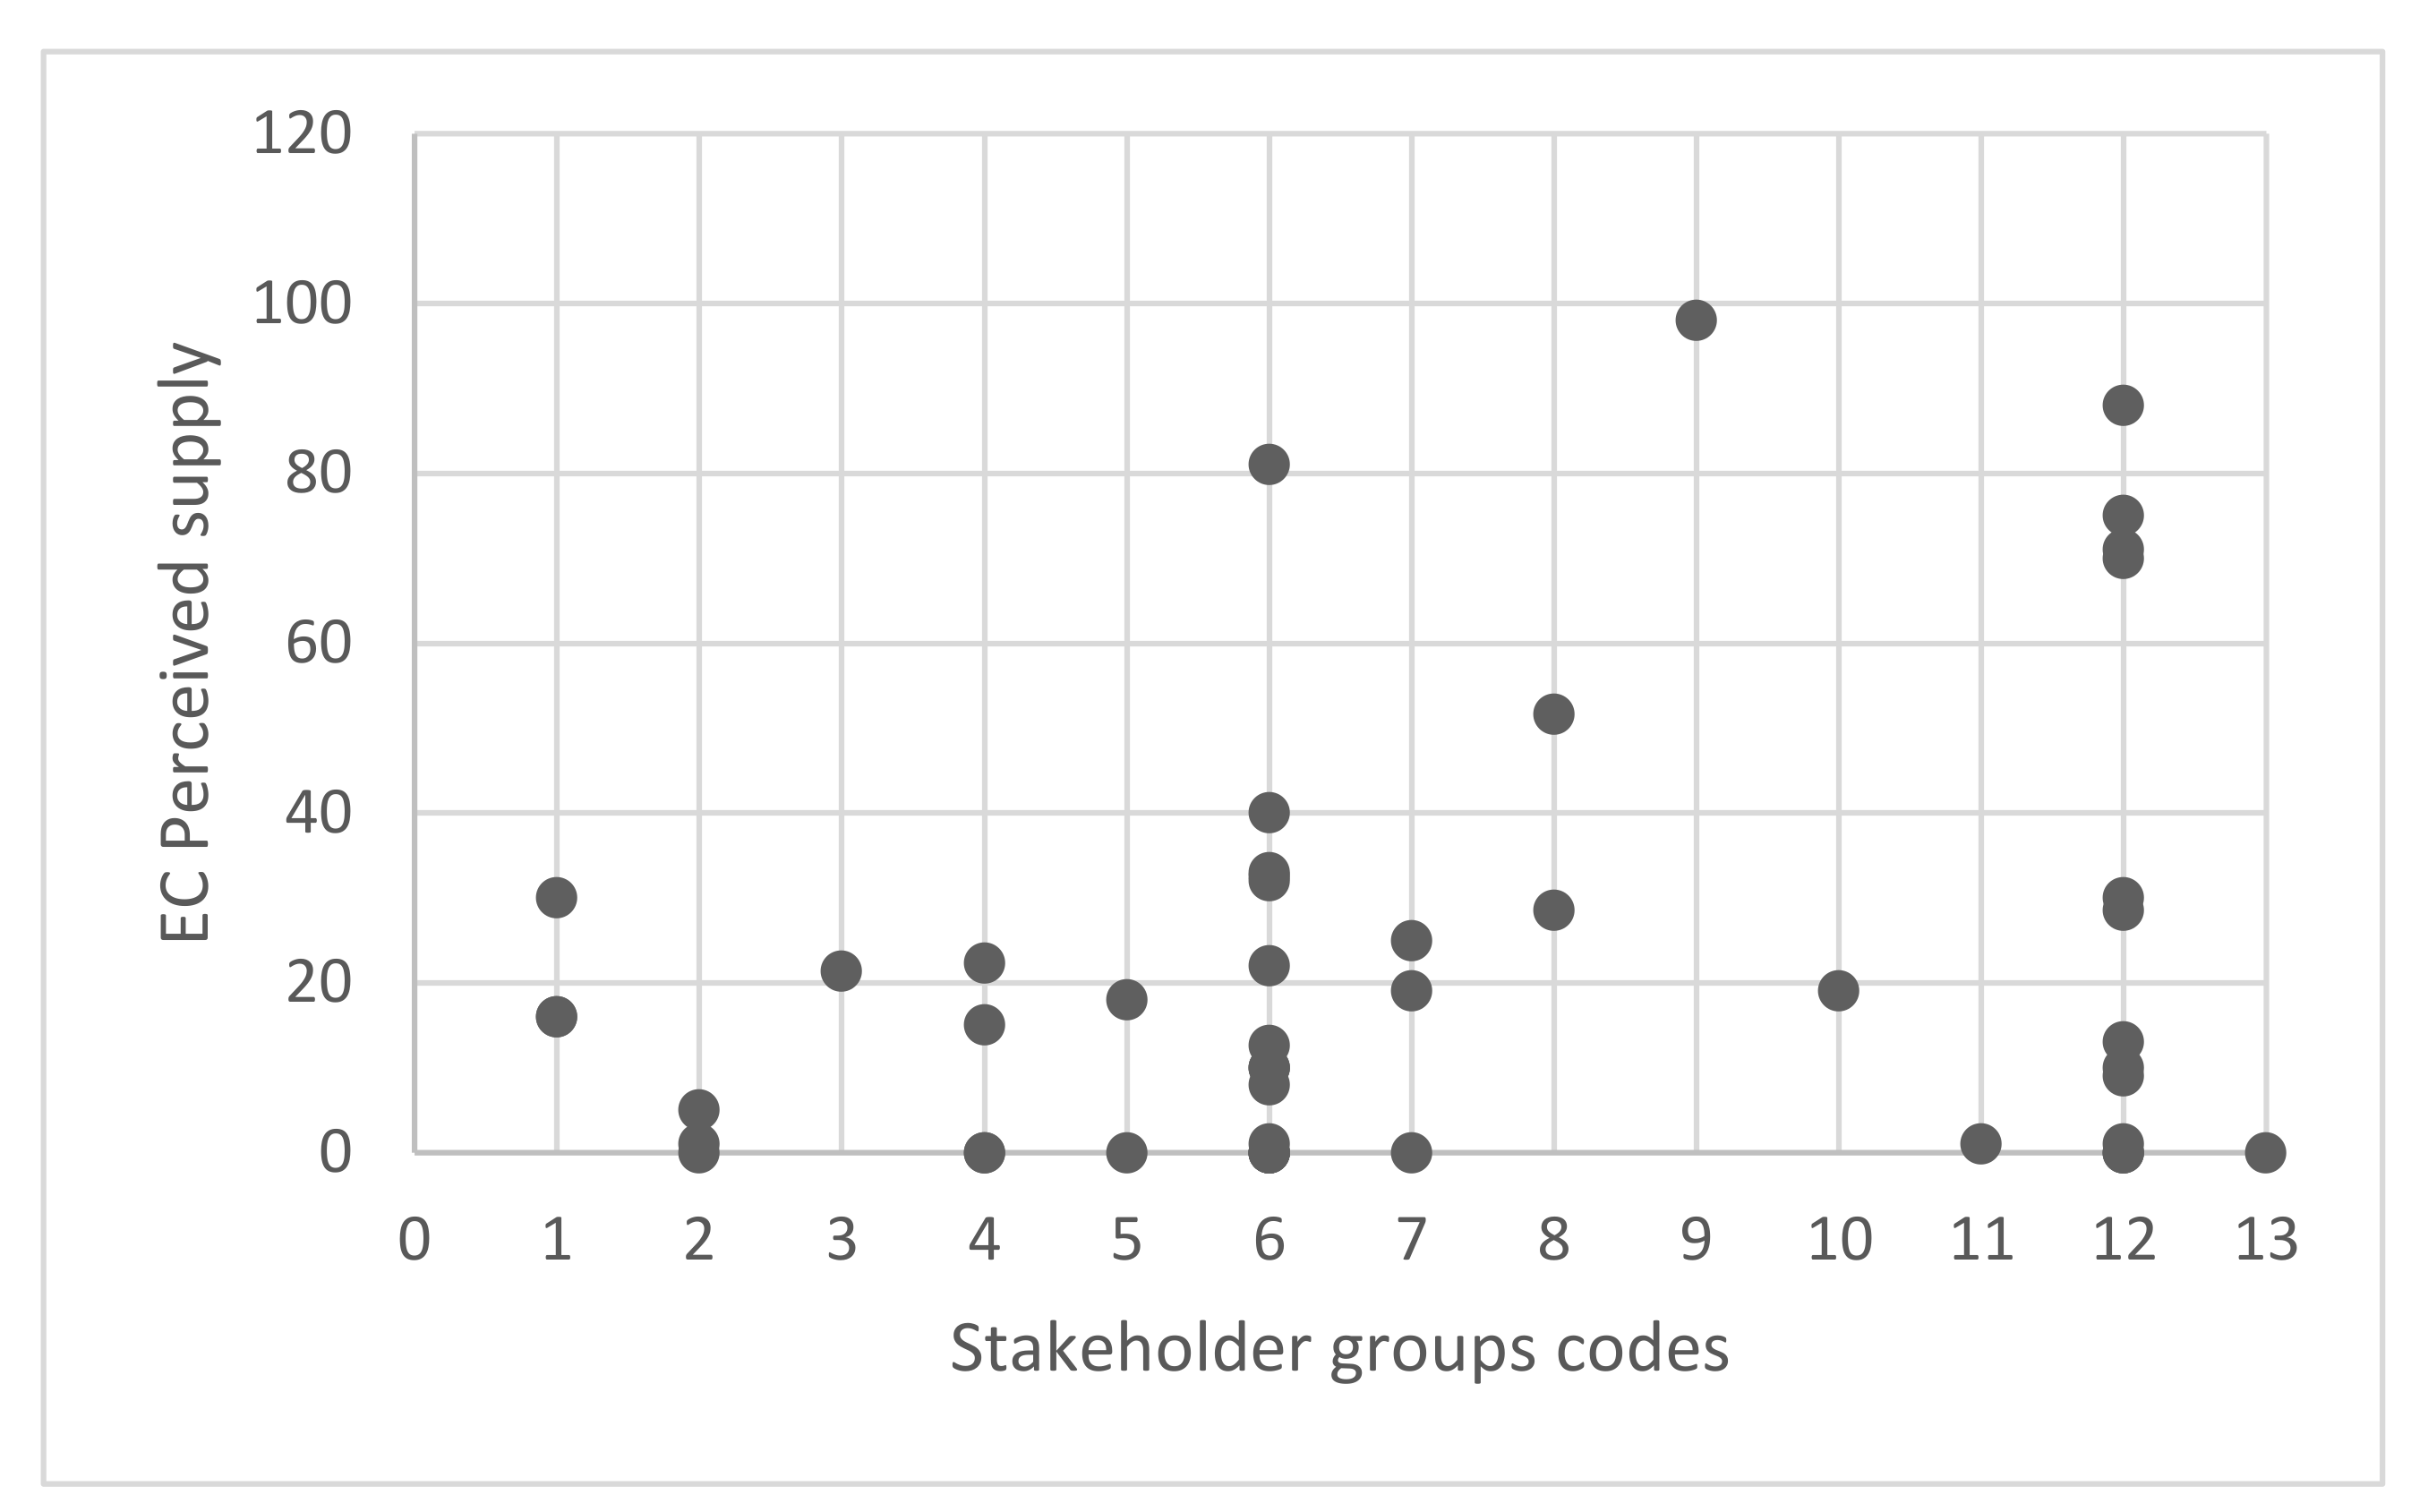
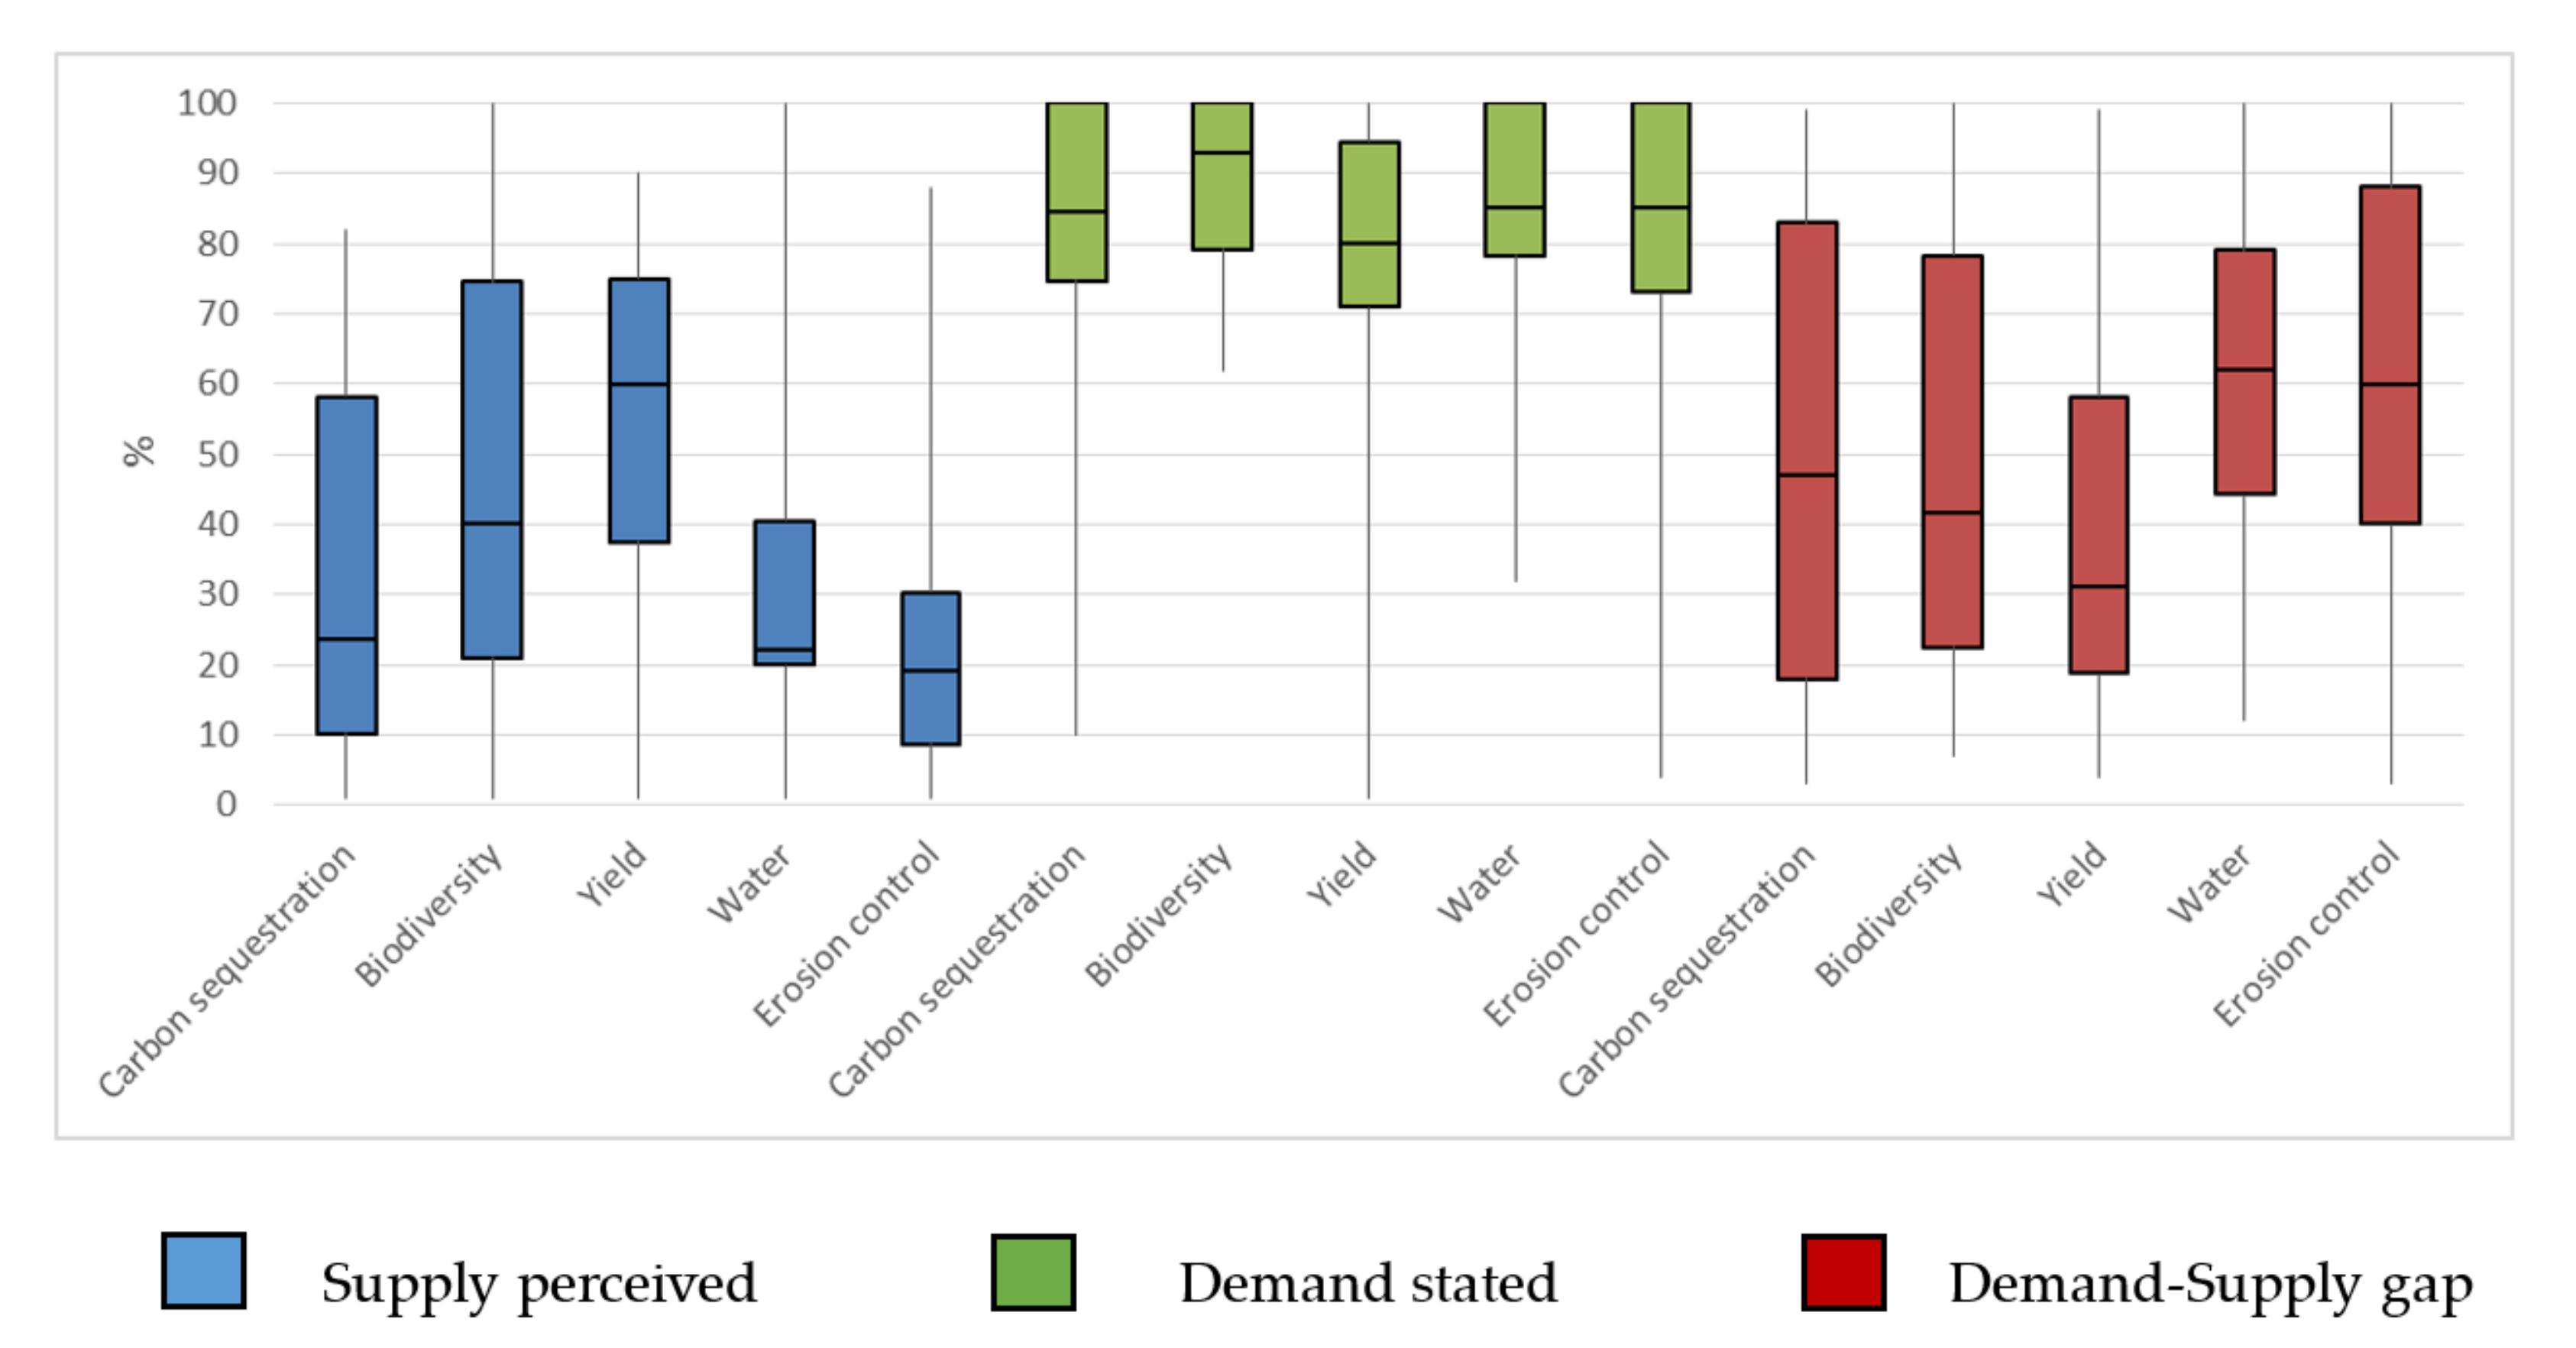
3.2. Statistical Analysis
3.3. Spatial Analysis
3.3.1. Demand Area Index
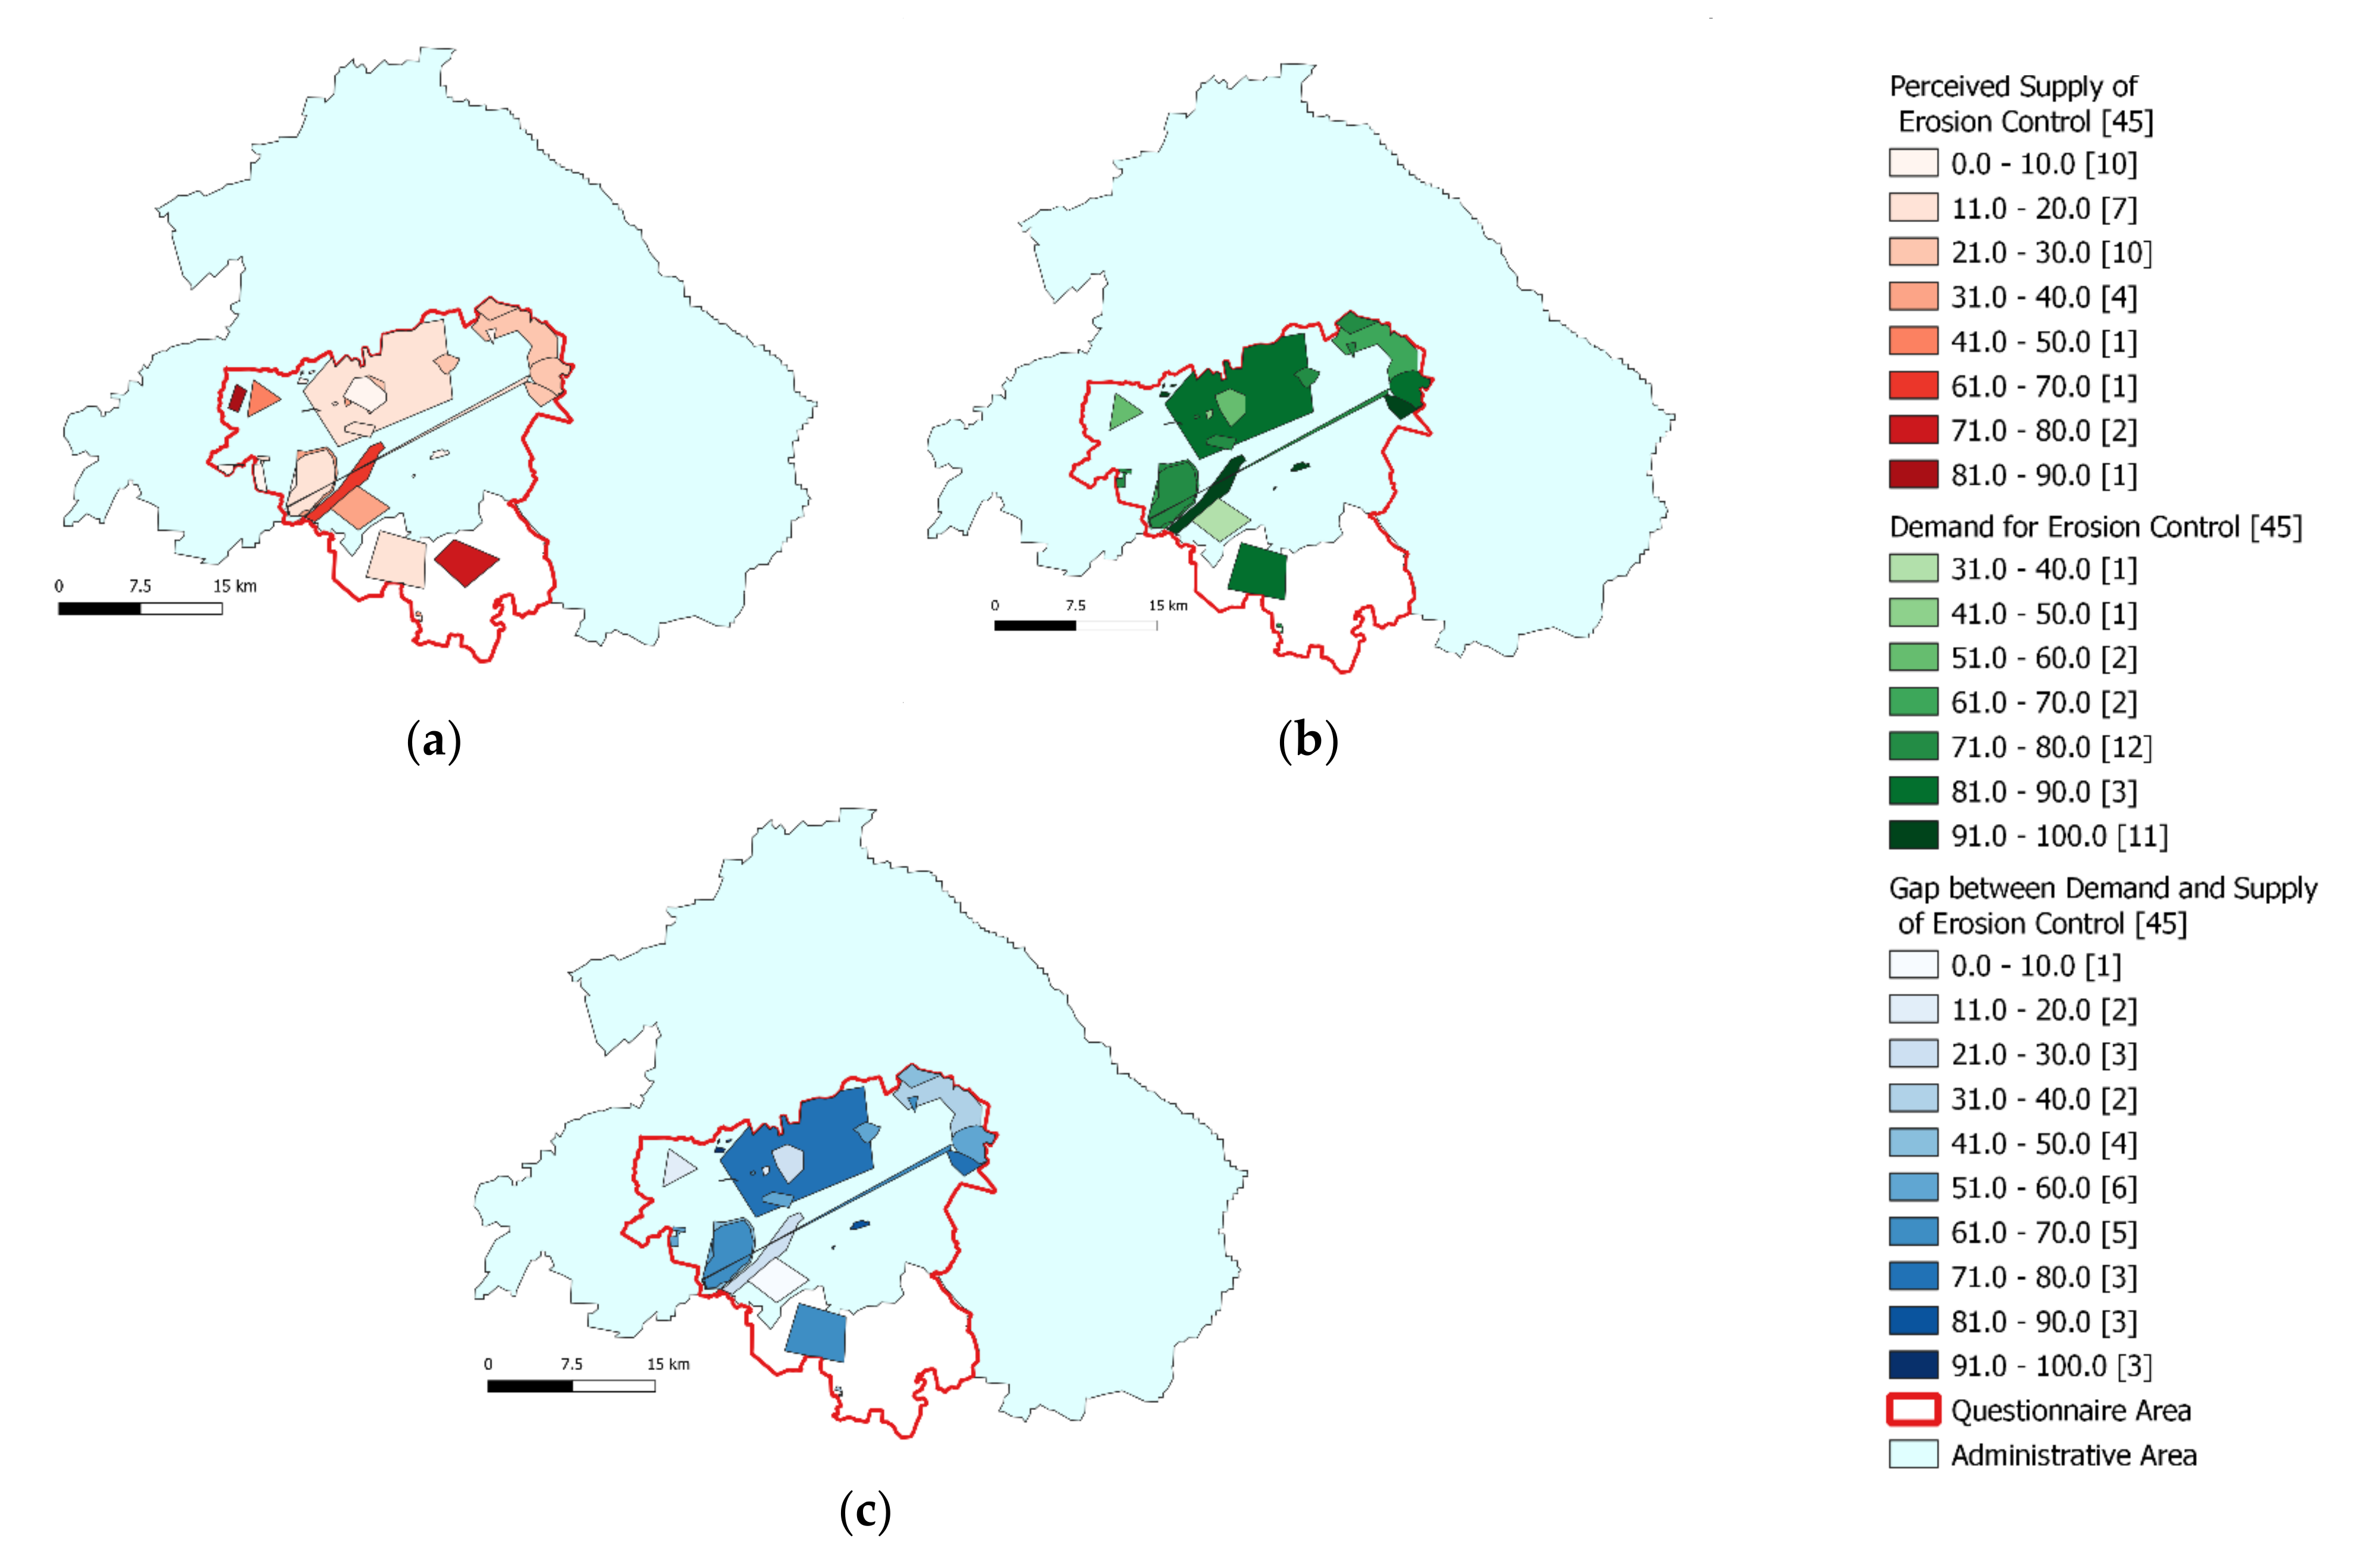
Example Erosion Control in MOL
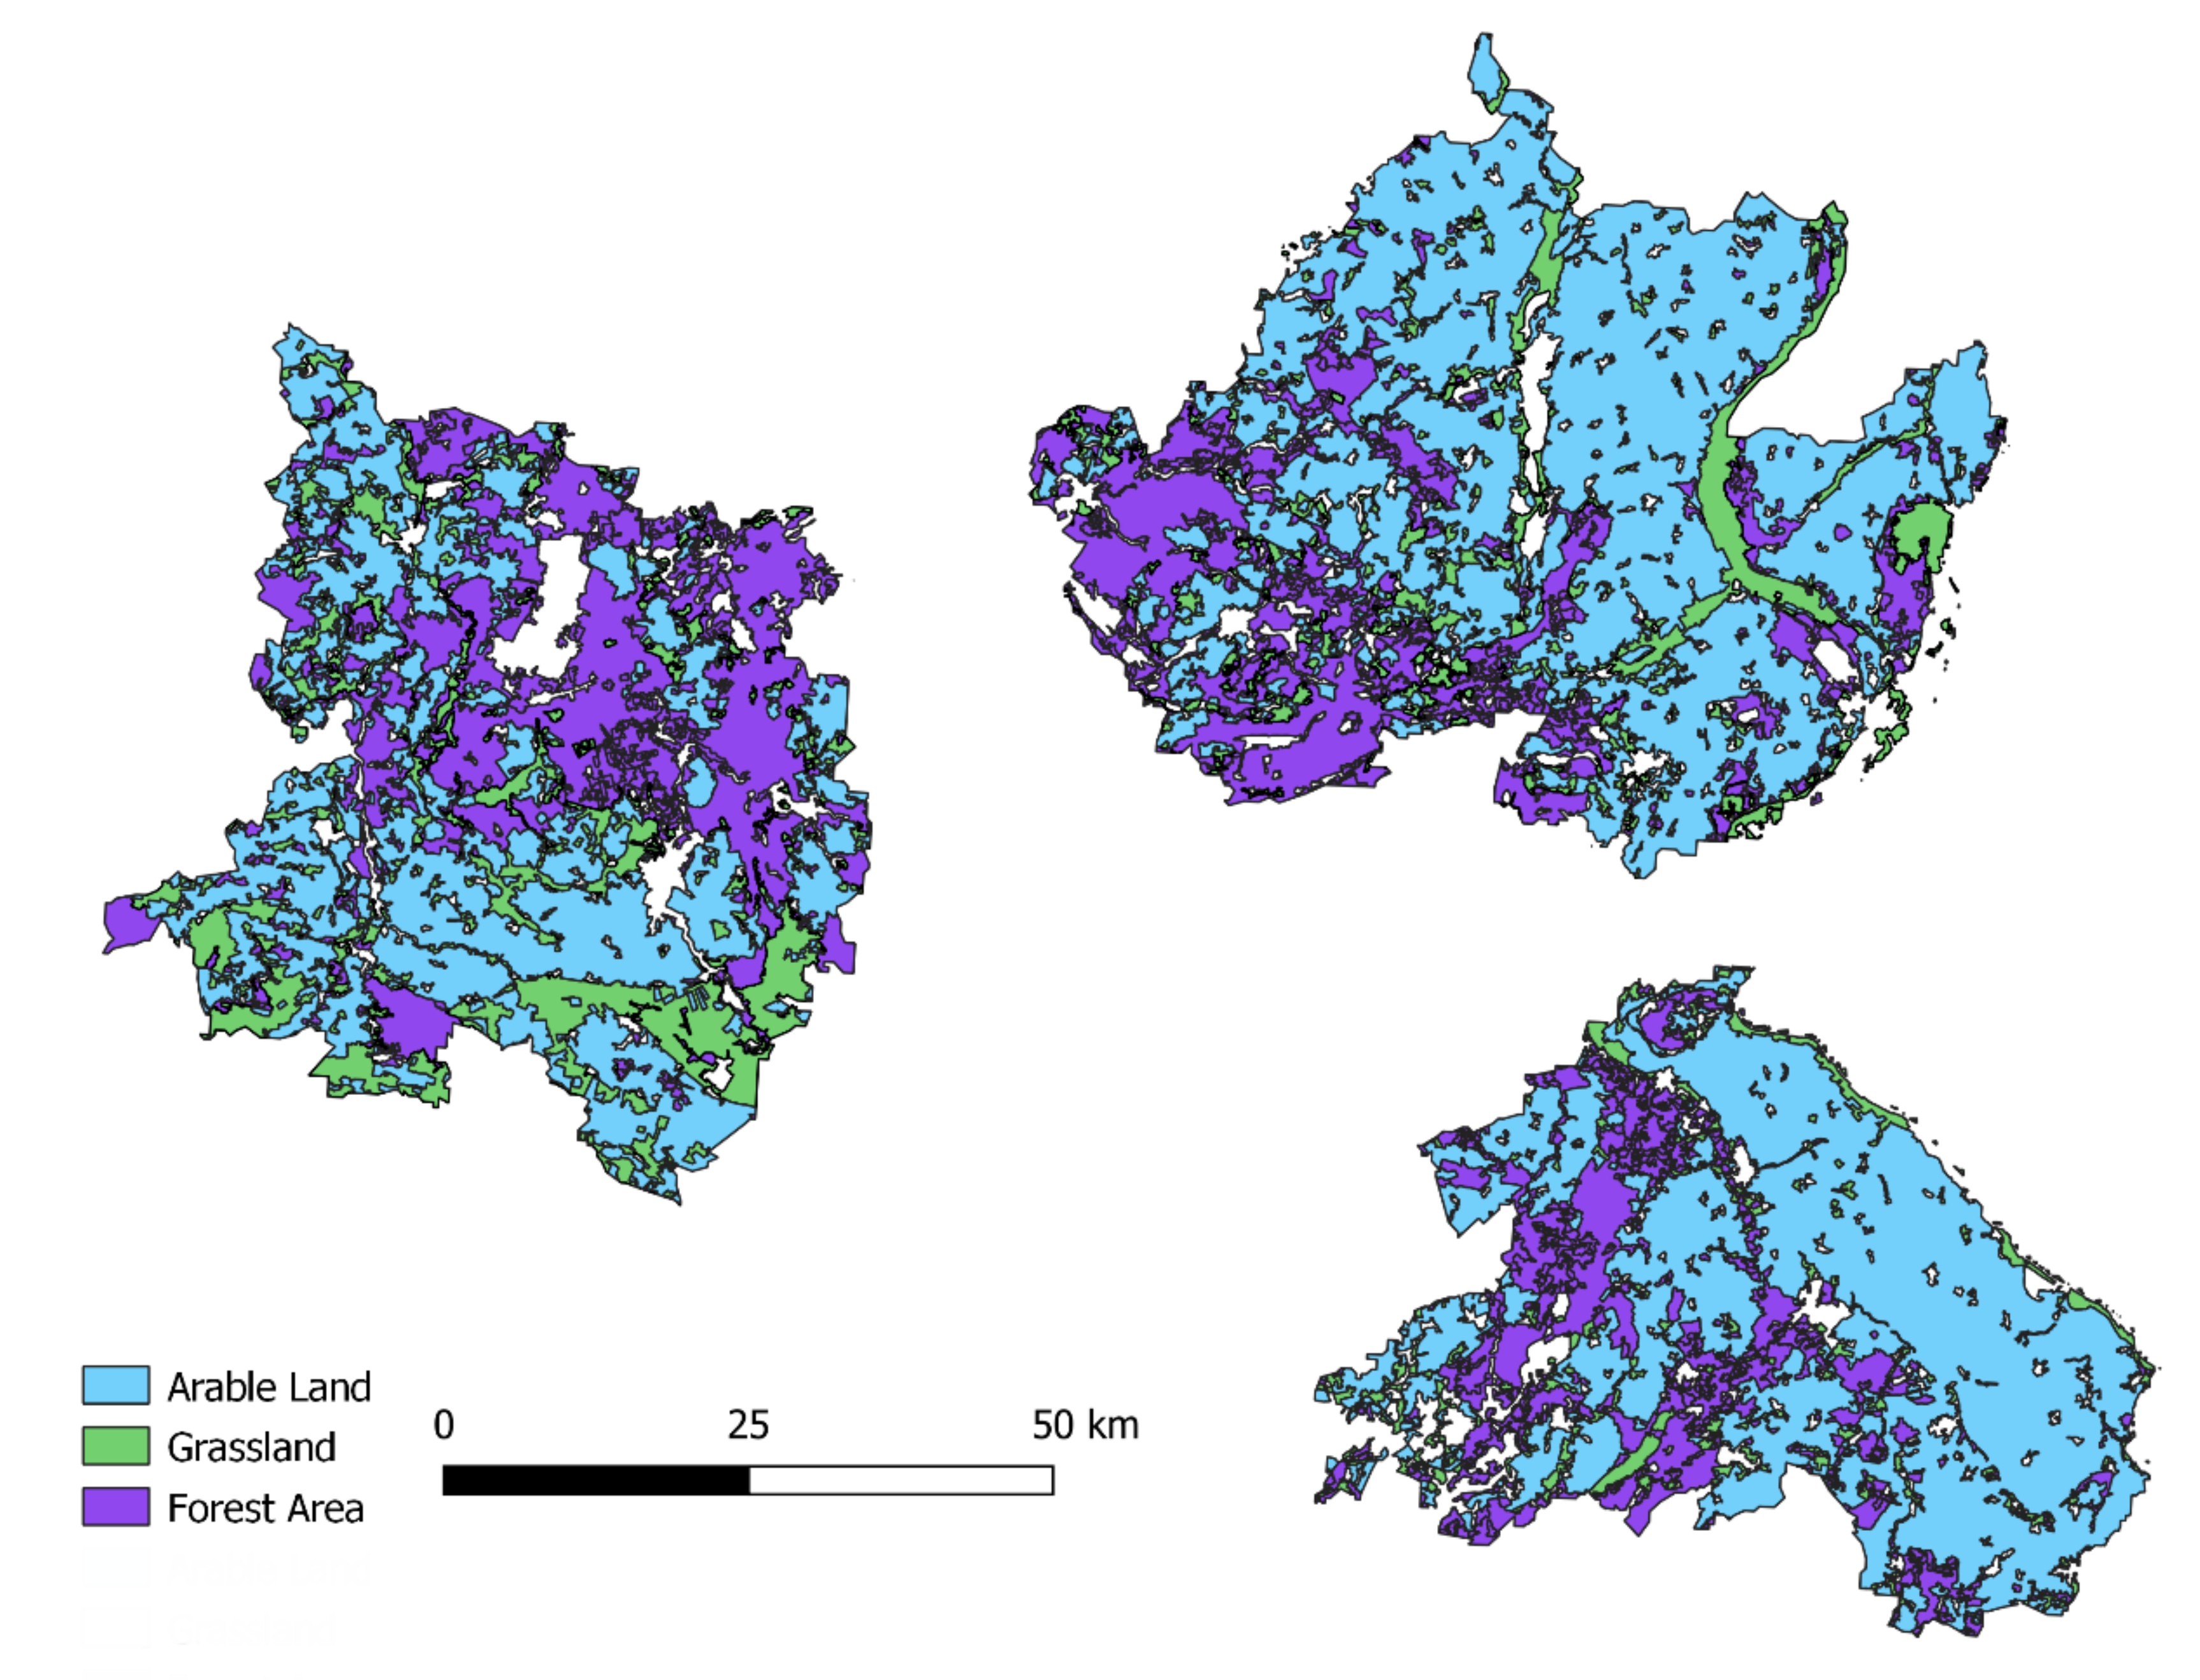
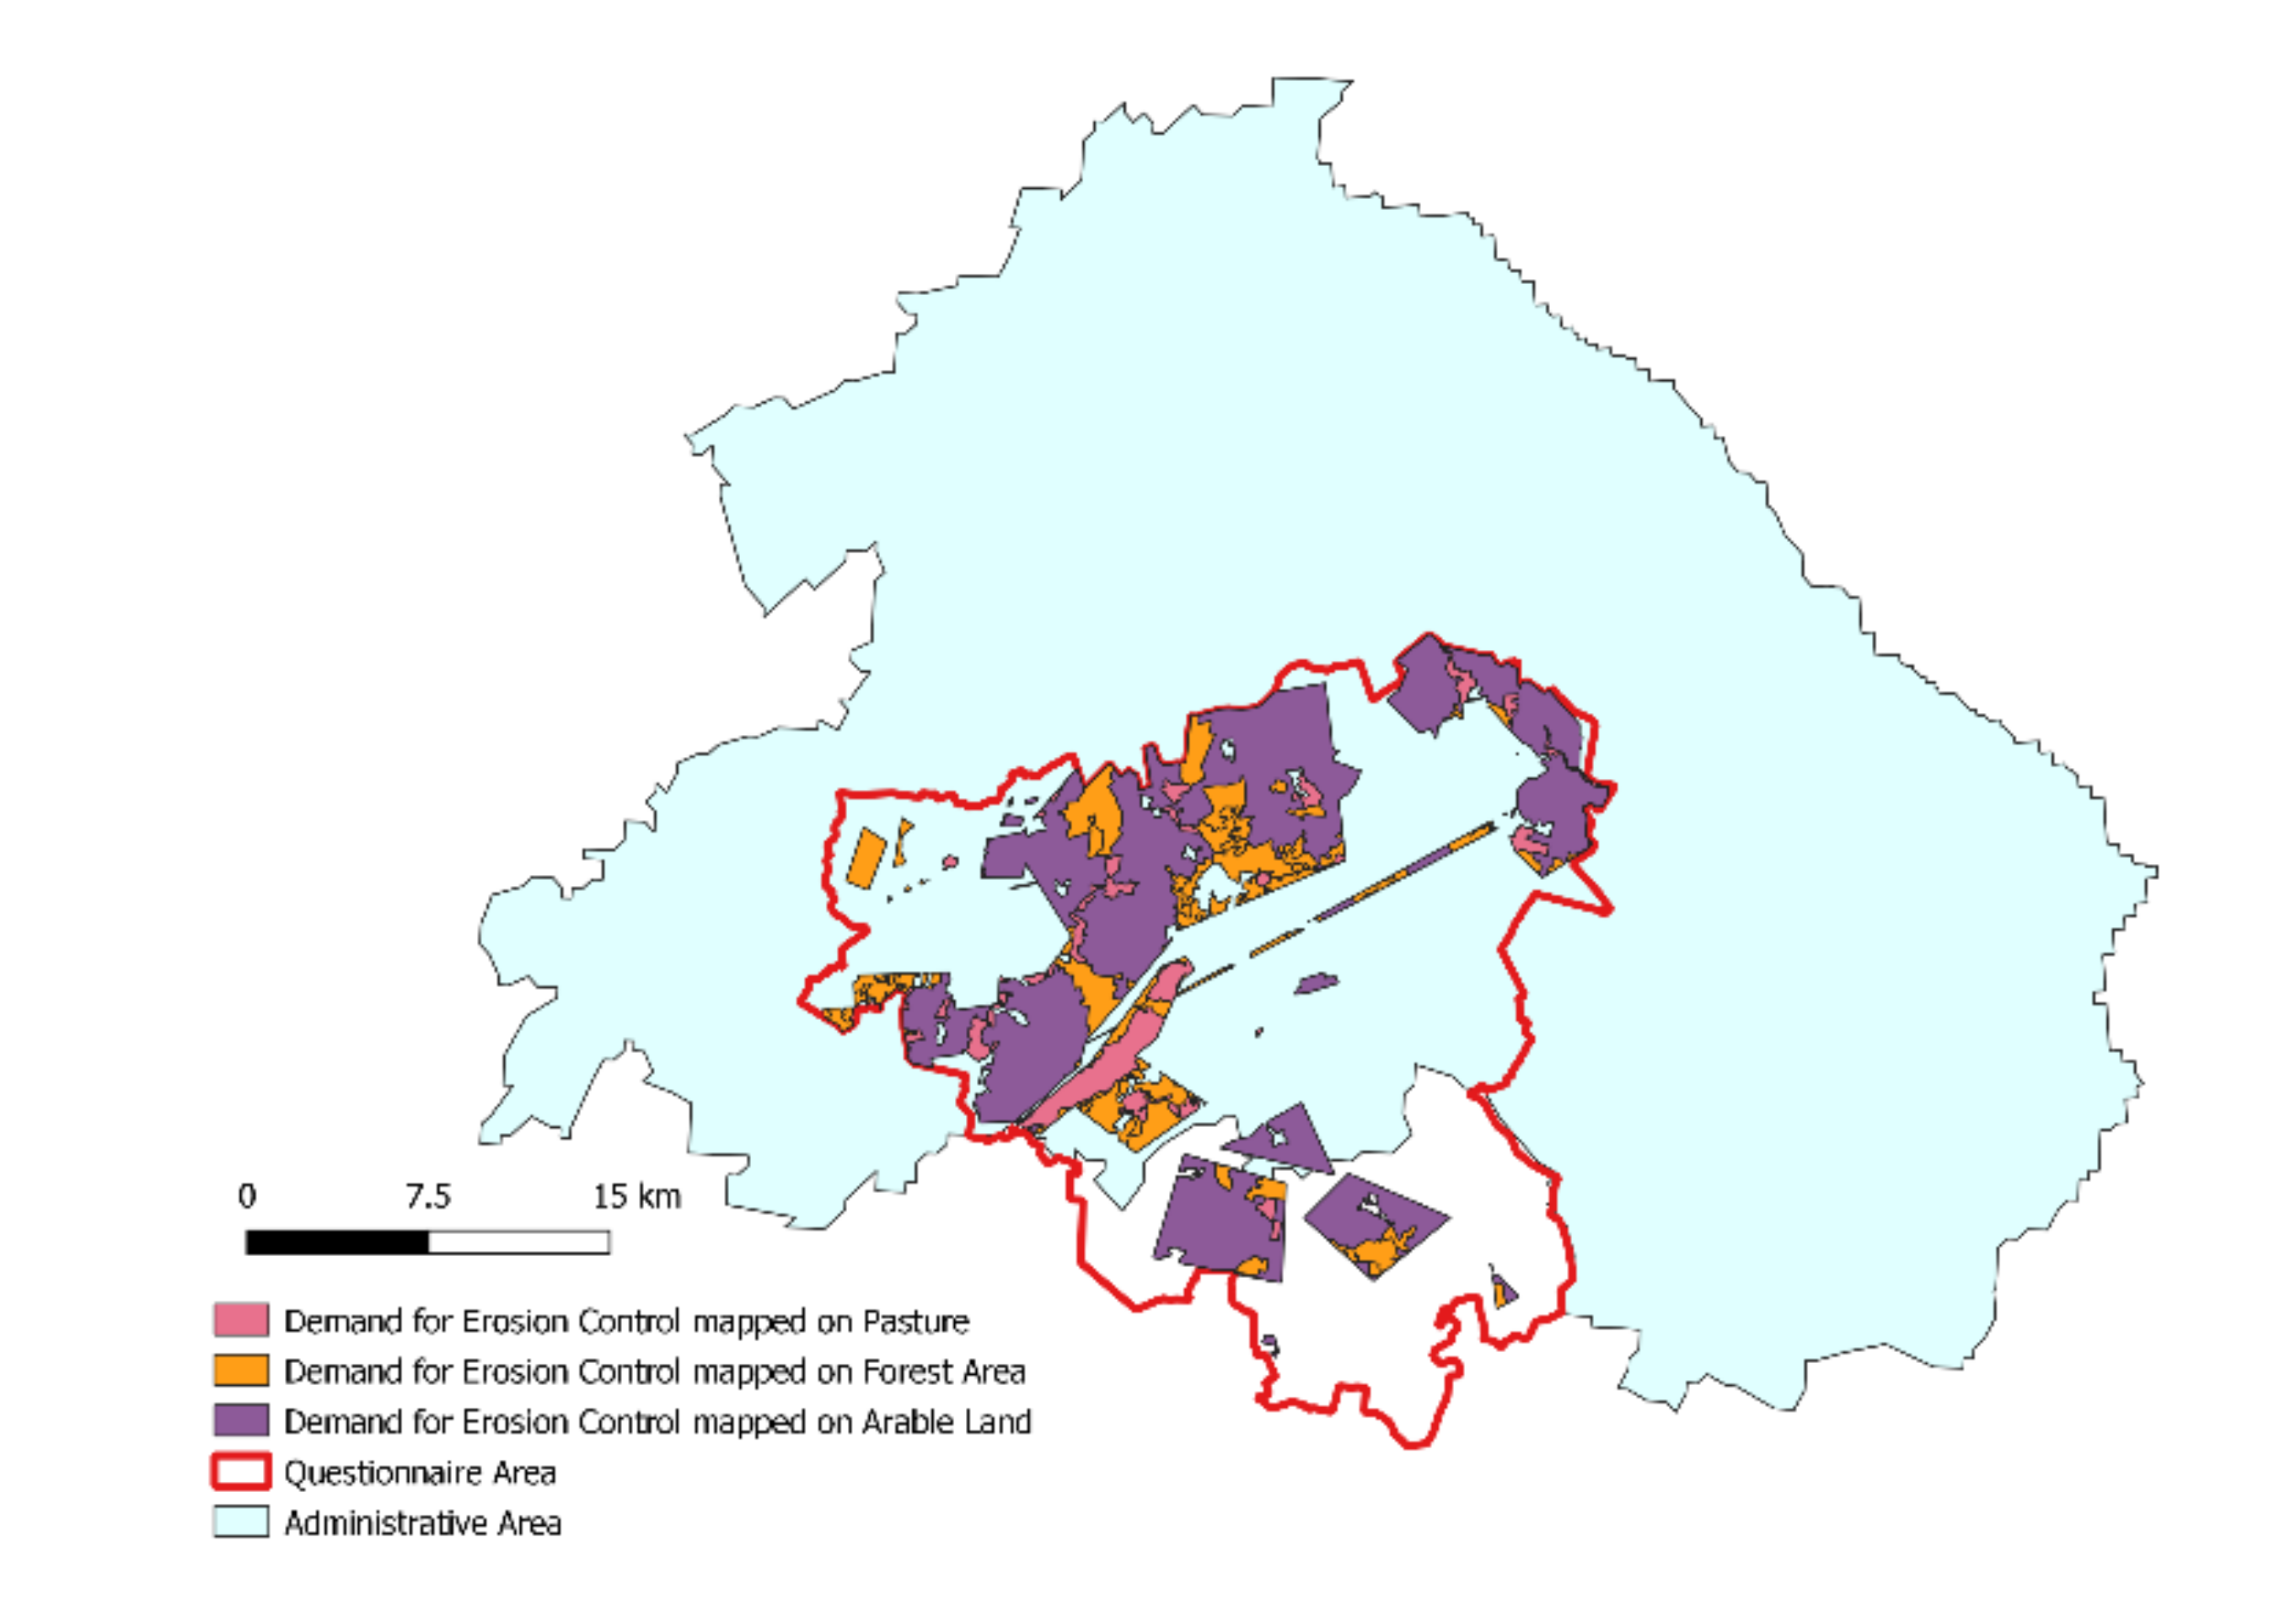
3.3.2. Mapped Area and Land Use
3.3.3. Stakeholder Workshop
4. Discussion
5. Conclusions
Author Contributions
Funding
Institutional Review Board Statement
Informed Consent Statement
Acknowledgments
Conflicts of Interest
Appendix A
Appendix A.1. Ecosystem Services
Appendix A.2. Erosion Risk and Erosion Control
Appendix A.3. Water Availability
Appendix A.4. Carbon Sequestration
- favoring biomass growth. Perennial crops and woody plants, in particular the removal of the greenhouse gas CO2 from the atmosphere by building up biomass, thus contributing to climate change mitigation.
- the development of organic matter-rich soil horizons by adding organic material (compost, crop residues).
Appendix A.5. Biodiversity
Appendix A.6. Yield


References
- Power, A.G. Ecosystem services and agriculture: Tradeoffs and synergies. Philos. Trans. R. Soc. B Biol. Sci. 2010, 365, 2959–2971. [Google Scholar] [CrossRef] [PubMed]
- Zhang, W.; Ricketts, T.H.; Kremen, C.; Carney, K.; Swinton, S.M. Ecosystem services and dis-services to agriculture. Ecol. Econ. 2007, 64, 253–260. [Google Scholar] [CrossRef] [Green Version]
- Altieri, M.A. Sustainable agricultural development in Latin America: Exploring the possibilities. Agric. Ecosyst. Environ. 1992, 39, 1–21. [Google Scholar] [CrossRef] [Green Version]
- Rasmussen, L.V.; Coolsaet, B.; Martin, A.; Mertz, O.; Pascual, U.; Corbera, E.; Dawson, N.; Fisher, J.A.; Franks, P.; Ryan, C.M. Social-ecological outcomes of agricultural intensification. Nat. Sustain. 2018, 1, 275–282. [Google Scholar] [CrossRef] [Green Version]
- Ungaro, F.; Zasada, I.; Piorr, A. Turning points of ecological resilience: Geostatistical modelling of landscape change and bird habitat provision. Landsc. Urban Plan. 2017, 157, 297–308. [Google Scholar] [CrossRef]
- Costanza, R.; d’Arge, R.; De Groot, R.; Farber, S.; Grasso, M.; Hannon, B.; Limburg, K.; Naeem, S.; O’Neill, R.V.; Paruelo, J.; et al. The value of the world’s ecosystem services and natural capital. Nature 1997, 387, 253–260. [Google Scholar] [CrossRef]
- Sandhu, H.S.; Wratten, S.; Cullen, R.; Case, B. The future of farming: The value of ecosystem services in conventional and organic arable land. An experimental approach. Ecol. Econ. 2008, 64, 835–848. [Google Scholar] [CrossRef]
- Sherrouse, B.C.; Clement, J.M.; Semmens, D.J. A GIS application for assessing, mapping, and quantifying the social values of ecosystem services. Appl. Geo. 2011, 31, 748–760. [Google Scholar] [CrossRef]
- Van Berkel, D.B.; Verburg, P.H. Spatial quantification and valuation of cultural ecosystem services in an agricultural landscape. Ecol. Indic. 2014, 37, 163–174. [Google Scholar] [CrossRef]
- Haines-Young, R.; Potschin, M. Common International Classification of Ecosystem Services (CICES) V5.1 and Guidance on the Application of the Revised Structure. 2018. Available online: www.cices.eu (accessed on 24 November 2021).
- Wolff, S.; Schulp, N.; Verburg, P. Mapping ecosystem services demand: A review of current research and future perspectives. Ecol. Indic. 2015, 55, 159–171. [Google Scholar] [CrossRef]
- Garcia-Martin, M.; Fagerholm, N.; Bieling, C.; Gounaridis, D.; Kizos, T.; Printsmann, A.; Müller, M.; Lieskovský, J.; Plieninger, T. Participatory mapping of landscape values in a Pan-European perspective. Landsc. Ecol. 2017, 32, 2133–2150. [Google Scholar] [CrossRef]
- García-Díez, V.; García-Llorente, M.; González, J.A. Participatory mapping of cultural ecosystem services in madrid: Insights for landscape planning. Land 2020, 9, 244. [Google Scholar] [CrossRef]
- Fagerholm, N.; Torralba, M.; Moreno, G.; Girardello, M.; Herzog, F.; Aviron, S.; Burgess, P.; Crous-Duran, J.; Ferreiro-Domínguez, N.; Graves, A.; et al. Cross-site analysis of perceived ecosystem service benefits in multifunctional landscapes. Glob. Environ. Chang. 2019, 56, 134–147. [Google Scholar] [CrossRef] [Green Version]
- Plieninger, T.; Torralba, M.; Hartel, T.; Fagerholm, N. Perceived ecosystem services synergies, trade-offs, and bundles in European high nature value farming landscapes. Landsc. Ecol. 2019, 34, 1565–1581. [Google Scholar] [CrossRef]
- Palomo, I.; Martín-López, B.; Potschin, M.; Haines-Young, R.; Montes, C. National Parks, buffer zones and surrounding lands: Mapping ecosystem service flows. Ecosyst. Serv. 2013, 4, 104–116. [Google Scholar] [CrossRef]
- Castro, A.J.; Verburg, P.H.; Martín-López, B.; Garcia, M.; Cabello, J.; Vaughn, C.C.; López, E. Ecosystem service trade-offs from supply to social demand: A landscape-scale spatial analysis. Landsc. Urban Plan. 2014, 132, 102–110. [Google Scholar] [CrossRef]
- Schulp, C.; Lautenbach, S.; Verburg, P. Quantifying and mapping ecosystem services: Demand and supply of pollination in the European Union. Ecol. Indic. 2013, 36, 131–141. [Google Scholar] [CrossRef]
- Nedkov, S.; Burkhard, B. Flood regulating ecosystem services—Mapping supply and demand, in the Etropole municipality, Bulgaria. Ecol. Indic. 2012, 21, 67–79. [Google Scholar] [CrossRef]
- Kroll, F.; Müller, F.; Haase, D.; Fohrer, N. Rural–urban gradient analysis of ecosystem services supply and demand dynamics. Land Use Policy 2012, 29, 521–535. [Google Scholar] [CrossRef]
- Bagstad, K.J.; Johnson, G.; Voigt, B.; Villa, F. Spatial dynamics of ecosystem service flows: A comprehensive approach to quantifying actual services. Ecosyst. Serv. 2013, 4, 117–125. [Google Scholar] [CrossRef]
- Geijzendorffer, I.R.; Martin-Lopez, B.; Roche, P. Improving the identification of mismatches in ecosystem services assessments. Ecol. Indic. 2015, 52, 320–331. [Google Scholar] [CrossRef]
- Lautenbach, S.; Mupepele, A.-C.; Dormann, C.F.; Lee, H.; Schmidt, S.; Scholte, S.S.K.; Seppelt, R.; Van Teeffelen, A.J.A.; Verhagen, W.; Volk, M. Blind spots in ecosystem services research and challenges for implementation. Reg. Environ. Chang. 2019, 19, 2151–2172. [Google Scholar] [CrossRef]
- Burkhard, B.; Kroll, F.; Nedkov, S.; Müller, F. Mapping ecosystem service supply, demand and budgets. Ecol. Indic. 2012, 21, 17–29. [Google Scholar] [CrossRef]
- Martin-Lopez, B.; Gómez-Baggethun, E.; García-Llorente, M.; Montes, C. Trade-offs across value-domains in ecosystem services assessment. Ecol. Indic. 2014, 37, 220–228. [Google Scholar] [CrossRef]
- Smith, P.; Ashmore, M.R.; Black, H.I.J.; Burgess, P.J.; Evans, C.D.; Quine, T.A.; Thomson, A.M.; Hicks, K.; Orr, H.G. REVIEW: The role of ecosystems and their management in regulating climate, and soil, water and air quality. J. Appl. Ecol. 2013, 50, 812–829. [Google Scholar] [CrossRef]
- Rodríguez, J.; Beard, T.D., Jr.; Bennett, E.; Cumming, G.; Cork, S.; Agard, J.; Dobson, A.P.; Peterson, G.D. Trade-offs across space, time, and ecosystem services. Ecol. Soc. 2006, 11, 1. [Google Scholar] [CrossRef] [Green Version]
- Mengist, W.; Soromessa, T.; Feyisa, G.L. A global view of regulatory ecosystem services: Existed knowledge, trends, and research gaps. Ecol. Process. 2020, 9, 1–14. [Google Scholar] [CrossRef]
- Syrbe, R.-U.; Grunewald, K. Ecosystem service supply and demand–the challenge to balance spatial mismatches. Int. J. Biodivers. Sci. Ecosyst. Serv. Manag. 2017, 13, 148–161. [Google Scholar] [CrossRef] [Green Version]
- Goldman, R.L.; Thompson, B.H.; Daily, G.C. Institutional incentives for managing the landscape: Inducing cooperation for the production of ecosystem services. Ecol. Econ. 2007, 64, 333–343. [Google Scholar] [CrossRef]
- Maerkisch-Oderland, L. Statistischer Jahresbericht 2020. 2021. Available online: https://www.maerkisch-oderland.de/datei/anzeigen/id/31785,1249/statistischer_jahresbericht_2020.pdf (accessed on 24 November 2021).
- Berlin-Brandenburg AfS. Bodennutzung und Ernte. 2021. Available online: https://statistik-berlin-brandenburg.de/regionalstatistiken/r-gesamt_neu.asp?Ptyp=410&Sageb=41002&creg=BBB&anzwer=8 (accessed on 24 November 2021).
- Maptionnaire 2021. Available online: https://maptionnaire.com/ (accessed on 24 November 2021).
- RStudio Team. RStudio: Integrated Development Environment for R; RStudio—PBC: Boston, MA, USA, 2021; Available online: https://www.rstudio.com (accessed on 8 September 2021).
- Searle, S.R.; Gruber, M.H. Linear Models; John Wiley & Sons: Hoboken, NJ, USA, 2016. [Google Scholar]
- Thomas, J.D.; Hultquist, R.A. Interval Estimation for the Unbalanced Case of the One-Way Random Effects Model. Ann. Stat. 1978, 6, 582–587. [Google Scholar] [CrossRef]
- Donner, A. The use of correlation and regression in the analysis of family resemblance. Am. J. Epidemiol. 1979, 110, 335–342. [Google Scholar] [CrossRef]
- EEA. Corine Land Cover (CLC). 2018. Version 20b2. Available online: https://land.copernicus.eu/pan-european/corine-land-cover/clc2018 (accessed on 24 November 2021).
- Lessells, C.; Boag, P.T. Unrepeatable repeatabilities: A common mistake. Auk 1987, 104, 116–121. [Google Scholar] [CrossRef]
- Brown, G.; Sanders, S.; Reed, P. Using public participatory mapping to inform general land use planning and zoning. Landsc. Urban Plan. 2018, 177, 64–74. [Google Scholar] [CrossRef]
- Klapwijk, C.; van Wijk, M.; Rosenstock, T.; van Asten, P.; Thornton, P.; Giller, K. Analysis of trade-offs in agricultural systems: Current status and way forward. Curr. Opin. Environ. Sustain. 2014, 6, 110–115. [Google Scholar] [CrossRef] [Green Version]
- Fagerholm, N.; Käyhkö, N. Participatory mapping and geographical patterns of the social landscape values of rural communities in Zanzibar, Tanzania. Fenn. Int. J. Geogr. 2009, 187, 43–60. [Google Scholar]
- Kenter, J.O. Integrating deliberative monetary valuation, systems modelling and participatory mapping to assess shared values of ecosystem services. Ecosyst. Serv. 2016, 21, 291–307. [Google Scholar] [CrossRef]
- Grêt-Regamey, A.; Sirén, E.; Brunner, S.H.; Weibel, B. Review of decision support tools to operationalize the ecosystem services concept. Ecosyst. Serv. 2017, 26, 306–315. [Google Scholar] [CrossRef] [Green Version]
- Nordström, E.-M.; Nieuwenhuis, M.; Başkent, E.Z.; Biber, P.; Black, K.; Borges, J.G.; Bugalho, M.N.; Corradini, G.; Corrigan, E.; Eriksson, L.O.; et al. Forest decision support systems for the analysis of ecosystem services provisioning at the landscape scale under global climate and market change scenarios. Eur. J. For. Res. 2019, 138, 561–581. [Google Scholar] [CrossRef]
- Klein, T.; Celio, E.; Grêt-Regamey, A. Ecosystem services visualization and communication: A demand analysis approach for designing information and conceptualizing decision support systems. Ecosyst. Serv. 2015, 13, 173–183. [Google Scholar] [CrossRef]


| Section | Division | Group | Class | Class Type | Simple Descriptor |
|---|---|---|---|---|---|
| Provisioning | Biomass | Cultivated terrestrial plants for nutrition, materials or energy | Cultivated terrestrial plants (including fungi, algae) grown for nutritional purposes | Crops by amount, type (e.g., cereals, root crops, soft fruit) | Any crops and fruit grown by humans for food; food crops |
| Biomass | Cultivated terrestrial plants for nutrition, materials or energy | Cultivated plants (including fungi, algae) grown as a source of energy | By amount, type, source | Plant materials used as a source of energy | |
| Regulation and Maintenance | Regulation of physical, chemical and biological conditions | Regulation of baseline flows and extreme events | Hydrological cycle and water flow regulation (including flood control and coastal protection) | By depth/volumes | Regulating the flows of water in our environment |
| Regulation of physical, chemical and biological conditions | Pest and disease control | Pest control (including invasive species) | By reduction in incidence, risk, area protected by type of living system | Controlling pests and invasive species | |
| Cultural | Direct, in situ and outdoor interactions with living systems that depend on presence in the environmental setting | Physical and experiential interactions with natural environment | Characteristics of living systems that that enable activities promoting health, recuperation or enjoyment through active or immersive interactions | By type of living system or environmental setting | Using the environment for sport and recreation; using nature to help stay fit |
| Direct, in situ and outdoor interactions with living systems that depend on presence in the environmental setting | Intellectual and representative interactions with the natural environment | Characteristics of living systems that are resonant in terms of culture or heritage | By type of living system or environmental setting | The things in nature that help people identify with the history or culture of where they live or come from |
| MOL | OPR | UM | |
|---|---|---|---|
| Total Area (km2) | 2158.5 | 2508.65 | 3058.35 |
| Agricultural Area (km2) | 1255 (58.14% of total area) | 1253 (49.95% of total area) | 1766 (57.77% of total area) |
| Agricultural Area—Crops (km2) | 1160 (92.43% of agricultural area) | 907 (72.39% of agricultural area) | 1472 (83.35% of agricultural area) |
| Agricultural Area—Grassland (km2) | 91 (7.25% of agricultural area) | 341 (27.21% of agricultural area) | 293 (16.6% of agricultural area) |
| Perennial cultures and others (km2) | 4 (0.32% of agricultural area) | 5 (0.32% of agricultural area) | 1 (0.05% of agricultural area) |
| Forest Area (km2) | 510.27 (23.6% of total area) | 813.76 (32.44% of total area) | 748.11 (24.46% of total area) |
| Stakeholder_Category | ICC | LowerCI | UpperCI | n | k | varw | vara |
|---|---|---|---|---|---|---|---|
| CS_Perceived_supply_average | −0.069 | −0.305 | 0.167 | 13 | 3.553 | 700.048 | −45.100 |
| CS_Demand_average | 0.024 | −0.173 | 0.378 | 13 | 3.553 | 1875.583 | 45.957 |
| Bio_Perceived_supply_average | 0.032 | −0.168 | 0.387 | 13 | 3.553 | 1001.460 | 32.876 |
| Bio_Demand_average | 0.013 | −0.180 | 0.365 | 13 | 3.553 | 2085.036 | 28.245 |
| Yield_Perceived_supply_average | −0.112 | −0.254 | 0.196 | 13 | 3.553 | 1228.897 | −123.892 |
| Yield_Demand_average | −0.009 | −0.194 | 0.339 | 13 | 3.553 | 1844.923 | −15.690 |
| Water_Perceived_supply_average | −0.075 | −0.233 | 0.250 | 13 | 3.553 | 652.103 | −45.432 |
| Water_Demand_average | −0.073 | −0.232 | 0.253 | 13 | 3.553 | 1864.221 | −126.847 |
| EC_Perceived_supply_average | 0.157 | −0.084 | 0.518 | 13 | 3.553 | 555.733 | 103.313 |
| EC_Demand_average | −0.001 | −0.189 | 0.348 | 13 | 3.553 | 1573.915 | −0.861 |
| Stakeholder Category | Code | Stakeholder Category | Code |
|---|---|---|---|
| Administration | 1 | Gardening | 8 |
| Association | 2 | Investment | 9 |
| Authority | 3 | Nature protection | 10 |
| Civil society | 4 | Politics | 11 |
| Entrepreneurship | 5 | Science | 12 |
| Farmer | 6 | Tourist marketing and planning | 13 |
| Forester | 7 | N.B. Zero value = not answered | |
| MOL (km2) | % of Total Area Mapped | OPR (km2) | % of Total Area Mapped | UM (km2) | % of Total Area Mapped | |
|---|---|---|---|---|---|---|
| Biodiversity | 21,551.5 | 13.67 | 10,212.7 | 16.19 | 8266.94 | 24.88 |
| Carbon Sequestration | 9710.42 | 6.16 | 25,911.9 | 41.08 | 2333.75 | 7.02 |
| Erosion Control | 41,159.3 | 26.10 | 6358.08 | 10.08 | 12234 | 36.82 |
| Water Availability | 69,534.8 | 44.09 | 15,032.2 | 23.83 | 7482.88 | 22.52 |
| Yield | 15,739 | 9.98 | 5559.28 | 8.81 | 2911.41 | 8.76 |
| Total area mapped (km2) | 157,695.02 | 63,074.16 | 33,228.98 |
| Biodiversity (km2) | % of Total Surface Area Mapped | Carbon Sequestration (km2) | % of Total Surface Area Mapped | Erosion Control (km2) | % of Total Surface Area Mapped | Water Availability (km2) | % of Total Surface Area Mapped | Yield (km2) | % of Total Surface Area Mapped | |
|---|---|---|---|---|---|---|---|---|---|---|
| Arable land | 7294.76 | 40.80 | 5505.98 | 64.12 | 15,738.6 | 63.30 | 23,261.8 | 49.09 | 6970.03 | 65.60 |
| Pasture | 1836.81 | 10.27 | 1172.54 | 13.66 | 2223.18 | 8.94 | 3598.08 | 7.59 | 507.87 | 4.78 |
| Forest area | 6868.79 | 38.41 | 1526.91 | 17.78 | 5083.63 | 20.45 | 15,358.5 | 32.41 | 2794.77 | 26.30 |
| Total surface area (km2) | 17,881 | 8586.82 | 24,864.8 | 47,388.1 | 10,625.2 |
Publisher’s Note: MDPI stays neutral with regard to jurisdictional claims in published maps and institutional affiliations. |
© 2021 by the authors. Licensee MDPI, Basel, Switzerland. This article is an open access article distributed under the terms and conditions of the Creative Commons Attribution (CC BY) license (https://creativecommons.org/licenses/by/4.0/).
Share and Cite
Schwartz, C.; Shaaban, M.; Bellingrath-Kimura, S.D.; Piorr, A. Participatory Mapping of Demand for Ecosystem Services in Agricultural Landscapes. Agriculture 2021, 11, 1193. https://doi.org/10.3390/agriculture11121193
Schwartz C, Shaaban M, Bellingrath-Kimura SD, Piorr A. Participatory Mapping of Demand for Ecosystem Services in Agricultural Landscapes. Agriculture. 2021; 11(12):1193. https://doi.org/10.3390/agriculture11121193
Chicago/Turabian StyleSchwartz, Carmen, Mostafa Shaaban, Sonoko Dorothea Bellingrath-Kimura, and Annette Piorr. 2021. "Participatory Mapping of Demand for Ecosystem Services in Agricultural Landscapes" Agriculture 11, no. 12: 1193. https://doi.org/10.3390/agriculture11121193
APA StyleSchwartz, C., Shaaban, M., Bellingrath-Kimura, S. D., & Piorr, A. (2021). Participatory Mapping of Demand for Ecosystem Services in Agricultural Landscapes. Agriculture, 11(12), 1193. https://doi.org/10.3390/agriculture11121193