Article

The Immense Functional Attributes of Maize Rhizosphere Microbiome: A Shotgun Sequencing Approach

by
Saheed Adekunle Akinola
,
Ayansina Segun Ayangbenro
and
Olubukola Oluranti Babalola
*
Food Security and Safety Niche, Faculty of Natural and Agricultural Sciences, North-West University, Private Mail Bag X2046, Mmabatho 2735, South Africa
*
Author to whom correspondence should be addressed.
Agriculture 2021, 11(2), 118; https://doi.org/10.3390/agriculture11020118
Submission received: 25 November 2020 / Revised: 4 January 2021 / Accepted: 6 January 2021 / Published: 2 February 2021
(This article belongs to the Special Issue Advanced Research of Soil Microbial Functional Diversity)

Abstract

:
The northwest (NW) province of South Africa is a semi-arid area, often disturbed by soil extremes such as drought and intense temperature. However, many functions possessed by the rhizosphere microbiome are still required, especially those inhabiting arid and semi-arid soils. This study involves a metagenomic comparison of the major metabolic attributes of two maize rhizosphere soils and their surrounding soils. Here, we hypothesized that there is a considerable difference between the functional diversity of maize rhizosphere and bulk soils and that the rhizosphere soil has distinct functional traits of agricultural importance. A high-throughput sequencing approach was used to assess the metabolic profile of rhizosphere soil microbiota of maize collected from the Gauteng and NW provinces of South Africa. The relative abundance of 13 functional hit categories was significantly different between the sampling sites. The diversity indices showed a considerable difference between the rhizosphere and surrounding soils. The difference in the chemical properties of the sampling sites was responsible for the variation in the microbial functional composition. Nevertheless, the presence of a high relative abundance of functional categories with unknown functions in SEED subsystem-2 coupled with the large number of functional hits conferring a response to soil stressors viz. oxidative stress, heat shock, osmotic stress, and cold shock noticed in the rhizosphere samples may indicate the presence of novel genes at the sampling sites. Exploring the plant growth-promoting traits of microorganisms present at these sites could eliminate the constraint posed by soil stressors on sustainable agriculture.

1. Introduction

Rhizosphere microorganisms occupy the area surrounding a plant’s roots and are influenced by complex activities associated with the host plant, such as root exudates [1]. Root exudates are compounds such as sugars, acids, peptides, amino acids, secondary metabolites, and organic compounds that influence the chemical and biological activities in the soil surrounding the plant. Here, a complex microbial interaction occurs, hindering the growth of the pathogens, abiotic and biotic stress tolerance, and biogeochemical cycling of nutrients in the plant biosphere [2].
The number of important soil microbiota increases as a result of organic compound secretion; hence, the richness of this environment instigates a complex interplay among organisms, resulting in either beneficial, neutral, or harmful effects on the plant. For example, the decomposition of plant residue and soil organic matter is a result of beneficial effects posed by soil microbes. The interaction between soil microbial diversity and the food web has received much attention over the years due to the large effect it has on food safety. The soil microbiome influences the environment of plants differently; for instance, an ecosystem dominated by bacteria is known for attributes such as high nutrient availability, a neutral to mildly acidic pH, and low organic material content because of high biological activities taking place in the environment [3,4]. The activities of bacteria in the soil mean that the plant’s environment is predisposed to the easy loss of nutrients via frequent mineralization of organic matter, exhausting soil nutrient reserves. Prokaryotes, specifically bacteria and archaea, drive the activities of plant ecosystems and are called ecosystem determinants. Therefore, agricultural sustainability is mainly dependent on or justified by the activities of these organisms, such as carbon sequestration, biogeochemical cycling, and pathogen control [4].
The changes in the physical and chemical attributes of rhizosphere soil alter the productivity of agricultural soils, and as such, soil quality assessment indicators viz. biological activities and strong plant–soil interactions have been used to predict quality and functional attributes of plant biosphere [5].
In the northwest (NW) province of South Africa, most (54%) of the land is mainly used for farming viz. crop production and animal grazing. In addition to the fact that South Africa is in the sub-Saharan part of Africa—with semi-arid soils—the NW province has a considerably high provincial soil degradation index, with the croplands affected by water and wind erosion due to lack of drainage systems [6]. The rate at which the farmlands are degraded remains constant and severely inhibits crop safety, with the loss of plants and soil nutrients a serious threat to sustaining crop production. In spite of this, the area still produces the largest percentage of staple food in South Africa, accounting for more than 30% of the total maize production in the country [6,7]. Therefore, to maintain the level of maize production in the NW province and South Africa, sustainable land-use practices are needed.
Previously, culture-based microbial analysis has been adopted for characterizing soil microbiota. Using phenotypic identification processes to classify microbial diversity inhabiting a plant’s rhizosphere is a crude method, and has produced little information about soil inhabitants and their functions. Nevertheless, most soil microbiota cannot be classified using traditional culture-based methods because the majority of soil biosphere organisms are non-culturable; therefore, there is a need for culture-independent techniques [8]. An eco-genomics sequencing approach (Illumina, Roche 454 etc.) has been useful in this regard, but there is still a paucity of studies on microbiome of the plant rhizosphere, especially those grown in arid and semi-arid soils.
Because the functional distinctiveness and application of soil microorganisms is under-explored, we speculate that there is a considerable difference between the functional diversity of the maize rhizosphere and bulk soils, and that the rhizosphere soil will host many important microorganisms of agricultural importance. In this research, we used shotgun metagenomic sequencing to assess the rhizosphere microbial structure and functions in maize plantations from selected farms in the Gauteng and NW provinces, and to describe the role of dominant rhizobia in key metabolic functions of maize soil.

2. Materials and Methods

2.1. Description of Study Area and Soil Sampling

Aseptically, 50 g of rhizosphere soil samples [9] were collected in triplicate from two farms situated in Randfontein (26°11′52.0″ S 27°33′18.3″ E) and Lichtenburg town (25°59′40.4″ S 26°31′44.5″ E) in the Gauteng and NW provinces. These included Randfontein maize farm (Rs), adjacent bulk sample (Rc), Lichtenburg maize farm (Ls), and adjacent bulk sample (Lc). Randfontein is situated 45 km west of Johannesburg, commonly referred to as gold mining municipality during the 1800s, while Lichtenburg is 188 km west of Johannesburg, and a seasonal rainfall for both towns is between April and November with approximately 365 mm mean annual rainfall. Vegetation in the towns is sparsely distributed and can be seen in succession due to environmental factors such as erosion [6]. The vegetation is heterogeneously distributed with numerous and relatively distinct plant communities with different species composition. Genetically modified (GM)-white and yellow maize seeds were planted in the two towns. After taking the consent of the farm owners, rhizosphere soils that were tightly bound to the plant roots were collected aseptically, while the bulk samples were collected from 10 m (adjacent) from the rhizosphere samples [9]. The samples were transported to the Department of Microbiology, Northwest University Mafikeng campus using a cooler box containing ice-packs and stowed in the cold room at −20 °C for one week before the chemical analysis and DNA extraction.

2.2. Chemical Analysis of Soil

In total, 20 g of the samples were used for chemical analysis. Using the ratio of 1:2.5 (soil-deionized water), the pH of samples was assessed using a pH-meter. Afterward, at pH 8.5, the phosphorus content of samples was determined by extraction with sodium bicarbonate (NaHCO3) [10], while the availability of organic matter (OM) and potassium (K) was determined according to the method of Walkley and Black [11]. To determine calcium (Ca2+) and magnesium (Mg2+), 1M NH4CH3CO2 (ammonium acetate) was used to extract soil magnesium and calcium, as well as measure with the aid of 230ATS Atomic Absorption Spectrophotometer (λ-190-900 nm) [12]. After that, dichromate digestion was used to calculate the organic carbon [13]. Then, data collected from triplicate readings were used to find the mean using GraphPad Prism version 5.

2.3. DNA Extraction, Metagenomic Sequencing, and Downstream Analysis

Using the DNeasy Power-Max soil kit (MOBIO Laboratories, Carlsbad, CA, USA), whole DNA from 5 g soil samples was extracted using the manufacturer’s procedure. Illumina sequencing was conducted at the Molecular Laboratory MR DNA (Shallowater, TX, USA) using shotgun whole-genome sequencing. The libraries were prepared using the Nextera DNA Flex library preparation kit. Moreover, 20–50 ng DNA was used to prepare the libraries. The samples were simultaneously fragmented and adapter sequences were added. The concentration of the libraries was finally measured using the Qubit® dsDNA HS Assay Kit (Life Technologies, Carlsbad, CA, USA) and the average library size was measured using the Agilent 2100-Bioanalyzer. The libraries were pooled and diluted (to 0.6 nM), then sequenced paired-end for 300-cycles using the NovaSeq system (Illumina). Reads were annotated using the Metagenomics Rapid Annotations Subsystems Technology (MG-RAST) server v4.0.3 [14]. After subjecting raw reads to quality control, the BLAST-like alignment (BLAT) algorithm was employed in annotating sequences [15] against the M5NR database [16], which provides nonredundant incorporation of various databases. The soil functional features and rhizobiome classifications were performed using the SEED subsystem level 1 and 2 (Table S1 and Figure S1) with a maximum alignment length of 15 base pairs, a minimum identity of 60%, and an e-value of 1 × 10⁻⁵. Annotated functional tables extracted from MG-RAST were agglomerated based on functional level and unclassified reads retained for statistical analysis. After the 12 sequences were annotated using MG-RAST, the mean relative abundances of the triplicate samples from each site (Ls, Rs, Lc, and Rc) were used for further analysis.
Pielou evenness and Shannon indices were used to determine the alpha diversity. Using PAST version 3.20 [17], the Kruskal–Wallis test was used to depict the diversity indices across the sites. Raw sequences used in this study were made available on the NCBI database with bio-project accession-number PRJNA645371 and PRJNA645385 for all the samples and controls. Quality-filtered and annotated data are publicly available in MG-RAST at mgm4898558.3, mgm4898574.3, mgm4898575.3, mgm4898551.3, mgm4898552.3, and mgm4898555.3 for each replicate.

2.4. Statistical Analysis

The differences between the pedological parameters were determined via a one-way analysis of variance (ANOVA) with Tukey’s honest significant difference (HSD) test using the GraphPad Prism (v5.0). p ≤ 0.05 was considered significant. The relative abundance of microbial functional hits was plotted using the shinyheatmap. Adopting the Bray–Curtis distance matrix using CANOCO 5 (Micro-computer Power, Ithaca, NY, USA), the mean relative abundance of functional features was used to plot the principal coordinate analysis (PCoA) and principal component analysis (PCA) of the samples. Likewise, canonical correspondence analysis (CCA) was used to evaluate the correlation between functional categories, while the evaluated chemical parameters was plotted with the aid of CANOCO 5. Hence, to evaluate environmental variables that best explain the diversity of soil functional attributes, CANOCO default settings, adopting forward selection of pedological variables, and Monte-Carlo permutation test were used.

3. Results

3.1. Chemical Properties of Maize Rhizosphere Soil and Control Samples

The chemical properties of the samples showed that the pH level of the samples collected from Lichtenburg (Ls–5.62, Lc–5.87) was more acidic than the pH (Rs-6.76, Rc-6.73) of the samples collected from Randfontein, while the organic C of Rs (1.09) and Rc (0.87) were significantly higher than the Ls (0.61) and Lc (0.60) samples (p < 0.05). P, N-NO3, and K contents showed a significant difference (p < 0.05) between rhizosphere samples, but indifferent compared with their controls. In the case of N-NH4, the values varied significantly between the samples except Ls and its control (p = 0.04). Soil parameters such as sulfate, total C, and OM showed no significant difference between the rhizosphere and the surrounding samples (p > 0.05) (Table 1).

3.2. Sequence Information and Processing Output

The output file showing the mean of raw sequences and the quality-filtered information of met genomics data using MG-RAST is compiled in Table 2.

3.3. Functional Attributes Associated with the Rhizosphere Samples and Their Controls

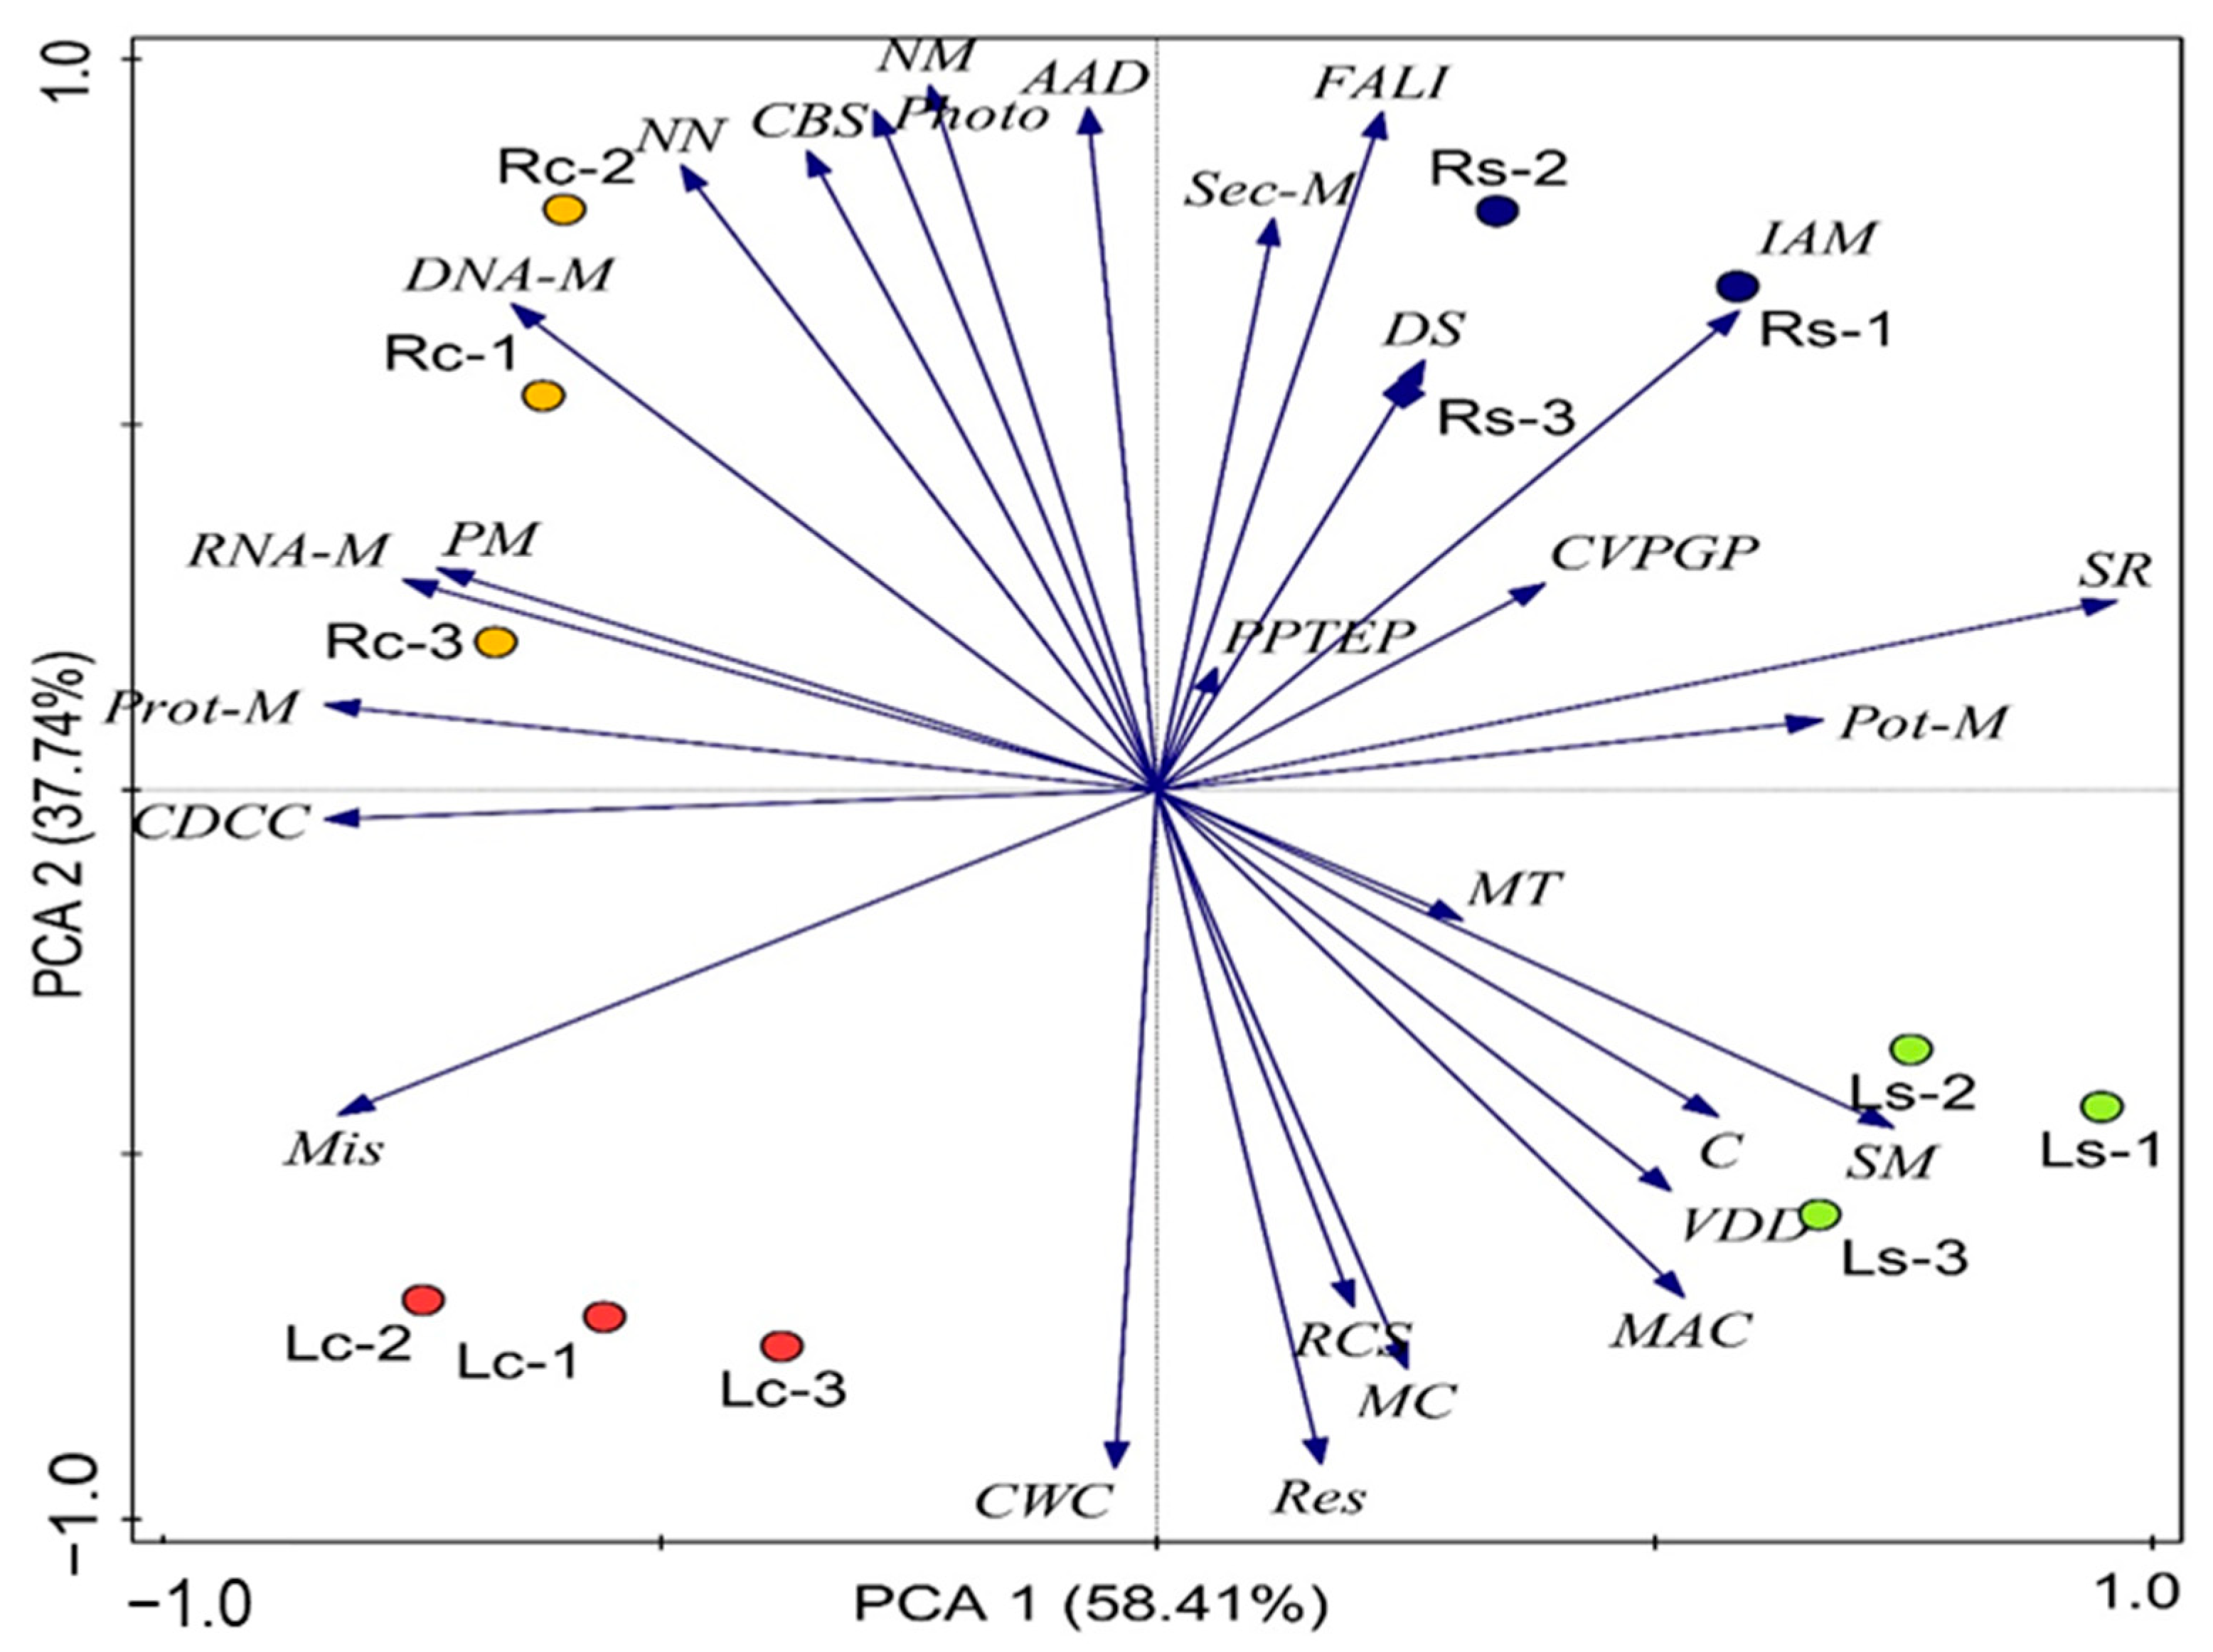
This research adopted the main functional hit categories from SEED subsystem level 1 gene annotation (MG-RAST) and further explained with annotations derived from SEED subsystem level 2. The major functional hits derived from level 1 annotation were 28, with only 13 showing significant difference (p ≤ 0.05) between the rhizosphere and the surrounding soil samples. The significantly different categories include amino acid derivatives (AAD), clustering-based subsystems (CBS), DNA metabolism (DNA-M), fatty acids, lipids and isoprenoids (FALI), the metabolism of aromatic compounds (MAC), miscellaneous (Mis), nitrogen metabolism (NM), nucleosides and nucleotides (NN), photosynthesis (Photo), protein metabolism (Prot-M), respiration (Res), secondary metabolism (Sec-M), and stress response (SR). While others such as carbohydrate metabolism (C), cofactors, vitamins, prosthetic groups and pigments (CVPGP), membrane transport (MT), cell wall capsule (CWC), RNA metabolism (RNA-M), virulence, disease and defense (VDD), phosphorus metabolism (PM), motility and chemotaxis (MC), sulfur metabolism (SM), regulation and cell signaling (RCS), cell division and cell cycle (CDCC), phages, prophages, transposable elements and plasmids (PPTEP), iron acquisition and metabolism (IAM), dormancy and sporulation (DS), and potassium metabolism (Pot-M) were not significantly different at p ≥ 0.05 (Figure 1 and Table S1). The most prominent hits in the rhizosphere and bulk samples were C, CBS, AAD, Prot-M, Mis, CVPGP, DNA-M, and Res, while SR and VDD of the samples (Ls-3.06, 3.03; Rs-3.10, 2.95) were observed to be far higher than the controls (Lc-2.50, 2.58; Rc-2.93, 2.80) at p ≤ 0.05. The graphical distribution of functional categories across all samples was structured using principal component analysis (PCA). PCA revealed that activities were higher in Ls (Res, MC, C, MAC, RCS, SM, CVPGP, etc.) compared to Lc (CWC, Mis). While in the other samples, both Rs (SR, MT, Pot-M, DS, IAM, FALI, Sec-M, and AAD) and Rc (CDCC, Prot-M, RNA-M, PM, DNA-M, NN, CBS, and NM) showed high functional hits considering the vectors (Figure 2).
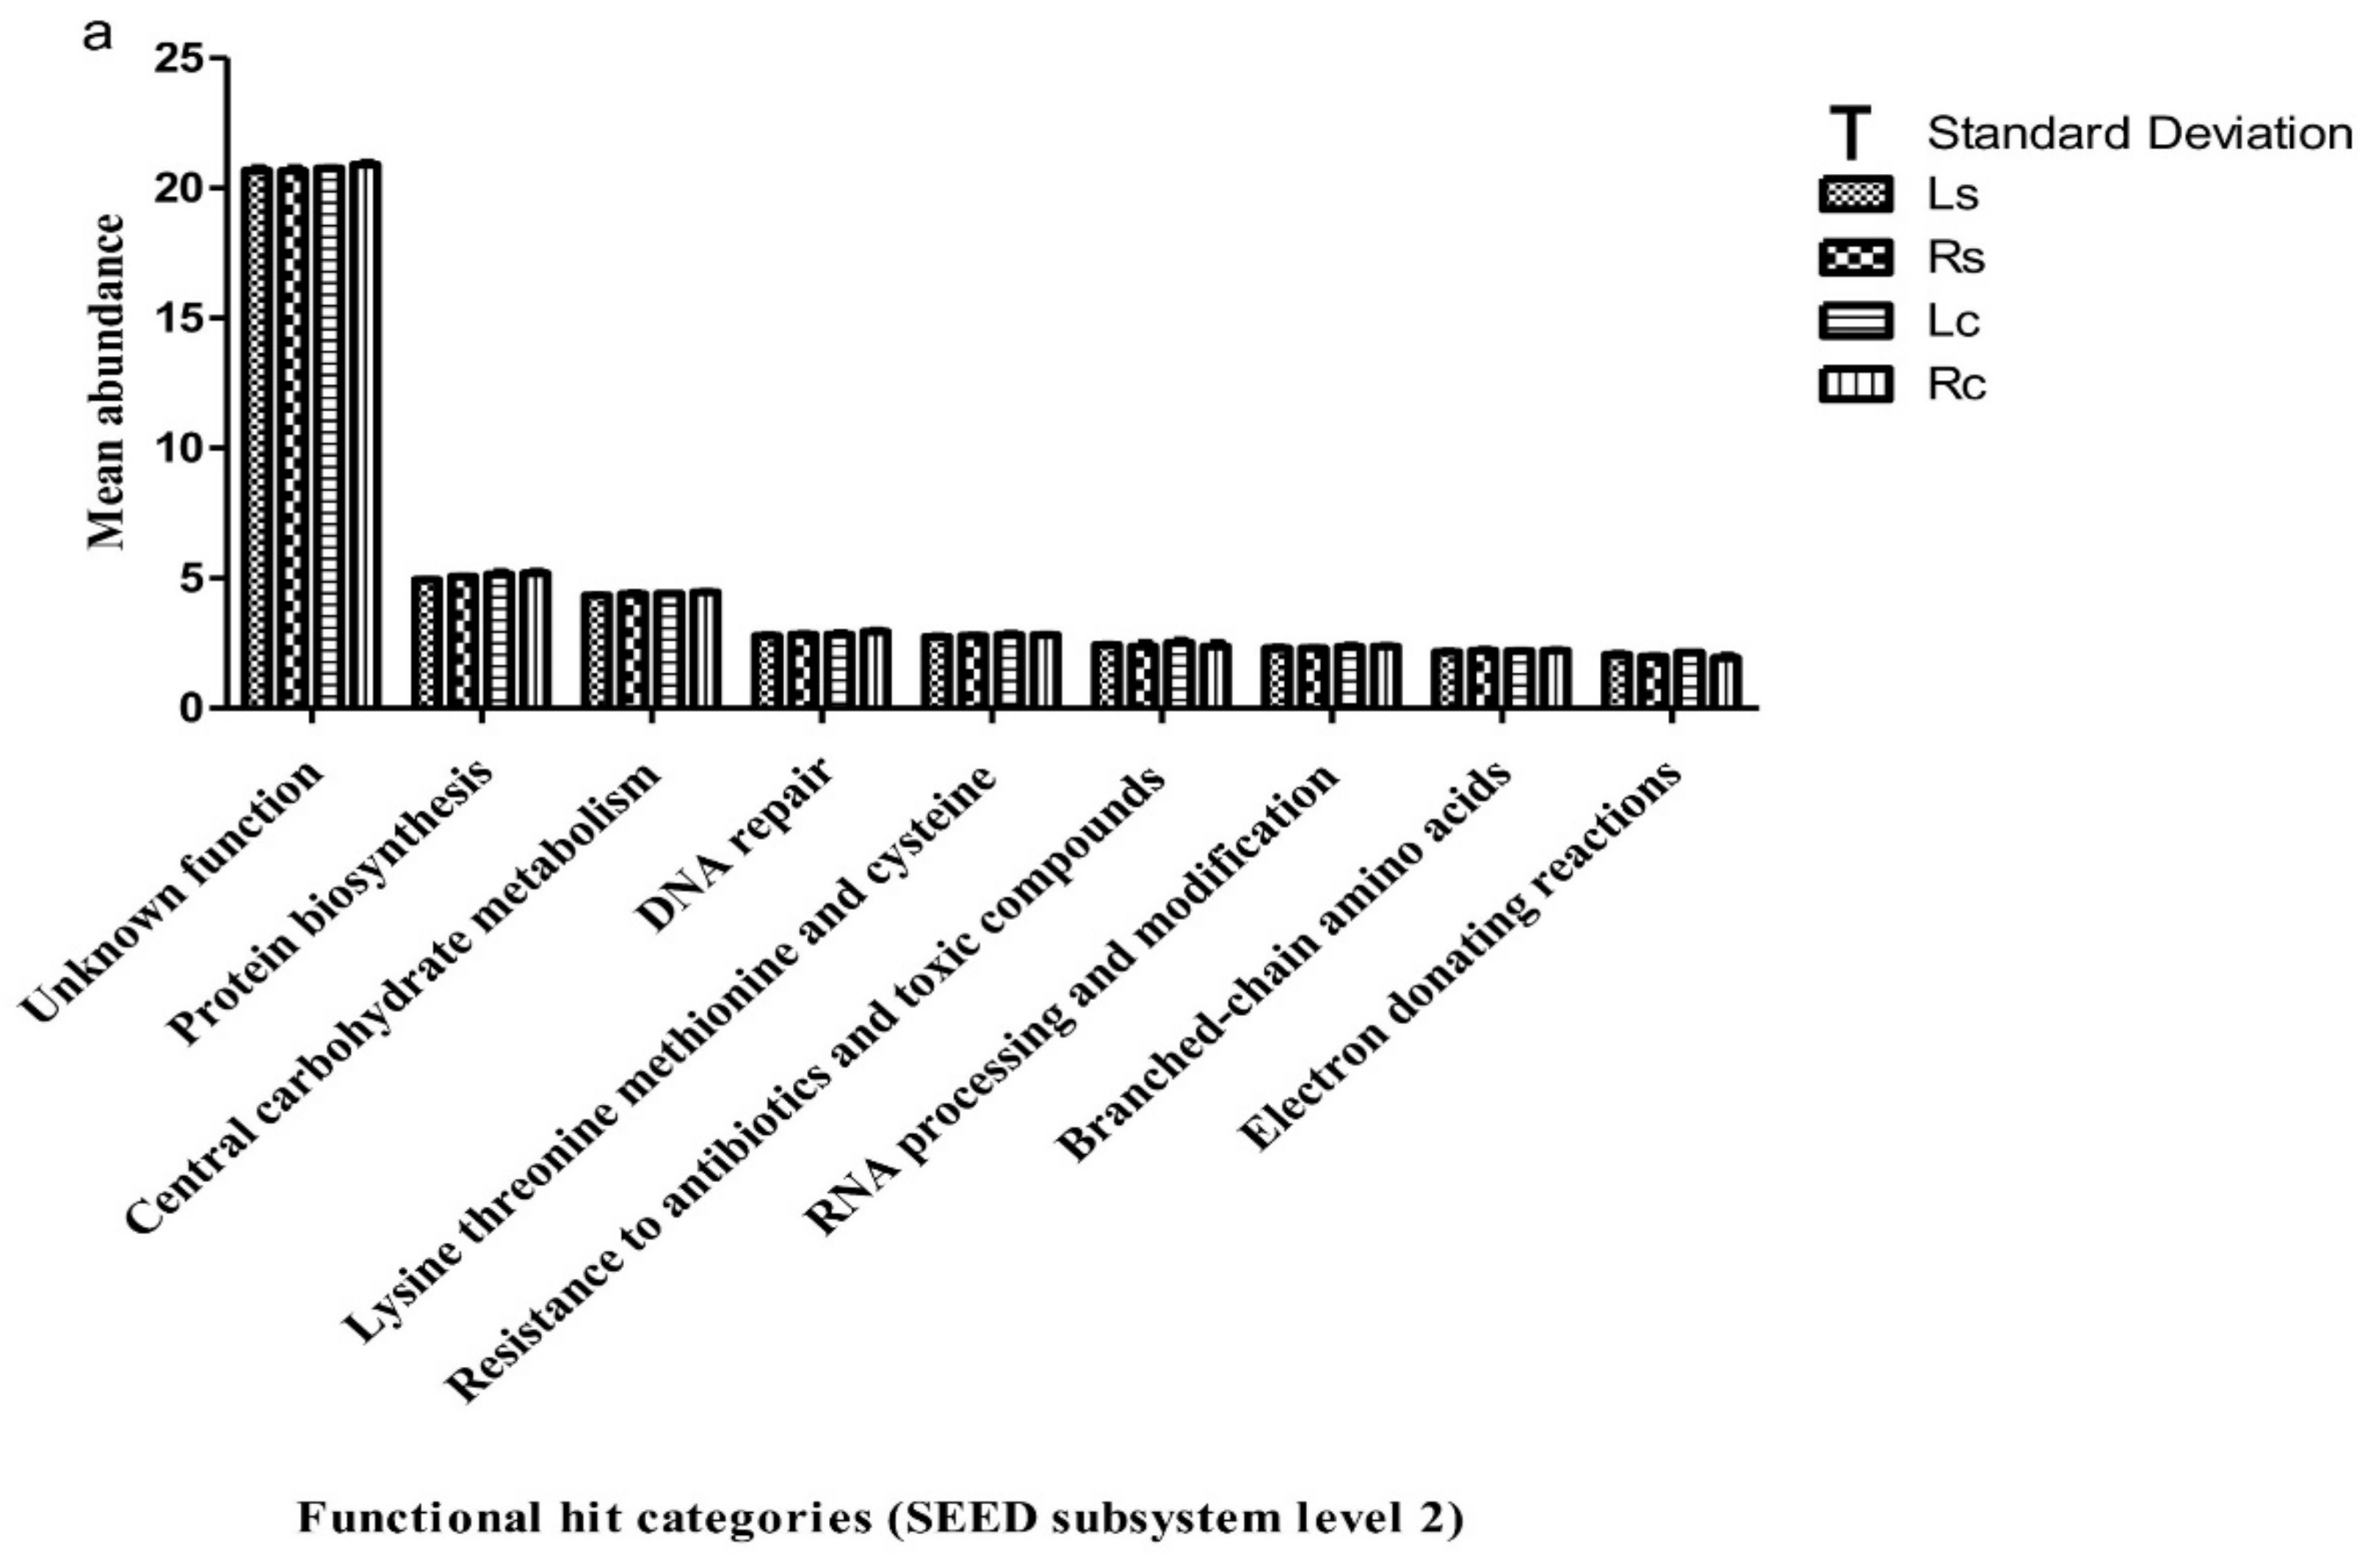
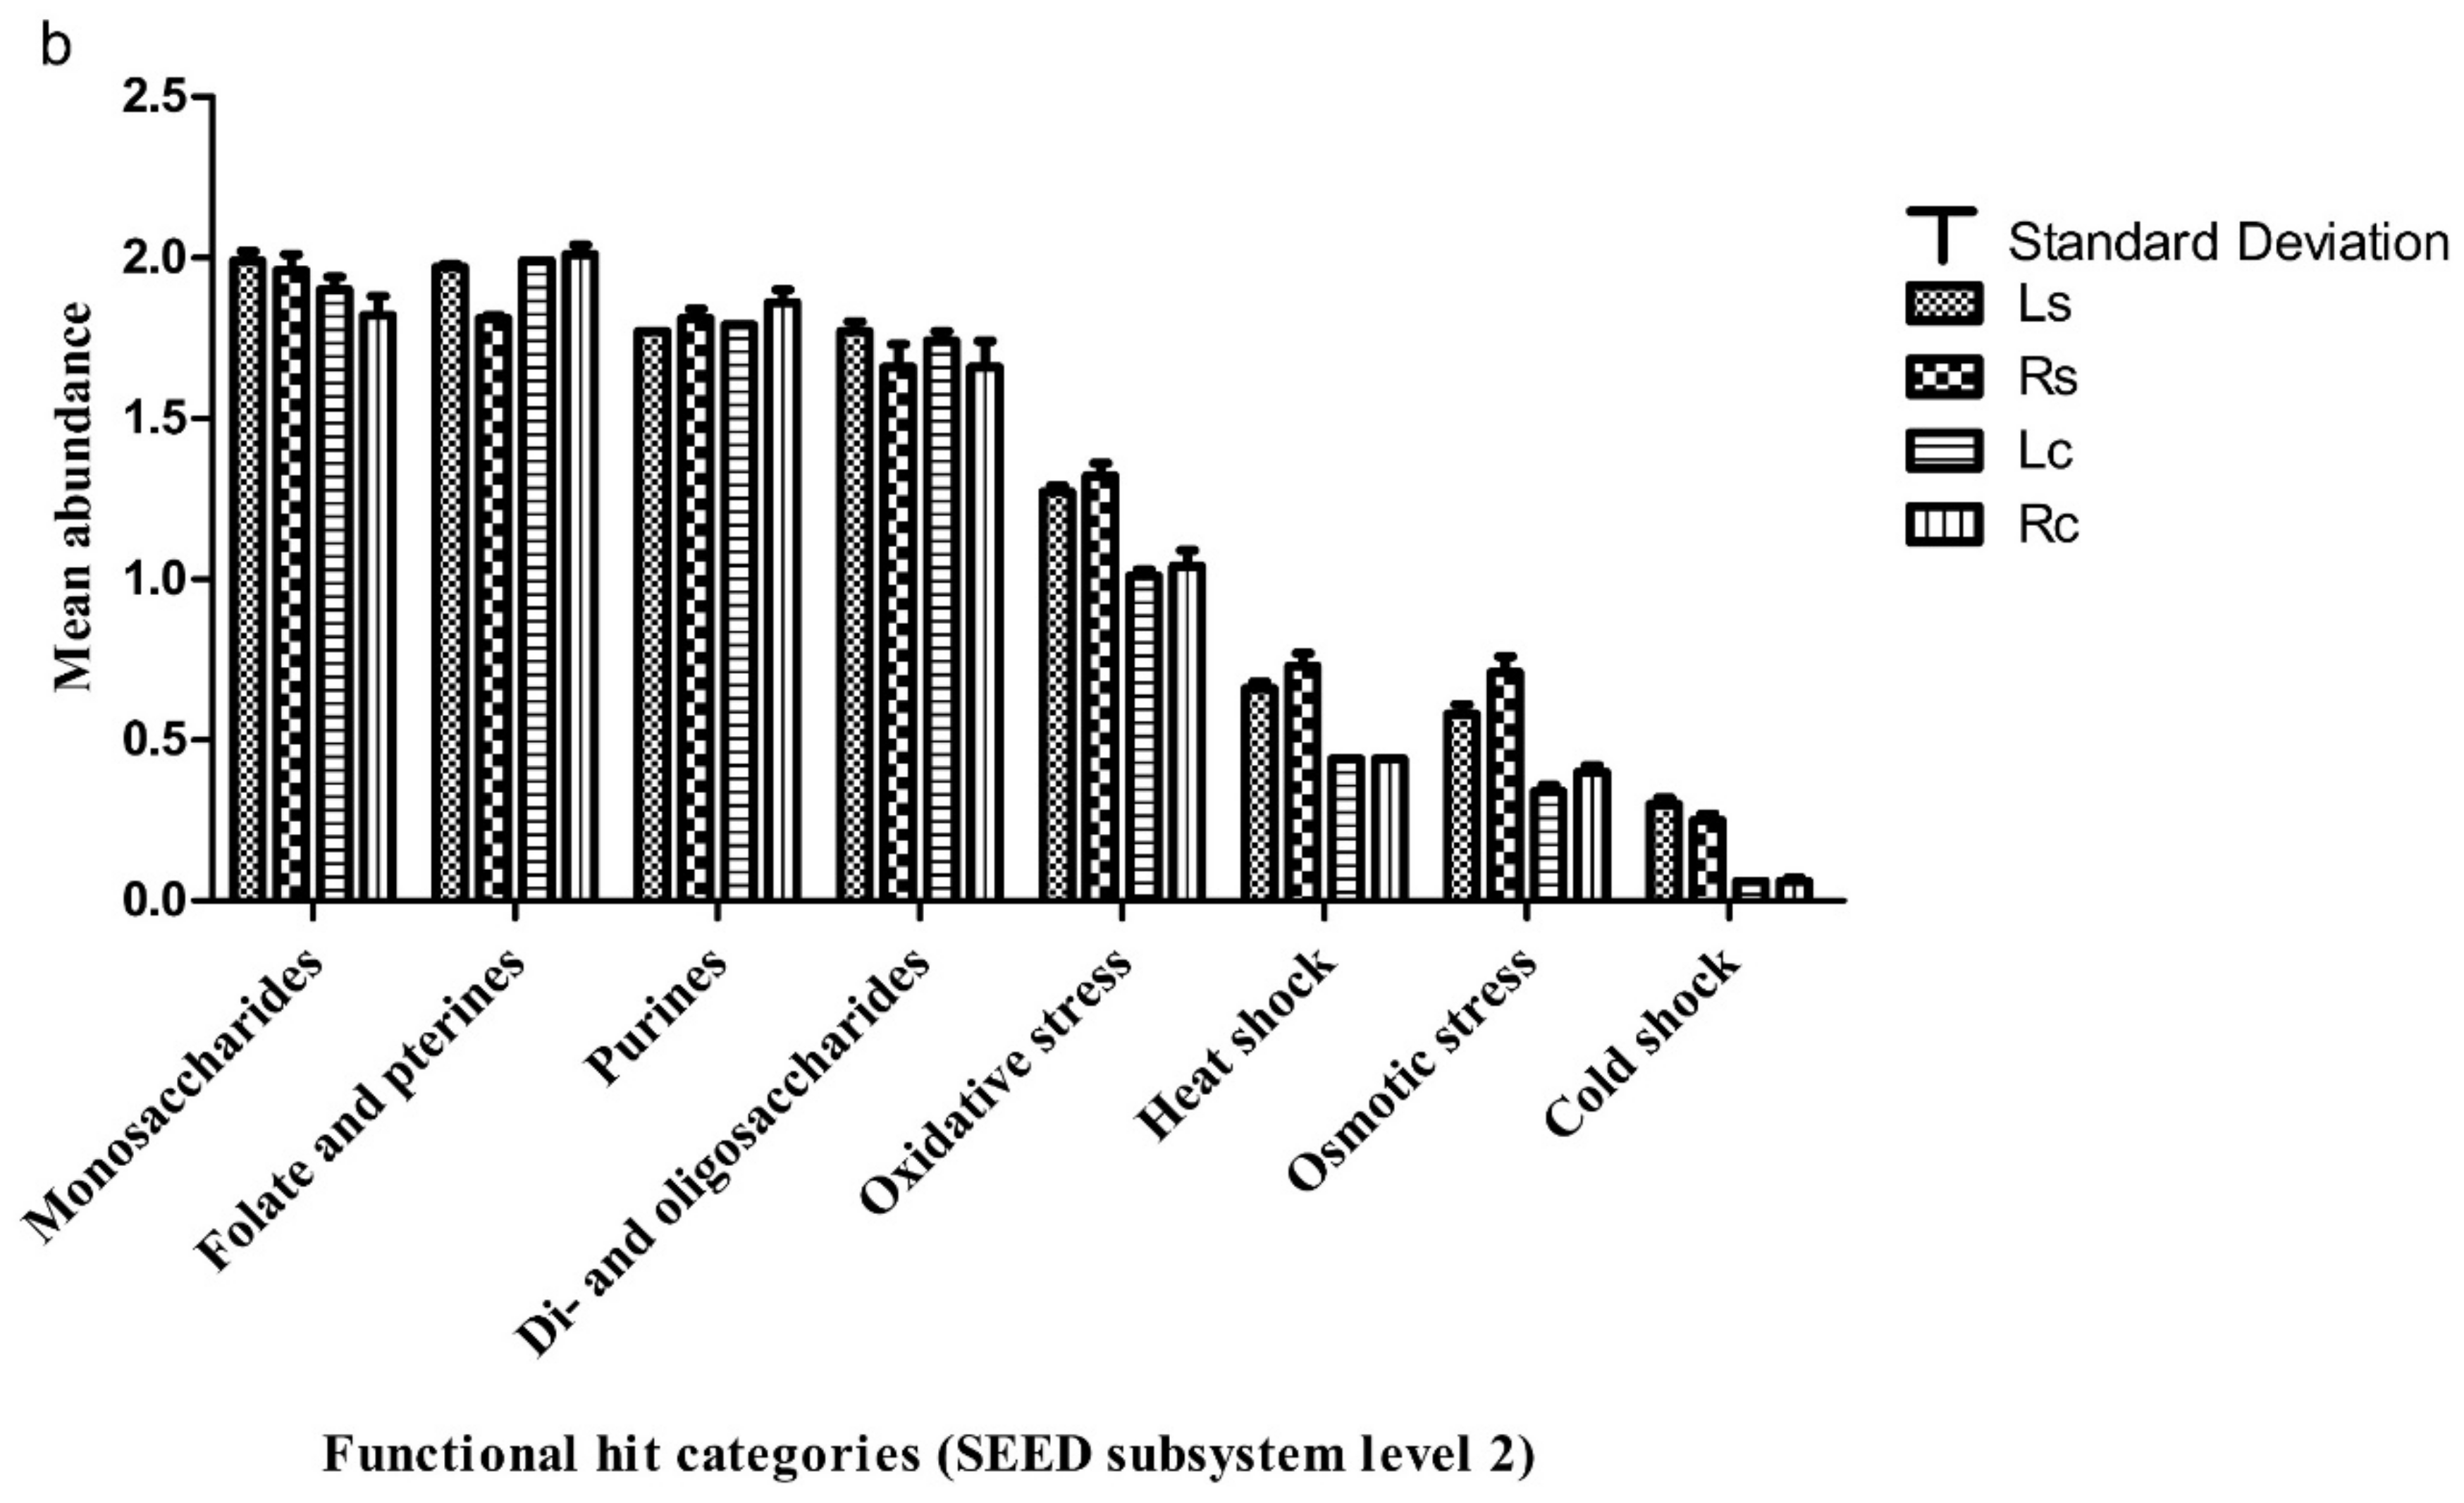
The SEED functional hits level 2 gene annotation showed that the most abundant category across all samples was the unknown functional category. The relative abundance across the samples was Ls (20.66%) and Rs (20.65%) in the maize rhizosphere soils and Lc (20.75%) and Rc (20.90%) in the surrounding samples (Figure 3a,b). The unknown functional category differs across the samples at p-value = 0.03. The relative abundance of functional categories such as oxidative stress, heat shock, and osmotic stress of rhizosphere samples was significantly higher than their controls. In the case of cold shock, the rhizosphere soils were 5 times higher than the surrounding samples. Besides, a highly significant difference (p < 0.0001) was noticed when comparing functional hits (oxidative stress, heat shock, osmotic stress and cold shock) of the rhizosphere soil samples to their controls (Table S2).

3.4. Alpha and Beta Diversity of Assessed Functional Hits across Soil Samples

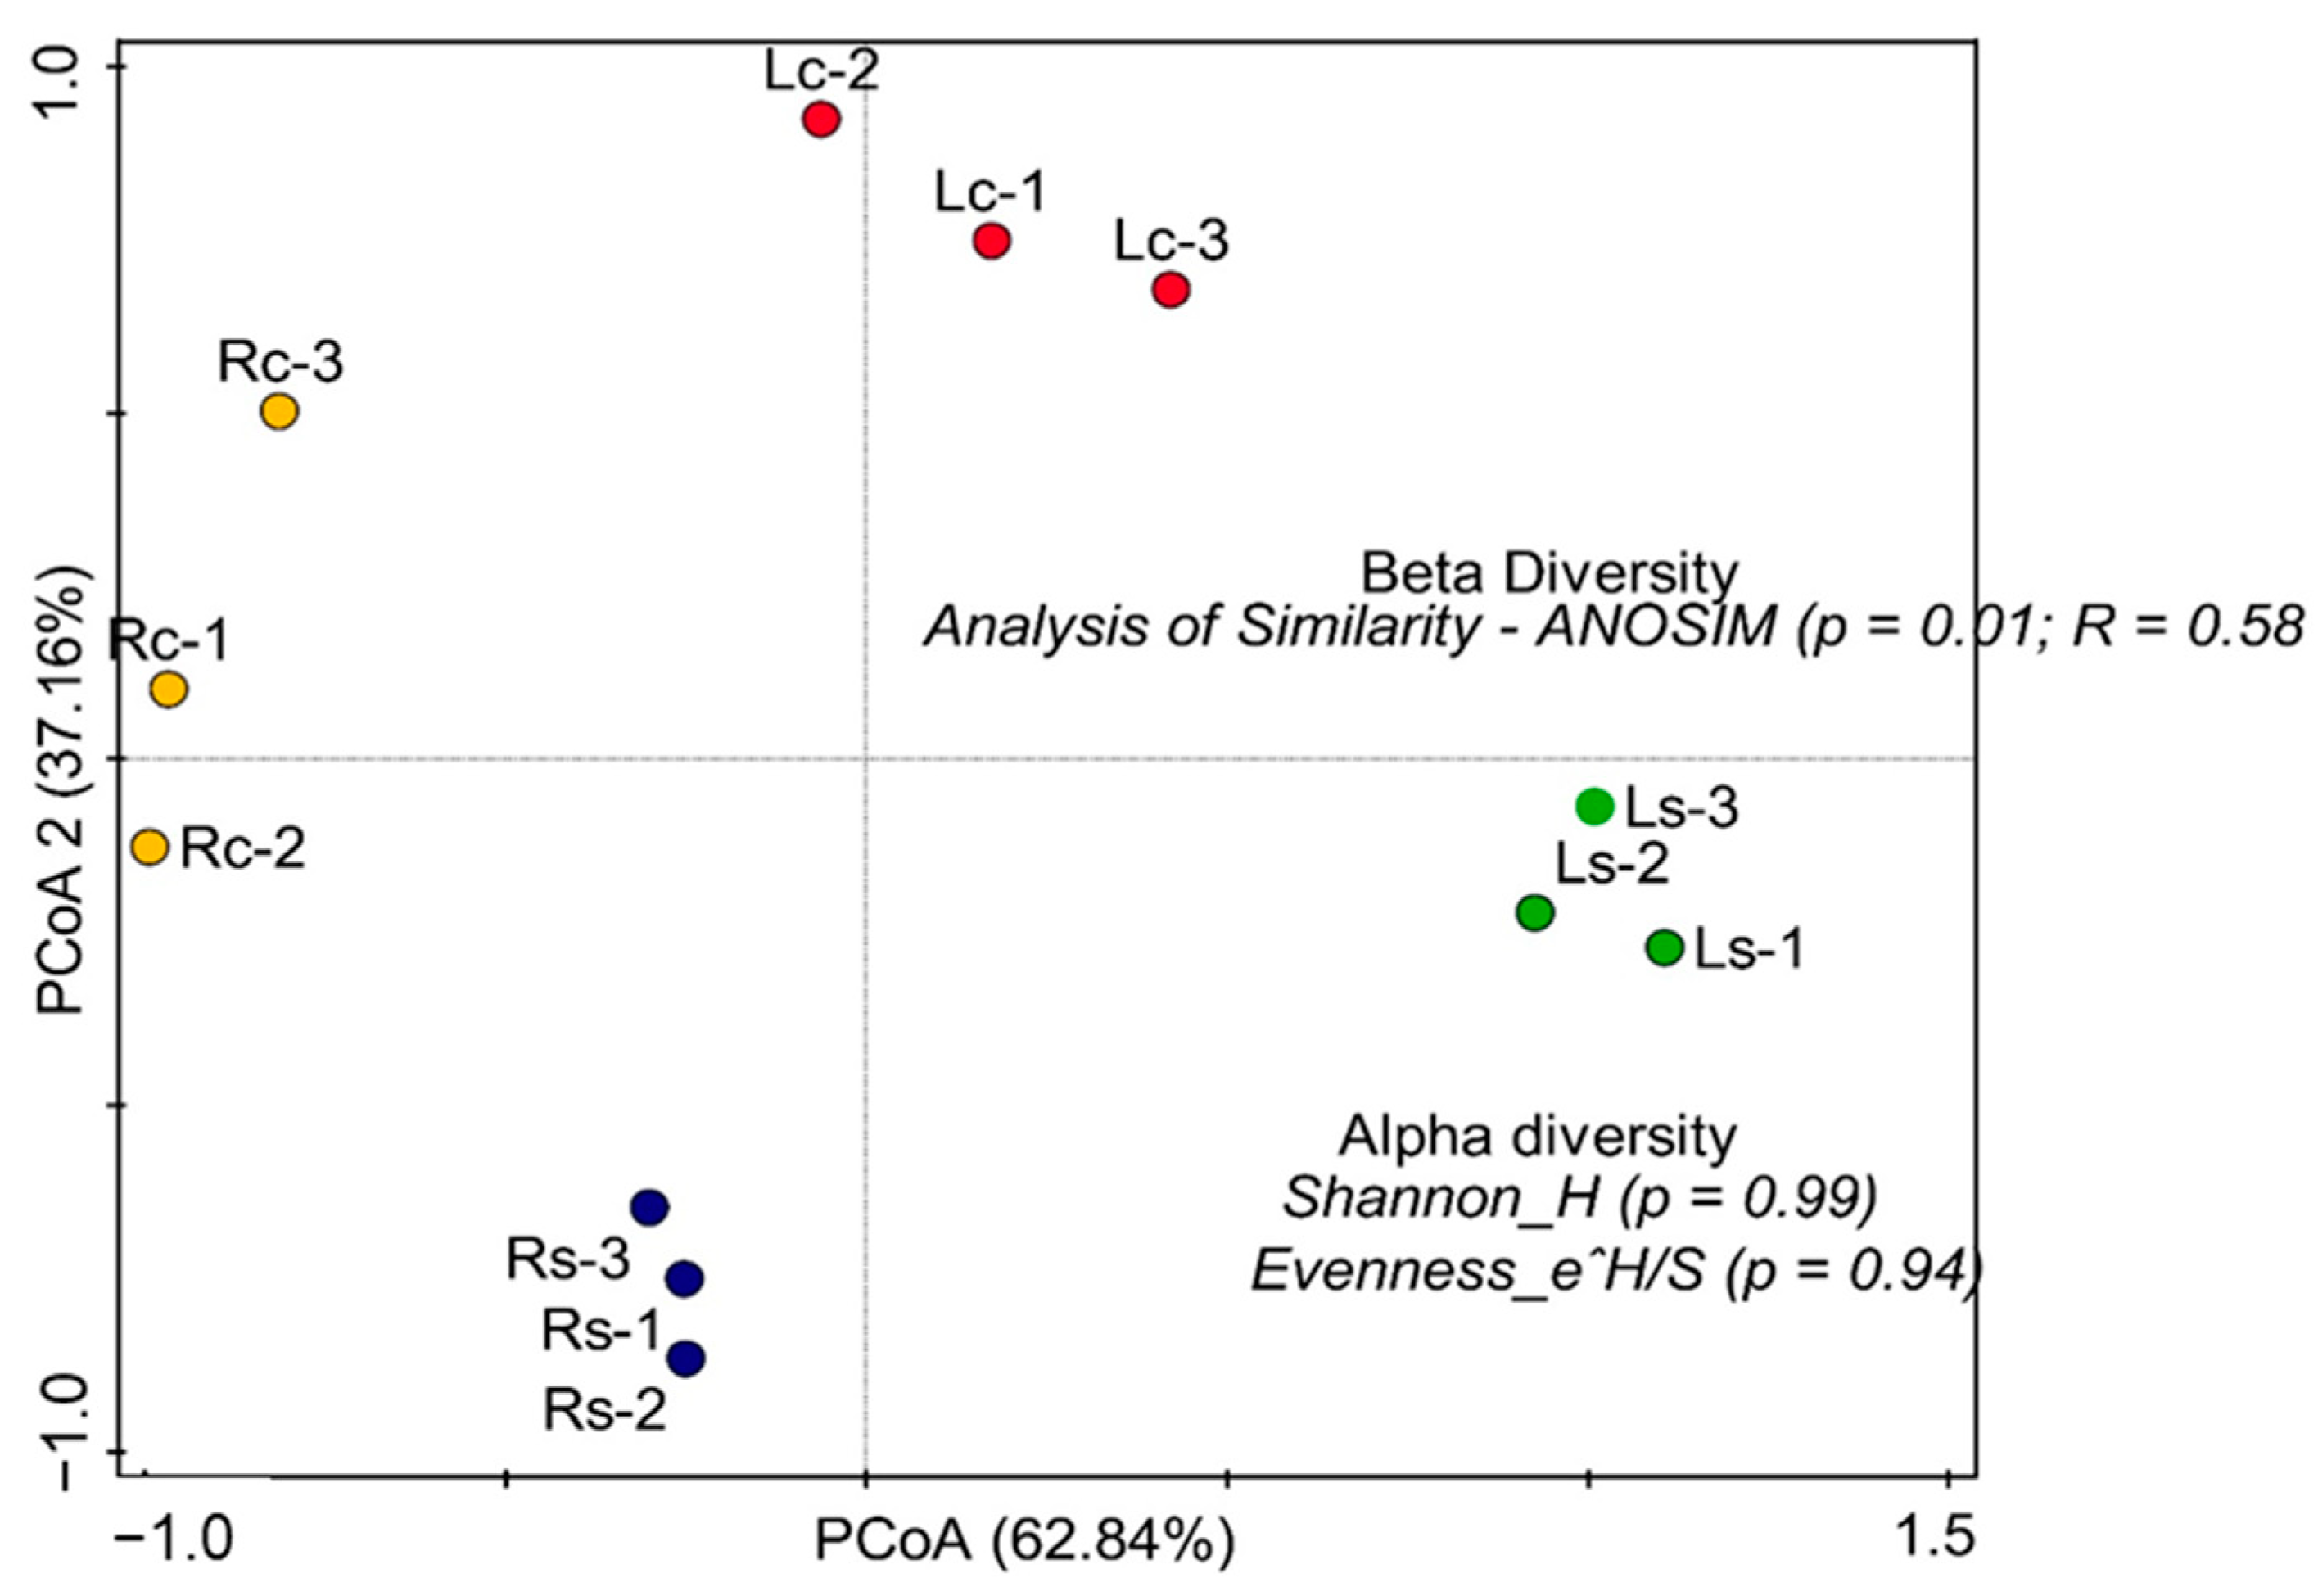
The α and β diversity of assessed functional hits using SEED subsystem (level 1) showed that metabolic functions within the rhizosphere of maize and surrounding soils (i.e., replicates) were not significantly different (p > 0.05) (Figure 4). Within each sample, the Kruskal–Wallis test showed that there was no significant difference in functional categories of each sample and their corresponding controls (i.e., the replicates) at p = 0.99 and 0.94. Furthermore, principal coordinate analysis (PCoA) was used to visualize the similarities and dissimilarities of the relative abundance of functional annotations between samples (Figure 4). The analysis of similarity (ANOSIM) revealed that p = 0.01 and R = 0.58.

3.5. Impact of Environmental Factors on Rhizobiome Functional Categories

The correlation between the analyzed soil chemical parameters and the relative abundances within rhizobiome functional categories was studied using the canonical correspondence analysis (CCA). Using forward selection of environmental variables, the parameters such as N-NO3, sulfate, and pH were significantly selected using the CCA-based test (Figure 5 and Table 3). These variables are the environmental factors that best describe the differences in the soil functional categories. The CCA results revealed that the functional features are dependent on the chemical properties of the soil with CCA permutation = 0.0004. Metabolism of aromatic compounds (MAC), cofactors, vitamins prosthetic groups and pigments (CVPGP), virulence, disease and defense (VDD), motility and chemotaxis (MC), and sulfur metabolism (SM) positively correlated with N-NO3 and negatively correlated with pH and sulfate. The vector length of pH positively correlated with protein metabolism (Prot-M), DNA-metabolism (DNA-M), nitrogen metabolism (NM), and secondary metabolism (Sec-M), while other metabolism viz. potassium metabolism (Pot-M), dormancy and sporulation (DS), fatty acids, lipids and isoprenoids (FALI), stress response (SR), and iron acquisition and metabolism (IAM) positively correlated with sulfate and negatively with N-NO3 and pH as shown in Figure 5.

4. Discussion

Eco-genomics gives a full description of plant-rhizobiome interaction adopting system-level modeling integration. Here, we compared the diverse functional attributes of maize rhizosphere communities with the bulk soils and to verify the influence of soil chemical variables on soil functional features. Environmental variables induce a change in microbial functional traits in the soil. In this analysis, the chemical properties of the samples showed a spatial heterogeneity in most of the used parameters except sulfate, total carbon, and organic matter that were without any significant difference (p ≤ 0.05) between the samples and their controls. Each chemical characteristic orchestrates differences in microbial functional diversity in a plant’s soil [18]. The pH of samples Ls (5.62) and Lc (5.87) was below the normal range (6–7.2) that indicates the balance in the available soil nutrients. However, the pH of the samples Rs (6.76) and Rc (6.73) were within the normal range for measuring the relative H+ and OH concentration of plant’s soil [19]. Soil pH ensures the availability of important soil nutrients such as Cu, Zn, Mn, and Fe. The higher the pH, the lower the soil micronutrient solubility and vice versa. Nevertheless, in both extremes, an imbalance in ionic strength may reduce plant’s growth. Other measured edaphic factors viz. N-NO3 (7–16), K (128–240), and N-NH4 (2.42–4.75) in the study were within the considerable range required for the growth of plants except for phosphorus, which had low values for Ls (50.98) and Lc (65.86) (Table 1). The values deduced from this analysis were similar to the findings of Salam and Obayori [20]. Low nutrient levels in the soil can be attributed to high microbial activities, especially plant soils with high organic matter [21].
The rhizobiome functional genes determine important plant physiological processes. These hits are salient in revealing the soil microbiome structures and what they contribute to the proximal environment. The metabolic pathways have been arranged by the SEED into a hierarchical structure in which the genes performing a specific task are organized into subsystems [22]. The subsystems are comprised of all metabolic functions (anabolic and catabolic) at the highest organizational level, while at the lowest level, the subsystems are in specific pathways. The metagenomic sequence functional categories (α-diversity) of our studies showed that both rhizosphere soils and their controls attained its theoretical limit of 2.81, which reveals that most subsystem hits were identified in all analyzed samples [22]. As expected, only Lichtenburg (Lc) control had lower functional diversity, i.e., miscellaneous and metabolism required for cell wall capsule. To support the view that the plant rhizosphere is nutrient-rich than bulk soil, a study by García-Salamanca et al. [23] showed a significantly higher level of β-glucosidase, alkaline phosphatase, and dehydrogenase activities in the cells of rhizosphere bacteria compared with those isolated from bulk soil. This is because plants alter microbial diversity within the rhizosphere to create a healthy microenvironment for sprouting [24]. Surprisingly, the other control sample collected from Randfontein (Rc) had a significant number of functional hits co-equal to other rhizosphere soils. Because microorganisms inhabiting a plant-free Lc-site are numerous, it is expected to witness a sizable reduction in the functional attributes of the community [23].
Diversity indices are most of the time determined by the richness and evenness, i.e., the relative abundance of metabolic processes involved in a sample. In this analysis, Figure 4 shows the metagenome’s evenness was low (0.94), which implies that only a few metabolisms were dominant in the sampling sites. Invariably, the differences in presiding metabolism imply that the metagenome harbor distinct functional profiles [22].
To verify our hypothesis that each sampling site harbors distinct metabolic profiles, principal component analysis (PCA) was conducted (Figure 2). PCA showed the influence of each metabolic hit on the sampling sites, as indicated by the direction of vectors on the rhizosphere samples and their controls, which explains the distinctiveness of the metabolic profile within the sampling sites. The vector arrows revealed which metabolism best determines the microbial distribution and influence activities within the sampling site. Metabolic functions viz. plant hormones are responsible for the elongation of roots and cell division in plants. Improvement of the aforementioned microbial functioning enhances plant physiological properties such as root elongation that facilitates easy access to water and nutrients in the soil [25].
Additionally, a comprehensive view of Figure 2 and Table S1 shows that functional hits, such as secondary metabolism, amino acid derivatives, fatty acids, lipids and isoprenoids, and nitrogen metabolism placed Rs-maize rhizobiome apart from microbiome found in the rhizosphere of Ls, Lc, and Rc. The high abundance of highlighted metabolic hits in the Rs site revealed that the microbiome associated with the site helps in nutrient acquisition and stress reduction. This assertion is supported by the abundance of microbial classes such as Deltaproteobacteria, Gammaproteobacteria, Bacilli, and Planctomycetacia in the rhizosphere samples (Figure S1). Several studies have reported the tremendous contributions of these microorganisms to the improvement of plant growth [26,27,28]. The metabolic hits involved in Ls site include carbohydrate metabolism, sulfur metabolism, virulence, disease and defense, metabolism of aromatic compounds and motility, and chemotaxis. This inference can also be attributed to the abundance of important plant growth-promoting organisms such as Acidobacteria, Sordariomycetes, Unclassified Thaumarchaeota, Leotiomycetes, and Betaproteobacteria mined from Ls-site (Figure S1). In the control samples, metabolic hits, such as cell division and cell cycle, nitrogen metabolism, nucleosides and nucleotides, photosynthesis, DNA metabolism, miscellaneous, and respiration were actively involved in Rc and Lc sites. The output of this study is synonymous with the finding of Chukwuneme et al. [29] on the functional diversity of maize rhizosphere and bulk soils collected from an intensively cultivated and former grassland in some provinces in South Africa.
The soil microbiota metabolic categories showed no significant difference (p > 0.05) within the sampling area (i.e., the replicates) (Figure 4). The diversity indices of the samples showed that the functional attributes of various fields were within the same range [22,29]. More so, the combined principal coordinate analysis (PCoA—100%) between rhizosphere soils and the controls described community variation (Figure 4) coupled with clear separations (R = 0.58) among samples. The differences were confirmed using analysis of similarity (ANOSIM) with a p-value = 0.01. The clear separation between the sites showed that each sample has distinct metabolic profile as shown by Dinsdale et al. [22] on comparative metagenomics assessment of functional potentials associated with nine biomes. Apart from the highlighted functions similar to both rhizosphere and bulk samples, the rhizosphere samples (Ls and Rs) had functional attributes viz. DNA metabolism, fatty acids, lipids and isoprenoids, photosynthesis, respiration, and stress response in common with p ≥ 0.05. Understanding plant soil metabolic processes are important for easy conservation and manipulation of agroecosystem [30].
The predominant functional categories depend on the soil microbiome activities. Our result showed high functional categories in rhizosphere samples (Figure 1 and Figure 2). This is highly expected because soils with little or no plants harbor more microbes (Figure S1) [23,31]. Meanwhile, the high microbial colonization is a result of the bioavailability of carbon, which serves as the major growth factor required by soil microorganisms [18]. South Africa is a semi-arid area with inconsistent climate conditions leading to low soil fertility and plant productivity [32]. A tremendously high unknown functional category gene coupled with conspicuously high abundances noticed in stress response (oxidative stress, heat shock, osmotic stress and cold stress) (Tables S2 and S3) of rhizosphere soils compared to bulk samples showed that our sampling areas are hotspots for bio-technologically important microorganisms.
We also speculated that the soil pedological properties also drive microbiome functional diversity. To test this hypothesis, a canonical correspondence analysis (CCA) (Figure 5) was used to expatiate on the possible correlation between the two parameters. Here, CCA showed that the metagenome functions depend on the soil’s chemical properties. On axis 1, the vector length of N-NO3 positively correlated with the metabolism of aromatic compounds, cofactors, vitamins, prosthetic groups and pigments, virulence, disease and defense mechanism, motility and chemotaxis, and sulfur metabolism. The vector length of sulfate (axis 2) correlated with potassium metabolism, stress responses, dormancy and sporulation, secondary metabolism, fatty acids, lipids and isoprenoid, and metabolism involved during iron acquisition. Simultaneously, other functions were positively affected by the pH of the soil. The inference deduced from that correspondence analysis showed that both N-NO3 and sulfate were the best predictors of the sample’s metagenome functional categories by contributing 45.5% and 46.4% variations, respectively (Table 3 and Figure 5). It has been confirmed that environmental factors, most particularly those related to chemical properties, drive soil microbiota diversity and structure [33,34]. It is also reported that the indirect influence of pedological soil properties on soil microbiome metabolic activities is unquantifiable [35].

5. Conclusions

To sum up, this study successfully compared the functional features of maize rhizosphere and bulk soils rhizobiome and likewise identified soil edaphic factors as an important predictor of soil functioning. The metagenome study showed that maize rhizosphere and surrounding samples harbored similar microbiome functional categories. The relative abundance of 13 functional hit categories was significantly different between sampling sites. The α-diversity of the functional hits showed no significant difference within the samples, while β-diversity indicated that assessed functional categories differed between the sampling area. We also showed that the pedological parameters such as N-NO3 and sulfate highly influenced the relative abundance of metagenome functional categories in the sampling sites. Besides, the presence of a high relative abundance of functional categories with unknown functions in SEED subsystem level 2 coupled with the enormous functional hits conferring response to soil stressors (oxidative stress, heat shock, osmotic stress, and cold shock) noticed in the rhizosphere samples compared to their controls could highlight the presence of novel genes in our sampling sites. Our study also suggests a need to explore plant growth-promoting traits of microorganisms present in the sites. The discovery of novel organisms (bioinoculants) capable of reducing the menace posed by soil stressors could serve as an alternative to the use of chemical fertilizers and improve the economic value of agricultural products in arid and semi-arid soils. Below are summarized highlights:
  • Differences in the functional attributes were observed in the metagenomics study of maize rhizosphere and bulk soil.
  • The presence of enormous functions conferring response to soil stressors in the rhizosphere samples could highlight the presence of novel organisms with biotechnological importance.
  • Environmental variables viz. N-NO3, sulfate, and pH had great impact on soil rhizobiome functioning.

Supplementary Materials

The following are available online at https://www.mdpi.com/2077-0472/11/2/118/s1, Figure S1: Heatmap of microbial class in maize rhizosphere soils and their surrounding soil samples. The z-score (scale bar) represents the relative abundance of each class, Table S1: Mean percentage of major functional hits in rhizosphere soil of maize and its surrounding soils, Table S2: Mean per-centage of major functional hits in rhizosphere soil of maize and its surrounding soils, Table S3. Mean abundance of major pathways and enzymes involved in the metagenome stress response.

Author Contributions

S.A.A. did the laboratory work, analyzed and interpreted the results with the help of A.S.A., and wrote the first draft of the manuscript. O.O.B. supervised all the listed coauthors, helped shape the research, verified the analytical methods, and edited/commented on the document at all stages. All authors have read and agreed to the published version of the manuscript.

Funding

This research was funded by the National Research Foundation of South Africa (UID123634).

Institutional Review Board Statement

Not applicable.

Informed Consent Statement

Not applicable.

Data Availability Statement

Data is publicly available on NCBI database with bio-project accession-number PRJNA645371 and PRJNA645385 for all the samples and controls.

Acknowledgments

This research was funded by the National Research Foundation (ZA) grant (UID123634) awarded to O.O.B.

Conflicts of Interest

The authors declare no conflict of interest.

References

  1. Enebe, M.C.; Babalola, O.O. The impact of microbes in the orchestration of plants’ resistance to biotic stress: A disease management approach. J. Appl. Microbiol. Biotechnol. 2019, 103, 9–25. [Google Scholar] [CrossRef] [PubMed] [Green Version]
  2. Alawiye, T.T.; Babalola, O.O. Bacterial diversity and community structure in typical plant rhizosphere. Diversity 2019, 11, 179. [Google Scholar] [CrossRef] [Green Version]
  3. Gougoulias, C.; Clark, J.M.; Shaw, L.J. The role of soil microbes in the global carbon cycle: Tracking the below-ground microbial processing of plant-derived carbon for manipulating carbon dynamics in agricultural systems. J. Sci. Food Agric. 2014, 94, 2362–2371. [Google Scholar] [CrossRef] [PubMed]
  4. Mhete, M.; Eze, P.N.; Rahube, T.O.; Akinyemi, F.O. Soil properties influence bacterial abundance and diversity under different land-use regimes in semi-arid environments. J. Sci. Afr. 2020, 7, e00246. [Google Scholar] [CrossRef]
  5. Igiehon, N.O.; Babalola, O.O. Rhizosphere microbiome modulators: Contributions of nitrogen fixing bacteria towards sustainable agriculture. Int. J. Environ. Res. Pub. Health 2018, 15, 574. [Google Scholar] [CrossRef] [Green Version]
  6. Jéan du Plessis, D.D.V.B.; Justinus, M.; Apie, P.; Thinus, P. The Department of Agriculture and Obtainable from Resource Centre Directorate Agricultural Information Services Private Bag X144, Pretoria, 0001; The Department of Agriculture: Pretoria, South Africa, 2003; pp. 1–35.
  7. Gravelet-Blondin, R. Prospectus on the South African Maize Industry; The Maize Trust: Pretoria, South Africa, 2013; Available online: https://sacota.co.za/wp-content/uploads/Prospectus-on-the-South-African-Maize-Industry.pdf (accessed on 15 May 2020).
  8. Wolińska, A.; Kuźniar, A.; Zielenkiewicz, U.; Banach, A.; Izak, D.; Stępniewska, Z.; Błaszczyk, M. Metagenomic analysis of some potential nitrogen-fixing bacteria in arable soils at different formation processes. J. Microb. Ecol. 2017, 73, 162–176. [Google Scholar] [CrossRef] [Green Version]
  9. Zhong, Y.; Hu, J.; Xia, Q.; Zhang, S.; Li, X.; Pan, X.; Zhao, R.; Wang, R.; Yan, W.; Shangguan, Z. Soil microbial mechanisms promoting ultrahigh rice yield. J. Soil Biol. Biochem. 2020, 143, 107741. [Google Scholar] [CrossRef]
  10. Olsen, S.; Sommers, L. Phosphorus. In Methods of Soil Analysis Part 2; Page, A.L., Miller, R.H., Keneey, D.R., Eds.; American Society of Agronomy: Madison, WI, USA, 1982; pp. 403–430. [Google Scholar]
  11. Walkley, A.; Black, I.A. An examination of the Degtjareff method for determining soil organic matter, and a proposed modification of the chromic acid titration method. J. Soil Sci. 1934, 37, 29–38. [Google Scholar] [CrossRef]
  12. Deke, A.L.; Adugna, W.T.; Fite, A.T. Soil physico-chemical properties in termite mounds and adjacent control soil in Miyo and Yabello Districts of Borana Zone, Southern Ethiopia. Am. J. Agric. For. 2016, 4, 69. [Google Scholar]
  13. Shi, J.-Y.; Yuan, X.-F.; Lin, H.-R.; Yang, Y.-Q.; Li, Z.-Y. Differences in soil properties and bacterial communities between the rhizosphere and bulk soil and among different production areas of the medicinal plant Fritillaria thunbergii. Int. J. Mol. Sci. 2011, 12, 3770–3785. [Google Scholar] [CrossRef]
  14. Meyer, F.; Paarmann, D.; D’Souza, M.; Olson, R.; Glass, E.M.; Kubal, M.; Paczian, T.; Rodriguez, A.; Stevens, R.; Wilke, A. The metagenomics RAST server—A public resource for the automatic phylogenetic and functional analysis of metagenomes. BMC Bioinform. 2008, 9, 386. [Google Scholar] [CrossRef] [Green Version]
  15. Kent, W.J. BLAT—the BLAST-like alignment tool. Genome Res. 2002, 12, 656–664. [Google Scholar] [CrossRef] [PubMed] [Green Version]
  16. Wilke, A.; Harrison, T.; Wilkening, J.; Field, D.; Glass, E.M.; Kyrpides, N.; Mavrommatis, K.; Meyer, F. The M5nr: A novel non-redundant database containing protein sequences and annotations from multiple sources and associated tools. J. BMC Bioinform. 2012, 13, 141. [Google Scholar] [CrossRef] [Green Version]
  17. Hammer, Ø.; Harper, D.A.; Ryan, P.D. PAST: Paleontological statistics software package for education and data analysis. J. Palaeontol. Electron. 2001, 4, 9. [Google Scholar]
  18. Amoo, A.E.; Babalola, O.O. Impact of land use on bacterial diversity and community structure in temperate pine and indigenous forest soils. Diversity 2019, 11, 217. [Google Scholar] [CrossRef] [Green Version]
  19. Tale, K.S.; Ingole, S. A review on role of physico-chemical properties in soil quality. J. Chem. Sci. Rev. Lett. 2015, 4, 57–66. [Google Scholar]
  20. Salam, L.B.; Obayori, O.S. Structural and functional metagenomic analyses of a tropical agricultural soil. Span. J. Soil Sci. 2019, 9. [Google Scholar] [CrossRef]
  21. Salam, L.B.; Obayori, S.O.; Nwaokorie, F.O.; Suleiman, A.; Mustapha, R. Metagenomic insights into effects of spent engine oil perturbation on the microbial community composition and function in a tropical agricultural soil. J. Environ. Sci. Pollut. Res. 2017, 24, 7139–7159. [Google Scholar] [CrossRef]
  22. Dinsdale, E.A.; Edwards, R.A.; Hall, D.; Angly, F.; Breitbart, M.; Brulc, J.M.; Furlan, M.; Desnues, C.; Haynes, M.; Li, L. Functional metagenomic profiling of nine biomes. Nature 2008, 452, 629–632. [Google Scholar] [CrossRef]
  23. García-Salamanca, A.; Molina-Henares, M.A.; van Dillewijn, P.; Solano, J.; Pizarro-Tobías, P.; Roca, A.; Duque, E.; Ramos, J.L. Bacterial diversity in the rhizosphere of maize and the surrounding carbonate-rich bulk soil. Microb. Biotechnol. 2013, 6, 36–44. [Google Scholar] [CrossRef]
  24. Uroz, S.; Buée, M.; Murat, C.; Frey-Klett, P.; Martin, F. Pyrosequencing reveals a contrasted bacterial diversity between oak rhizosphere and surrounding soil. Environ. Microbiol. Rep. 2010, 2, 281–288. [Google Scholar] [CrossRef] [PubMed]
  25. Chukwuneme, C.F.; Babalola, O.O.; Kutu, F.R.; Ojuederie, O.B. Characterization of actinomycetes isolates for plant growth promoting traits and their effects on drought tolerance in maize. J. Plant Interact. 2020, 15, 93–105. [Google Scholar] [CrossRef]
  26. Kumar, P.; Dubey, R.; Maheshwari, D. Bacillus strains isolated from rhizosphere showed plant growth promoting and antagonistic activity against phytopathogens. Microbiol. Res. 2012, 167, 493–499. [Google Scholar] [CrossRef]
  27. Madhaiyan, M.; Saravanan, V.S.; Blom, J.; Smits, T.H.; Rezzonico, F.; Kim, S.J.; Weon, H.Y.; Kwon, S.W.; Whitman, W.B.; Ji, L. Phytobacter palmae sp. nov., a novel endophytic, N2 fixing, plant growth promoting Gammaproteobacterium isolated from oil palm (Elaeis guineensis Jacq.). Int. J. Syst. Evol. Microbiol. 2020, 70, 841–848. [Google Scholar] [CrossRef] [PubMed]
  28. Krishnan, R.; Lang, E.; Midha, S.; Patil, P.B.; Rameshkumar, N. Isolation and characterization of a novel 1-aminocyclopropane-1-carboxylate (ACC) deaminase producing plant growth promoting marine Gammaproteobacteria from crops grown in brackish environments. Proposal for Pokkaliibacter plantistimulans gen. nov., sp. nov., Balneatrichaceae fam. nov. in the order Oceanospirillales and an emended description of the genus Balneatrix. Syst. Appl. Microbiol. 2018, 41, 570–580. [Google Scholar]
  29. Chukwuneme, C.F.; Ayangbenro, A.S.; Babalola, O.O. Functional diversity of microbial communities in two contrasting maize rhizosphere soils. Rhizosphere 2020, 17, 100282. [Google Scholar] [CrossRef]
  30. Akinola, S.A.; Babalola, O.O. The importance of adverse soil microbiomes in the light of omics: Implications for food safety. Plant. Soil Environ. 2020, 66, 421–430. [Google Scholar] [CrossRef]
  31. Fan, K.; Weisenhorn, P.; Gilbert, J.A.; Chu, H. Wheat rhizosphere harbors a less complex and more stable microbial co-occurrence pattern than bulk soil. Soil Biol. Biochem. 2018, 125, 251–260. [Google Scholar] [CrossRef]
  32. Nkuekam, G.K.; Cowan, D.A.; Valverde, A. Arable agriculture changes soil microbial communities in the South African Grassland Biome. S. Afr. J. Sci. 2018, 114, 1–7. [Google Scholar] [CrossRef]
  33. Fierer, N. Embracing the unknown: Disentangling the complexities of the soil microbiome. Nat. Rev. Microbiol. 2017, 15, 579–590. [Google Scholar] [CrossRef]
  34. Bickford, W.A.; Zak, D.R.; Kowalski, K.P.; Goldberg, D.E. Differences in rhizosphere microbial communities between native and non-native Phragmites australis may depend on stand density. Ecol. Evol. 2020, 10, 11739–11751. [Google Scholar] [CrossRef] [PubMed]
  35. Arroyo, P.; de Miera, L.E.S.; Ansola, G. Influence of environmental variables on the structure and composition of soil bacterial communities in natural and constructed wetlands. J. Sci. Total Environ. 2015, 506, 380–390. [Google Scholar] [CrossRef] [PubMed]
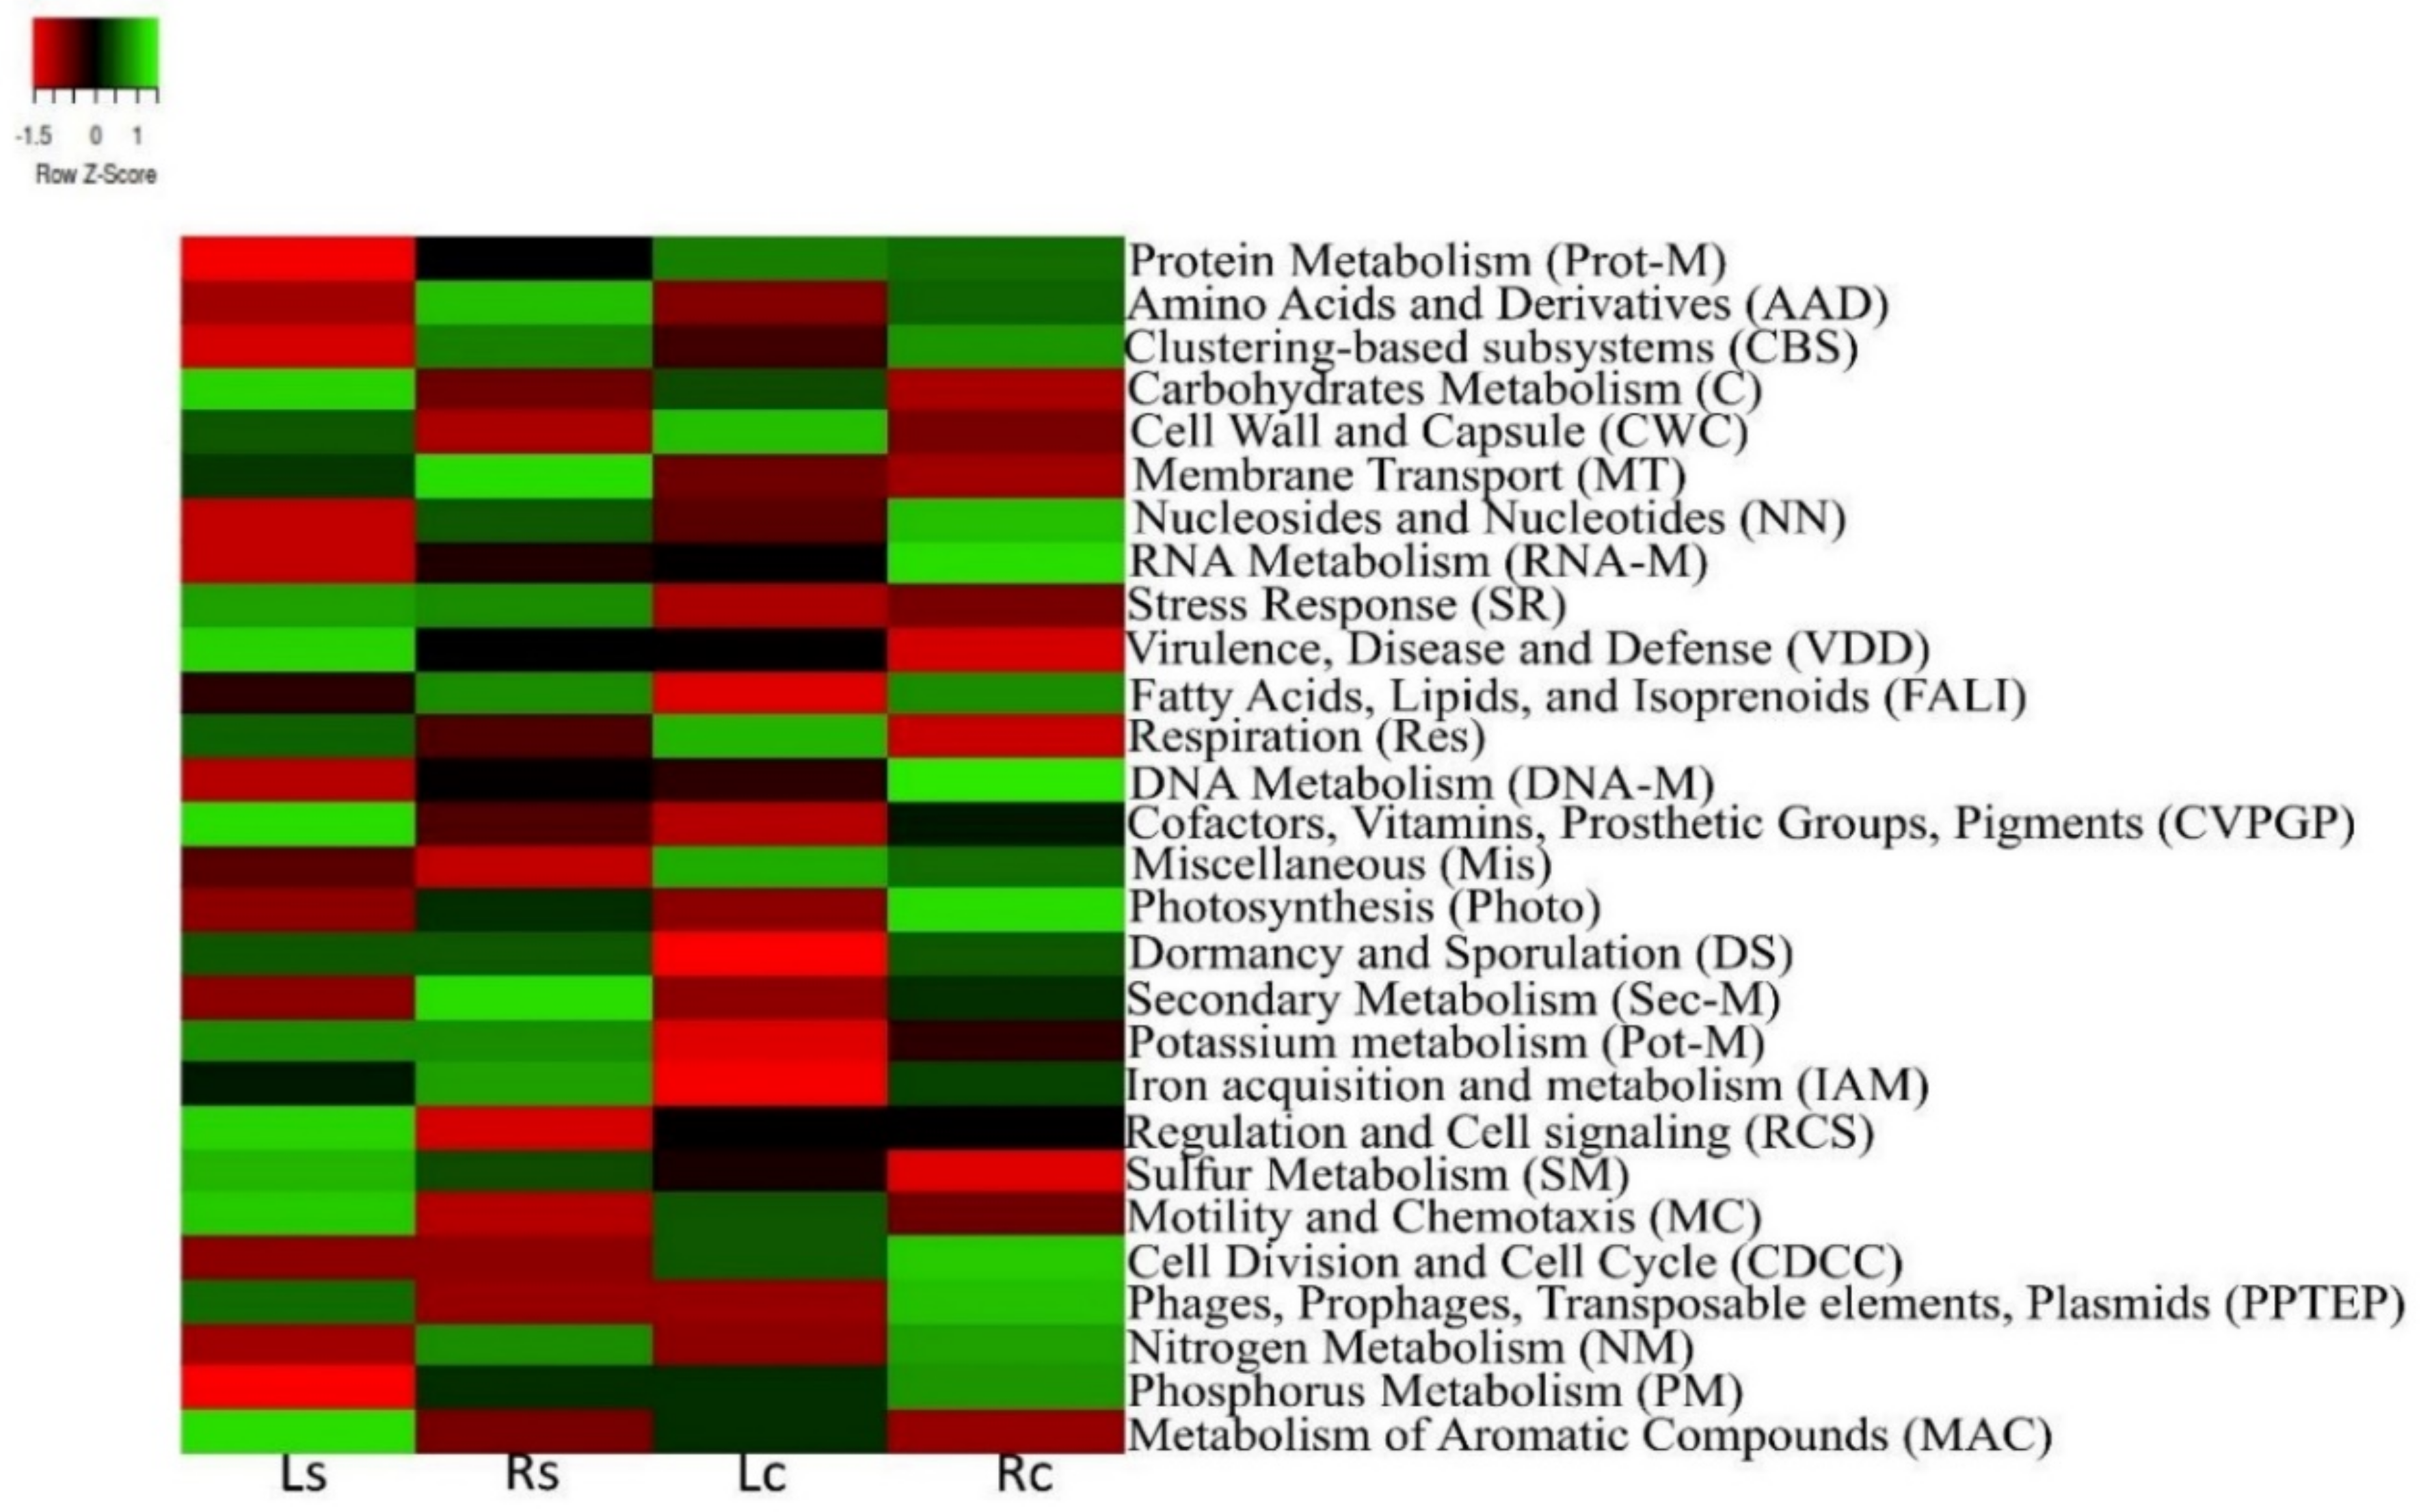
Figure 1. The major metabolic hits in maize rhizosphere soils and their bulk samples. The z-score (scale bar) represents the color saturation gradient based on the relative abundance of functional hits in subsystem level 1 (MG-RAST) of three replicates deduced from the maize rhizosphere (Ls and Rs) and bulk (Lc and Rc) soils. All statistical analyses, including mean values and analysis of variance (ANOVA) were done using GraphPad Prism (v5.0) as shown in Table S1.
Agriculture 11 00118 g001
Figure 2. Principal component analysis (PCA) of the functional hits (subsystem 1) of maize rhizosphere and the surrounding soil. Replicate samples from the sampling sites were denoted using different colors. Ls-1–3 (replicates of rhizosphere samples collected from Lichtenburg maize farm), Rs-1–3 (replicates of rhizosphere samples collected from Randfontein maize farm), Lc-1–3 (replicates of bulk soil samples collected from Lichtenburg maize farm), and Rc-1–3 (replicates of bulk soil samples collected from Randfontein maize farm). The length of vectors shows the strength of the influence of metabolic processes (e.g., Stress response-SR, fatty acids, lipids, and isoprenoids-FALI and iron acquisition, and metabolism-IAM had the most influence on Rs-1–3; respiration (Res), sulfur metabolism (SM), and metabolism of aromatic compounds (MAC) had the most influence on Ls-1–3; miscellaneous (mis), cell wall and capsule (CWC), and cell division and cell cycle (CDCC) were most effective on Lc-1–3 while protein metabolism (Prot-M), DNA-metabolism (DNA-M), and nitrogen metabolism (NM) had most influence on Rc-1–3). Axis 1 and 2 explained 58.41 and 37.74% variation, respectively.
Agriculture 11 00118 g002
Figure 3. (a,b) Mean relative abundance of functional hits in subsystem level 2. Data represent mean relative abundance and standard deviation (T) of functional hits (SEED subsystem 2) of three replicates deduced from maize rhizosphere (Ls and Rs) and bulk (Lc and Rc) soils. All statistical analyses, including mean values and analysis of variance (ANOVA) were done using GraphPad Prism (v5.0) as shown in Table S2. Most importantly, functional features attributed to stress responses (oxidative, heat, osmotic, and cold shock responses) were conspicuously higher (p < 0.05) in the rhizosphere samples compared to the surrounding soils.
Agriculture 11 00118 g003aAgriculture 11 00118 g003b
Figure 4. Similarity measure to compare functional categories obtained from sample sites using Principal Coordinate Analysis (PCoA). Using the Kruskal–Wallis one-way analysis of variance, Shannon and Pielou evenness indices (Alpha diversity) showed no significant difference within the replicates of each sample (p = 0.99; 0.94). Beta diversity using Analysis of Similarity (ANOSIM) depicts differences between the sampling sites (p = 0.01; R = 0.58). The result showed no significant difference within the functional attributes of the replicates in each sample, while Beta diversity revealed a wide difference between the samples and their controls at p < 0.05. Ls-1–3 (replicates of rhizosphere samples collected from Lichtenburg maize farm), Rs-1–3 (replicates of rhizosphere samples collected from Randfontein maize farm), Lc-1–3 (replicates of bulk samples collected from Lichtenburg maize farm), and Rc-1–3 (replicates of bulk samples collected from Randfontein maize farm).
Agriculture 11 00118 g004
Figure 5. Canonical correspondence analysis (CCA) showing the relationship between major soil chemical parameters and functional categories of the samples. Based on the CANOCO adviser, N-NO3, sulfate and pH were selected as major factors influencing soil functional hit categories. The contribution of each variable has been explained in Table 3.
Agriculture 11 00118 g005
Table 1. Mean values of chemical properties of maize rhizosphere and surrounding soils.
Sample Locations →LsRsLcRcp-Value
Physicochemical parameterspH (H2O)5.62 ± 0.09 a6.76 ± 0.28 b5.87 ± 0.22 a6.73 ± 0.26 b<0.000
P (mgkg−1)50.98 ± 1.77 a257.14 ± 35.32 b65.86 ± 13.71 a206.54 ± 81.73 b0.001
K (mgkg−1)240.00 ± 2.94 a167.00 ± 11.63 b243.00 ± 0.82 a148.50 ± 34.95 b<0.000
Sulfate (mgkg−1)1.60 ± 1.68 a2.56 ± 2.66 a0.44 ± 0.36 a2.32 ± 2.75 a0.623
Total C (%)0.90 ± 0.05 a1.34 ± 0.24 a0.90 ± 0.01 a0.85 ± 0.50 a0.187
Org C (%)0.61 ± 0.02 a1.09 ± 0.09 b0.60 ± 0.01 a0.87 ± 0.15 c<0.000
Org M (%)3.40 ± 0.16 a3.43 ± 0.39 a3.25 ± 0.03 a2.95 ± 0.85 a0.609
N-NO3(mgkg−1)16.29 ± 2.25 a8.52 ± 2.68 b16.24 ± 0.59 a7.38 ± 2.46 b0.001
N-NH4 (mgkg−1)3.61 ± 0.29 a,b2.91 ± 1.12 a2.42 ± 0.19 a4.75 ± 1.21 b0.044
Each value is expressed as mean ± standard deviation of chemical properties deduced from the maize rhizosphere (Ls and Rs) and bulk (Lc and Rc) soils. All statistical analyses, including mean values and analysis of variance (ANOVA) were done using GraphPad Prism (v5.0). Mean bearing different superscripts <a,b> within each row indicate significant differences at p ≤ 0.05. p values given across the rows were used to compare chemical properties of the sampling sites.
Table 2. Raw sequence and quality-filtered data based on metagenomics rapid annotations using subsystems technology.
Sample SitesLsRsLcRc
Uploaded Information
bp Count2,863,587,2722,237,924,0062,269,959,3372,113,440,642
Sequences Count19,276,11814,928,20114,988,81814,053,905
Mean sequence length (bp)149 ± 51150 ± 48152 ± 47151 ± 48
Mean G + C content (%)64 ± 1165 ± 1165 ± 1065 ± 11
Post Quality Control Information
bp count2,687,455,3682,115,280,8332,147,410,5211,994,176,095
Sequence count17,596,17713,823,19213,925,53713,006,005
Mean sequence length (bp)153 ± 47154 ± 45154 ± 44154 ± 45
Mean G + C content (%)65 ± 965 ± 965 ± 965 ± 9
Processed Sequences
Predicted protein features15,344,91712,427,66412,428,89111,695,150
Predicted rRNA features35,94531,59427,29227,927
Aligned Sequences
Identified protein features5,959,3954,732,5044,654,9964,507,871
Identified rRNA features8225712963477240
Table 3. The disparity in functional hit categories within samples best explained using a forward preference of environmental variables.
Environmental VariableContribution%Pseudo-Fp
N-NO345.51.70.65
Sulfate46.45.70.53
pH8.1<0.11.00
Keys: N-NO3, sulfate and pH—most important environmental variables selected using CANOCO that determines the contribution of each variable to the variation in the functional attributes of the sampling sites. N-NO3 contributed 45.5% variation, sulfate contributed 46.4% variation, while pH contributed 8.1% variation in the functional attributes of the sampling sites.
Publisher’s Note: MDPI stays neutral with regard to jurisdictional claims in published maps and institutional affiliations.