
State of the Art of Monitoring Technologies and Data Processing for Precision Viticulture


Abstract
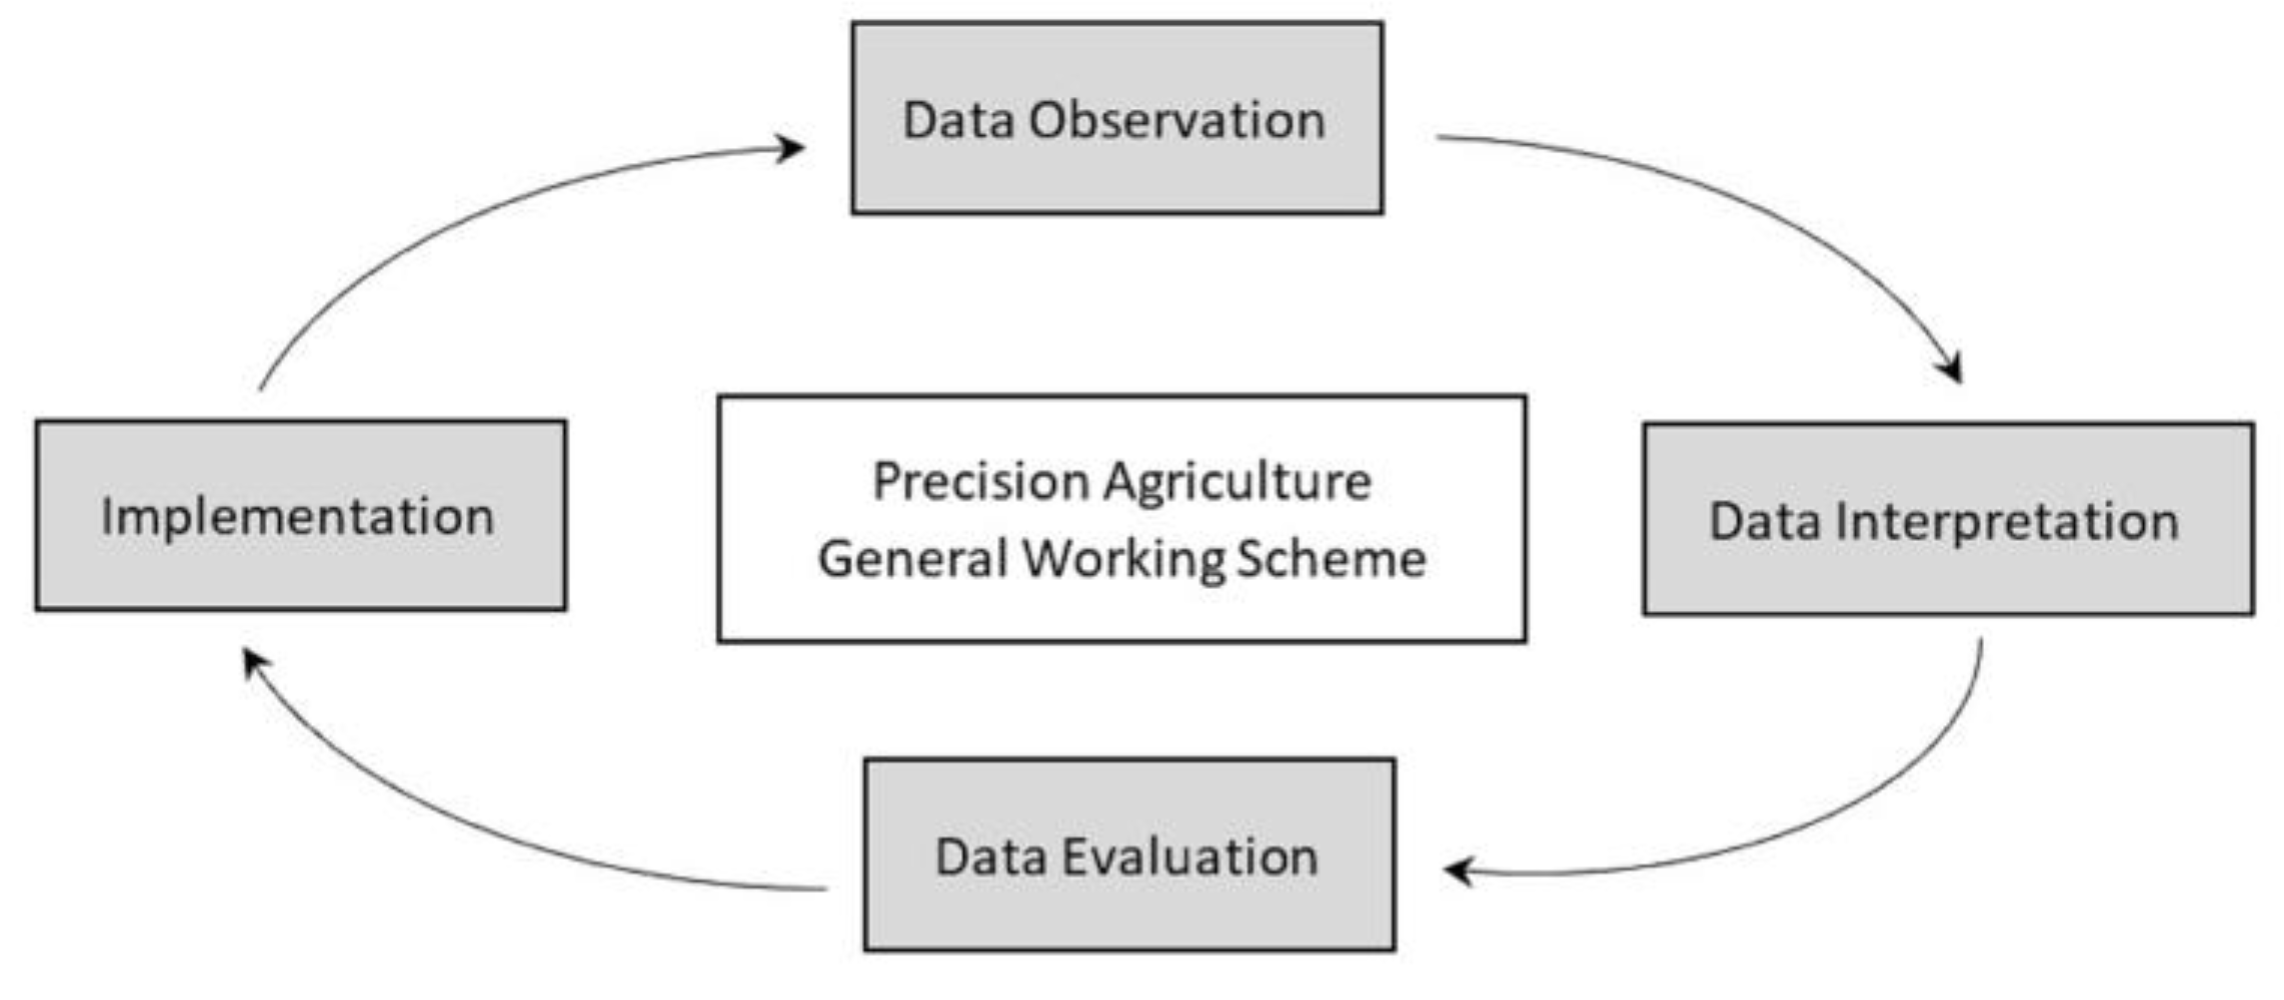
:1. Introduction
- Maximization of yields;
- Identification of plant stress;
- Constant monitoring of crops with the possibility to implement targeted actions;
- Reduction of intra-field variability;
- Reduction of costs and time of agricultural operations;
- Lower the environmental impact of agricultural operations;
- Optimization of the use of fertilizers, pesticides and water;
- Increase of products quality.
- quantification and evaluation of intra-field variability;
- delimitation of differential treatment areas at parcel level, based on the analysis and interpretation of this variability;
- development of variable rate technologies (VRT);
- evaluation of opportunities for site-specific vineyard management.
2. Story
- the availability of accurate and cheap global navigation satellite systems (GNSS);
- the development of GIS software to visualize/analyze spatial and geographical data;
- the growing availability of georeferenced information acquired remotely;
- the development of variable rate technologies (VRT).
3. Monitoring Systems
3.1. Remote Sensing
3.1.1. Satellites
3.1.2. Aircrafts
3.1.3. UAV
3.2. Proximal Sensing
3.2.1. Canopy
Radiometric Sensors
- the survey time is much higher as all the vineyards rows have to be passed through;
- the total monitoring cost is higher, due to the higher survey time;
- the data collected are tabular (GPS coordinates and corresponding NDVI values) so that they have to be converted in a map in the post-processing by interpolating the point values, which are usually collected every 30–50 cm along the vine rows and often every two rows;
- the final NDVI map is less precise as it results from an interpolation of sparse points collected along the rows.
Fluorometers
VitiCanopy
3.2.2. Soil
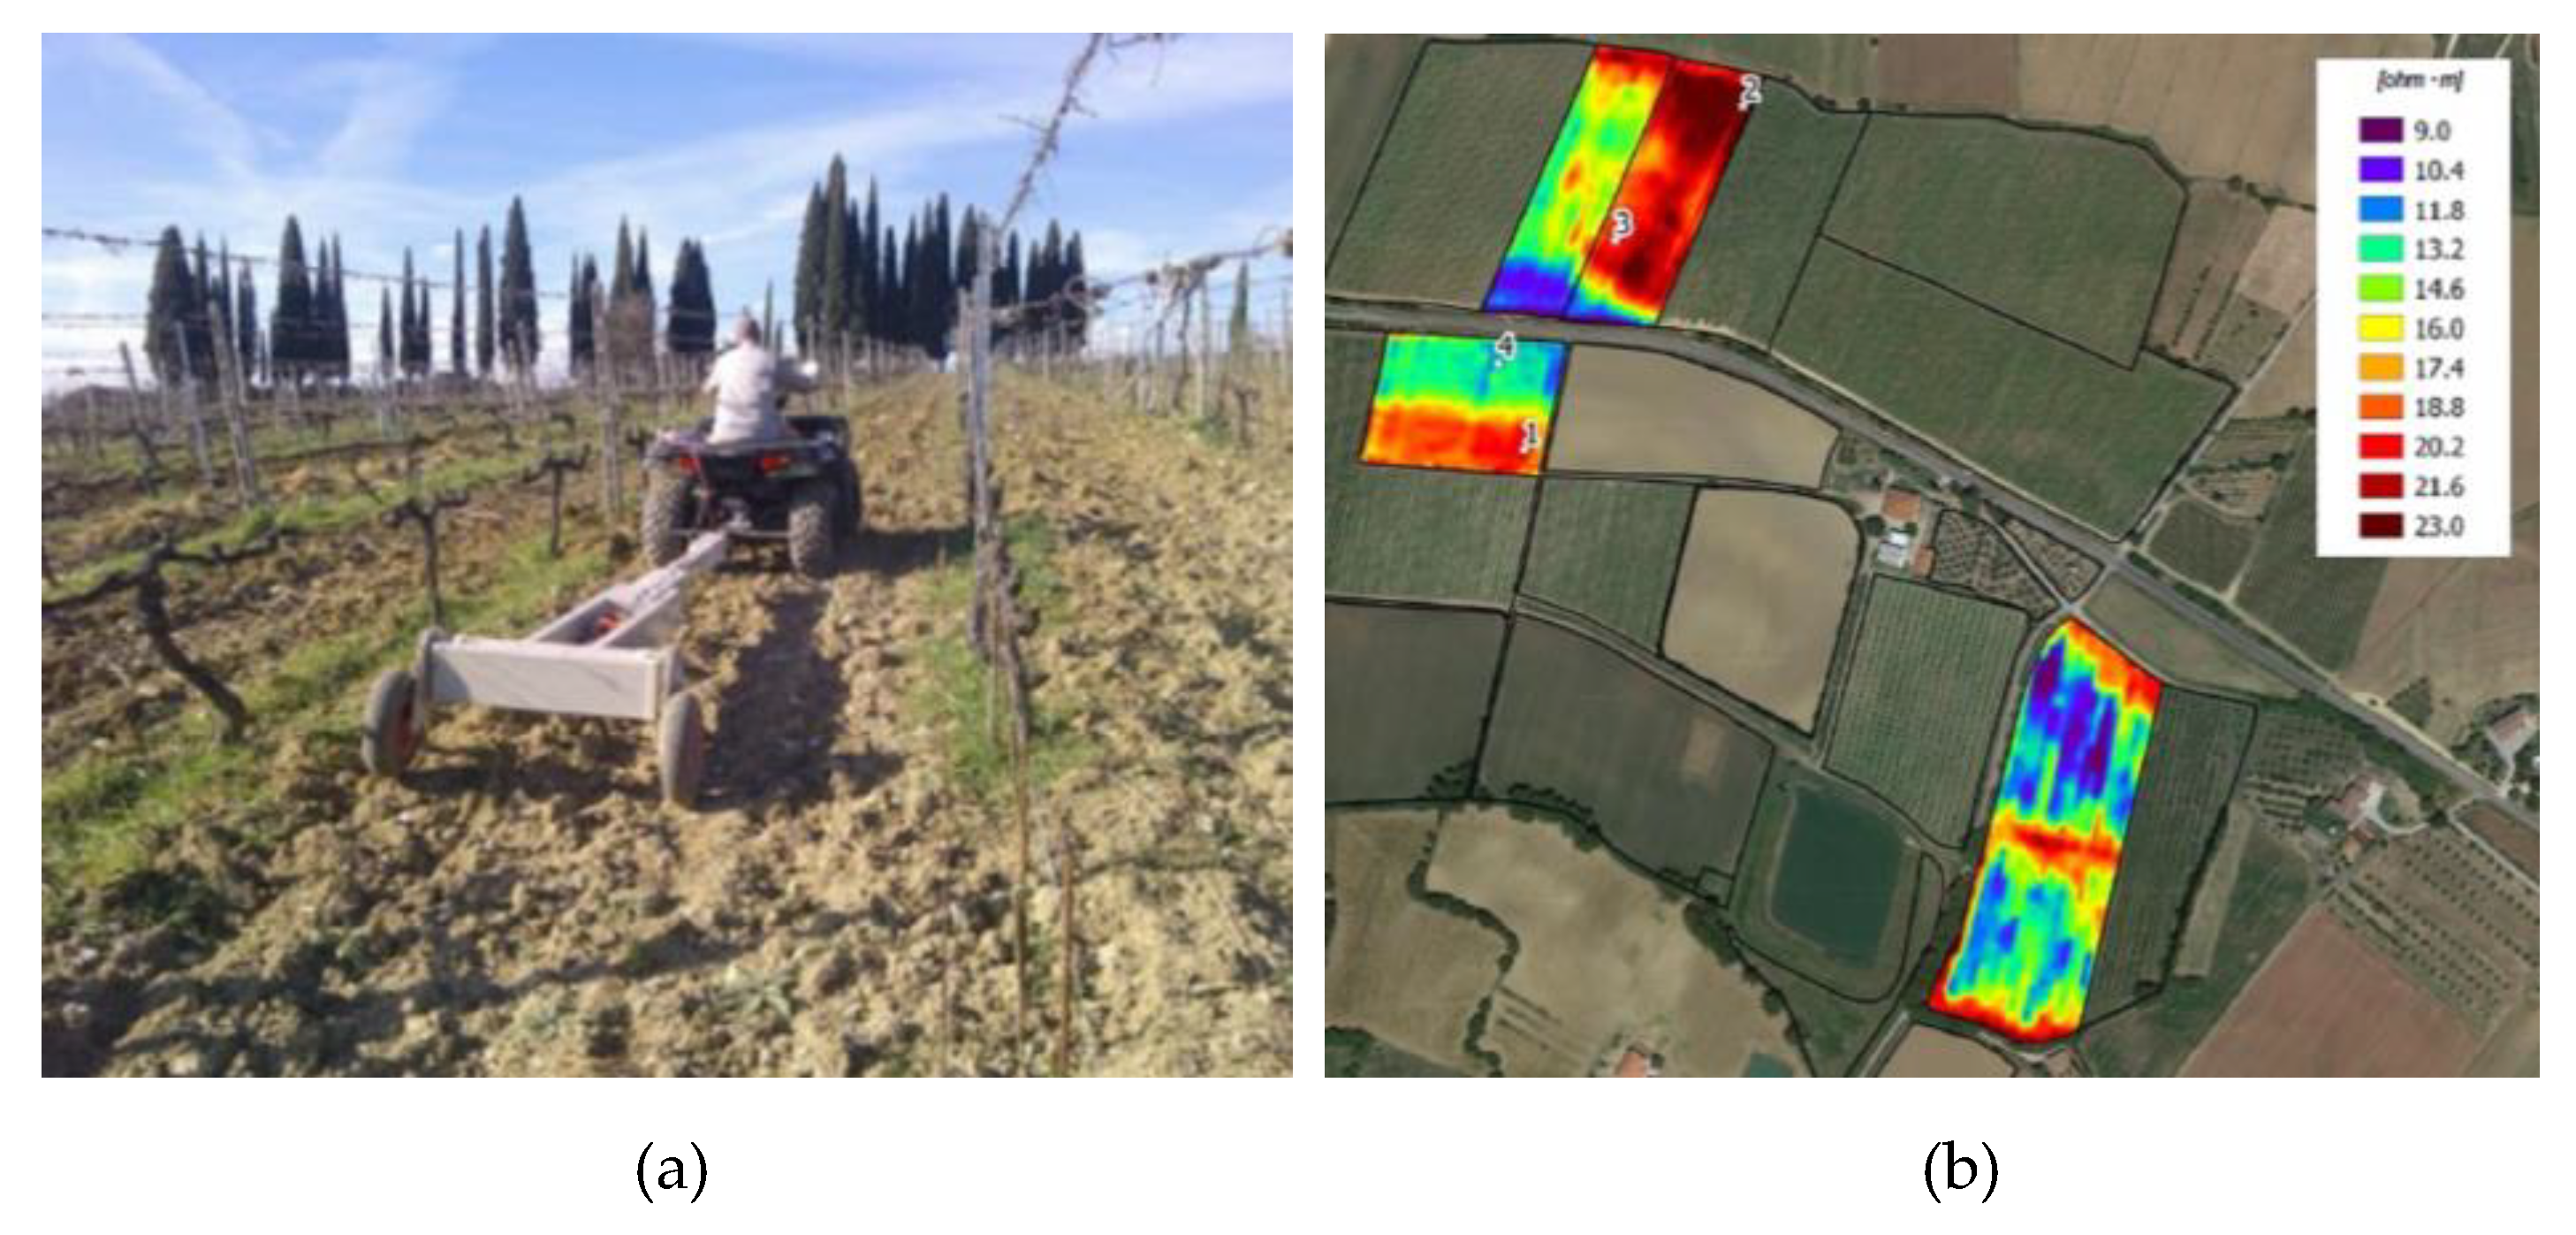
Geophysical Systems
Spectroradiometers
3.2.3. Grape Quality
4. Variable Rate Machines
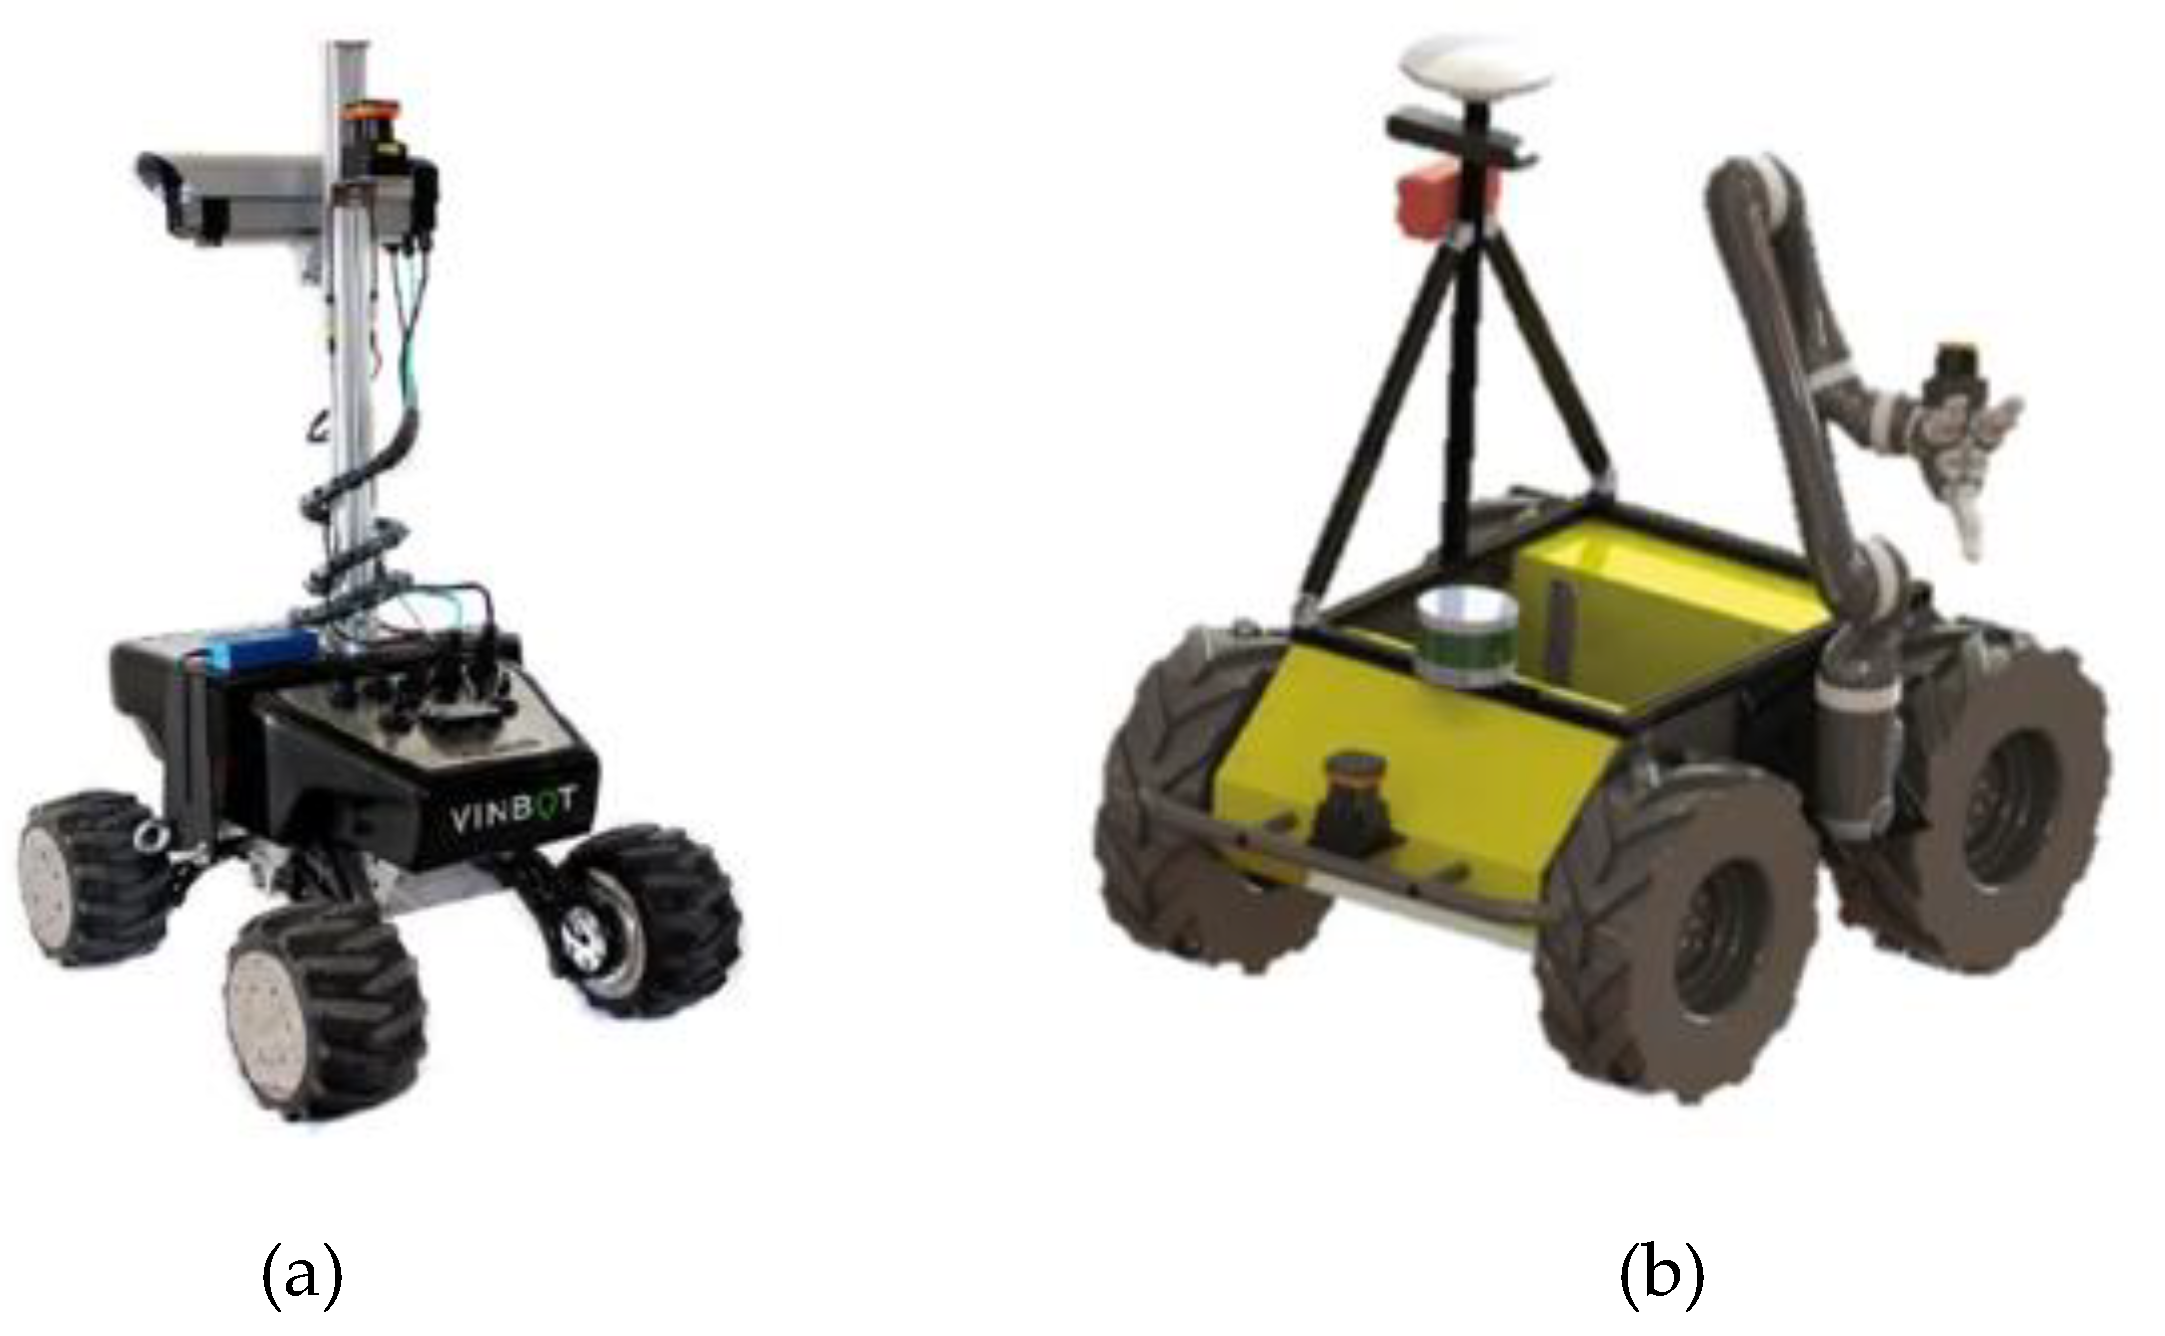
5. Robotics
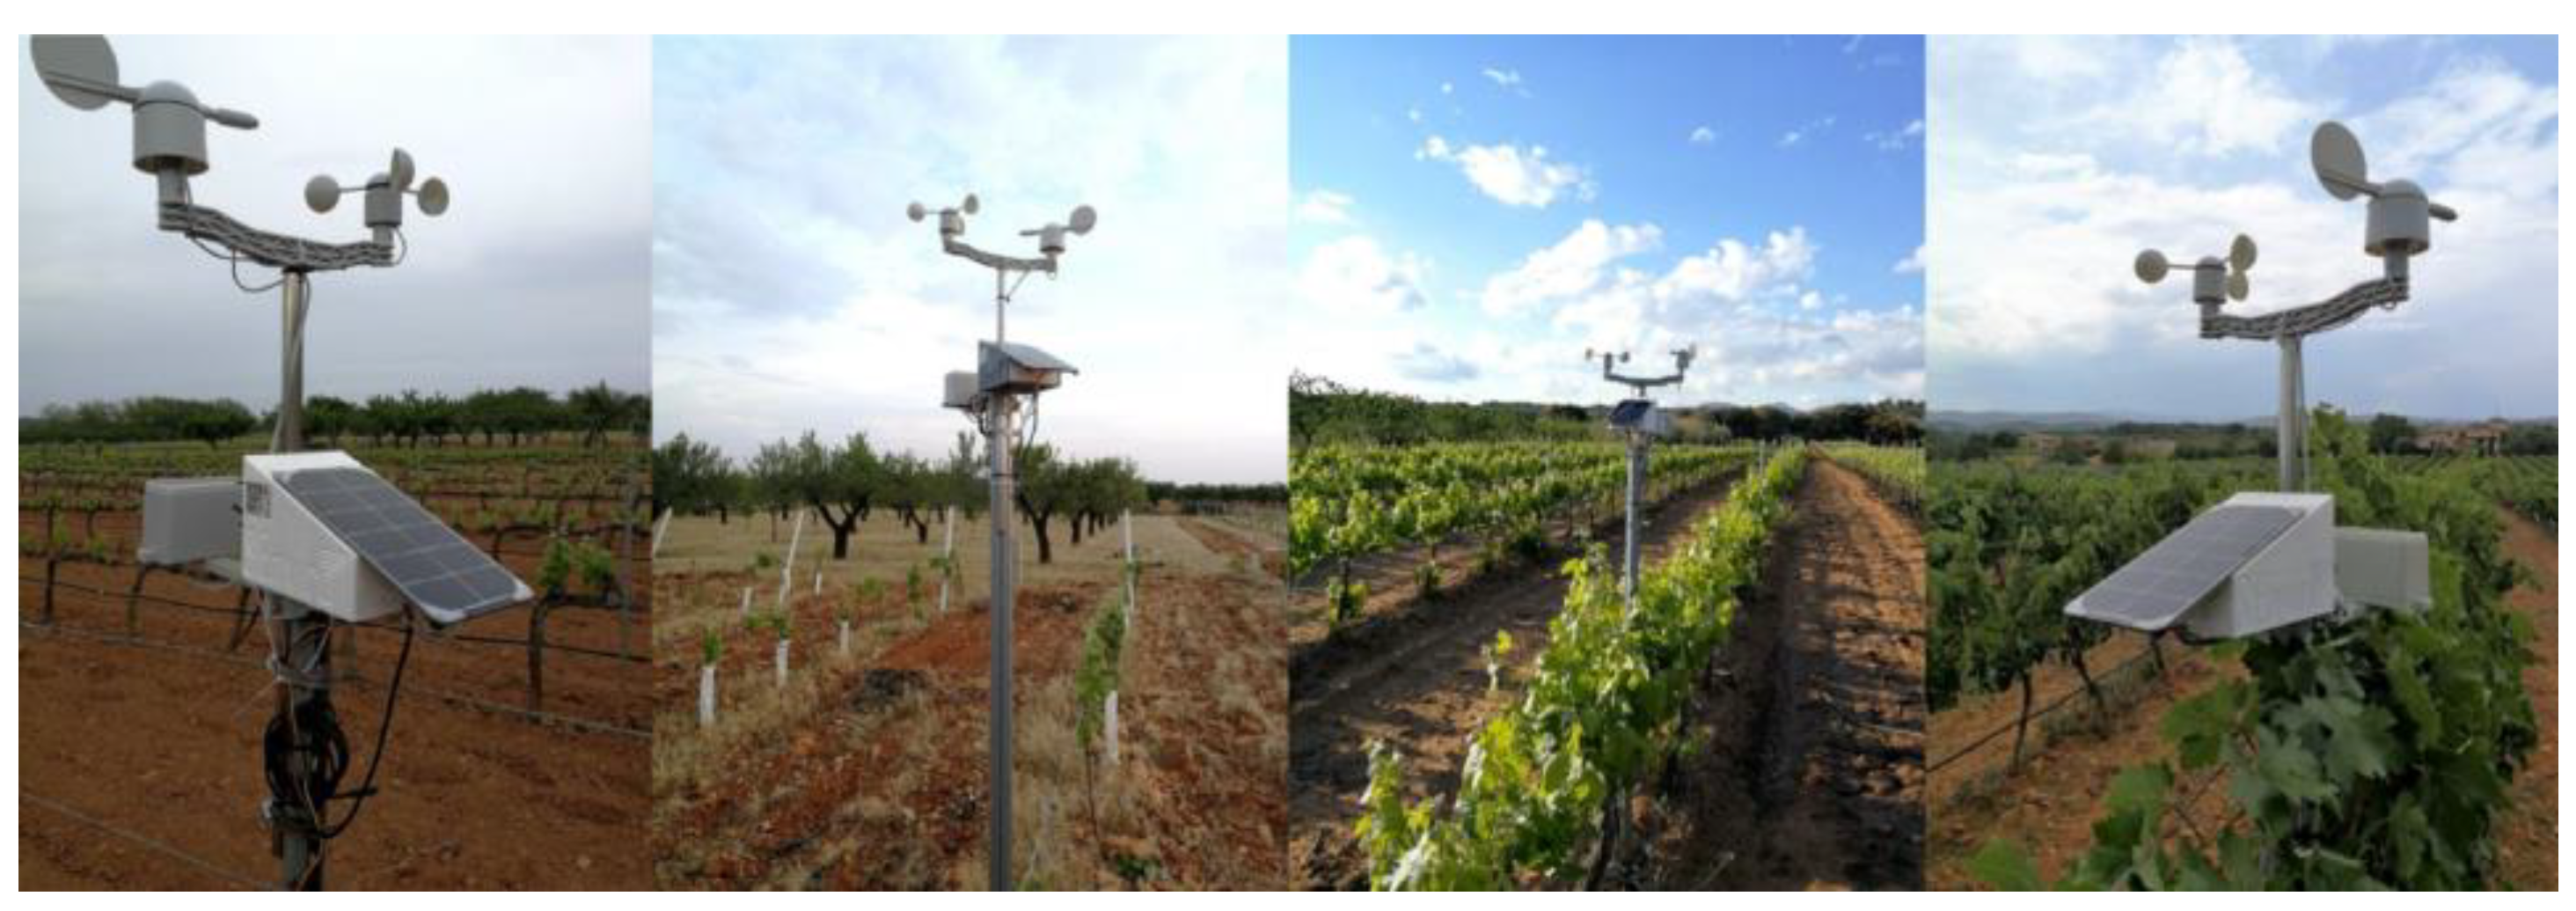
6. DSS and WSN
- a system for acquiring data relating to the cultivation environment, from multiple sources, which flow asynchronously to the DSS;
- a structure of interdependent databases that collects, organizes and performs a quality control of this data;
- sophisticated analysis algorithms (i.e., mathematical models) that allow the transition from raw data to processed data;
- automatic interpretation procedures that allow to pass from the processed data to the agronomic advice;
- a graphical interface that allows the user to access and interact with the DSS.
- Cellular (GSM, 3G, 4G), which is the most suitable for applications that require a very high frequency of data but it is also expensive and with high power consumption;
- 6LoWPAN, which is an IP-based communication protocol with low cost, low bandwidth and low power consumption;
- ZigBee, which is a wireless communication protocol with a flexible structure and a high battery life but it has a short operational range with low data speed and it is also less secure compared to Wi-Fi-based systems;
- BLE, which is a protocol similar to Bluetooth technology, has low bandwidth and short operational range (i.e., 10 m). The main advantages of this system are low setup time and low power consumption;
- Wi-Fi, which is the most common protocol that allows devices to communicate together thanks to a wireless network;
- LoRaWAN, which is a very common protocol used in agriculture due to its possibility to cover wide areas along with a low power consumption.
7. Conclusions
Author Contributions
Funding
Institutional Review Board Statement
Informed Consent Statement
Data Availability Statement
Conflicts of Interest
References
- Pierce, F.J.; Novak, P. Aspects of Precision Agriculture. Adv. Agron. 1999, 67, 1–85. [Google Scholar]
- Bramley, R.G.V. Progress in the development of precision viticulture—Variation in yield, quality and soil properties in contrasting Australian vineyards. Fertil. Lime Res. Centre Massey Univ. Palmerst. North 2001, 14, 25–43. [Google Scholar]
- Hedley, C.B. The Role of Precision Agriculture for Improved Nutrient Management on Farms. J. Sci. Food Agric. 2015, 95, 12–19. [Google Scholar] [CrossRef] [PubMed]
- Yost, M.A.; Kitchen, N.R.; Sudduth, K.A.; Sadler, E.J.; Drummond, S.T.; Volkmann, M.R. Long-term impact of a precision agriculture system on grain crop production. Precis. Agric. 2017, 18, 823–842. [Google Scholar] [CrossRef]
- Gebbers, R.; Adamchuk, V. Precision Agriculture and Food Security. Science 2010, 828–831. [Google Scholar] [CrossRef]
- Schimmelpfennig, D.E.; Ebel, R.M. Sequential Adoption and Cost Savings from Precision Agriculture. J. Agric. Resour. Econ. 2016, 41, 97–115. [Google Scholar]
- Sumiahadi, A.; Direk, M.; Acar, R. Economic Assessment of Precision Agriculture: A Short Review. In Proceedings of the 6th International Conference on Sustainable Agriculture and Environment, Konya, Turkey, 3–5 October 2019. [Google Scholar]
- Srinivasa, A. Handbook of Precision Agriculture; Hayworth Press: Haworth, UK, 2006. [Google Scholar]
- Matese, A.; Di Gennaro, S.F. Technology in precision viticulture: A state of the art review. Int. J. Wine Res. 2015, 7, 69–81. [Google Scholar] [CrossRef] [Green Version]
- Tisseyre, B.; Taylor, J.A. An Overview of Methodologies and Technologies for Implementing Precision Agriculture in Viticulture, XII Congresso Brasileiro de Viticultura e Enologia—Anais; Patrícia Ritschel, Sandra de Souza Sebben: Bento Gonçalves, Brazil, 2005. [Google Scholar]
- Balafoutis, A.; Beck, B.; Fountas, S.; Vangeyte, J.; Van der Wal, T.; Soto, I.; Gómez-Barbero, M.; Barnes, A.; Eory, V. Precision Agriculture Technologies Positively Contributing to GHG Emissions Mitigation, Farm Productivity and Economics. Sustainability 2017, 9, 1339. [Google Scholar] [CrossRef] [Green Version]
- Priori, S.; Valboa, G.; Pellegrini, S.; Leprini, M.; Perria, R.; Storchi, P.; Costantini, E.A.C. Three Proximal Sensors to Map Homogeneous Harvest Zones in Chianti D.O.C.G. (Tuscany, Italy)–The Oenological Results. Eur. Assoc. Geosci. Eng. First Conf. Prox. Sens. Supporting Precis. Agric. 2015, 2015, 1–5. [Google Scholar]
- Priori, S.; Pellegrini, S.; Perria, R.; Puccioni, S.; Storchi, P.; Valboa, G.; Costantini, E.A.C. Scale effect of terroir under three contrasting vintages in the Chianti Classico area (Tuscany, Italy). Geoderma 2019, 334, 99–112. [Google Scholar] [CrossRef]
- Agriprecisione. Available online: http://www.agriprecisione.it/en/viticoltura/viticoltura-di-precisione/ (accessed on 12 September 2020).
- Casa, R. Agricoltura di precisione. Metodi e tecnologie per migliorare l’efficienza e la sostenibilità dei sistemi colturali. Edagricole New Bus. Media 2018. [Google Scholar]
- Maynard, H.D. An Economic Analysis of Precision Viticulture, Fruit, and Pre-Release Wine Pricing across Three Western Australian Cabernet Sauvignon Vineyards. Ph.D. Thesis, Curtin University, Bentley, Australia, 2015. [Google Scholar]
- Mondino, E.B.; Gajetti, M. Scenari economici per l’utilizzo degli RPAS in agricoltura: Conviene davvero? In Proceedings of the Conference VIII Convegno AIT Palermo (Italy), AIT, Palermo, Italy, 22–24 June 2016.
- Arnó, J.; Martínez Casasnovas, J.A.; Ribes Dasi, M.; Rosell, J.R. Review. Precision Viticulture. Research topics, challenges and opportunities in site-specific vineyard management. Span. J. Agric. Res. 2009, 7, 779–790. [Google Scholar] [CrossRef] [Green Version]
- Santesteban, L.G. Precision viticulture and advanced analytics. A short review. Food Chem. 2018, 279, 58–62. [Google Scholar] [CrossRef]
- Linsley, C.M.; Bauer, F.C. Test your soil for acidity. Circ. Univ. Ill. Agric. Exp. Stn. 1929, 346. [Google Scholar]
- Oliver, M.A. An Overview of Geostatistics and Precision Agriculture, Geostatistical Applications for Precision Agriculture; Springer: Dordrecht, The Netherlands, 2010; pp. 1–34. [Google Scholar]
- Blasi, G.; Pisante, M.; Sartori, L.; Casa, R.; Liberatori, S.; Loreto, F.; De Bernardinis, B.; Furlan, L.; Guaitoli, F.; Sarno, G. Linee guida per lo sviluppo dell’agricoltura di precisione in Italia. In Ministero delle Politiche Agricole Alimentari e Forestali; Italian Ministry of Agriculture and Forestry: Roma, Italy, 2017. [Google Scholar]
- Puletti, N.; Perria, R.; Storchi, P. Unsupervised classification of very high remotely sensed images for grapevine rows detection. Eur. J. Remote Sens. 2014, 47, 45–54. [Google Scholar] [CrossRef] [Green Version]
- Bramley, R.G.V. Precision Viticulture: Managing vineyard variability for improved quality outcomes. In Viticulture and Wine Quality, Woodhead Publishing Series in Food Science, Technology and Nutrition; Woodhead Publishing: Cambridge, UK, 1999; pp. 445–480. [Google Scholar]
- Bramley, R.G.V.; Lamb, D.W. Making sense of vineyard variability in Australia. In Precision Viticulture. Proceedings of an International Symposium Held as Part of the IX Congreso Latinoamericano de Viticultura y Enologia, Chile; Centro de Agricultura de Precisión, Pontificia Universidad Católica de Chile, Facultad de Agronomía e Ingenería Forestal: Santiago, Chile, 2003; pp. 35–54. [Google Scholar]
- Martínez-Casasnovas, J.A.; Borsed, X. Viticultura de precisión: Predicción de cosecha a partir de variables del cultivo e índices de vegetación. Rev. Teledetección 2005, 24, 67–71. [Google Scholar]
- Sudduth, K.A. Engineering Technologies for Precision Farming; USDA—Agricultural Research Service: Columbia, MO, USA, 1999. [Google Scholar]
- Blackmore, B.S. Developing the Principles of Precision farming. In Proceedings of the International Conference on Precision Agriculture, Minneapolis, MN, USA, 14–17 July 2002; p. 5. [Google Scholar]
- Johnson, L.F.; Bosch, D.F.; Williams, D.C.; Lobitz, B.M. Remote sensing of vineyard management zones: Implications for wine quality. Appl. Eng. Agric. 2001, 17, 557–560. [Google Scholar] [CrossRef]
- Martinez-Casasnovas, J.A.; Agelet-Fernandez, J.; Arno, J.; Ramos, M.C. Analysis of vineyard differential management zones and relation to vine development, grape maturity and quality. Span. J. Agric. Res. 2012, 10, 326–337. [Google Scholar] [CrossRef] [Green Version]
- Lamb, D.W.; Weedon, M.M.; Bramley, R.G.V. Using remote sensing to predict grape phenolics and colour at harvest in a Cabernet Sauvignon vineyard: Timing observations against vine phenology and optimising image resolution. Aust. J. Grape Wine Res. 2008, 10, 46–54. [Google Scholar] [CrossRef] [Green Version]
- Bhatti, A.U.; Mulla, D.J.; Frazier, B.E. Estimation of soil properties and wheat yields on complex eroded hills using geostatistics and thematic mapper images. Remote Sens. Environ. 1991, 37, 181–191. [Google Scholar] [CrossRef]
- Mulla, D.J. Twenty-five years of remote sensing in precision agriculture: Key advances and remaining knowledge gaps. Biosyst. Eng. 2013, 114, 358–371. [Google Scholar] [CrossRef]
- Landsat 8 Satellite. Available online: https://landsat.gsfc.nasa.gov/landsat-8/landsat-8-overview (accessed on 5 August 2020).
- Ridwan, M.A.; Radzi, N.A.M.; Ahmad, W.S.H.M.W.; Mustafa, I.S.; Din, N.M.; Jalil, Y.E.; Isa, A.M.; Othman, N.S.; Zaki, W.M.D.W. Applications of Landsat-8 Data: A Survey. Int. J. Eng. Technol. 2018, 7, 436–441. [Google Scholar] [CrossRef] [Green Version]
- Sentinel-2 Satellite. Available online: https://sentinels.copernicus.eu/web/sentinel/user-guides/sentinel-2-msi (accessed on 6 August 2020).
- RapidEye Satellite. Available online: https://earth.esa.int/eogateway/missions/rapideye?text=rapideye (accessed on 10 August 2020).
- Santangelo, T.; Di Lorenzo, R.; La Loggia, G.; Maltese, A. On the relationship between some production parameters and a vegetation index in viticulture. SPIE Remote Sens. 2013, 8887, 888715. [Google Scholar] [CrossRef]
- Vanino, S.; Pulighe, G.; Nino, P.; De Michele, C.; Falanga Bolognesi, S.; D’Urso, G. Estimation of Evapotranspiration and Crop Coefficients of Tendone Vineyards Using Multi-Sensor Remote Sensing Data in a Mediterranean Environment. Remote Sens. 2015, 7, 14708–14730. [Google Scholar] [CrossRef] [Green Version]
- World View Mission. Available online: https://earthdata.nasa.gov/worldview (accessed on 10 August 2020).
- DigitalGlobe WorldView-3 Satellite. Available online: http://worldview3.digitalglobe.com/ (accessed on 11 August 2020).
- Cogato, A.; Pagay, V.; Marinello, F.; Meggio, F.; Grace, P.; De Antoni Migliorati, M. Assessing the Feasibility of Using Sentinel-2 Imagery to Quantify the Impact of Heatwaves on Irrigated Vineyards. Remote Sens. 2019, 11, 2869. [Google Scholar] [CrossRef] [Green Version]
- Karakizi, C.; Oikonomou, M.; Karantzalos, K. Vineyard Detection and Vine Variety Discrimination from Very High Resolution Satellite Data. Remote Sens. 2016, 8, 235. [Google Scholar] [CrossRef] [Green Version]
- Del-Campo-Sanchez, A.; Ballesteros, R.; Hernandez-Lopez, D.; Ortega, J.F.; Moreno, M.A. On behalf of Agroforestry and Cartography Precision Research Group Quantifying the effect of Jacobiasca lybica pest on vineyards with UAVs by combining geometric and computer vision techniques. PLoS ONE 2019, 14, e0215521. [Google Scholar] [CrossRef] [PubMed] [Green Version]
- Sozzi, M.; Kayad, A.G.; Pezzuolo, A.; Sartori, L.; Dubbini, M.; Marinello, F. Comparison Between Different Spatial Resolution Satellites Images for Viticulture. In Proceedings of the European Society of Agricultural Engineers, Wageningen, The Netherlands, AgEng, Évora, Portugal, 8–12 July 2018. [Google Scholar]
- Khaliq, A.; Comba, L.; Biglia, A.; Aimonino, D.R.; Chiaberge, M.; Gay, P. Comparison of Satellite and UAV-Based Multispectral Imagery for Vineyard Variability Assessment. Remote. Sens. 2019, 11, 436. [Google Scholar] [CrossRef] [Green Version]
- Matese, A.; Di Gennaro, S.F. Practical Applications of a Multisensor UAV Platform Based on Multispectral, Thermal and RGB High Resolution Images in Precision Viticulture. Agriculture 2018, 8, 116. [Google Scholar] [CrossRef] [Green Version]
- Comba, L.; Gay, P.; Primicerio, J.; Aimonino, D.R. Vineyard detection from unmanned aerial systems images. Comput. Electron. Agric. 2015, 114, 78–87. [Google Scholar] [CrossRef]
- Di Gennaro, S.F.; Toscano, P.; Cinat, P.; Berton, A.; Matese, A. A Low-Cost and Unsupervised Image Recognition Methodology for Yield Estimation in a Vineyard. Front. Plant Sci. 2019, 10. [Google Scholar] [CrossRef] [Green Version]
- Matese, A.; Baraldi, R.; Berton, A.; Cesaraccio, C.; Di Gennaro, S.F.; Duce, P.; Facini, O.; Mameli, M.G.; Piga, A.; Zaldei, A. Estimation of Water Stress in Grapevines Using Proximal and Remote Sensing Methods. Remote. Sens. 2018, 10, 114. [Google Scholar] [CrossRef] [Green Version]
- Soubry, I.; Patias, P.; Tsioukas, V. Monitoring vineyards with UAV and multi-sensors for the assessment of water stress and grape maturity. J. Unmanned Veh. Syst. 2017, 5, 37–50. [Google Scholar] [CrossRef] [Green Version]
- Di Gennaro, S.F.; Dainelli, R.; Palliotti, A.; Toscano, P.; Matese, A. Sentinel-2 Validation for Spatial Variability Assessment in Overhead Trellis System Viticulture Versus UAV and Agronomic Data. Remote Sens. 2019, 11, 2573. [Google Scholar] [CrossRef] [Green Version]
- Sardaro, R.; Fucilli, V.; De Gennaro, B.; Bozzo, F.; Roselli, L. Sustainability of precision viticulture: An economic assessment of the adoption of UAV technology in vineyard management. In Proceedings of the 54th SIDEA Conference–25th SIEA Conference, Bisceglie/Trani, Italy, 13–16 September 2017; pp. 189–194. [Google Scholar]
- Mondino, E.B. Considerazioni su costi e mercato potenziali del telerilevamento da SAPR in Italia nel settore vitivinicolo. In Proceedings of the 11 Workshop tematico di Telerilevamento—OSSERVAZIONE DELLA TERRA, Bologna (Italy), ENEA, Rome, Italy, 27–28 June 2017. [Google Scholar]
- Mondino, E.B.; Gajetti, M. Preliminary considerations about costs and potential market of remote sensing from UAV in the Italian viticulture context. Eur. J. Remote Sens. 2017, 50, 310–319. [Google Scholar] [CrossRef]
- Carter, G.A.; Knapp, A.K. Leaf optical properties in higher plants: Linking spectral characteristic to stress and chlorophyll concentration. Physiol. Biochem. 2001, 88, 677–684. [Google Scholar] [CrossRef] [Green Version]
- Terrón, J.M.; Blanco, J.; Moral, F.J.; Ramírez, L.M.; Uriarte, D.; Da Silva, J.R.M.; López, J.M.T.; Da Silva, J.R.M. Evaluation of vineyard growth under four irrigation regimes using vegetation and soil on-the-go sensors. SOIL 2015, 1, 459–473. [Google Scholar] [CrossRef] [Green Version]
- Losciale, P.; Manfrini, L.; Morandi, B.; Pierpaoli, E.; Zibordi, M.; Stellacci, A.M.; Salvati, L.; Corelli Grappadelli, L. A multivariate approach for assessing leaf photo-assimilation performance using the IPL index. Physiol. Plant. 2015, 154, 609–620. [Google Scholar] [CrossRef]
- De Bei, R.; Fuentes, S.; Gilliham, M.; Tyerman, S.; Edwards, E.; Bianchini, N.; Smith, J.; Collins, C. VitiCanopy: A Free Computer App to Estimate Canopy Vigor and Porosity for Grapevine. Sensors 2016, 16, 585. [Google Scholar] [CrossRef] [Green Version]
- Corwin, D.L.; Lesch, S.M. Characterizing soil spatial variability with apparent soil electrical conductivity: Part II. Case study. Comput. Electron. Agric. 2005, 46, 135–152. [Google Scholar] [CrossRef]
- Samouëlian, A.; Cousin, I.; Tabbagh, A.; Bruand, A.; Richard, G. Electrical resistivity survey in soil science: A review. Soil Tillage Res. 2005, 83, 173–193. [Google Scholar] [CrossRef] [Green Version]
- Priori, S.; L’Abate, G.; Fantappiè, M.; Costantini, E.A.C. Mapping soil spatial variability at high detail by proximal sensors for vineyard planning. EQA Int. J. Environ. Qual. 2018, 30, 9–15. [Google Scholar]
- Priori, S. Sensori ad Induzione Elettromagnetica per il Rilevamento Prossimale del Suolo: Opportunità per L’agricoltura di Precisione e L’individuazione di Anomalie Sottosuperficiali. Available online: http://www.georgofili.info/ (accessed on 14 March 2017).
- Force-A. Available online: https://www.force-a.com/products/multiplex (accessed on 20 September 2020).
- Cerovic, Z.C.; Goutouly, J.P.; Hilbert, G.; Moise, N. Irvine Mapping winegrape quality attributes using portable fluorescence-based sensors. Frutic 2009, 9, 301–310. [Google Scholar]
- Garcia, O.; Debuisson, S.; Morlet, M.; Germain, C.; Panigai, L. Using MULTIPLEX® to manage nitrogen variability in Champagne vineyards. In ICPA; International Society of Precision Agriculture: Monticello, IL, USA, 2012. [Google Scholar]
- Vieri, M.; Sarri, D.; Rimediotti, M.; Perria, R.; Storchi, P. The new architecture in the vineyard system management for variable rate technologies and traceability. Ist Int. Workshop Vineyard Mech. Grape Wine Qual. Piacenza Acta Hortic. 2013, 978, 47–53. [Google Scholar] [CrossRef]
- Tecnovict. Available online: http://www.tecnovict.com/viticoltura-di-precisione/ (accessed on 1 August 2020).
- Gatti, M.; Poni, S. Within-field variability and variable rate nitrogen fertilization in a Barbera vineyard. In La Viticultura de Precisión en la Mejora de la Calidad del vino, Valencia; Universitat Politecnica de Valencia: Valencia, Spain, 2015. [Google Scholar]
- ISO Standard. Available online: https://www.iso.org/standard/57556.html (accessed on 2 August 2020).
- Donna, P.; Tonni, M.; Divittini, A.; Valenti, L. Concimare il vigneto guidati dal satellite. L’Informatore Agrar. 2013, 22, 42–46. [Google Scholar]
- Blackmore, S. Farming with robots 2050. In Proceedings of the Oxford Farming Conference, Oxford, UK, 6–8 January 2014. [Google Scholar]
- Lopes, C.M.; Graça, J.; Sastre, J.; Reyes, M.; Guzmán, R.; Braga, R.; Monteiro, A.; Pinto, P.A. Vineyard yeld estimation by VINBOT robot—Preliminary results with the white variety Viosinho. In Proceedings 11th Int. Terroir Congress; Jones, G., Doran, N., Eds.; Southern Oregon University: Ashland, VA, USA, 2016; pp. 458–463. [Google Scholar]
- Roure, F.; Moreno, G.; Soler, M.; Faconti, D.; Serrano, D.; Astolfi, P.; Bardaro, G.; Gabrielli, A.; Bascetta, L.; Matteucci, M. GRAPE: Ground Robot for vineyArd Monitoring and ProtEction. In ROBOT 2017: Third Iberian Robotics Conference. ROBOT 2017. Advances in Intelligent Systems and Computing; Ollero, A., Sanfeliu, A., Montano, L., Lau, N., Cardeira, C., Eds.; Springer: Cham, Switzerland, 2017; Volume 693. [Google Scholar]
- Ramin Shamshiri, R.; Weltzien, C.; Hameed, I.A.; Yule, I.J.; Grift, T.E.; Balasundram, S.-P.K.; Pitonakova, L.; Ahmad, D.; Chowdhary, G. Research and development in agricultural robotics: A perspective of digital farming. Int. J. Agric. Biol. Eng. 2018, 11, 1–14. [Google Scholar] [CrossRef]
- Guzmán, R.; Ariño, J.; Navarro, R.; Lopes, C.M.; Graça, J.; Reyes, M.; Barriguinha, A.; Braga, R. Autonomous hybrid gps/reactive navigation of an unmanned ground vehicle for precision viticulture-VINBOT. In Proceedings of the 62nd German Winegrowers Conference, Stuttgart, German Winegrowers’ Association, Bonn, Germany, 27–30 November 2016. [Google Scholar]
- Berenstein, R.; Ben Shahar, O.; Shapiro, A.; Edan, Y. Grape clusters and foliage detection algorithms for autonomous selective vineyard sprayer. Intell. Serv. Robot. 2010, 3, 233–243. [Google Scholar] [CrossRef]
- Millan, B.; Diago, M.P.; Aquino, A.; Palacios, F.; Tardaguila, J. Vineyard pruning weight assessment by machine vision: Towards an on-the-go measurement system. OENO One 2019, 53. [Google Scholar] [CrossRef]
- Trilles, S.; Juan, P.; Díaz-Avalos, C.; Ribeiro, S.; Painho, M. Reliability Evaluation of the Data Acquisition Potential of a Low-Cost Climatic Network for Applications in Agriculture. Sensors 2020, 20, 6597. [Google Scholar] [CrossRef] [PubMed]
- Shafi, U.; Mumtaz, R.; García-Nieto, J.; Hassan, S.A.; Raza Zaidi, S.A.; Iqbal, N. Precision Agriculture Techniques and Practices: From Considerations to Applications. Sensors 2019, 19, 3796. [Google Scholar] [CrossRef] [Green Version]


| Type of Monitoring | Collected Data | Benefits |
|---|---|---|
| Meteorological | Temperature | Disease prevention, pesticide and water management |
| Air humidity | ||
| Leaf wetness | ||
| Wind speed | ||
| Rainfall data | ||
| Solar radiation | ||
| Soil | Electric conductivity | Fertilization, seed and water management, project of new plantations |
| Soil Texture | ||
| Organic matter content | ||
| pH | ||
| Humidity | ||
| Plant | Vigor and biomass | Fertilization, pesticide, harvest, defoliation and water management |
| LAI (leaf area index) | ||
| Fluorescence | ||
| Growth ratio | ||
| Fruit | Ripening grade | Selective harvesting to increase the quality of the final products (e.g., wine) |
| Sugars | ||
| Anthocyanin | ||
| Acidity Growth ratio |
| Country | PA Technique | Diffusion |
|---|---|---|
| USA | Tractors with GPS | 80% |
| Autosteer tractors | 40% | |
| VRT fertilization | 70% | |
| VRT seeding | 60% | |
| VRT spraying | 38% | |
| Soil sampling | 70% | |
| Soil electrical conductivity mapping | 25% | |
| Harvester with production mapping system | 40% | |
| Yield monitoring | 58% | |
| UAV mapping | 38% | |
| Satellite mapping | 55% | |
| UK | Tractors with GPS | 22% |
| Soil mapping | 20% | |
| Variable rate applications | 16% | |
| Production mapping | 11% | |
| Germany | Various PA techniques | 10% |
| ISOBUS systems | 45% | |
| France | Various PA techniques | 10% |
| Variable rate applications | 10% | |
| ISOBUS systems | 30% | |
| Italy | Tractors with GPS | 8% |
| ISOBUS systems | 10% | |
| VRT fertilizer | 200 machines | |
| Harvester with production mapping system | 1600 machines |
| Platform | Spatial Resolution | Autonomy | Coverage Area | Cost per Hectare |
|---|---|---|---|---|
| Satellite | 0.4–100 m | Unlimited | Thousands of ha | Free–0.3 €/ha |
| Aircraft | 10–100 cm | 1–3 h | Hundreds of ha | 100–500 €/ha |
| UAV | 0.5–10 cm | 30–60 min | Tens of ha | 60–120 €/ha |
| Satellite | Bands (Spatial Resolution) | Applications |
|---|---|---|
| Landsat 8 | 1 panchromatic band (15 m) | Agriculture and forestry, environmental monitoring, geology, land use mapping, hydrology, coastal resources [35] |
| 8 multispectral bands (30 m) | ||
| 2 thermal infrared bands (100 m) | ||
| Sentinel-2 | 13 multispectral bands (10 m/20 m/60 m) | Land monitoring, maritime monitoring, emergency management, security [36] |
| RapidEye | 5 multispectral bands (5 m) | Agriculture and forestry, environment, mapping, defense, security and emergency, visual simulation [37] |
| WorldView 3 | 1 panchromatic band (0.31 m) | Mapping, land classifications, disaster preparedness/response, feature extraction, soil/vegetative analysis, geology, environmental monitoring, bathymetry, coastal applications [41] |
| 8 multispectral bands (1.24 m) | ||
| 8 shortwave infrared bands (3.7 m) | ||
| 12 CAVIS (Clouds, Aerosols, Vapors, Ice, and Snow) bands (30 m) |
| Type of Sensor | Applications |
|---|---|
| Radiometric | Canopy vigor/stress assessment, chlorophyll content, nitrogen concentration, LAI, water stress |
| Fluorometer | |
| Apps (VitiCanopy) | |
| Geophysical | Soil composition and structure |
| Spectroradiometers | |
| Fluorometer | Grape quality and ripening assessment |
| Spectrophotometer |
Publisher’s Note: MDPI stays neutral with regard to jurisdictional claims in published maps and institutional affiliations. |
© 2021 by the authors. Licensee MDPI, Basel, Switzerland. This article is an open access article distributed under the terms and conditions of the Creative Commons Attribution (CC BY) license (http://creativecommons.org/licenses/by/4.0/).
Share and Cite
Ammoniaci, M.; Kartsiotis, S.-P.; Perria, R.; Storchi, P. State of the Art of Monitoring Technologies and Data Processing for Precision Viticulture. Agriculture 2021, 11, 201. https://doi.org/10.3390/agriculture11030201
Ammoniaci M, Kartsiotis S-P, Perria R, Storchi P. State of the Art of Monitoring Technologies and Data Processing for Precision Viticulture. Agriculture. 2021; 11(3):201. https://doi.org/10.3390/agriculture11030201
Chicago/Turabian StyleAmmoniaci, Marco, Simon-Paolo Kartsiotis, Rita Perria, and Paolo Storchi. 2021. "State of the Art of Monitoring Technologies and Data Processing for Precision Viticulture" Agriculture 11, no. 3: 201. https://doi.org/10.3390/agriculture11030201