Article

Above and Belowground Relative Yield Total of Clover–Ryegrass Mixtures Exceed One in Wet and Dry Years

1
Department of Crop Sciences, Division Agronomy/Crop Science, Georg-August-University of Goettingen, 37073 Goettingen, Germany
2
Seed Quality Research, Strube Research GmbH & Co. KG. Hauptstraße 1, 38387 Söllingen, Germany
*
Author to whom correspondence should be addressed.
Agriculture 2021, 11(3), 206; https://doi.org/10.3390/agriculture11030206
Submission received: 16 January 2021 / Revised: 8 February 2021 / Accepted: 22 February 2021 / Published: 3 March 2021
(This article belongs to the Special Issue Root-Soil Interactions in Organic Farming)

Abstract

:
Grassland mixtures hold the potential for increasing biomass and productivity. In a field experiment, monocultures and mixtures of eight white clover (Trifolium repens L.) genotypes and perennial ryegrass (Lolium perenne L.) were analyzed over three years (2015, 2016, and 2018) for their species-specific aboveground and belowground biomass. Roots were analyzed by Fourier transform infrared (FTIR) spectroscopy to identify species-specific root mass, vertical distribution, and belowground relative yield total (RYT). Aboveground biomass decreased strongly from 2015 to 2018. Aboveground and belowground RYT were always significantly higher than one. Aboveground biomass overyielded in 2016 and 2018 compared to monocultures. Monocultures of perennial ryegrass displayed a significantly higher proportion of roots in shallow soil layers than white clover in two of the three examined years. In mixtures, these differences in vertical root distribution between both species were not present and perennial ryegrass, and white clover occupied similar vertical niches in 2015 and 2016. Interestingly, in the dry year 2018, white clover had a higher proportion of roots in shallow soil layers than perennial ryegrass in mixtures.

1. Introduction

Diverse plant communities use a broader range of belowground resources, such as nutrients and soil moisture. Roots have been rarely analyzed in mixed communities due to a lack of appropriate methods to distinguish between roots of different species. Root system architecture is a major morphological trait determining foraging capacity [1]. In particular, deep rooting is fundamental for efficient nutrient acquisition and scavenging subsoil water resources [1,2].
Grasses and legumes differ in their rooting depth [3,4] in a way that grasses are characterized by a homorhizous root system, which is often associated with a higher proportion of roots in the topsoil, whereas legumes are characterized by a more allorhizous root system, which is often associated with a higher proportion of roots in the subsoil [5]. Therefore, resource complementarity is assumed to occur between shallow rooting grasses and deep-rooting legumes [4,6,7,8,9]. Vertical niche differentiation is a commonly proposed mechanism to reach functional complementarity. Complementarity increases when roots of a given species grow away from zones of intense nutrient competition with neighbors, leading to a segregation of roots of the different species [10,11,12]. Nonlegumes and legumes differ in their competitive ability regarding light, water, and soil resources [13,14]. While nonlegumes often have a higher competitive ability under high N-fertility and are characterized by a higher N-absorption under wet conditions, legumes can be fiercely competitive under high soil P availability [15,16].
Spatial root segregation in vertical root distribution in wheat–legume intercrops was demonstrated in [17]. An enhanced root segregation might be responsible for aboveground and belowground overyielding [18]. A flexible rooting response to interspecific competition enabled plants to use the soil more optimal in a way that water and nutrient uptake as well as plant performance increased [19,20,21]. Diversity-dependent shifts in rooting depth contributed further to the positive diversity–productivity relationship [22].
White clover (Trifolium repens L.) and perennial ryegrass (Lolium perenne L.) are frequently sown together in many pasture mixtures. White clover (WC) is considered as the most important pasture legume in temperate zones of the world [23]. The creeping, many-branched perennial plant grows in a broad range of different climates and ensures a high nutritional quality and digestibility of its herbage [23]. White clover biomass and yield are very unstable, largely due to poor survival rates during moisture stress, such as summer droughts [24]. Perennial ryegrass is an important pasture and forage plant, which is native to southern Europe, the Middle East, North Africa, and Central Asia. It can produce high grass yield on fertile soil. High aboveground yields, however, are often coupled with a shallow root system and a subsequent limitation of long-term persistence and drought resistance [25].
To our knowledge, the number of studies dealing with species-specific root discrimination is still limited. In a study by [26], roots of maize, faba bean, and wheat were distinguished by different color, texture, and rooting pattern. Root discrimination has only once been performed in white clover and perennial ryegrass mixtures [27], where roots of white clover have been separated manually. Separating roots manually holds a high risk of uncertainty. In a study by [27], a proportion of 7–45% of the root biomass could not be attributed to either perennial ryegrass or white clover. Furthermore, root discrimination can be performed by identifying species-specific DNA [1,12]. Recently, Fourier transform infrared (FTIR) spectroscopy has been applied successfully to discriminate species-specific root biomass in [17,28,29,30].
The aim of the current study was to investigate vertical root distribution of white clover and perennial ryegrass grown in monocultures and mixtures. Species-specific root biomass in the mixtures was determined by FTIR spectroscopy. Eight different genotypes of white clover were grown in monocultures and mixtures with perennial ryegrass in a split plot field trial. We determined (1) species-specific aboveground and belowground biomass and (2) species-specific vertical root distribution of white clover and perennial ryegrass grown in monocultures and mixtures. We tested the following hypotheses: (1) vertical root distribution differs between white clover and perennial ryegrass, (2) vertical root distribution differs between monocultures and mixtures, and (3) white clover–perennial ryegrass mixtures have higher aboveground and belowground biomasses than monocultures (relative yield total (RYT) > 1).

2. Materials and Methods

2.1. Study Site, Plant Material, and Experimental Setting

The field experiment was established at the agricultural experimental station at Reinshof (51°29′42″ N, 09°55′11″ E) in the south of Goettingen, Germany, in 2014. The field site is located 167 m above sea level. The climate is characterized by an annual precipitation of 645 mm; the mean annual temperature is about 8.7 °C, and the mean temperature during the growth season about 15.7 °C. Soils consist of 21% clay, 68% silt, and 11% sand and can be characterized as a fertile Gleyic Fluvisols [13]. The crop rotation before the experiment started was sugar beet, winter wheat, and winter barley.
Eight genotypes of white clover (WC) (Trifolium repens L.) and perennial ryegrass (PR) (Lolium perenne L.) were sown in May 2014 in sole stands with a uniform seed density (1000 seeds m−2). Each genotype of white clover (WC1–WC8) was sown also in mixtures (WC1_PR–WC8_PR) with unfertilized perennial ryegrass (PR) (seed density: 400 white clover seeds m−2, 600 perennial ryegrass seeds m−2). The 17 monocultures and mixtures were part of a split plot design with four blocks (replication), which accumulated to a total number of 68 plots. Each block contained eight main plots with mixtures and monocultures stands of one genotype (eight). Each main plot contained five plots. The plot size was 2 m2 (1 m × 2 m). The experiment was part of IMPAC3 (https://www.uni-goettingen.de/en/impac%c2%b3/528191.html (accessed on 2 December 2020)), and only relevant plots for our study were used.

2.2. Aboveground and Belowground Biomass and Root Length Density

Aboveground and belowground biomasses were sampled on 7 July 2015; 28 June 2016; and 27 June 2018, before the second out of four cuts each year. The cuts in the experiment were carried out from mid-May to mid-October in six-week intervals (for more details see [31]). Aboveground biomass of 0.125 m2 (0.25 m × 0.5 m) was sampled per plot at a cutting height of 5 cm. The aboveground biomass was separated visually into perennial ryegrass and white clover components, dried at 60 °C for 72 h and weighted.
For root sampling, two soil cores per plot, with a diameter of 8.74 cm were sampled up to a soil depth of 60 cm. One soil core was taken directly on the row, and one was taken between the rows. Soil cores were divided into six segments of 10 cm. Soil samples were air dried for 96 h and washed to extract roots with custom made sieves (1 mm mesh size). Root samples were frozen at −20 °C until further processing. Frozen root samples were defrosted and scanned for root length density using a flatbed scanner (Epson Perfection V800 Photo) and the software WinRHIZO (version 2017; Régent Instruments Inc., Canada). Subsequently, roots were dried at 55 °C for 72 h to constant weight, and root dry matter per soil segment was determined. Dry roots were ground with a centrifugal mill (Retsch, ZM 200, 0.12 mm, Germany). Micromilled roots were used for belowground species determination via FTIR spectroscopy. For belowground biomass, the sum of the six root samples (0–60 cm) was calculated.
Species-specific aboveground and belowground biomasses were used to calculate the aboveground and belowground relative yield total (RYT) as follows:
RYT = m = 1 m iyi syi = iyc 1 syc 1 + iyc 2 syc 2
where iyi is the yield for the ith crop in mixed stands, syi is the yield for the ith crop in monocultures, c1 is crop 1, and c2 is crop 2 [32,33]. A RYT higher than one indicates a yield advantage of the mixture and therefore overyielding. The aboveground and the belowground RYT were averaged over all WC genotypes.

2.3. FTIR Spectroscopy

An Alpha-P FTIR spectrometer combined with a platinum ATR unit (Bruker Optics, Ettlingen, Germany) was used to determine species-specific root biomass of white clover and perennial ryegrass in mixtures. Spectra were recorded five times with 32 scans in the wavenumber range of 400–4500 cm−1.
First, monocultures were measured. For this, one homogenous sample of each white clover (WC) genotype and perennial ryegrass (PR) was measured. To establish a quantification model to determine species-specific biomass of mixed samples, a gradient with artificial mixtures of each WC genotype and PR from the monocultures was created. These artificial mixtures were used to calibrate and validate the quantification models (Software package OPUS QUANT 2, Version 7.0, Bruker 2011) as follows: For calibration, 35 calibration samples with known species composition were used to prepare a two-species calibration (from 100% PR and 0% WC to 0% PR and 100% WC, 3% steps). In addition, 20 artificial mixture samples with known species percentages were used for an external validation of the quantification model. For each genotype, a model was established by using the optimize procedure in the Quant 2 method (OPUS, Version 7.0, Bruker). This procedure ranked the models according to the lowest root mean square error of cross validation (RMSECV). Five models with the lowest RMSECV were tested by the external validation. The model with the highest residual prediction deviation (RPD) was selected to calculate the species-specific biomass in mixtures.

2.4. Vertical Root Distribution
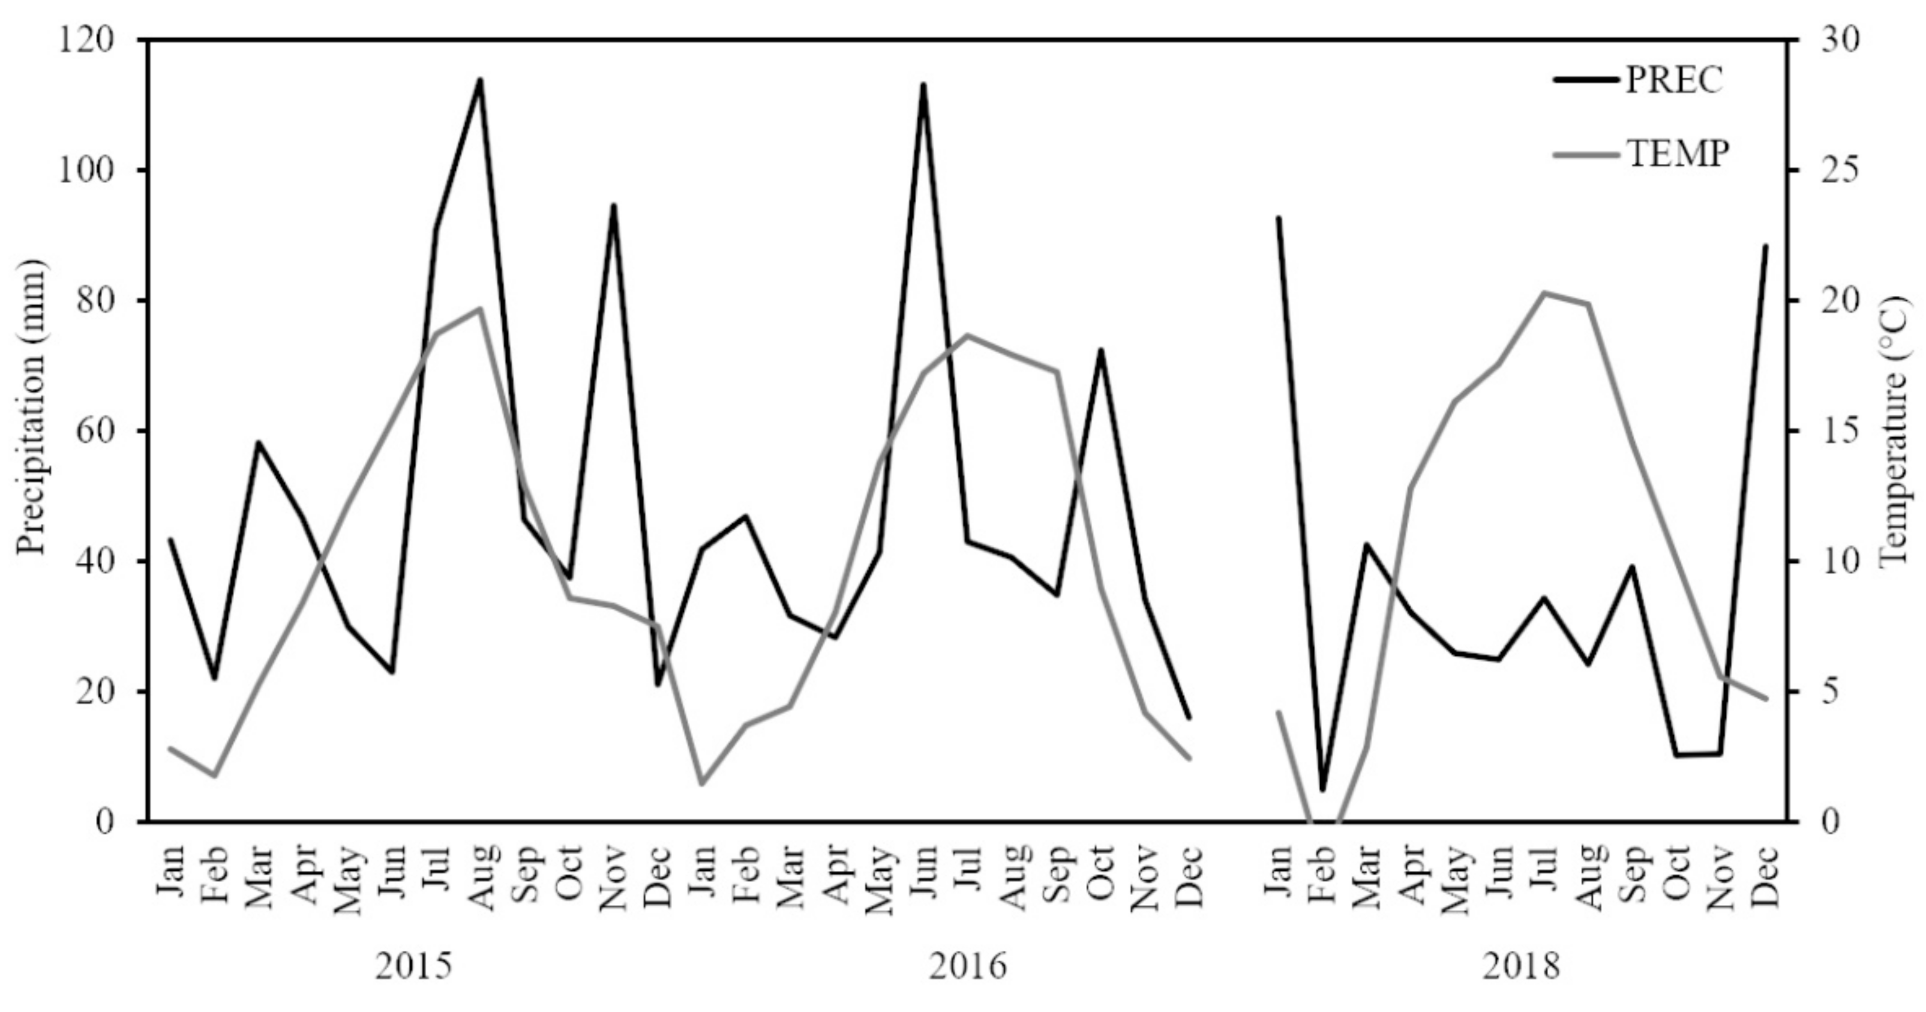
Vertical root distribution was assessed by the numerical index β, which can be calculated according to the equation:
Y = 1 − βd
where d is the soil depth and Y is the proportion of roots from the surface to soil depth d [34]. High β-values correspond to a larger proportion of roots in deeper areas, whereas low β-values correspond to a higher proportion of roots in shallow soil layers [35]. The β-values were calculated separately for white clover and perennial ryegrass and for each cropping system. Calculation of β-values and associated figure development was performed by using the software X-act (version 8.05f, SciLab, Hamburg, Germany). Vertical root distribution was averaged over all WC genotypes. Differences in β-values were tested by a t-test.

2.5. Weather

Weather data was provided by a weather station [36] approximately 3 km south of Goettingen. Temperature was recorded hourly, and temperature means for each month of the years 2015, 2016, and 2018 were calculated (Figure A1). Precipitation of 2015, 2016, and 2018 was measured daily, and cumulated values were used for each month. Average temperature of 2015, 2016, and 2018 was 10.1 ± 1.7 °C, 9.8 ± 1.9 °C, and 10.6 ± 2.1 °C. Precipitation of 2015, 2016, and 2018 was 627 mm year−1, 544 mm year−1 and 430 mm year−1.

2.6. Data Analyses

The statistical analysis was performed with SAS Version 9.4. The effects of year (YEAR) and cropping system with mixture or monoculture (TREAT) on aboveground and belowground biomass as well as root length density were analyzed with a mixed model approach (proc mixed). Both effects were treated as fixed effects. Data was normal distributed and not transformed. Differences between genotypes in aboveground biomass, belowground biomass, and root length density were tested using a one-factorial ANOVA (R, version 3.5.1, R Developmental Team). If no significant genotype effect was detected, average values for all genotypes were calculated. Tukey’s range post hoc test (Tukey’s honest significant difference test) was conducted to identify significant differences between individual factor levels. Significance was determined at p ≤ 0.05. Means and standard errors were calculated from four replicates per treatment.
Differences in vertical root distribution between monocultures and mixed stands of perennial ryegrass and clover were analyzed by using a one-way ANOVA. For this, average values for all clover genotypes were calculated. This analysis was performed with R, version 3.5.1 (R Development Core Team). A two-sided student t-test was used to reveal if the aboveground and belowground relative yield total (RYT) differed significantly from one and if the relative yield (RY) of perennial ryegrass and white clover differed significantly from 0.6 and 0.4, respectively. This analysis was performed with Excel 2010.

3. Results

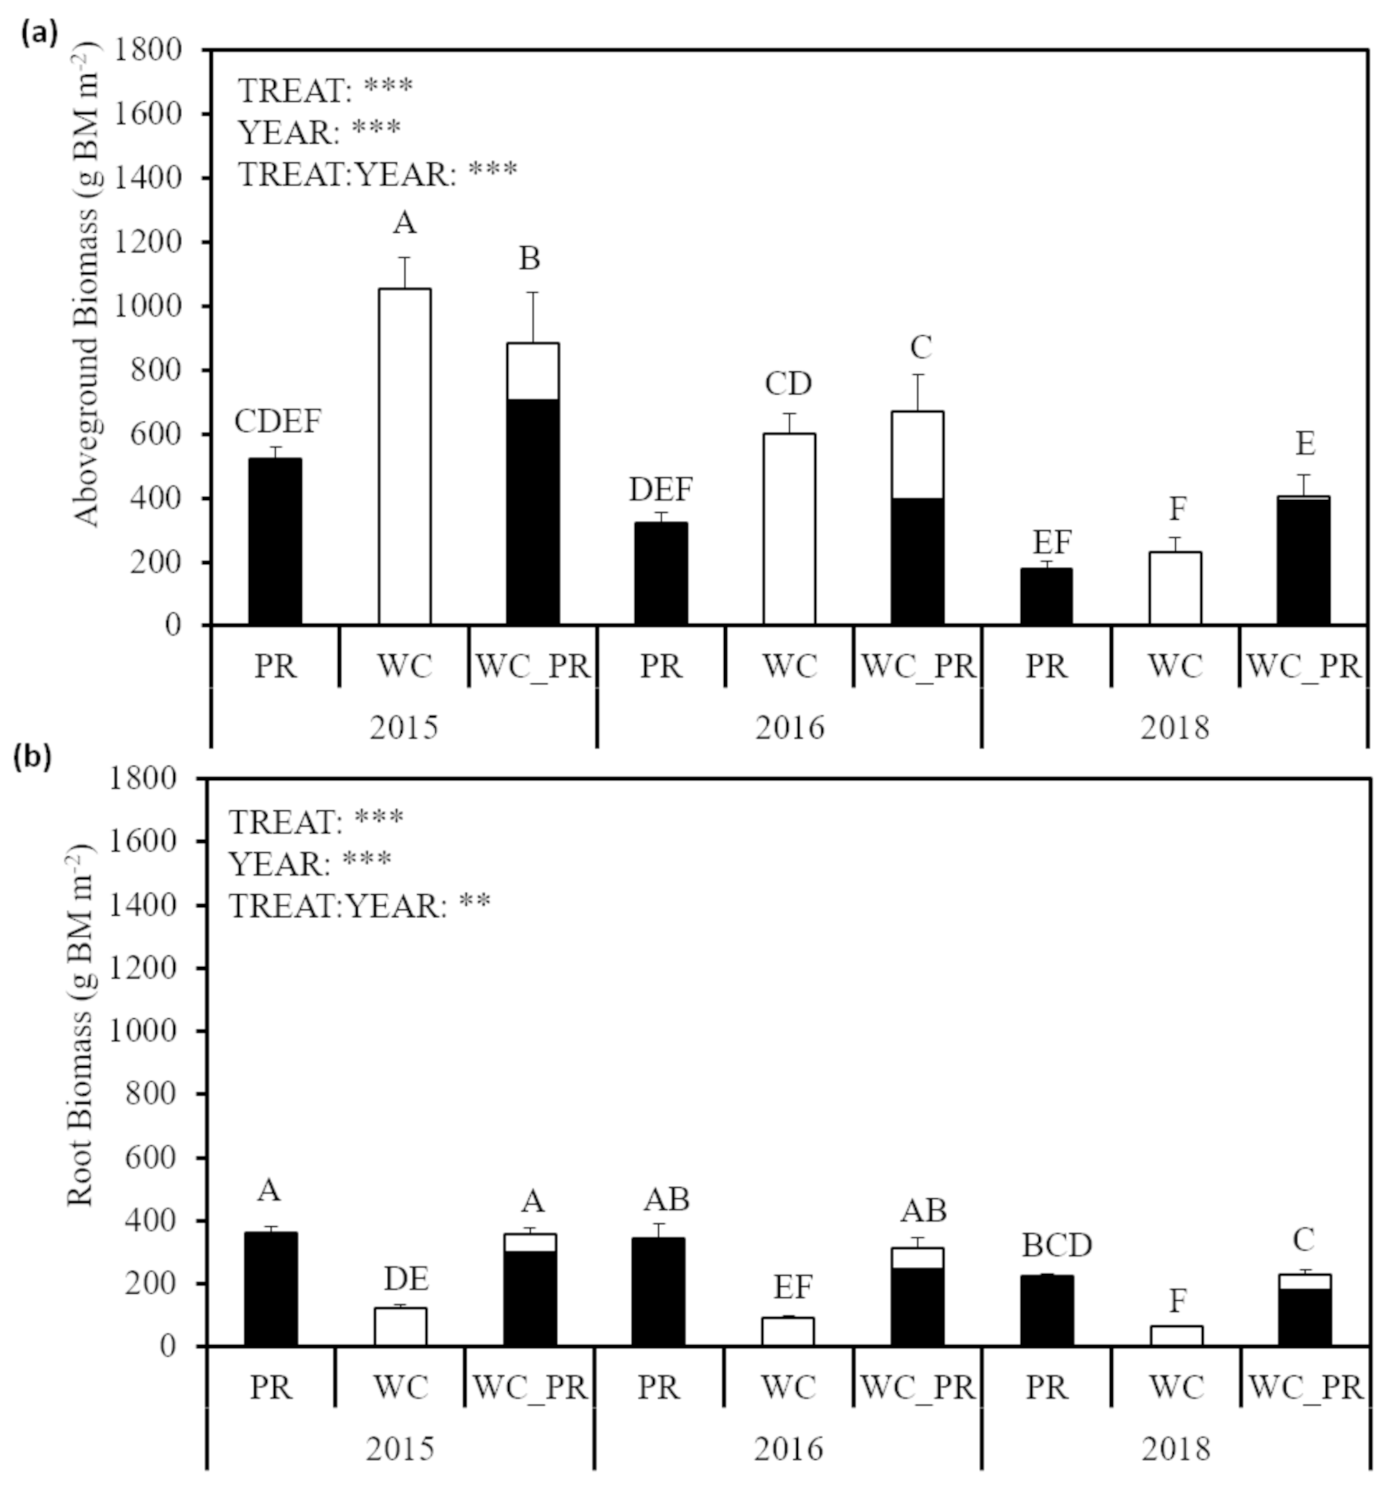
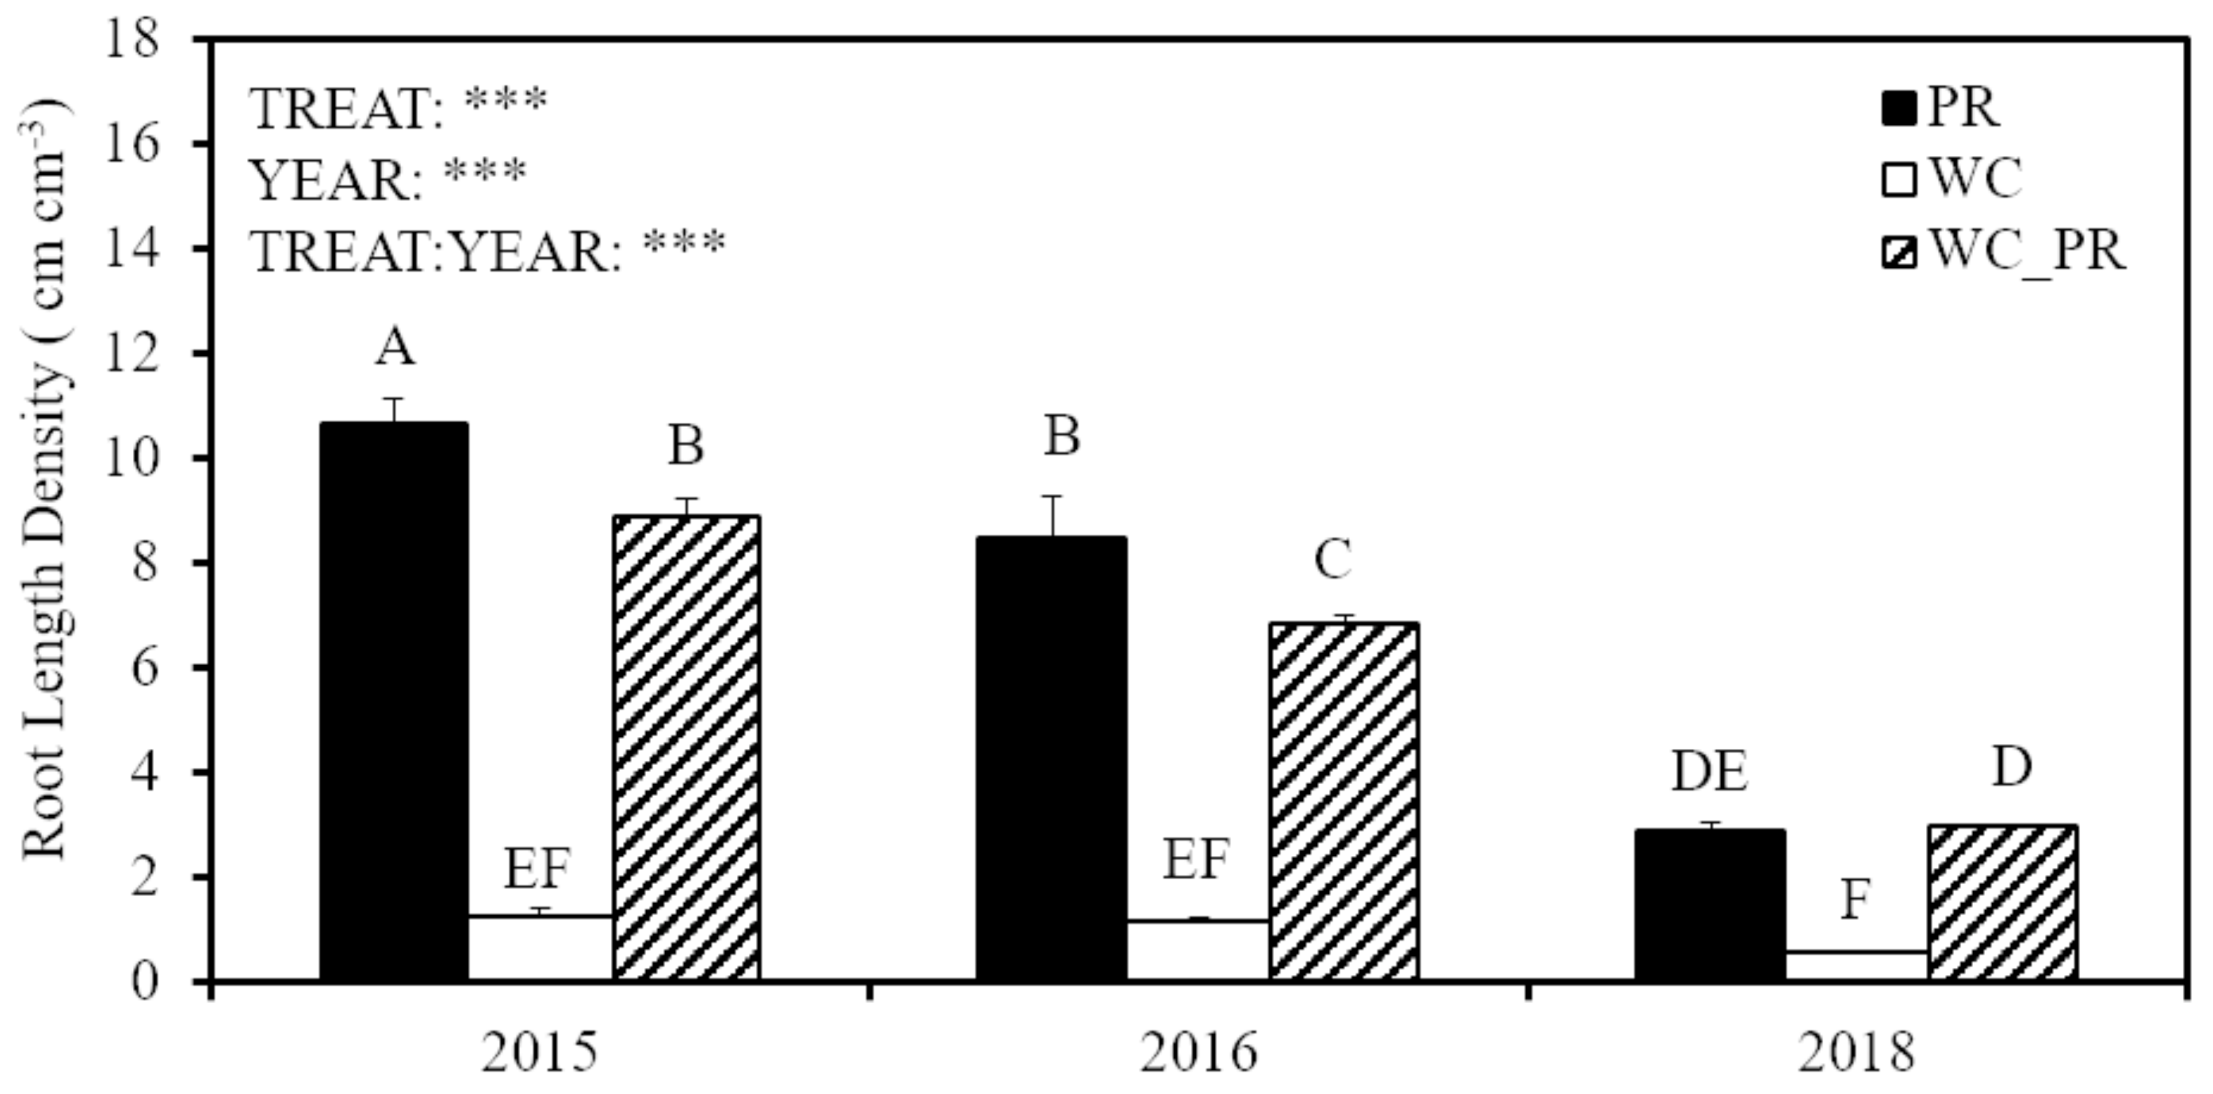
3.1. Aboveground and Belowground Biomass and Root Length Density

Aboveground biomass, root biomass, and root length density did not differ between white clover genotypes in monoculture (WC1–WC8) and in mixture with perennial ryegrass (WC1_PR–WC8_PR) in 2015, 2016, and 2018 (Table 1). Therefore, average values of the eight white clover genotypes (WC) and average values of the mixtures with perennial ryegrass (WC_PR) are presented.
Average aboveground biomass decreased from 2015 to 2018 from 958 ± 33 g m−2 in 2015, to 618 ± 19 g m−2 in 2016, and to 291 ± 17 g m−2 in 2018 (Figure 1a).
Cropping treatment and year and the interaction between treatment and year had a significant effect on aboveground biomass (Table 2).
Aboveground biomasses of WC and WC_PR were significantly lower in 2018 than in 2015 by 78% and 54%, respectively. Aboveground biomass of PR was 49% lower than WC and 59% lower than WC_PR in 2015 and 52% lower than WC_PR in 2016 (Figure 1a). WC_PR had a 76% significantly higher biomass than WC in 2018, but not in 2016 and 2015. Aboveground biomass of WC was double that of perennial ryegrass (PR) in 2015 but not in 2016 and 2018. Within mixtures, the proportion of WC and PR changed between years: whereas, in mixed stands, PR produced 79.5%, 59.2%, and 96.8% of the total biomass in 2015, 2016, and 2018, WC produced 20.5%, 40.8%, and 3.2% only.
Belowground biomass was, on average, 269 ± 17 g m−2 in 2015, 229 ± 16 g m−2 in 2016, and 156 ± 14 g m−2 in 2018 (Figure 1b). Cropping treatment, year, and the interaction between cropping treatment and year had a significant effect on belowground biomass (Table 2). Root biomass of WC was approximately lowered by two-thirds, compared to PR and WC_PR in 2015, 2016, and 2018. PR had a 38% significantly lower root biomass in 2018 than in 2015, and WC_PR had a 36% and 27% significantly lower root biomass in 2018 than in 2015 and 2016.
Root length density was significantly affected by year, treatment, and the interaction between treatment and year (Figure 2). Root length density of PR and WC_PR were significantly lower in 2015 (73% and 66%), compared to 2018. WC had an 88% and 86% significantly lower root length density than PR and WC_PR in 2015, an 86% and 83% lower root length density in 2016, and an 80% and 81% lower root length density in 2018.

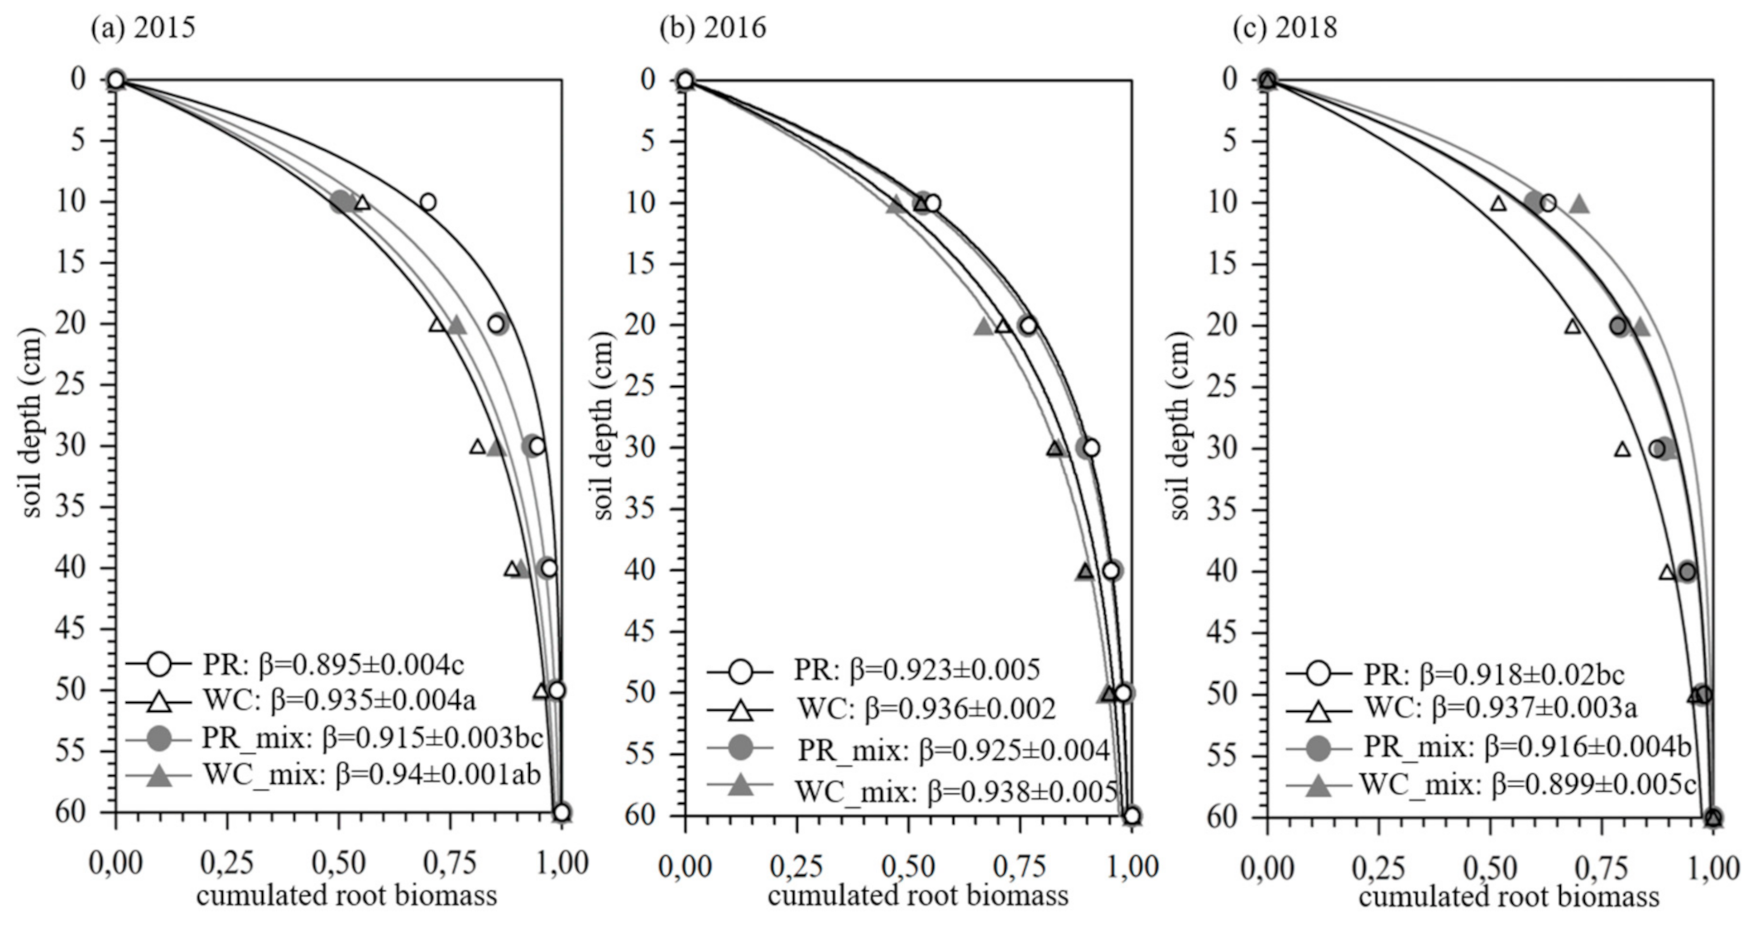
3.2. Vertical Root Distribution (β-Value) of White Clover and Perennial Ryegrass in Monocultures and Mixtures

High β-values are related to a deep rooting pattern, whereas low β-values point to a shallow rooting pattern. Vertical root distribution (β-value) was similar in 2016 but differed between species and treatments in 2015 and 2018 (Figure 3). White clover in monocultures (WC) and mixtures (WC_mix) was 0.94 in all years except 2018 (0.90 in mixture). Perennial ryegrass in mixtures (PR_mix) was also similar in all years (0.92–0.93), and PR was 0.90 in 2015 and 0.92 in 2016 and 2018.
In monocultures, β-values of WC, and PR significantly differed in 2015 and 2018 in a way that WC (β = 0.94) had a significantly deeper root system than PR (β = 0.90 and β = 0.92) (Figure 3).
In 2015 and 2016, β-values of white clover and perennial ryegrass in mixtures were not significantly different from each other (Figure 3). In 2018, PR_mix and WC_mix significantly differed in a way that WC_mix (β = 0.90) had a higher proportion of roots in shallow soil layers than PR_mix (β = 0.92) (Figure 3c). Further, WC_mix (β = 0.90) also displayed a shallower root system than WC_mix (β = 0.94) in 2018.

3.3. Aboveground and Belowground Relative Yield Total

The aboveground and the belowground relative yield total (RYT) were always significantly higher than one (Table 3). Aboveground relative yield of white clover (RYWC) was significantly lower than 0.4 in 2015 and 2018, whereas aboveground relative yield of perennial ryegrass (RYPR) was always significantly higher than 0.6. Relative yield total (RYT) was highest in 2018.
Belowground RYT was 1.55 in 2015, 1.56 in 2016, and 1.50 in 2018 and, thus, similar in all years. Belowground RYWC was 0.55 in 2015, 0.90 in 2016, and 0.65 in 2018, whereas belowground RYPR was 1.00 in 2015, 0.65 in 2016, and 0.86 in 2018. Aboveground RYWC was significantly higher than 0.4 in 2016, and RYPR was significantly higher than 0.6 in 2018. Averaged over years, perennial ryegrass contributed 0.70 and white clover 0.84 to the belowground RYT (1.54).

4. Discussion

Aboveground and belowground RYTs were always significantly higher than one over the three examined years. Aboveground and belowground RY of perennial ryegrass was always higher than RY of white clover. Aboveground and belowground biomass displayed a strong decrease from 2015 to 2018. Roots of white clover and perennial ryegrass occupied similar vertical niches in mixed stands in 2015 and 2016, thus indicating root competition and synergism rather than complementary resource use. In the dry year 2018, vertical root distribution of white clover and perennial ryegrass significantly differed in mixtures: vertical root distribution of WC_mix was significantly shallower than that of PR_mix. In 2016, differences in vertical root distribution could be detected neither in monocultures nor in mixtures.

4.1. Aboveground and Belowground Biomass

Aboveground yields of 2015, 2016, and 2018 were higher than those measured in [37], where spring yield amounted to 2.1 t ha−1 and summer yields to 2.4 t ha−1. Higher yields of the current study can be explained by high to moderate precipitation in 2015 and 2016 (Figure A1), whereas field sites in the Netherlands where exposed to drier conditions than usual between 1990 and 1992 [37]. [38] measured 11.8 t ha−1 in the first year (1995) and 8.5 t ha−1 in the second year (1996), and thus slightly higher yields in comparison to the current study in 2015 and 2016. This might be related to the fact that our study included biomass of the second cut (May to July) out of four cuts, whereas [38] accumulated the aboveground biomass of the whole season (4 to 5 cuts year−1). According to [38], cutting frequency did not have an effect on aboveground biomass of white clover–perennial ryegrass mixtures, but other studies reveal a negative effect of high cutting frequency on dry matter [27], and thus, conclusions are inconsistent.
A decrease in aboveground biomass was detected from 2015 to 2018. Such a decrease in dry matter of white clover–perennial ryegrass mixtures (no N fertilizer) was also found by [39], where yields decreased from 12.2 t ha−1 to 10.5 t ha−1, and 8.7 t ha−1 and lowest yields were reached in the last year of the experiment, which accumulated to 71% of the initial biomass. In the current study however, yields decreased much stronger to 28% of the initial biomass. The decrease in aboveground biomass from 2015 to 2018 can be associated with substantial differences in precipitation (Figure A1), because white clover–perennial ryegrass mixtures have limitations in the production and persistence in drought prone regions [40]. In particular, white clover is characterized as heavily sensitive to low soil moisture [41] and significantly reduces its shoot biomass under drought [42]. Consistently, white clover biomass in monocultures decreased 78.1% in 2018, compared to its initial biomass in 2015, whereas biomass of white clover–perennial ryegrass mixtures decreased only 44.1%.
Root biomass amounted to less than a third of the aboveground biomass in the beginning of the experiment and to more than half of the aboveground biomass at the end of the experiment. Values are considerably lower than in [27], who measured between 2.4 t ha−1 and 10.2 t ha−1 of perennial ryegrass root biomass and between 0.2 and 0.5 t ha−1 of white clover root biomass under infrequent cutting treatments (3 to 4 cuts year−1) in Central Jutland, Denmark. Lower root biomass values certainly relate to the fact that the current study included the standing root biomass in July of each year, whereas [27] used the total cumulated root biomasses of four root biomass harvests.
Root biomass mostly consisted of perennial ryegrass biomass, whereas the proportion of white clover root biomass was low. Explanations can be found in the presence of root interaction that largely enhanced relative yield of Lolium perenne in clover–ryegrass mixtures by 101%, compared to that of monocultures, thus suggesting that perennial ryegrass benefited from interspecies root interaction [43].

4.2. Vertical Root Distribution of White Clover and Perennial Ryegrass

4.2.1. Monocultures

White clover and perennial ryegrass differed in their vertical root distribution in monocultures in a way that perennial ryegrass had a higher root fraction in shallow soils and white clover had a larger root fraction in deeper soils in two of the three examined years. Thus, our first hypothesis can be confirmed for 2015 and 2018, but not for 2016. Differences in vertical root distribution between grasses and forbs have been recently described in [44], where vertical root distribution of pure grass communities had a greater standing root biomass and root length density in the upper 10 cm of the profile than mixtures of both functional groups and pure forb communities. In contrast, standing root biomass in deeper layers of the profile was larger in communities containing forb species than in pure grass communities [44].
Shallow rooting grasses concentrate most of their biomass to the upper 10 cm of the soil. In the current study between 2015 and 2018, perennial ryegrass allocated on average 55–73% of its root biomass to the upper 10 cm of the soil, which is comparable to [45], who detected a proportion of 33 to 75% of root dry matter in the topsoil (0–10 cm). In contrast, white clover concentrated, on average, 52–55% of its root biomass to the upper 10 cm of the soil between 2015 and 2018.

4.2.2. Mixtures

In mixtures, both perennial ryegrass and white clover occupied similar vertical root niches in two of the three years. Similar results have been recently detected in four species intercrops of white mustard, Phacelia, bristle oat, and Egyptian clover, where vertical root profiles presented low niche complementarity, but rather root synergisms [1]. In the mixtures, vertical root segregation did not occur in 2015 and 2016, although it was determined in the monocultures in 2015. Thus, our second hypothesis that assumes differences in vertical root distribution between monocultures and mixtures was confirmed for 2015 and 2018, but not for 2016. Reasons for the missing differences in vertical root distribution in 2016 might be found in the high dominance of white clover, as it displayed a proportion in mixtures up to 40.8%, compared to 20.5% in 2015 and 3.2% in 2018. Because white clover was a strong competitor in 2016, its roots were present in shallow as well as in deeper soil layers. Further, vertical root segregation was detected at the same area and time in wheat–faba bean intercrops [17]. Specific vertical root distribution in intercrops of faba bean and wheat displays that root segregation was taking place in a way that, in intercrops, roots of wheat grew shallower in their own row, while they were growing deeper in their partner’s row, compared to pure stands [17]. These results suggest a complementary use of resources, which could not be detected in the mixtures in 2015 and 2016. Moreover, in 2015, perennial ryegrass and white clover had a very similar root distribution in mixtures. Deep rooting of perennial ryegrass in the mixtures in 2015 was associated with significantly higher aboveground biomass in the mixtures, compared to perennial ryegrass monoculture. An explanation could be that deeper rooting species are more efficient in nutrient acquisition and prevention of nitrate leaching into deeper soils [46,47]. In grassland studies of [45,48], root system architecture had no effect on nitrate interception, whereas total biomass positively affected nitrate interception. Vertical root distribution of white clover did not change in 2015 and 2016, which was consistent to recent findings of Trifolium alexandrinum in sole and mixed stands [1]. Mixed cultivation does not necessarily lead to a spatial root niche segregation, which has also been shown in [49]. The explanation might be that niche segregation may be less important than other ecological factors for species coexistence [50,51]. This might be related to the N-fixation of white clover in the current study. Perennial ryegrass could be the beneficiary in terms of soil nitrogen, while growing in the same rooting depth as white clover.
Root coexistence in mixtures can be explained by the fixation of atmospheric nitrogen of white clover, which is particularly relevant in the absence of nitrogen fertilizer [23]. A legume-derived N transfer from clover to neighboring nonlegumes and grassland species was determined in [52,53]. There, grass species relied to a great extent on clover N, whereas forbs relied on soil N [53]. Residue incorporation of legumes can contribute to ameliorating soil fertility in legume–nonlegume intercrops [54]. Recently, it was confirmed that the use of grass–legume mixtures can substantially contribute to resource-efficient agricultural grassland systems over a wide range of productivity levels, leading to important savings in N fertilizers and thus greenhouse gas emissions [55]. In perennials, such as clover and grass pastures, N transfer between species is quantitatively greater than in annual intercrops and crucial for N cycling [56,57]. This could explain the similar rooting patterns of white clover and perennial ryegrass in 2015 and 2016. In contrast, in the dry summer 2018, white clover was characterized by shallower rooting and perennial ryegrass by a deeper rooting pattern, favoring a complementary water use instead of a synergistic nitrogen use. Overall, white clover is heavily sensitive to low soil moisture [41], and a further explanation for the shallow rooting might be found in the general decrease in shoot and root biomass under drought stress in white clover plants [58]. However, the decrease in belowground biomass was, by far, less pronounced than the decrease in aboveground biomass, and the shallow root system of white clover was only predominant in mixtures, but not in monocultures, which could be an argument for the complementary use of water resources. Another explanation might be the stronger competitiveness of perennial ryegrass in comparison to white clover, especially under dry conditions.

4.3. Relative Yield Total

Aboveground and belowground RYT was higher than 1 among all genotypes and years. Thus, our third hypothesis can be confirmed. Aboveground RYT was, on average, higher than belowground RYT and increased with time from 1.53 (2015) to 1.74 (2016) and to 2.33 (2018). The rising RYT from 2015 to 2018 can be explained by the decreasing nitrogen content in the soil. The soil can be characterized as fertile [31], and nitrogen fertilization of the mixtures stopped in 2014. The white clover had to increase N2 fixation from 2015 to 2018. Possibly, a nitrogen shift from white clover to perennial ryegrass occurred. Higher yields in white clover–perennial ryegrass mixtures, compared to monocultures of white clover, were also detected at the same field site in [31]. So far, larger yields in mixed cultures, compared to monocultures of L. perenne and one Trifolium species (T. repens or T. pratense), were explained by asynchrony in seasonal shoot growth [59]. White clover–perennial ryegrass mixtures could further be characterized by a N-gain, compared to monocultures; however, the N-gain was not related to site productivity [55]. In the current study, higher yields of mixtures, compared to monocultures of perennial ryegrass, were detected in 2015 and 2016. In 2016, the total biomass of the mixtures overyielded, absolutely, compared to the pure stands. In their study, [43] explain the high belowground overyielding by an increase belowground biomass of perennial ryegrass in mixtures.
In 2018, mixtures achieved higher yields than white clover monocultures. Belowground RYT displayed a low fluctuation between the years (1.55, 1.56, and 1.50 in 2015, 2016, and 2018).
The two species differed in their overyielding potential, particularly regarding aboveground biomass: while perennial ryegrass doubled its aboveground biomass in mixtures, white clover reduced its aboveground biomass to a quarter. A dominance of perennial ryegrass in a perennial ryegrass–white clover mixture has been shown in [60], where the grass–clover ratio increased with time from 2.4 after 7 weeks to 15.4 after 19 weeks. In the current study, RY of perennial ryegrass dominated aboveground biomass in mixtures, especially in the dry year 2018, where the proportion of white clover of the aboveground biomass was only 3.2%. In the current study, the grass–clover ratio was 3.8 in 2015, 1.45 in 2016, and 30.21 in 2018.
Aboveground, all genotypes displayed high RYTs during the experiment, and no significant differences could be additionally detected in their specific dry matter (Table A1). This is in accordance with [31], who concluded that white clover populations did not perform differently in monocultures and mixtures. Thus, research should rather focus on combining new species mixtures and analysis of their complementary or synergistic effects than of an extensive number of genotypes or populations.
Regarding the belowground rooting, higher root yields of perennial ryegrass than of clover in mixtures were detected in seven out of eight genotypes in 2015 and 2018 and in five out of eight genotypes in 2016 (data not shown). Thus, results are only partly consistent with [61], who observed a belowground dominance of perennial ryegrass in white clover–perennial ryegrass mixtures.

5. Conclusions

Under these experimental conditions, aboveground and belowground biomass displayed a strong decrease from 2015 to 2018. Aboveground and belowground RYT were, in average, always significantly higher than one over the three examined years. This indicates a biomass yield security of mixtures, compared to monocultures, even in dry years. Vertical root distribution of clover and ryegrass significantly differed in 2015 and 2018 in a way that white clover had a significantly higher root fraction in deep soil layers than perennial ryegrass.
While, in monocultures, significant differences in vertical root distribution between white clover and perennial ryegrass could be detected in two of the three examined years, roots of white clover and perennial ryegrass occupied similar vertical niches in mixed stands in the two wet of the three examined years.

Author Contributions

Conceptualization, C.M. and J.S.; methodology, C.M., J.S., and I.D.; software, C.M., J.S., and I.D.; validation, I.D. and C.M.; formal analysis, I.D. and C.M.; investigation, I.D., J.S., and C.M.; resources, C.M.; data curation, I.D. and C.M.; writing—original draft preparation, I.D. and C.M.; writing—review and editing, I.D., J.S., and C.M.; visualization, I.D.; supervision, C.M.; project administration, C.M.; funding acquisition, C.M. All authors have read and agreed to the published version of the manuscript.

Funding

This research was funded by the Federal Ministry of Education and Research (BMBF, FKZ 031A351A, B, C). We acknowledge support by the Open Access Publication Funds of the Goettingen University.

Institutional Review Board Statement

Not applicable.

Informed Consent Statement

Not applicable.

Acknowledgments

We acknowledge the great support of the technicians Christiane Münter and Gabi Kolle in the field and in the laboratory. We thank all field workers of the Department of Crop Sciences, University of Goettingen. This experiment was part of the IMPAC3 project of the Centre of Biodiversity and sustainable Land Use at the University of Goettingen.

Conflicts of Interest

The authors declare no conflict of interest. The funders had no role in the design of the study; in the collection, analyses, or interpretation of data; in the writing of the manuscript; or in the decision to publish the results.

Appendix A

Figure A1. Precipitation and temperature at Goettingen (Reinshof) in 2015, 2016, and 2018. The figure shows monthly precipitation (mm) and temperature means (°C).
Agriculture 11 00206 g0a1
Table A1. Average values and standard errors of aboveground biomass and root biomass (n = 4) of white clover genotypes (GT) WC1–WC8 grown in monocultures and white clover (WC)–perennial ryegrass (PR) mixtures for 2015, 2016, and 2018.
GTAboveground BiomassRoot Biomass
Monocultures
(g m−2)
WC–PR Mixtures
(g m−2)
Monocultures
(g m−2)
WC–PR Mixtures
(g m−2)
AVSEAVSEAVSEAVSE
2015WC11084±102892±118160±27323±11
WC2926±15797±131113±29389±52
WC31078±67913±14384±2304±18
WC4811±65736±45108±26375±11
WC51085±119782±120139±42316±56
WC61279±170999±28969±8425±31
WC71023±123918±78186±31359±20
WC81130±1421038±109143±35349±30
PR521±102 361±20
2016WC1634±57617±8297±13317±25
WC2612±40833±103100±22317±71
WC3644±95583±4272±9323±18
WC4405±30679±7683±7305±33
WC5608±96631±43102±14352±26
WC6658±40625±7177±10318±29
WC7564±81584±56113±4340±43
WC8675±88806±39103±8295±13
PR322±32 345±45
2018WC1175±18428±4765±17230±43
WC2335±83436±10880±7134±46
WC3203±35333±2983±17239±38
WC4270±43412±2482±11241±26
WC5312±59428±13868±15195±33
WC6160±44354±0644±1324±30
WC7253±54545±9461±10312±80
WC8138±30314±4155±5160±23
PR177±26 224±7

References

  1. Heuermann, D.; Gentsch, N.; Boy, J.; Schweneker, D.; Feuerstein, U.; Groß, J.; Bauer, B.; Guggenberger, G.; Wirén, N. von. Interspecific competition among catch crops modifies vertical root biomass distribution and nitrate scavenging in soils. Sci. Rep. 2019, 9, 11531. [Google Scholar] [CrossRef] [Green Version]
  2. Giehl, R.F.H.; von Wirén, N. Root nutrient foraging. Plant Physiol. 2014, 166, 509–517. [Google Scholar] [CrossRef] [Green Version]
  3. Dimitrakopoulos, P.G.; Schmid, B. Biodiversity effects increase linearly with biotope space. Ecol. Lett. 2004, 7, 574–583. [Google Scholar] [CrossRef]
  4. von Felten, S.; Schmid, B. Complementarity among species in horizontal versus vertical rooting space. J. Plant Ecol. 2008, 1, 33–41. [Google Scholar] [CrossRef]
  5. Kemper, R.; Bublitz, T.A.; Müller, P.; Kautz, T.; Döring, T.F.; Athmann, M. Vertical Root Distribution of Different Cover Crops Determined with the Profile Wall Method. Agriculture 2020, 10, 503. [Google Scholar] [CrossRef]
  6. Parrish, J.; Bazzaz, F.A. Underground Niche Separation in Successional Plants. Ecology 1976, 57, 1281–1288. [Google Scholar] [CrossRef]
  7. Berendse, F. Interspecific Competition and Niche Differentiation Between Plantago Lanceolata and Anthoxanthum Odoratum in a Natural. J. Ecol. 1983, 71, 379–390. [Google Scholar] [CrossRef]
  8. Berendse, F. Competition between Plant Populations with Different Rooting Depths II. Pot Experiments. Oecologia 1981, 48, 334–341. [Google Scholar] [CrossRef] [PubMed]
  9. Levine, J.M.; HilleRisLambers, J. The importance of niches for the maintenance of species diversity. Nature 2009, 461, 254–257. [Google Scholar] [CrossRef]
  10. Gersani, M.; Arbramsky, Z.; Falik, O. Density-dependent habitat selection in plants. Evolut. Ecol. 1998, 12, 223–234. [Google Scholar] [CrossRef]
  11. Semchenko, M.; John, E.A.; Hutchings, M.J. Effects of physical connection and genetic identity of neighbouring ramets on root-placement patterns in two clonal species. New Phytol. 2007, 176, 644–654. [Google Scholar] [CrossRef]
  12. Mommer, L.; van Ruijven, J.; de Caluwe, H.; Smit-Tiekstra, A.E.; Wagemaker, C.A.; Joop Ouborg, N.; Bögemann, G.M.; van der Weerden, G.M.; Berendse, F.; de Kroon, H. Unveiling below-ground species abundance in a biodiversity experiment: A test of vertical niche differentiation among grassland species. J. Ecol. 2010, 98, 1117–1127. [Google Scholar] [CrossRef]
  13. Schwinning, S.; Parsons, A.J. Analysis of the Coexistence Mechanisms for Grasses and Legumes in Grazing Systems. J. Ecol. 1966, 84, 799–813. [Google Scholar] [CrossRef]
  14. Del Río, M.; Pretzsch, H.; Ruíz-Peinado, R.; Ampoorter, E.; Annighöfer, P.; Barbeito, I.; Bielak, K.; Brazaitis, G.; Coll, L.; Drössler, L.; et al. Species interactions increase the temporal stability of community productivity in Pinus sylvestris-Fagus sylvatica mixtures across Europe. J. Ecol. 2017, 105, 1032–1043. [Google Scholar] [CrossRef] [Green Version]
  15. Dennis, W.D.; Woledge, J. The effect of nitrogen in spring on shoot number and leaf area of white clover in mixtures. Grass Forage Sci. 1987, 42, 265–269. [Google Scholar] [CrossRef]
  16. Davidson, I.A.; Robson, M.J. Short-term effects of nitrogen on the growth and nitrogen nutrition of small swards of white clover and perennial ryegrass in spring. Grass Forage Sci. 1990, 45, 413–421. [Google Scholar] [CrossRef]
  17. Streit, J.; Meinen, C.; Rauber, R. Intercropping effects on root distribution of eight novel winter faba bean genotypes mixed with winter wheat. Field Crop. Res. 2019, 235, 1–10. [Google Scholar] [CrossRef]
  18. Streit, J.; Meinen, C.; Nelson, W.C.D.; Siebrecht-Schöll, D.J.; Rauber, R. Above- and belowground biomass in a mixed cropping system with eight novel winter faba bean genotypes and winter wheat using FTIR spectroscopy for root species discrimination. Plant Soil 2019, 436, 141–158. [Google Scholar] [CrossRef]
  19. Lynch, J.P. Root Architecture and Plant Productivity. Plant Physiol. 1995, 109, 7–13. [Google Scholar] [CrossRef] [PubMed]
  20. Robinson, D.; Hodge, A.; Griffiths, B.S.; Fitter Alastair, H. Plant Root Proliferation in Nitrogen-Rich Patches Confers Competitive Advantage. Proc. Biol. Sci. 1999, 226, 431–435. [Google Scholar] [CrossRef] [Green Version]
  21. Shi, R.; Junker, A.; Seiler, C.; Altmann, T. Phenotyping roots in darkness: Disturbance-free root imaging with near infrared illumination. Funct. Plant Biol. 2018, 45, 400–411. [Google Scholar] [CrossRef] [Green Version]
  22. Mueller, K.E.; Tilman, D.; Fornara, D.A.; Hobbie, S.E. Root depth distribution and the diversity-productivity relationship in a long-term grassland experiment. Ecology. 2013, 94, 787–793. [Google Scholar] [CrossRef] [Green Version]
  23. Frame, J.; Newbould, P. Agronomy of white clover. Adv. Agron. 1986, 40, 1–88. [Google Scholar] [CrossRef]
  24. Lane, L.A.; Ayres, J.F.; Lovett, J.V. The pastoral significance, adaptive characteristics, and grazing value of white clover (Trifolium repens L.) in dryland environments in Australia: A review. Aust. J. Exp. Agric. 2000, 40, 1033. [Google Scholar] [CrossRef]
  25. Marshall, A.H.; Collins, R.P.; Humphreys, M.W.; Scullion, J. A new emphasis on root traits for perennial grass and legume varieties with environmental and ecological benefits. Food Energy Secur. 2016, 5, 26–39. [Google Scholar] [CrossRef] [PubMed] [Green Version]
  26. Li, L.; Sun, J.; Zhang, F.; Guo, T.; Bao, X.; Smith, F.A.; Smith, S.E. Root distribution and interactions between intercropped species. Oecologia 2006, 147, 280–290. [Google Scholar] [CrossRef] [PubMed]
  27. Vinther, F.P. Effects of cutting frequency on plant production, N-uptake and N2 fixation in above- and below-ground plant biomass of perennial ryegrass–white clover swards. Grass Forage Sci. 2006, 61, 154–163. [Google Scholar] [CrossRef]
  28. Naumann, A.; Heine, G.; Rauber, R. Efficient discrimination of oat and pea roots by cluster analysis of Fourier transform infrared (FTIR) spectra. Field Crop. Res. 2010, 119, 78–84. [Google Scholar] [CrossRef]
  29. Meinen, C.; Rauber, R. Root discrimination of closely related crop and weed species using FT MIR-ATR spectroscopy. Front. Plant Sci. 2015, 765. [Google Scholar] [CrossRef] [PubMed] [Green Version]
  30. Legner, N.; Meinen, C.; Rauber, R. Root Differentiation of Agricultural Plant Cultivars and Proveniences Using FTIR Spectroscopy. Front. Plant Sci. 2018, 748. [Google Scholar] [CrossRef] [PubMed] [Green Version]
  31. Heshmati, S.; Tonn, B.; Isselstein, J. White clover population effects on the productivity and yield stability of mixtures with perennial ryegrass and chicory. Field Crop. Res. 2020, 252, 107802. [Google Scholar] [CrossRef]
  32. De Wit, C.T. On competition. Versl. Landbouwk. Onderzoek. 1960, 66, 1–82. [Google Scholar]
  33. De Wit, C.T.; van den Bergh, J.P. Competition between herbage plants. Neth. J. Agric. Sci. 1965, 13, 212–221. [Google Scholar] [CrossRef]
  34. Gale, M.R.; Grigal, D.F. Vertical root distributions of northern tree species in relation to successional status. Can. J. For. Res. 1987, 829–834. [Google Scholar] [CrossRef]
  35. Jackson, R.B.; Canadell, J.; Ehleringer, J.R.; Mooney, H.A.; Sala, O.E.; Schulze, E.D. A global analysis of root distributions for terrestrial biomes. Oecologia 1996, 108, 389–411. [Google Scholar] [CrossRef]
  36. DWD—Climate Data Center. Climate Data Center (CDC)—German Meteorological Service (DWD). 2020. Available online: https://cdc.dwd.de/portal/ (accessed on 12 February 2020).
  37. Schils, R.; Vellinga, T.V.; Kraak, T. Dry-matter yield and herbage quality of a perennial ryegrass/white clover sward in a rotational grazing and cutting system. Grass Forage Sci. 1999, 54, 19–29. [Google Scholar] [CrossRef]
  38. Elgersma, A.; Nassiri, M.; Schlepers, H. Competition in perennial ryegrass–white clover mixtures under cutting. 1. Dry-matter yield, species composition and nitrogen fixation. Grass Forage Sci. 1998, 53, 353–366. [Google Scholar] [CrossRef]
  39. Elgersma, A.; Schlepers, H. Performance of white clover/perennial ryegrass mixtures under cutting. Grass Forage Sci. 1997, 52, 134–146. [Google Scholar] [CrossRef]
  40. Goh, K.M.; Bruce, G.E. Comparison of biomass production and biological nitrogen fixation of multi-species pastures (mixed herb leys) with perennial ryegrass-white clover pasture with and without irrigation in Canterbury, New Zealand. Agric. Ecosyst. Environ. 2005, 110, 230–240. [Google Scholar] [CrossRef]
  41. Li, Z.; Peng, Y.; Ma, X. Different response on drought tolerance and post-drought recovery between the small-leafed and the large-leafed white clover (Trifolium repens L.) associated with antioxidative enzyme protection and lignin metabolism. Acta Physiol. Plant. 2013, 35, 213–222. [Google Scholar] [CrossRef]
  42. Lucero, D.W. Water deficit and plant competition effects on growth and water-use efficiency of white clover (Trifolium repens, L.) and ryegrass (Lolium perenne, L.). Plant Soil 2000, 227, 1–15. [Google Scholar] [CrossRef]
  43. Ren, H.; Gao, T.; Hu, J.; Yang, G. The effects of arbuscular mycorrhizal fungi and root interaction on the competition between Trifolium repens and Lolium perenne. PeerJ 2017, 5, e4183. [Google Scholar] [CrossRef] [Green Version]
  44. Siebenkäs, A.; Roscher, C. Functional composition rather than species richness determines root characteristics of experimental grasslands grown at different light and nutrient availability. Plant Soil 2016, 404, 399–412. [Google Scholar] [CrossRef]
  45. Crush, J.R.; Easton, H.S.; Waller, J.E.; Hume, D.E.; Faville, M.J. Genotypic variation in patterns of root distribution, nitrate interception and response to moisture stress of a perennial ryegrass (Lolium perenne L.) mapping population. Grass Forage Sci. 2007, 62, 265–273. [Google Scholar] [CrossRef]
  46. Thorup-Kristensen, K. Are differences in root growth of nitrogen catch crops important for their ability to reduce soil nitrate-N content, and how can this be measured? Plant Soil 2001, 230, 185–195. [Google Scholar] [CrossRef]
  47. Thorup-Kristensen, K. Effect of deep and shallow root systems on the dynamics of soil inorganic N during 3-year crop rotations. Plant Soil 2006, 288, 233–248. [Google Scholar] [CrossRef]
  48. Crush, J.R.; Waller, J.E.; Care, D.A. Root distribution and nitrate interception in eleven temperate forage grasses. Grass Forage Sci. 2005, 60, 385–392. [Google Scholar] [CrossRef]
  49. Wardle, D.A.; Peltzer, D.A. Interspecific interactions and biomass allocation among grassland plant species. Oikos 2003, 100, 497–506. [Google Scholar] [CrossRef]
  50. Shmida, A.; Ellner, S. Coexistence of Plant Species with Similar Niches. Vegetatio 1984, 58, 29–55. [Google Scholar]
  51. Chesson, P. A need for niches? Trends Ecol. Evol. 1991, 6, 26–28. [Google Scholar] [CrossRef]
  52. Rasmussen, J.; Gylfadóttir, T.; Loges, R.; Eriksen, J.; Helgadóttir, Á. Spatial and temporal variation in N transfer in grass–white clover mixtures at three Northern European field sites. Soil Biol. Biochem. 2013, 57, 654–662. [Google Scholar] [CrossRef]
  53. Dhamala, N.R.; Rasmussen, J.; Carlsson, G.; Søegaard, K.; Eriksen, J. N transfer in three-species grass-clover mixtures with chicory, ribwort plantain or caraway. Plant Soil 2017, 413, 217–230. [Google Scholar] [CrossRef] [Green Version]
  54. Jensen, E.S. Grain yield, symbiotic N2 fixation and interspecific competition for inorganic N in pea-barley intercrops. Plant Soil 1996, 182, 25–38. [Google Scholar] [CrossRef]
  55. Suter, M.; Connolly, J.; Finn, J.A.; Loges, R.; Kirwan, L.; Sebastià, M.-T.; Lüscher, A. Nitrogen yield advantage from grass-legume mixtures is robust over a wide range of legume proportions and environmental conditions. Glob. Chang. Biol. 2015, 21, 2424–2438. [Google Scholar] [CrossRef] [PubMed] [Green Version]
  56. Høgh-Jensen, H.; Schjoerring, J.K. Below-ground nitrogen transfer between different grassland species: Direct quantification by 15N leaf feeding compared with indirect dilution of soil 15N. Plant Soil 2000, 227, 171–183. [Google Scholar] [CrossRef]
  57. Jørgensen, F.V.; Jensen, E.S.; Schjoerring, J.K. Dinitrogen fixation in white clover grown in pure stand and mixture with ryegrass estimated by the immobilized 15N isotope dilution method. Plant Soil 1999, 208, 293–305. [Google Scholar] [CrossRef]
  58. Xiao-Qing, T.U.O.; Li, H.E.; Ying-Ning, Z.O.U. Alleviation of Drought Stress in White Clover after Inoculation with Arbuscular Mycorrhizal Fungi. Not. Bot. Horti Agrobot. Cluj-Napoca 2017, 45, 220–224. [Google Scholar] [CrossRef] [Green Version]
  59. Husse, S.; Huguenin-Elie, O.; Buchmann, N.; Lüscher, A. Larger yields of mixtures than monocultures of cultivated grassland species match with asynchrony in shoot growth among species but not with increased light interception. Field Crop. Res. 2016, 194, 1–11. [Google Scholar] [CrossRef]
  60. Collins, R.P.; Rhodes, I. Influence of root competition on compatibility between white clover and perennial ryegrass populations during seedling establishment. Grass Forage Sci. 1994, 49, 506–509. [Google Scholar] [CrossRef]
  61. Davidson, I.A.; Robson, M.J. Effect of Nitrogen Supply on the Grass and Clover Components of Simulated Mixed Swards Grown under Favourable Environmental Conditions II. Nitrogen Fixation and Nitrate Uptake. Ann. Bot. 1985, 55, 697–703. [Google Scholar] [CrossRef]
Figure 1. (a) Aboveground biomass and (b) root biomass (0–60 cm) in 2015, 2016, and 2018 of monocultures of unfertilized perennial ryegrass (PR) and white clover (WC) and white clover–perennial ryegrass mixtures (WC_PR). Shown are means and standard errors averaged over all eight genotypes with four replicate samplings (n = 4). The results of the mixed models on the significance of the effect of the cultivated crop (TREAT) and year (YEAR) are indicated by asterisks (*** for p ≤ 0.001). Different uppercase letters indicate significant differences (** p ≤ 0.05, LSD post hoc test) between different treatments and years.
Agriculture 11 00206 g001
Figure 2. Root length density of 2015, 2016, and 2018 of monocultures of unfertilized perennial ryegrass (PR), white clover (WC), and white clover–ryegrass mixtures (WC_PR). Shown are means and standard errors for all eight genotypes and four replicate samplings (n = 4). The results of the mixed models on the significance of the effect of the mixture or monoculture system (TREAT) and year (YEAR) are indicated by asterisks (*** for p ≤ 0.001).
Agriculture 11 00206 g002
Figure 3. Vertical root distribution in (a) 2015, (b) 2016, and (c) 2018 of monocultures of unfertilized perennial ryegrass (PR), white clover (WC), and mixed stands of perennial ryegrass (PR_mix) and white clover (WC_mix). Average values of all WC genotypes are presented. Shown are fits of vertical root distribution (β-values), according to [27]. R2 was 1.00 in all fits.
Agriculture 11 00206 g003
Table 1. One-factorial ANOVA on the significance of the effect of eight different white clover (WC) (WC1–WC8) genotypes on the variance of aboveground biomass, belowground biomass, and root length density of WC1–WC8 monocultures and mixtures of white clover–perennial ryegrass (PR) (WC1_PR–WC8_PR) for 2015, 2016, and 2018. Significance was given at p ≤ 0.05.
YearAboveground BiomassBelowground BiomassRoot Length Density
FpFpFp
WC1–WC820151.580.192.000.100.930.50
20161.490.221.360.270.580.76
20182.140.081.260.310.980.47
WC1_PR–WC8_PR20150.530.801.550.201.540.20
20162.100.080.250.971.020.45
20180.960.481.580.190.910.52
Table 2. Two-factorial analyses of a mixed model on the significance of the effects of mixture or monoculture system (TREAT), year (YEAR), and their interaction (TREAT:YEAR) on the variance of aboveground biomass, belowground biomass, and root length density (RLD) of the species sum white clover and perennial ryegrass.
Aboveground BiomassBelowground BiomassRoot Length Density
FpFpFp
TREAT15.7≤0.0001260.2≤0.0001613.6≤0.0001
YEAR64.3≤0.000127.6≤0.0001165.4≤0.0001
TREAT:YEAR8.7≤0.00014.6≤0.00153.5≤0.0001
Table 3. Relative shoot and root yields of white clover (RYWC, n = 4), perennial ryegrass (RYPR, n = 4), and relative yield total (RYT, n = 4) of the averaged eight white clover genotypes in mixture with perennial ryegrass (WC1_PR–WC8_PR) for 2015, 2016, and 2018. Given are means and standard errors. Asterisks indicate values significantly different from 0.4 for RYWC, 0.6 for RYPR and 1 for RYT (p ≤ 0.05, t-test). RYT = relative yield total.
201520162018Average
RY WCRY PRRYTRY WCRY PRRYTRY WCRY PRRYTRY WCRY PRRYT
Shoot Yield0.17 * ± 0.041.36 * ± 0.09 1.53 * ± 0.12 0.46 ± 0.08 1.28 * ± 0.17 1.74 * ± 0.18 0.07 * ± 0.01 2.26 * ± 0.20 2.33 * ± 0.19 0.23 * ± 0.02 1.63 * ± 0.14 1.87 * ± 0.24
Root Yield0.55 ± 0.06 1.00 ± 0.15 1.55 * ± 0.15 0.90 * ± 0.09 0.65 ± 0.09 1.56 * ± 0.14 0.65 ± 0.11 0.86 * ± 0.02 1.50 * ± 0.12 0.70 ± 0.04 0.84 * ± 0.06 1.54 ± 0.02
Publisher’s Note: MDPI stays neutral with regard to jurisdictional claims in published maps and institutional affiliations.

