Article

Methodology of Analyzing Maize Density Loss in Smallholder’s Fields and Potential Optimize Approach

1
National Academy of Agriculture Green Development, Department of Plant Nutrition, College of Resources and Environmental Sciences, China Agricultural University, Beijing 100193, China
2
College of Resources and Environmental Science, Hebei Agricultural University, Baoding 071000, China
*
Author to whom correspondence should be addressed.
Agriculture 2021, 11(6), 480; https://doi.org/10.3390/agriculture11060480
Submission received: 4 April 2021 / Revised: 18 May 2021 / Accepted: 20 May 2021 / Published: 24 May 2021

Abstract

:
Increasing plant density is a key measure to close the maize (Zea mays L.) yield gap and ensure food security. However, there is a large plant density difference in the fields sown by agronomists and smallholders. The primary cause of this phenomenon is the lack of an effective methodology to systematically analyze the density loss. To identify the plant density loss processes from experimental plots to smallholder fields, a research methodology was developed in this study involving a farmer survey and measurements in a smallholder field. The results showed that the sowing density difference caused by farmer decision-making and plant density losses caused by mechanical and agronomic factors explained 15.5%, 5.5% and 6.8% of the plant density difference, respectively. Changing smallholder attitudes toward the value of increasing the plant density could help reduce this density loss and increase farm yields by 12.3%. Therefore, this methodology was effective for analyzing the plant density loss, and to clarify the primary causes of sowing density differences and plant density loss. Additionally, it was beneficial to identify the priorities and stakeholders who share responsibility for reducing the density loss. The methodology has wide applicability to address the sowing density differences and plant density loss in other areas to narrow crop yield gaps and ensure food security.

1. Introduction

The maize (Zea mays L.) yield must increase greatly to meet the growing demands for food, feed, fiber and biofuels from a growing global population [1]. However, the yield has been stagnating in China, which currently produces more than a fifth of the world’s maize [2]. Farmers only achieve 58–65% of the yield potential [3]. There is a significant gap between the yield potential and actual yields due to climate, soil and poor agronomic practices, especially in areas where smallholders dominate agricultural production [4,5,6,7]. Smallholders (cultivated area <0.7 ha) comprise 70% of the country’s arable land [8]. Therefore, closing this yield gap for smallholders is of great significance for food security in China and the rest of the world [9,10].
It has been demonstrated previously that optimizing agronomic practices [11], especially the sowing density [6,10,12], was a priority to close the crop yield gap. Increasing the plant density within a certain range can maximize the use of light, water and heat [13,14] and significantly increase the leaf area index and dry matter accumulation in maize [15,16], achieving the maximum grain yield per unit area. Through developing hybrids of density-tolerant genotypes, and optimized water and fertilizer management, agronomists have improved the potential of increasing the plant density [1,17]. However, the current average plant density in China is less than 60,000 plants ha−1, which is far below the optimal range of 75,000 to 120,000 plants ha−1 [1,12,18,19]. Closing the gap could substantially improve the maize yield [10]. This requires understanding the process and causes of plant density loss in order to develop targeted solutions.
From sowing to harvest, there are many factors that can lead to plant density losses. Before sowing, farmers usually advise the seeder driver of their desired sowing density. Then, the driver sets the interplant distance by adjusting the seeder before sowing. In this process, farmer decision-making, the type and quality of the seeder and the experienced operator affect the final sowing density [20]. In addition, soil factors (e.g., water content), seed quality (e.g., germination rate) and the use of herbicides also affect seedling emergence after sowing [19,21]. Finally, poor management practices in water and fertilizer applications and plant protection can further reduce the final plant density [22].
However, at present, there were only a few individual aspects attempts to improve the sowing quality. For example, Huang et al. [20] developed a straw displacement and anti-blocking maize precision direct seeder, which reduced the density loss in the process of sowing. The density differences and losses caused by farmer decisions and poor management practices were ignored [19]. In addition, there were great differences in the psychological determinants and management practices of smallholders due to the variations of individual characteristics and household characteristics [23,24]; the soil and seeder types were different in different areas. Therefore, the main loss paths and root causes of density losses were different in different regions and farmers. This requires that the whole process must be diagnosed and analyzed to clarify the priorities reducing density loss. Unfortunately, there is a lack of an effective method to demonstrate the impact of contributors to the sowing density difference and plant density loss from sowing to harvest and to systematically analyze the primary cause of the sowing density difference and plant density loss. The application of this method is very important for reducing the density loss and increasing the yield.
The North China Plain is one of the largest maize-producing areas in China, producing one-third of the country’s maize, and it is also a typical area where smallholders predominate in the agricultural landscape [25]. The aim of this paper is to propose a systematic analysis methodology (Figure 1) for the sowing density difference and plant density loss assessment in order to facilitate a comprehensive understanding of the process of density loss. In this framework, the sowing density difference and plant density loss was divided into three categories: the difference caused by decision-making and the loss caused by mechanical and agronomic factors. The sowing density difference and plant density loss pathways of maize were quantified by combining experimental and farmer field data on the North China Plain to verify the applicability and effectiveness of the methodology. The primary causes of the differences and loss in each path were analyzed. These findings will help to develop specific measures to reduce the density loss, improve the average yields and narrow the maize yield gap.

2. Materials and Methods

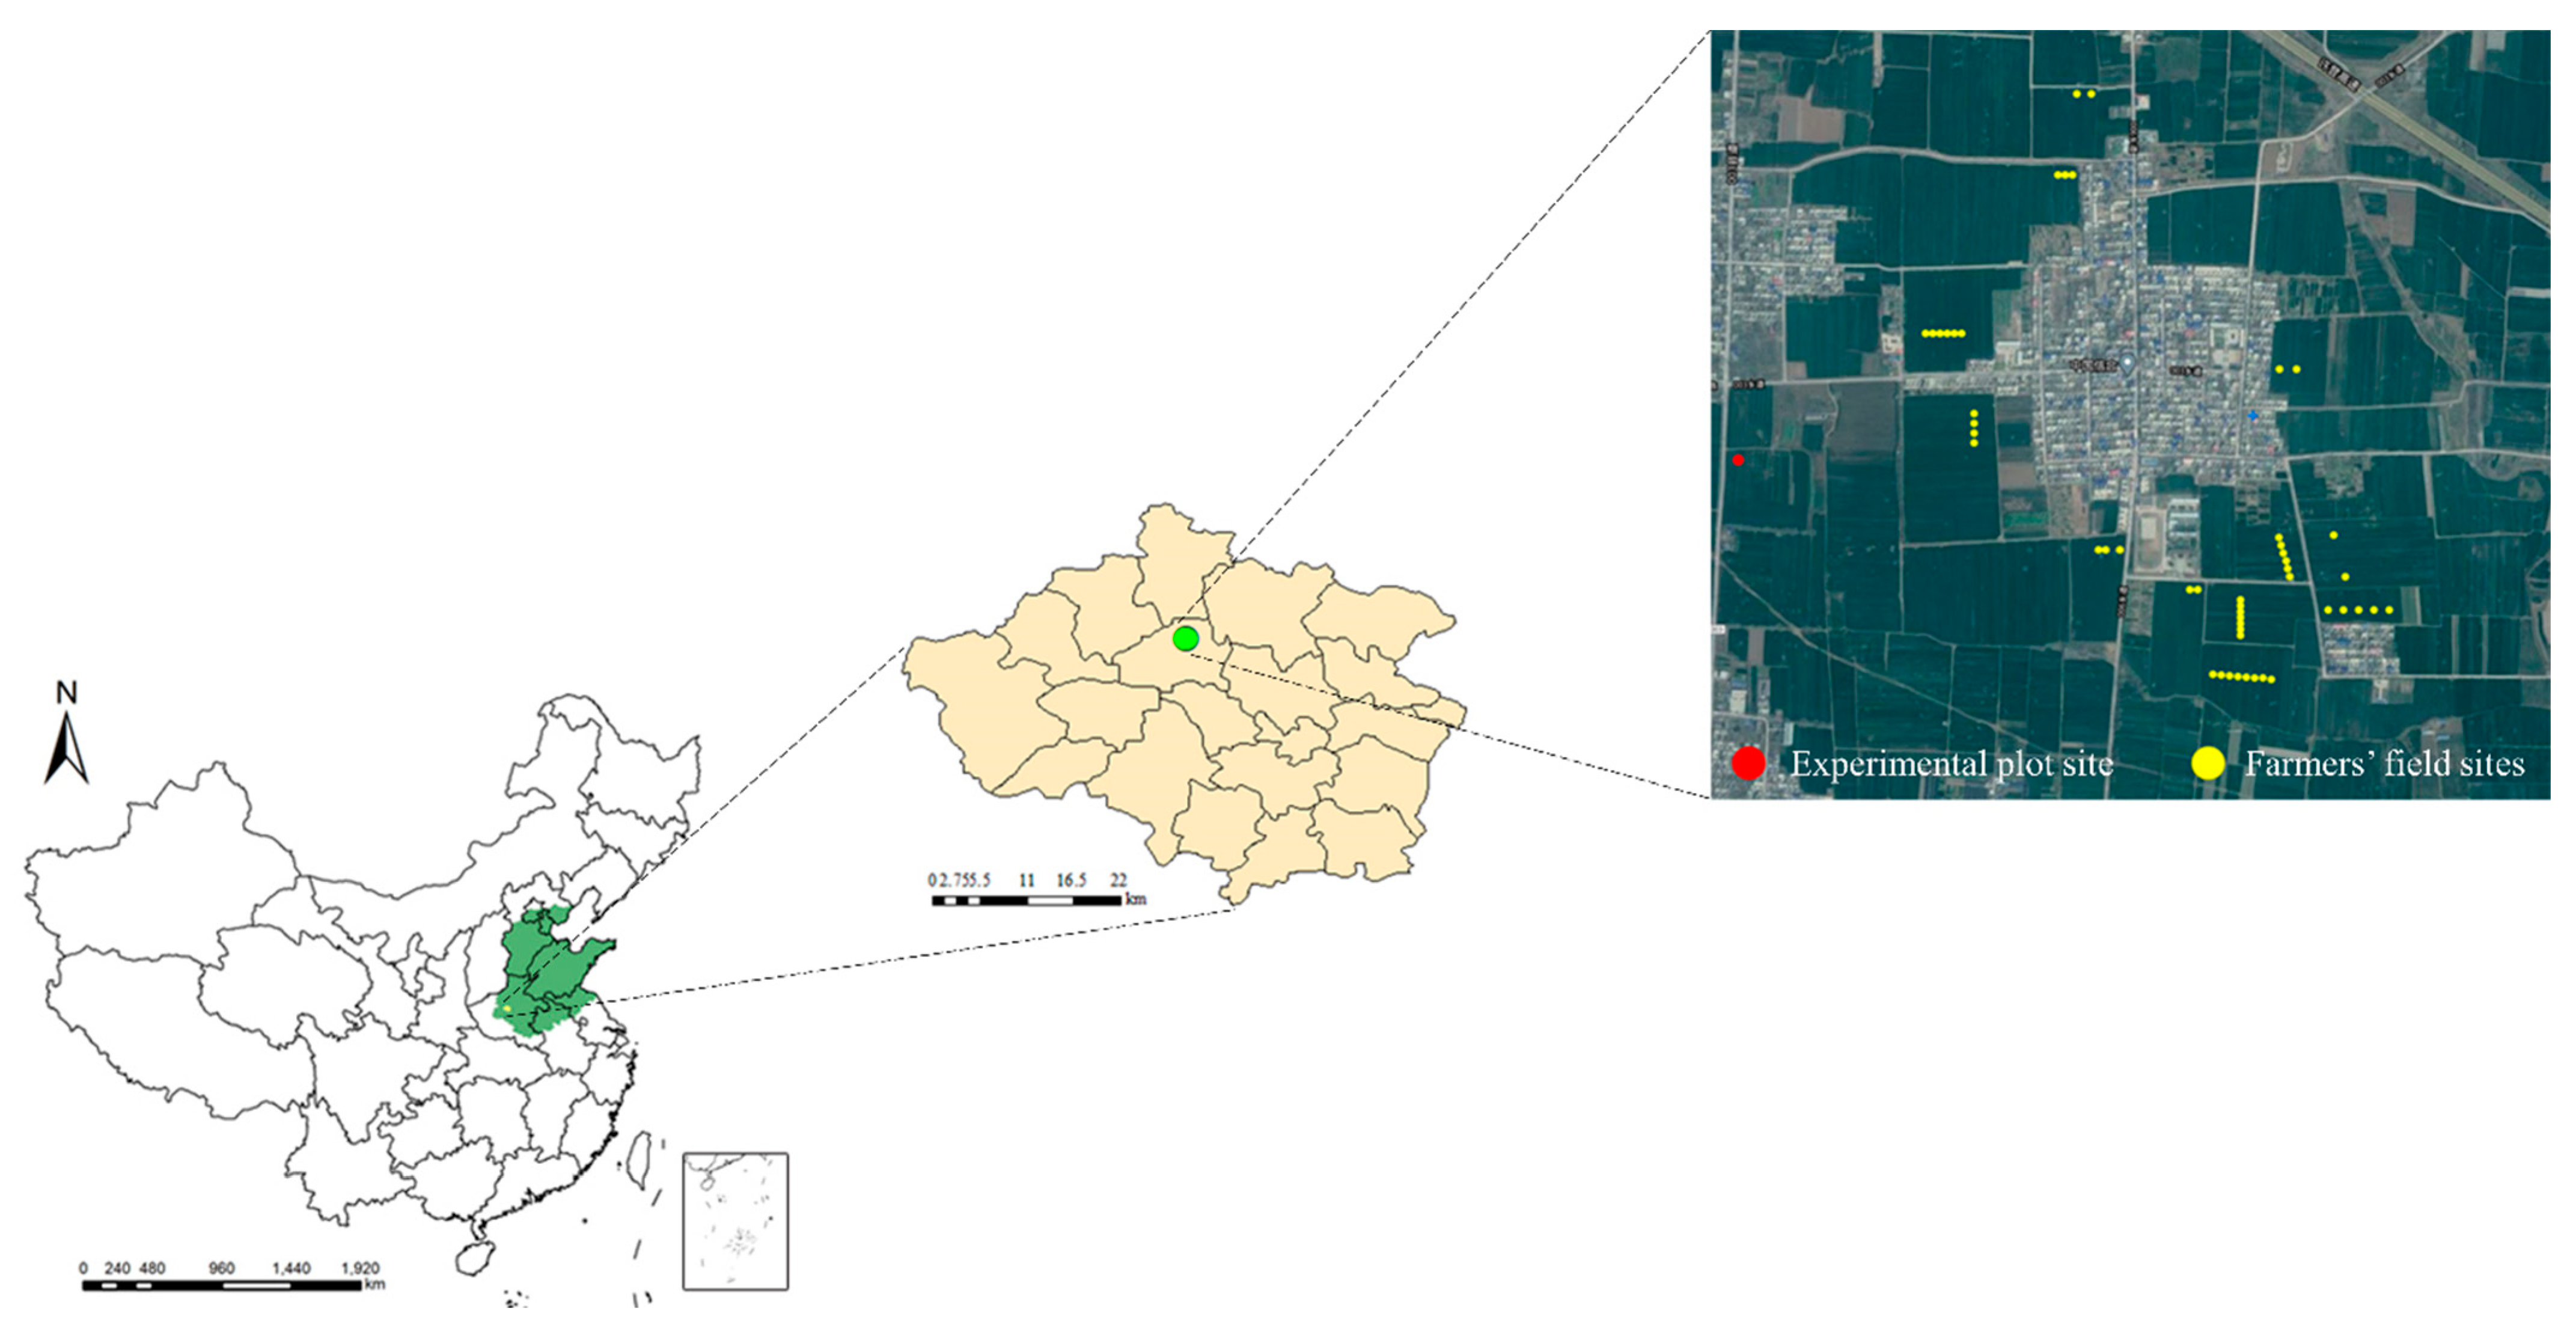
2.1. Study Area 0′27″

The study was conducted in representative counties that mainly produce wheat (Triticum aestivum L.) and maize on the North China Plain: Kangcheng Village, Yuzhou County, Henan Province (34°27′ N and 113°34′ E, 66.8 masl) (Figure 2). The climate in this area is a semihumid and semiarid monsoon climate. Maize is planted in early June, harvested in late September and, then, wheat is planted. The soil type is Calcaric Cambisols [26]. The basic properties of the surface layer soil (0–20 cm) are pH 8.2, 25 g kg−1 for organic matter, 1.2 g kg−1 for total N, 15 mg kg−1 for available P and 150 mg kg−1 for available K.

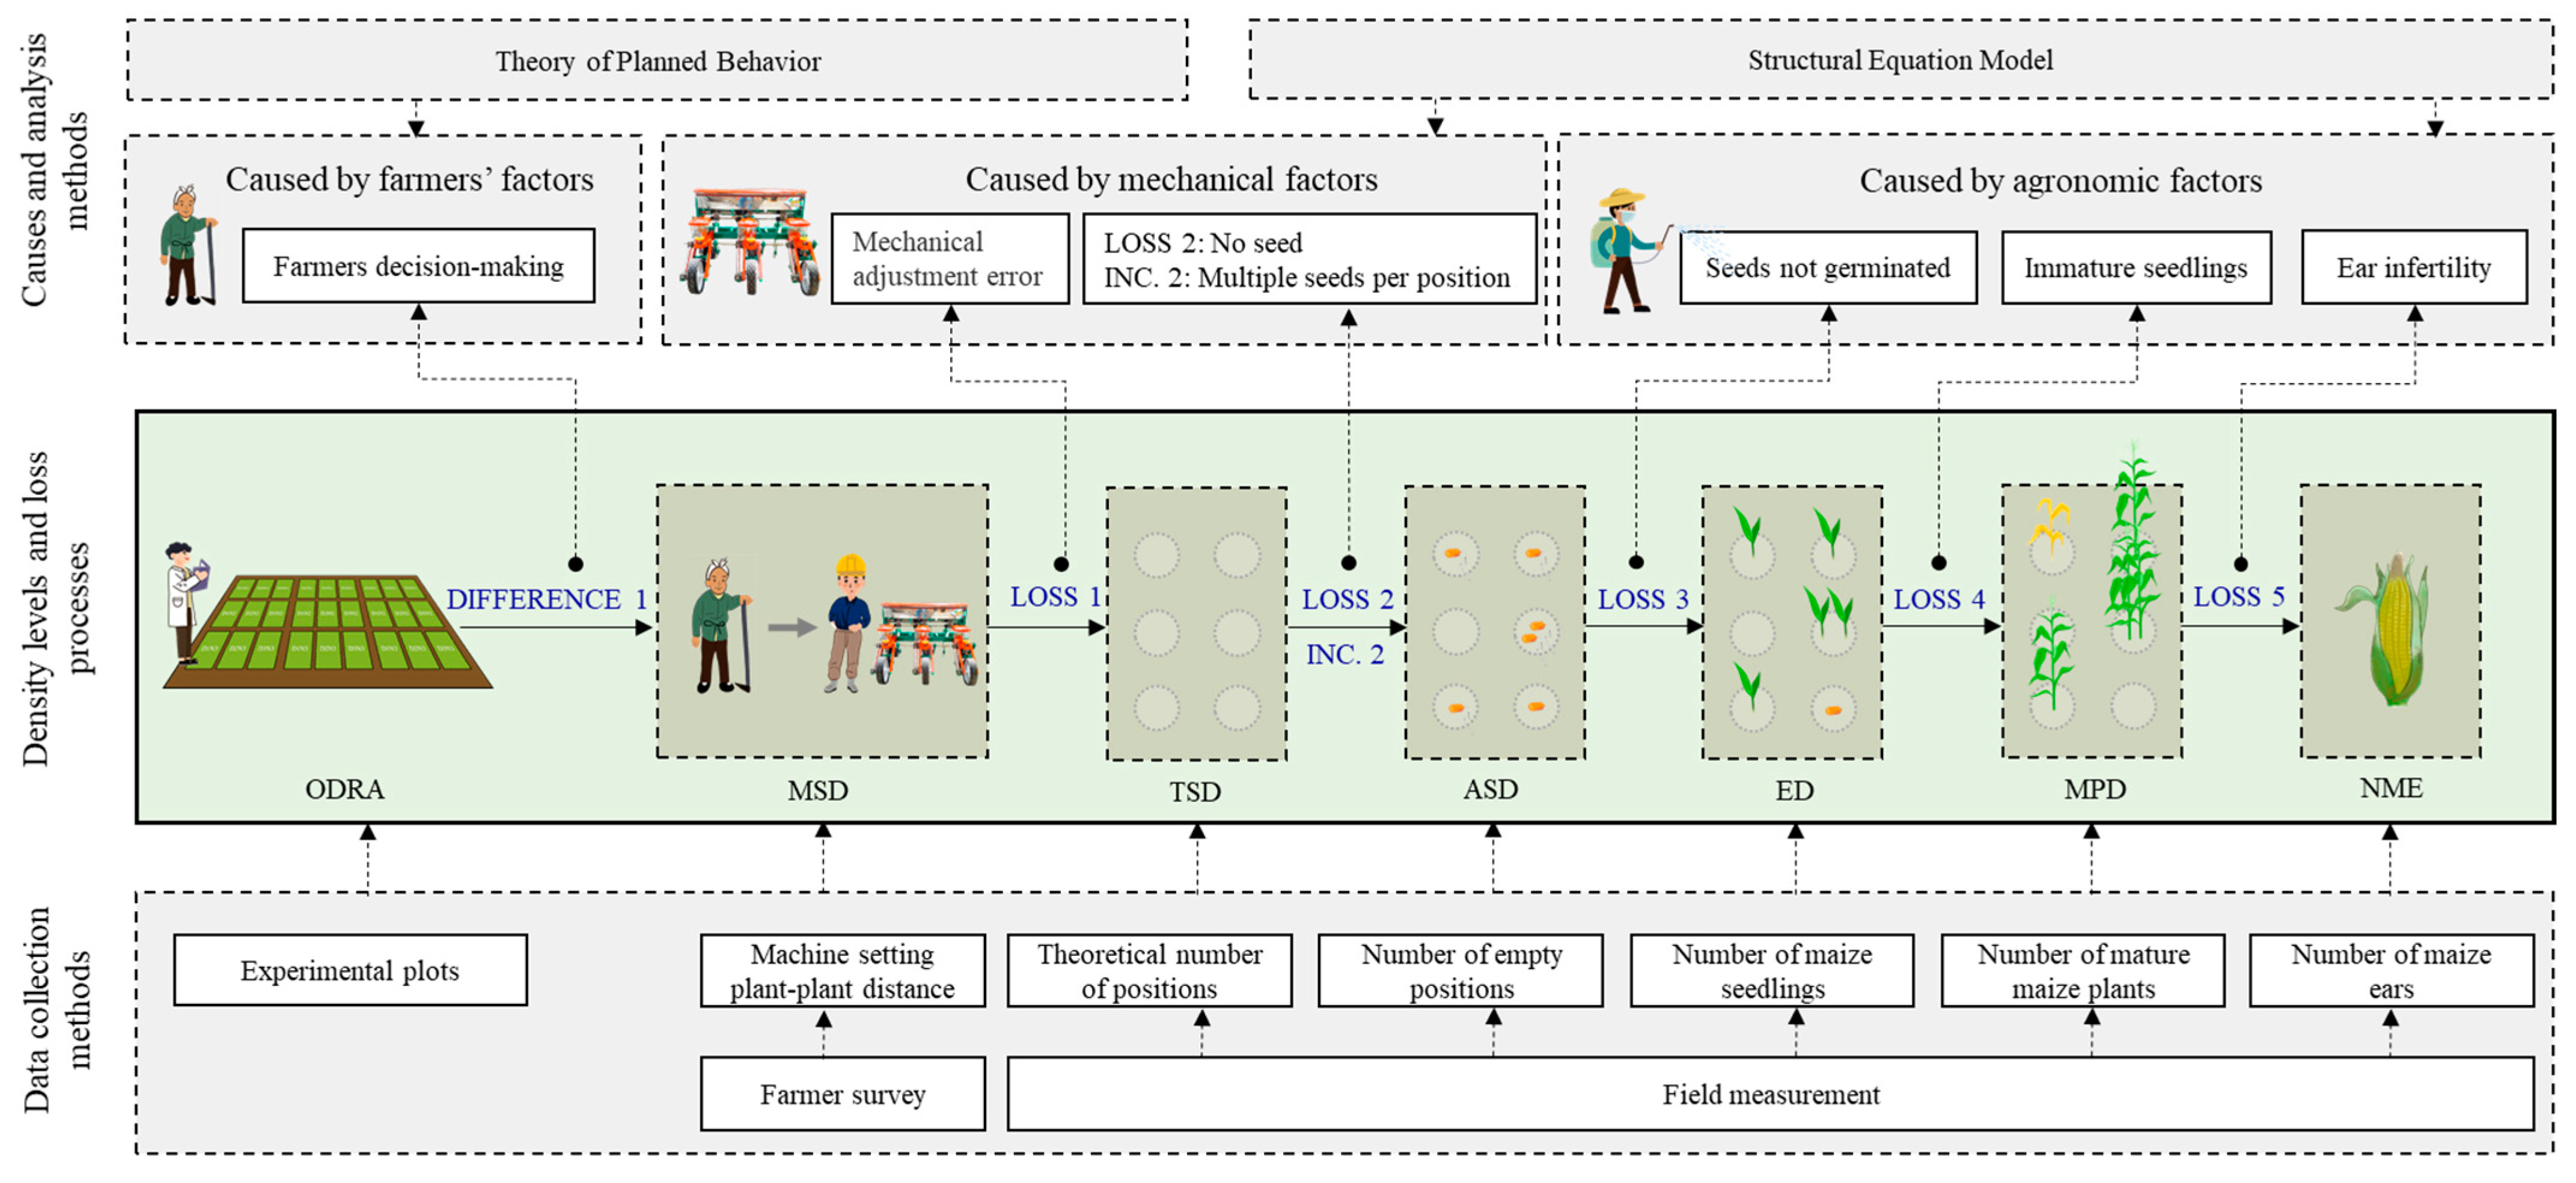
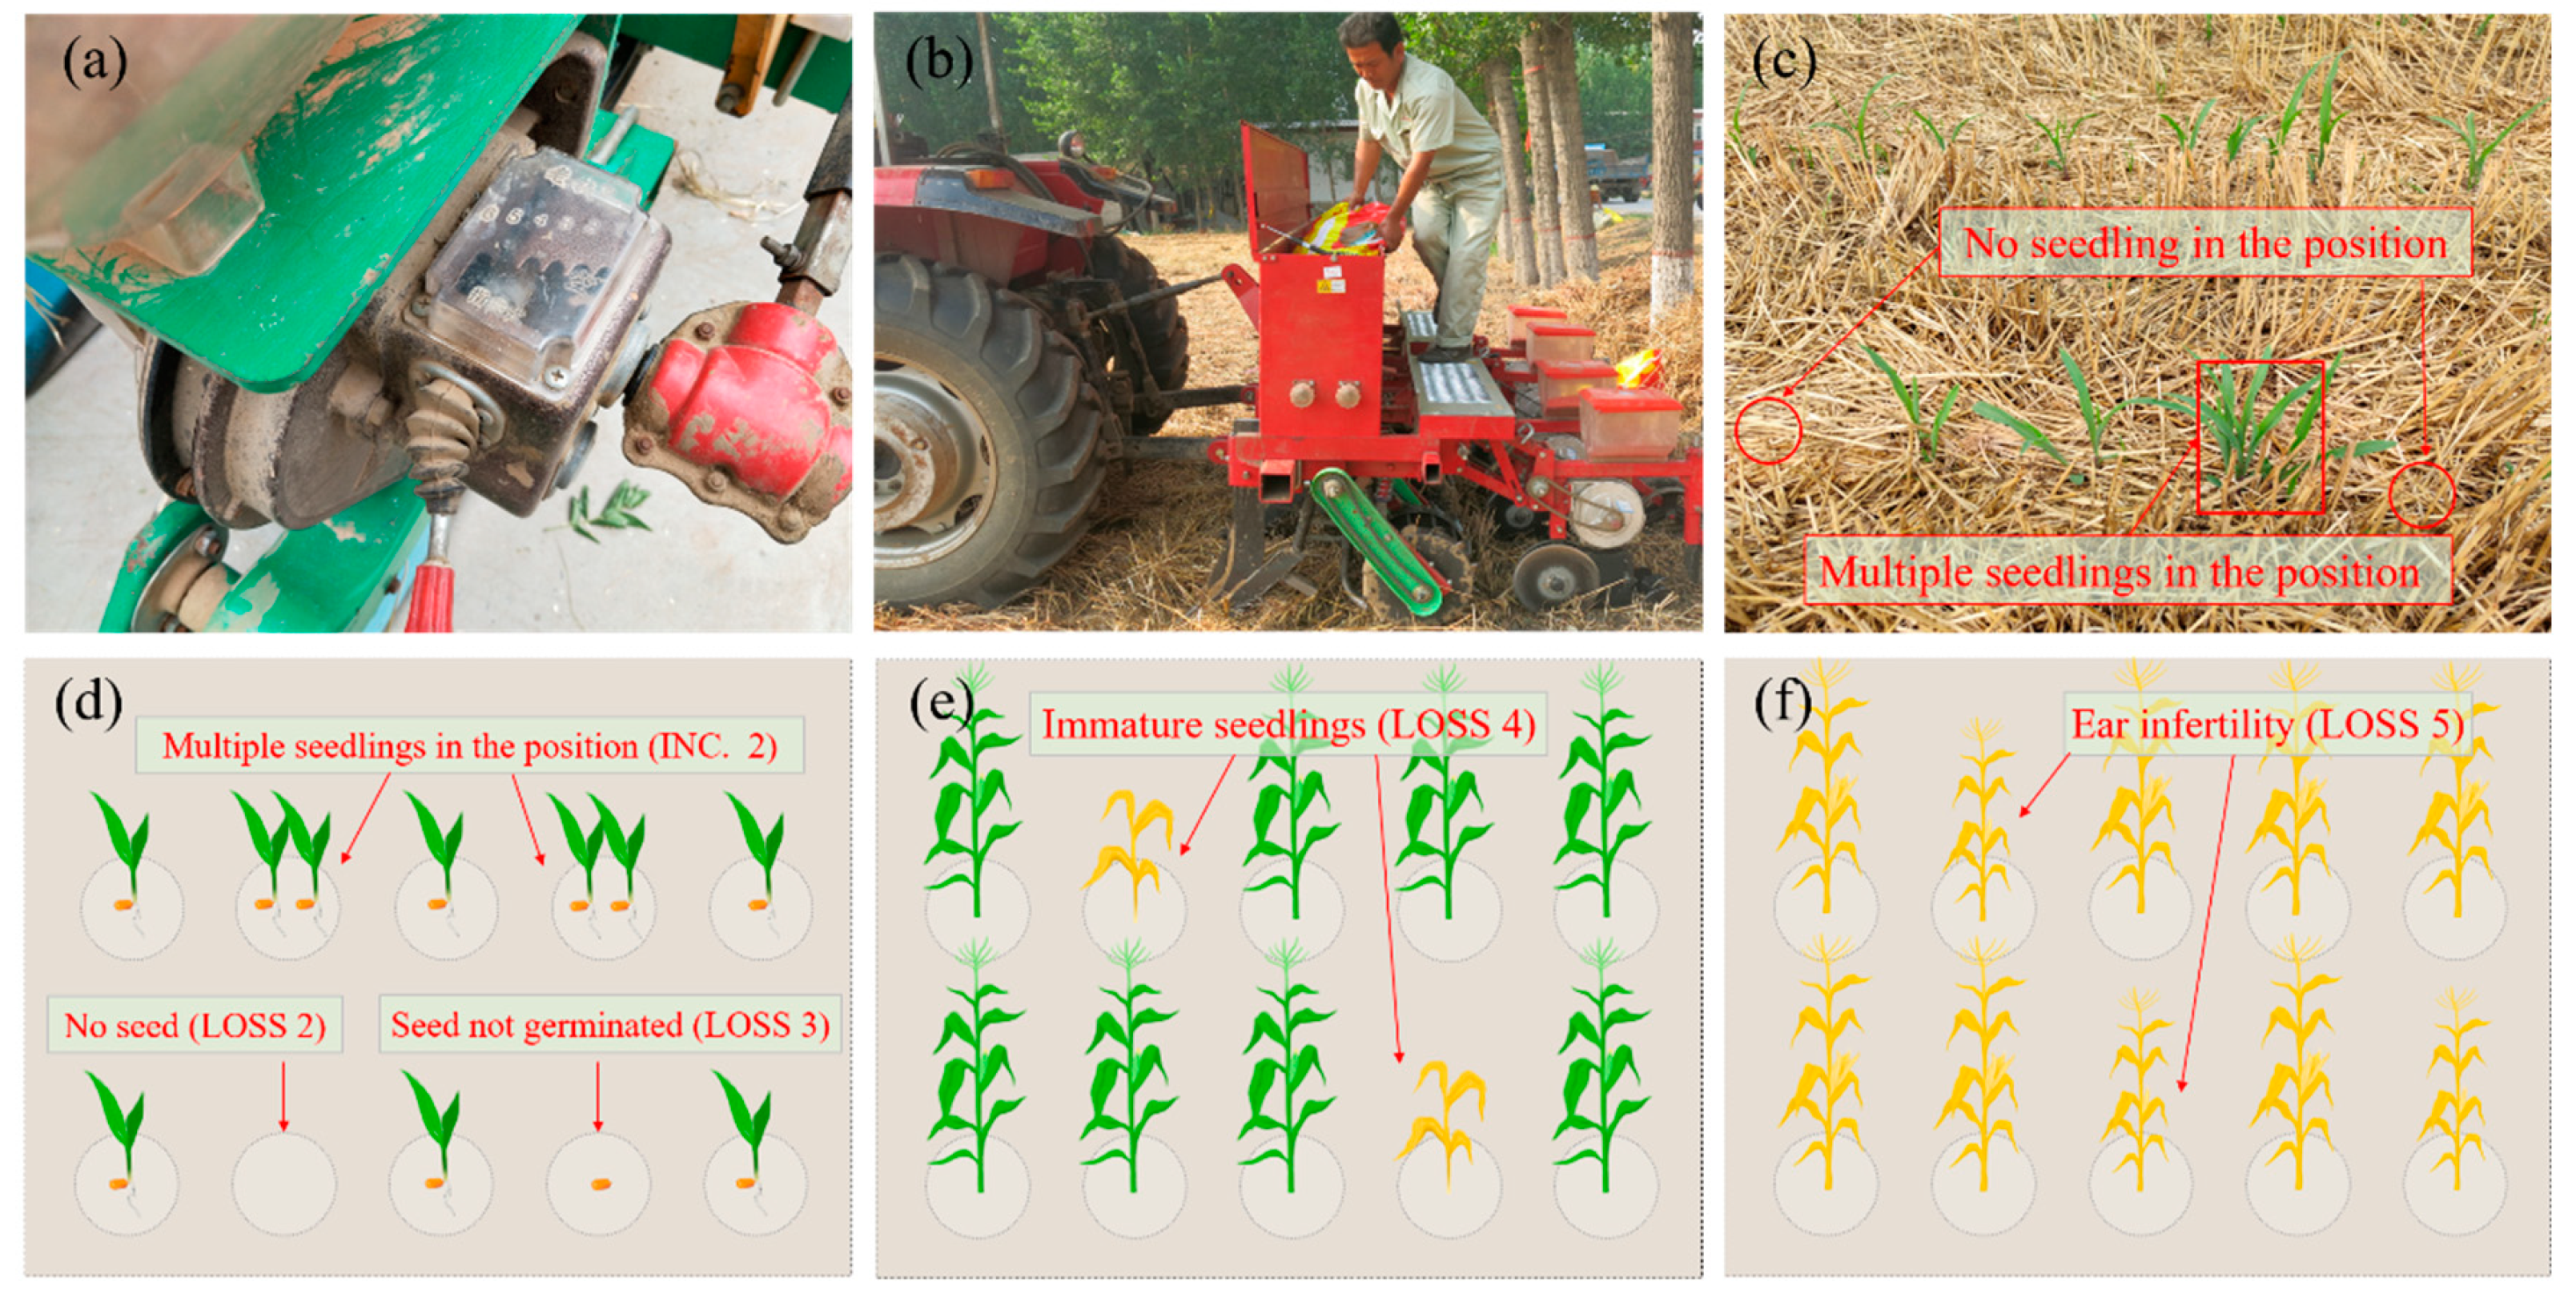
2.2. Measurement Methods of Density Loss and Data Collection

To quantify the processes involved in the plant density loss in maize and to explore the causes of plant density differences from the density recommended by agronomists to the harvest plant density in smallholder fields, 50 farmer fields were randomly selected in Kangcheng Village from June to October in 2019 for the research samples. Three plots (2.4 m × 5 m) were measured as subsamples in each field. Based on a density assessment framework, the density was divided into seven stages (Figure 1)—namely, the optimal density recommended by agronomists (ODRA), mechanical set density (MSD), theoretical seed density (TSD), actual seed density (ASD), emergence density (ED), mature plant density (MPD) and number of maize ears (NME). The methods for measuring these were:
Optimal density recommended by agronomists. Asseva et al. [27] showed that the relationship between maize yield and plant density follows a quadratic curve. Therefore, the density under the highest yield demonstrated by agronomists in the plant density experiments was taken as the optimal density. The experimental results of Zhao et al. [28] in Kangcheng Village were adopted. The results of the two cultivars in 2015 and 2016 showed that the yield was the lowest when the density was 45,000 plants ha−1. With the increase of the density, the yield increased gradually and reached the maximum yield when the density was 75,000 plants ha−1. The yield of cv. WK702 reached 13.0 t ha−1 in 2015 and 12.4 t ha−1 in 2016, respectively; the yield of cv. ZD909 reached 11.7 and 12.5 t ha−1, respectively. With increasing the density, the yield did not increase significantly (WK702) and even decreased (ZD909). Therefore, the optimal density recommended for ODRA was set at 75,000 plants ha−1.
Mechanical set density. The type of seeder was a dibbling machine. Mechanically set density was adjusted by changing the hole spacing while the row spacing was nonadjustable. Before sowing, the seeder was set to the plant spacing according to the farmer requirements (Figure 3a). Therefore, a face-to-face questionnaire was conducted immediately after sowing to obtain information on the mechanical plant spacing settings used of each farmer. The row spacing of all seeders was confirmed by measurement at 60 cm. Then, the MSD was calculated according to the row and plant spacing.
Theoretical seed density. There will be errors between the set distance of the machinery and the actual distance, due to the quality of the machinery and the experience of the operator (such as driving speed). Therefore, one month after sowing, when all the emergence was complete, the number of seedlings in the subplot was counted on the assumption that there were no missing seedlings and there was only one plant in each position. The density calculated in this way was designated TSD.
Actual seed density and emergence density. In practice, seeders did not sow in the ideal way of one seed per position (Figure 3c). Therefore, all the positions in each plot where there were no seedlings were dug up to explore the primary causes. They were classified into two categories: the first was that there were no seed in this position due to mechanical reasons (LOSS 3; Figure 3d); the second was that there was a seed in the position but no germination/emergence due to the seed quality or soil environmental factors (LOSS 3). In addition, sometimes more than one seed will be sown in some positions, resulting in two or more seedlings in that positions. Thus, the actual seedling density also increased (INCREASE 2). The ASD and ED were calculated as follows:
ASD = TSD − LOSS 2 + INCREASE 2
ED = ASD − LOSS 3
where ASD, TSD and ED are as defined above. LOSS 2 and LOSS 3 are the loss of density from TSD to ASD and ASD to ED, respectively.
Mature plant density and number of maize ears. Some seedlings failed to grow to mature plants (Figure 3e) due to diseases and pests, poor water or fertilizer applications or weather events; additonally, some mature plants did not produced ears (Figure 3f). Therefore, at maturity, the number of mature plants and ears in each plot were measured again to obtain the MPD and NME.
Therefore, the sowing density difference and plant density loss were divided into one difference pathway, five loss pathways and one increase pathway (Figure 1). DIFFERENCE 1 refers to the difference between ODRA to MSD; LOSS 1, LOSS 2, LOSS 3, LOSS 4 and LOSS 5 refer to the loss of density from MSD to TSD, TSD to ASD, ASD to ED, ED to MPD and MPD to NME, respectively; INCREASE 3 refers to the increase of density from TSD to ASD. The loss rate and increase rate of each pathway was calculated as:
DIFFERENCE 1 rate (%) = DIFFERENCE 1/ODRA × 100
LOSS n rate (%) = LOSS n/ODRA × 100
INCREASE 2 rate (%) = INCREASE 2/ODRA × 100
where n is the pathway of density loss from 1 to 5, and ODRA is optimal density recommended by agronomists.

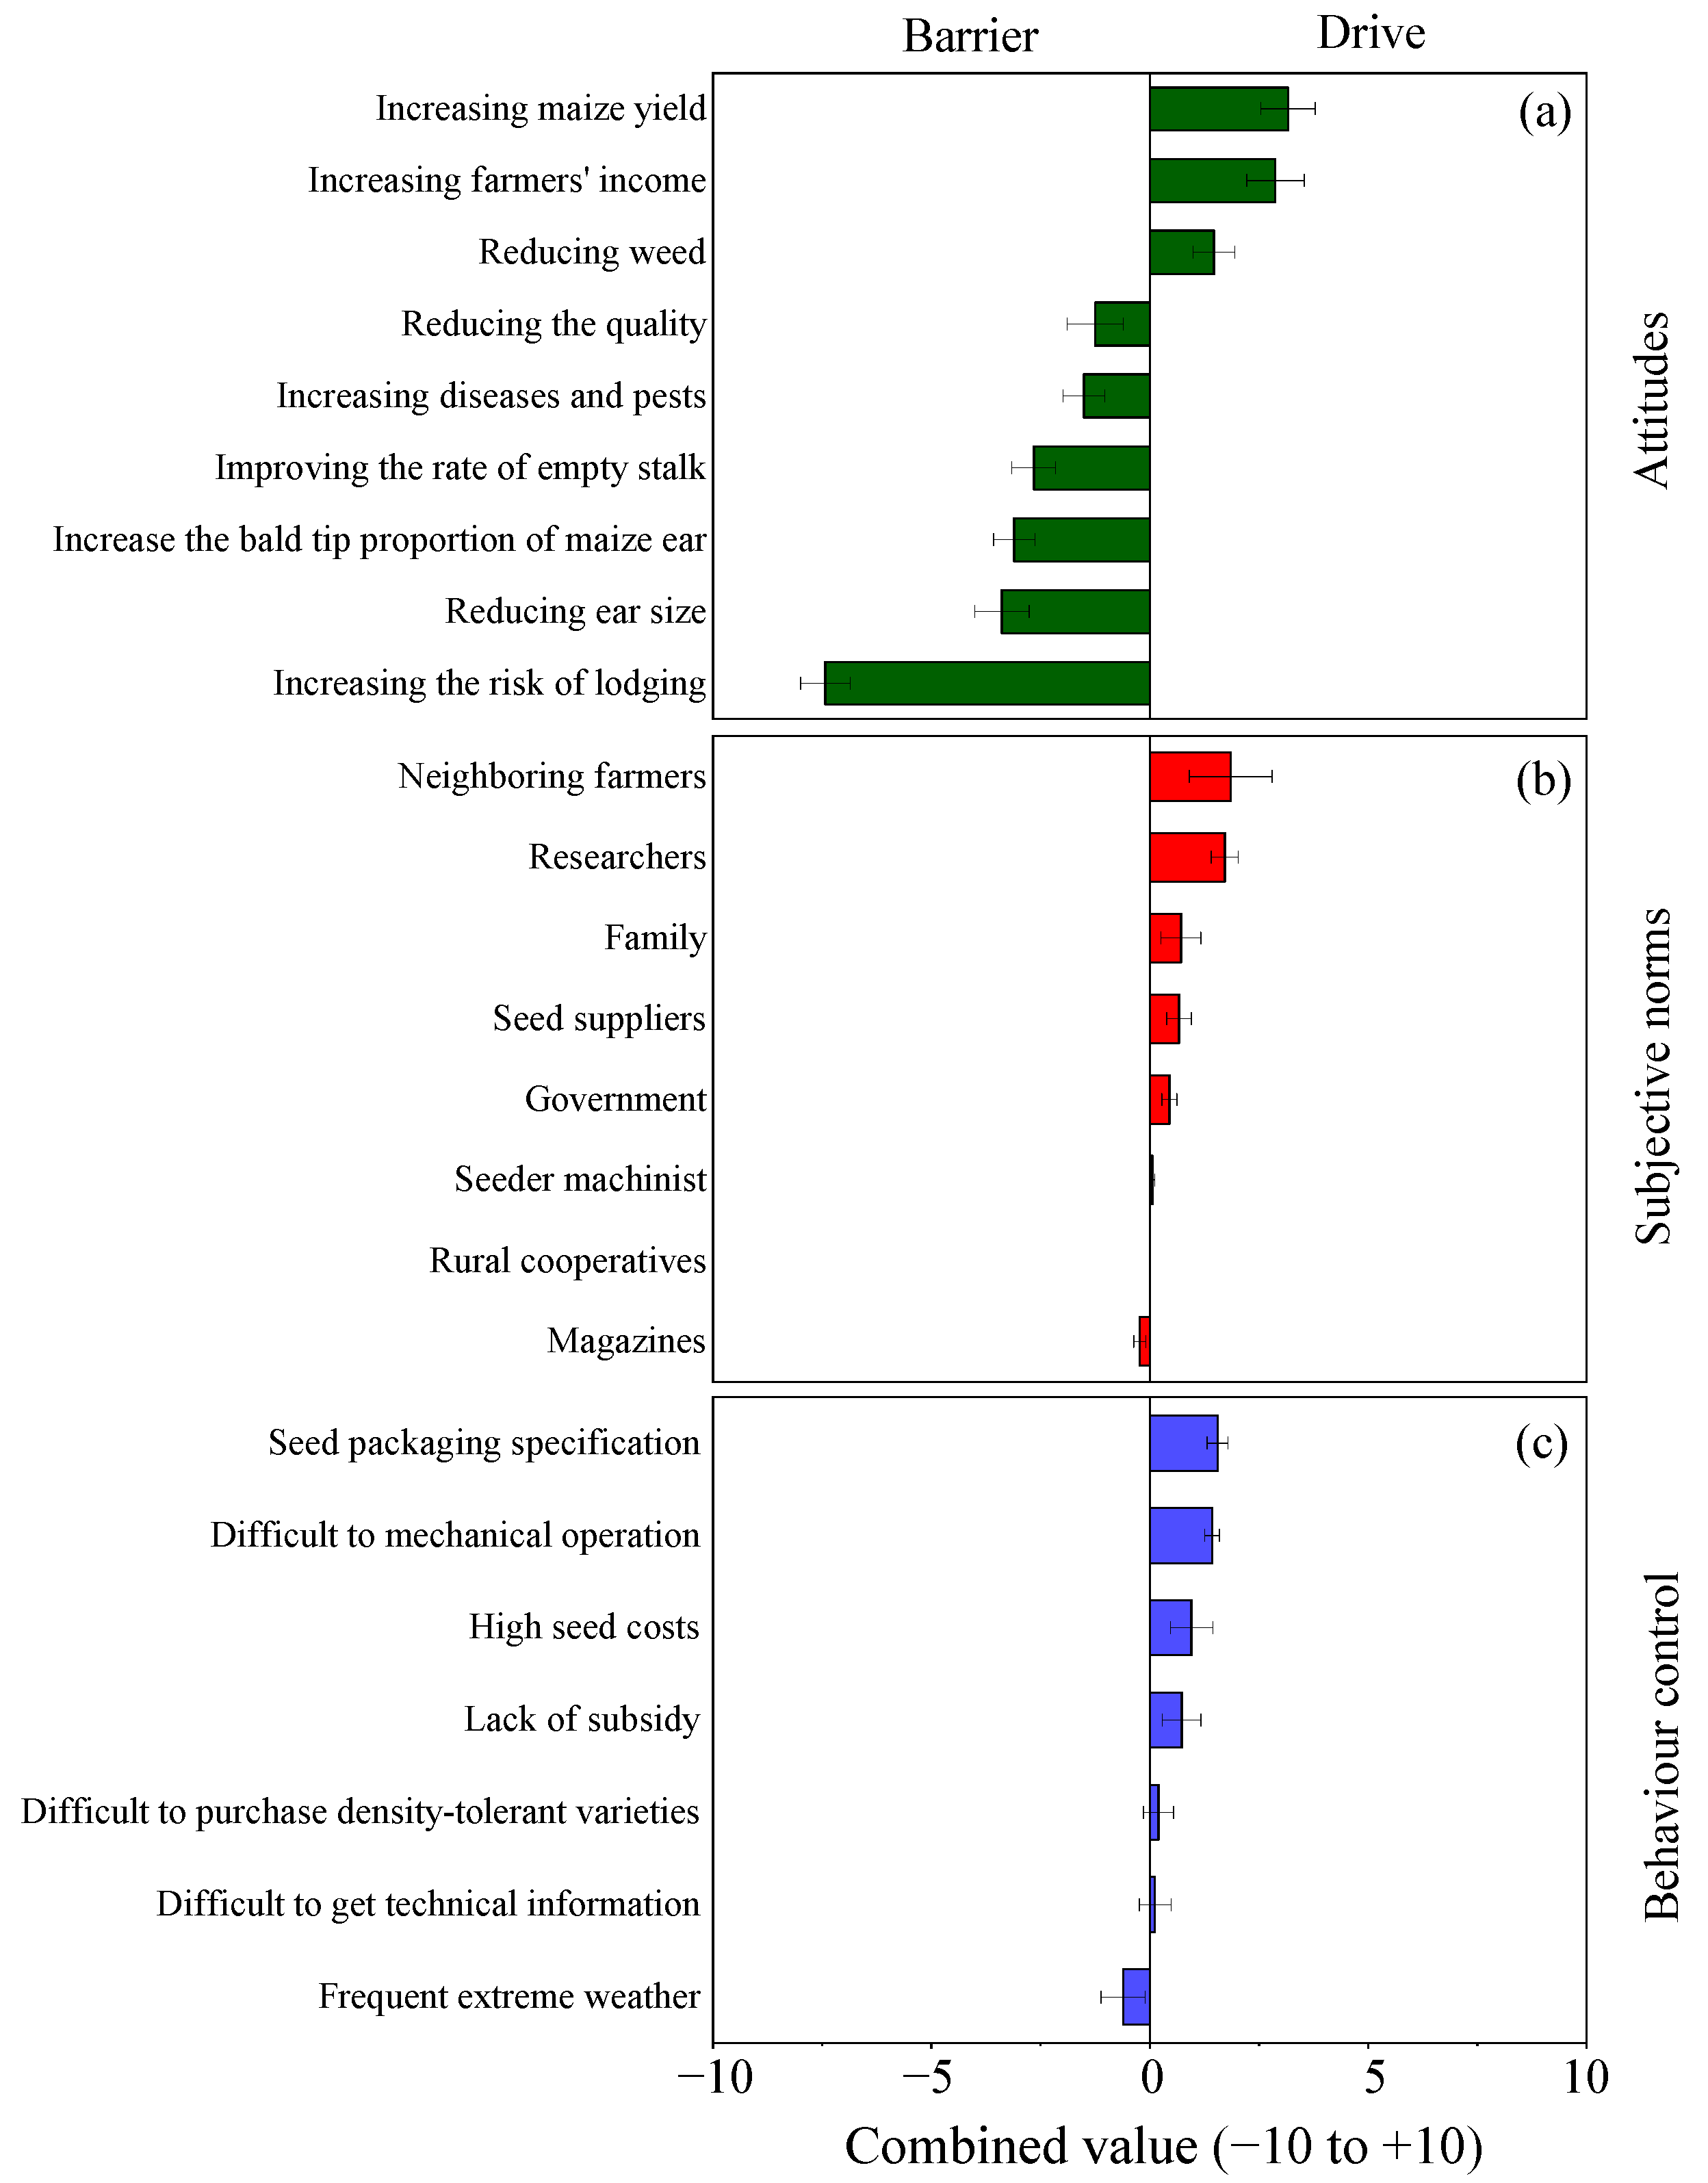
2.3. Theory of Planned Behavior

The Theory of Planned Behavior (TPB) was used in this paper to analyze the barrier and drive the factors of farmer decisions on sowing density [29]. The Theory of Planned Behavior postulates that human behavior is directly affected by (1) attitude toward the outcome of the suggested behavior, (2) subjective norm by social referents and (3) perceived behavior control and those indirectly affect behavior. A semi-structured interview was first conducted to determine the specific impact indicators of smallholder attitude cognition, subjective norms and perceived behavioral control on increasing the plant density. Twenty-four factors (9 outcomes, 8 social referents and 7 control factors) affecting the decisions of farmers to increase the density were identified (Table S1) through interviews with 10 farmers, two agricultural experts and two officers of the local agricultural bureau.
According to these 24 indicators, a questionnaire was designed to quantify farmer attitudes toward outcomes and belief strength, their perceptions of referents and treaties to comply and their perceptions of controlling factors and the control strength. For each indicator, two questions were asked, with both questions to be answered using a Likert five-point scale. For each identified outcome, farmers were asked: (1) to which degree a farmer expects a certain outcome (belief strength) and (2) how is the outcome valued on a scale from ‘bad’ to ‘good’ (outcome evaluation). For example, one possible outcome of increasing the density is to increase the lodging risk. In the survey, farmers were first asked to what degree they thought the increased density increased the lodging risk (1–5: highly likely, likely, neutral, unlikely and highly unlikely) and, secondly, how they evaluated the improvement of lodging (1–5: not very important, not important, neutral, important and very important). For each identified referent, farmers were asked: (1) to which degree the referent is positive or negative towards a practice (normative belief) and (2) how motivated they are to comply with the referent view (motivation to comply). For each identified control factor, farmers were asked: (1) to which degree that control factor is valid for the farm (control strength) and (2) to which degree the control factor makes the practice attractive or difficult (control power). Values for the outcome valuations, normative belief and control power were lowered by three points to give a negative-to-positive scaling (−2 to +2). Finally, the values for each pair of questions were multiplied to obtain a score (scores ranging from −10 to +10) for attitude, subjective norm and perceived behavioral control; see Equations (6)–(8) [30]:
Attitudei = belief strengthi × (outcome valuationi − 3)
Subjective normk = motivation to complyk × (normative beliefk − 3)
Perceived behavioral controlm = control strengthm × (control powerm − 3)
For each attitude, subjective norm and perceived behavioral control, the mean value and standard across all the respondents were calculated. Positive values were classified as drivers. Negative values were classified as barriers.

2.4. Statistical Analysis

Structural Equation Modeling (SEM) is well-suited to quantitatively analyze the causal structure of multivariate relationships [31]. To evaluate the causal relationship between maize yield and density loss and increase in the present study, the relationships between density losses, increase and yield were founded based on previous studies. Factors used to assess the impact of yield included INCREASE 2, LOSS 4, LOSS 5, total agronomic losses and NME. Then, an a priori model of structural relationships that included direct and indirect causal pathways was proposed. Finally, SEM was used to verify whether the survey data conformed to the proposed model; thus, the direct and indirect relationships between the variables were obtained. Path coefficient was used to explain the relationship between the variables in the model, and the R2 value was used to indicate the proportion of variance explained by each variable. SEM was performed with SPSS AMOS 21.0 software. The adequacy of the models was tested by using the maximum likelihood-ratio chi-square (χ2, p > 0.05) goodness-of-fit test and the root mean square error of the approximation index (RMSEA < 0.08) [32]. LOSS 1 and LOSS 2 were classified as density loss paths directly caused by mechanical factors, and INCREASE 2 was classified as the density increase path directly caused by mechanical factor. Loss 3, LOSS 4 and LOSS 5 were classified as density loss paths directly caused by agronomic factors. However, INCREASE 2 resulted in partial LOSS 4 and LOSS 5. The proportion of the LOSS 4 and LOSS 5 caused by INCREASE 2 can be calculated according to the results of the SEM. Therefore, the real density loss caused by mechanical factors and agronomic factors, and the density differences caused by farmer factors were calculated by Equations (9)–(11):
Density loss caused by mechanical factors = LOSS 1 + LOSS 2 − INCREASE 2 + LOSS A
Density loss caused by agronomic factors = LOSS 3 + LOSS 4 +LOSS 5 − LOSS A
Density difference caused by farmer factors = DIFFERENCE 1
where LOSS A represents the loss of agronomic density caused by INCREASE 2. Four scenarios were used to analyze the yield changes after different density loss paths were controlled. In the first three scenarios, only the density differences caused by farmer decision-making and density loss caused by mechanical and agronomic factors were respectively controlled, while other losses still existed. In the fourth scenario, all the density difference and losses were controlled. The simulated yield of the different scenarios was calculated according to the equation by fitting the linear relationship between the density and yield achieved by farmers.

3. Results

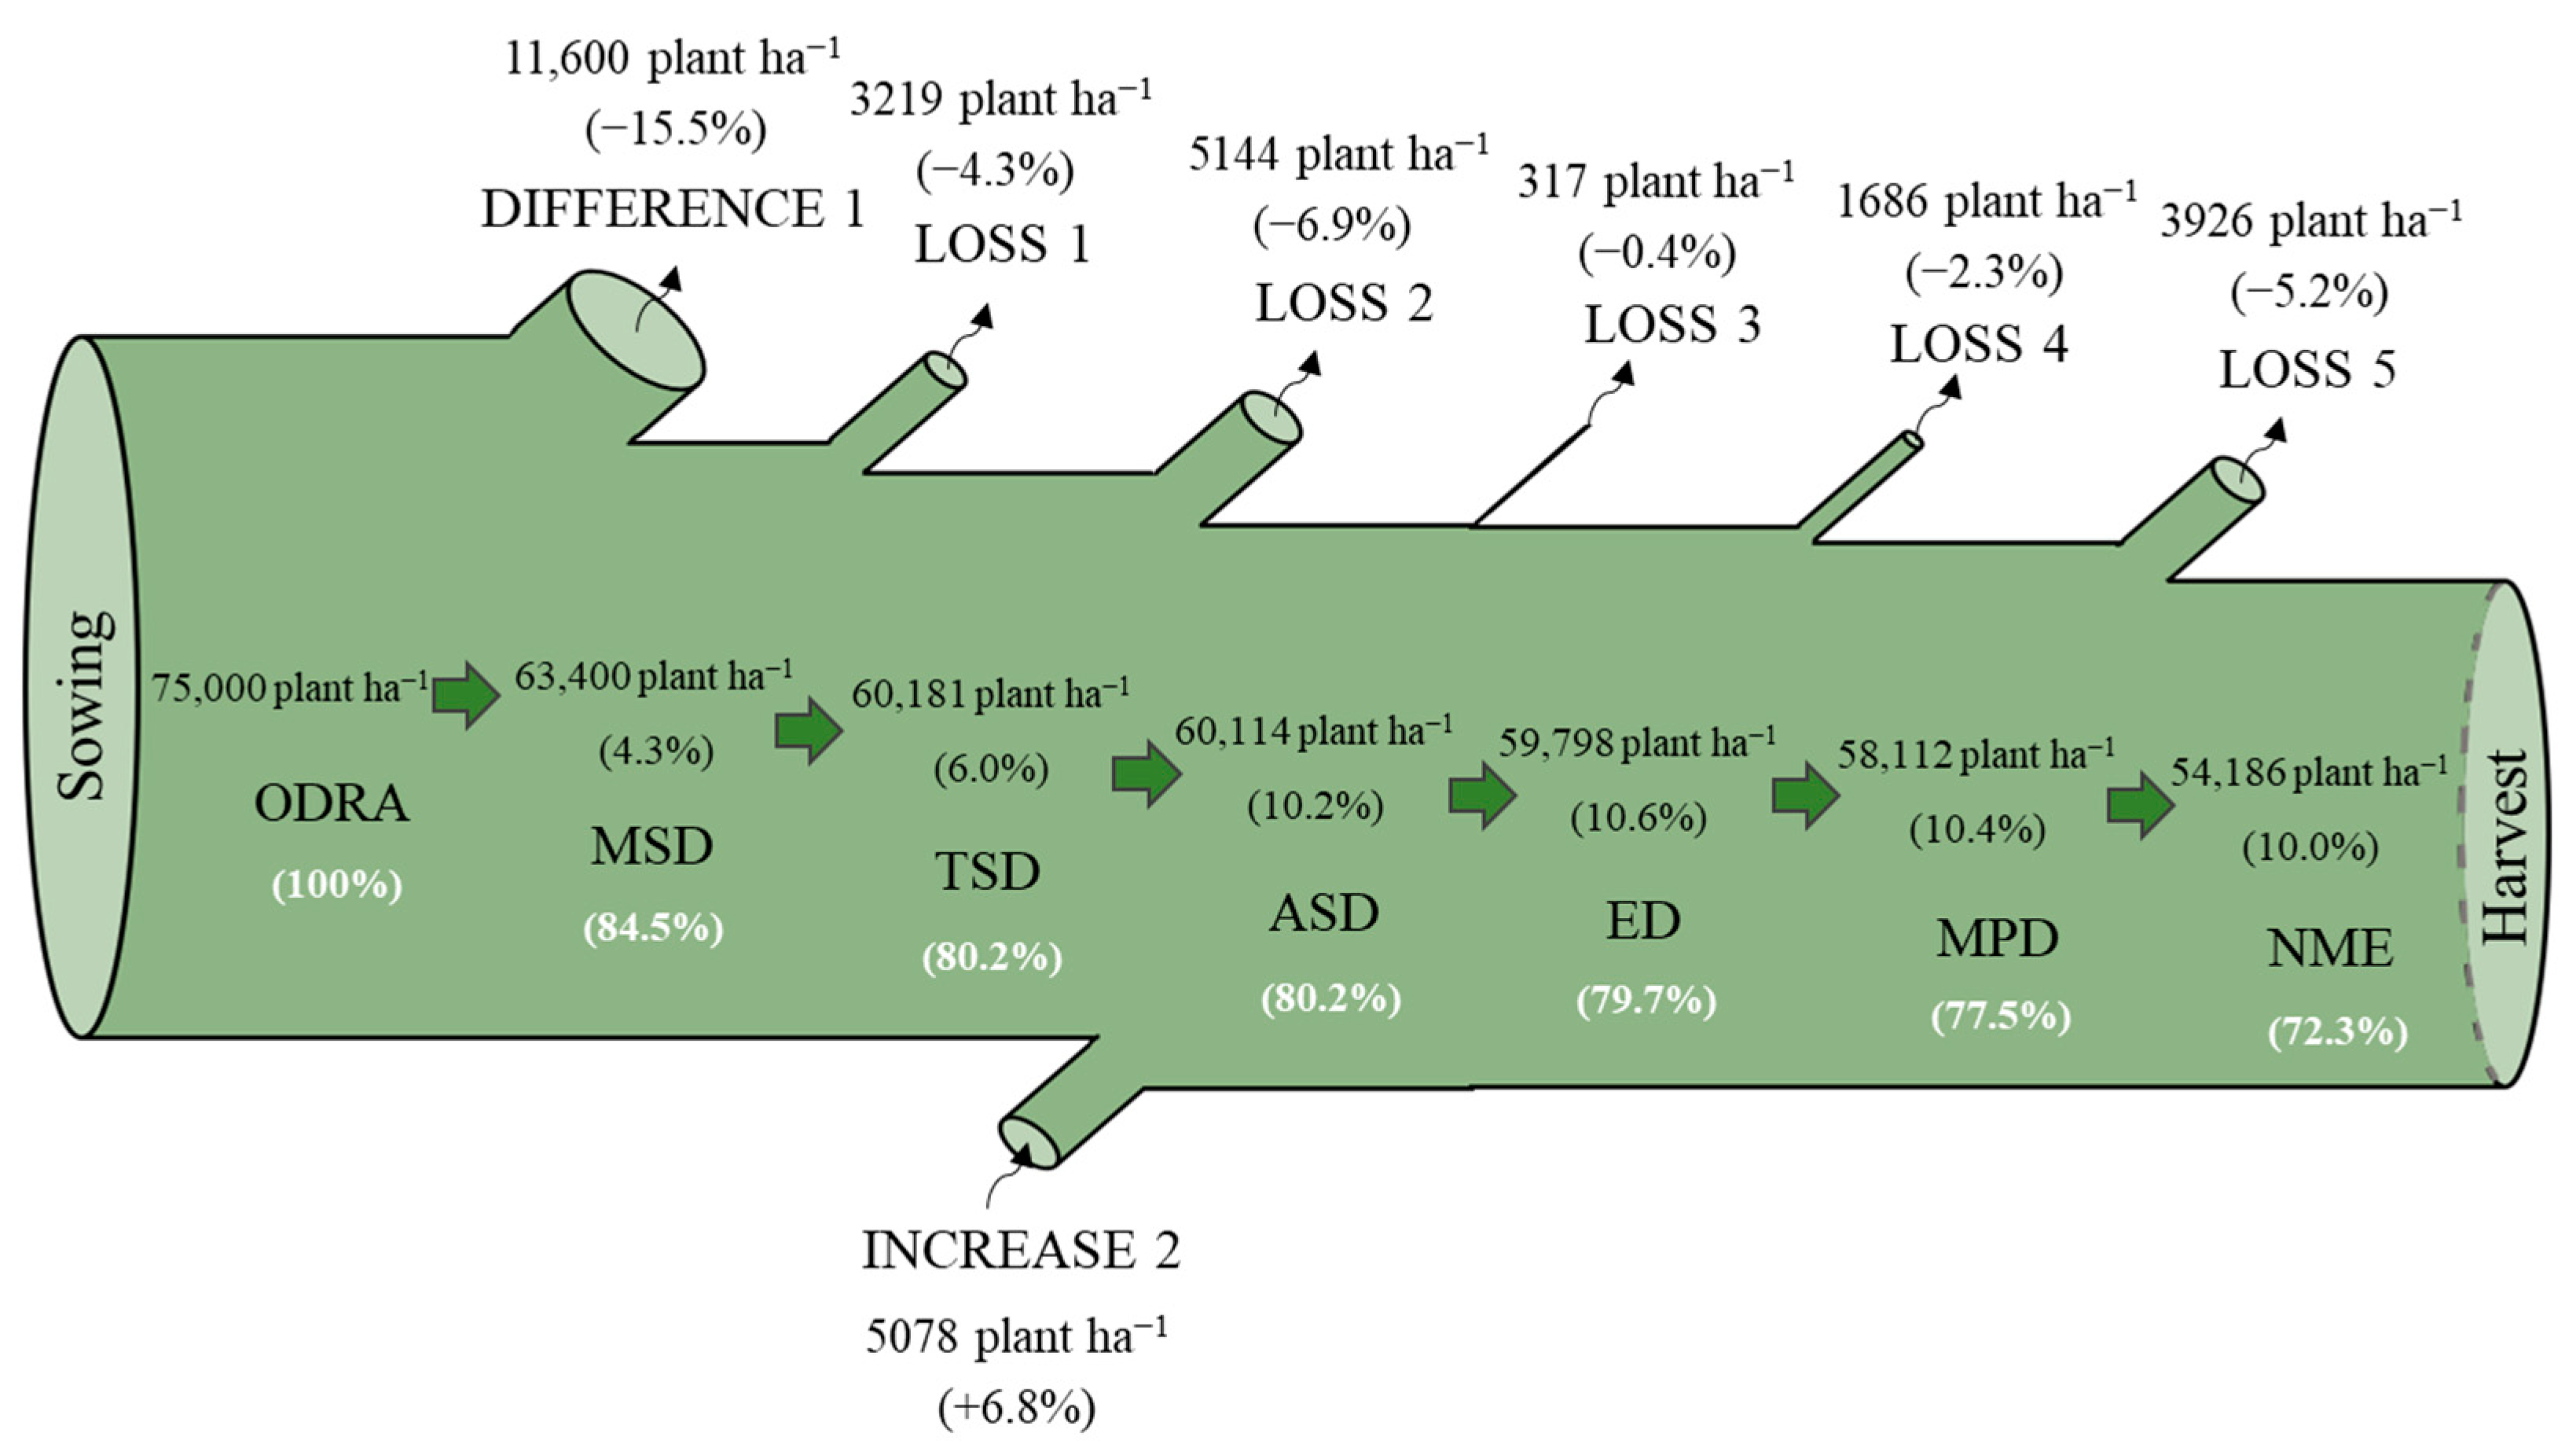
3.1. Sowing Density Difference Caused by Farmer Factors and Other Causes

There were different degrees of differences and losses from the density recommended by agronomists to the harvest density achieved by farmers (Figure 4). The sowing density adopted by farmers was 63,400 plants ha−1, lower than the optimal density recommended by agronomists. Additionally, this was the largest difference (11,600 plants ha−1), with a different rate of 15.5%.
The results of the theory of planned behavior (Figure 5) showed that the main influencing factors for smallholder farmers to adopt the plant density recommended by agronomists was the attitude toward the outcome of high density, while subjective norms and behavior control had little influence. Although farmers believed that high density can improve the yield and economic income, it is also deemed to contribute to some negative outcomes, such as increasing the rate of empty stalk (−2.7), improving the bald tip proportion of maize ears (−3.1), reducing ear sizes (−3.4) and, especially, increasing the risk of maize lodging (−7.4). These factors impede the willingness of farmers to adopt the recommendations of agronomists.

3.2. Density Loss Caused by Mechanical Factors and Agronomic Factors

The values for LOSS 1, LOSS 2, INCREASE 2, LOSS 3, LOSS 4 and LOSS 5 were 3219, 5144, 5078, 317, 1686 and 3926 plants ha−1, respectively (Figure 4). LOSS 2 was the second density loss pathway, with a loss rate of 6.9%, while INCREASE 2 had a similar increase rate of 6.8%. The loss rate of LOSS 3 was the lowest at only 0.4%. The harvest plant density achieved by the farmers only reached 72.3% of the optimal density.
The overall goodness-of-fit of the constructed SEM met each threshold condition (p > 0.05, EMSEA < 0.1), which indicated that the relationship between the variables was well-explained (Figure 6a). The results showed that INCREASE 2 had direct and positive effects on LOSS 4 and LOSS 5. INCREASE 2 explained 24% of LOSS 4 and 11% of LOSS 5, respectively. Meanwhile, LOSS 4 and LOSS 5 also had direct and positive impacts on the total agronomic losses. As a result, INCREASE 2 actually resulted in 1.1% of the agronomic density loss, and the actual density losses caused by the mechanical factors and agronomic factors were 5.5% and 6.8%, respectively.

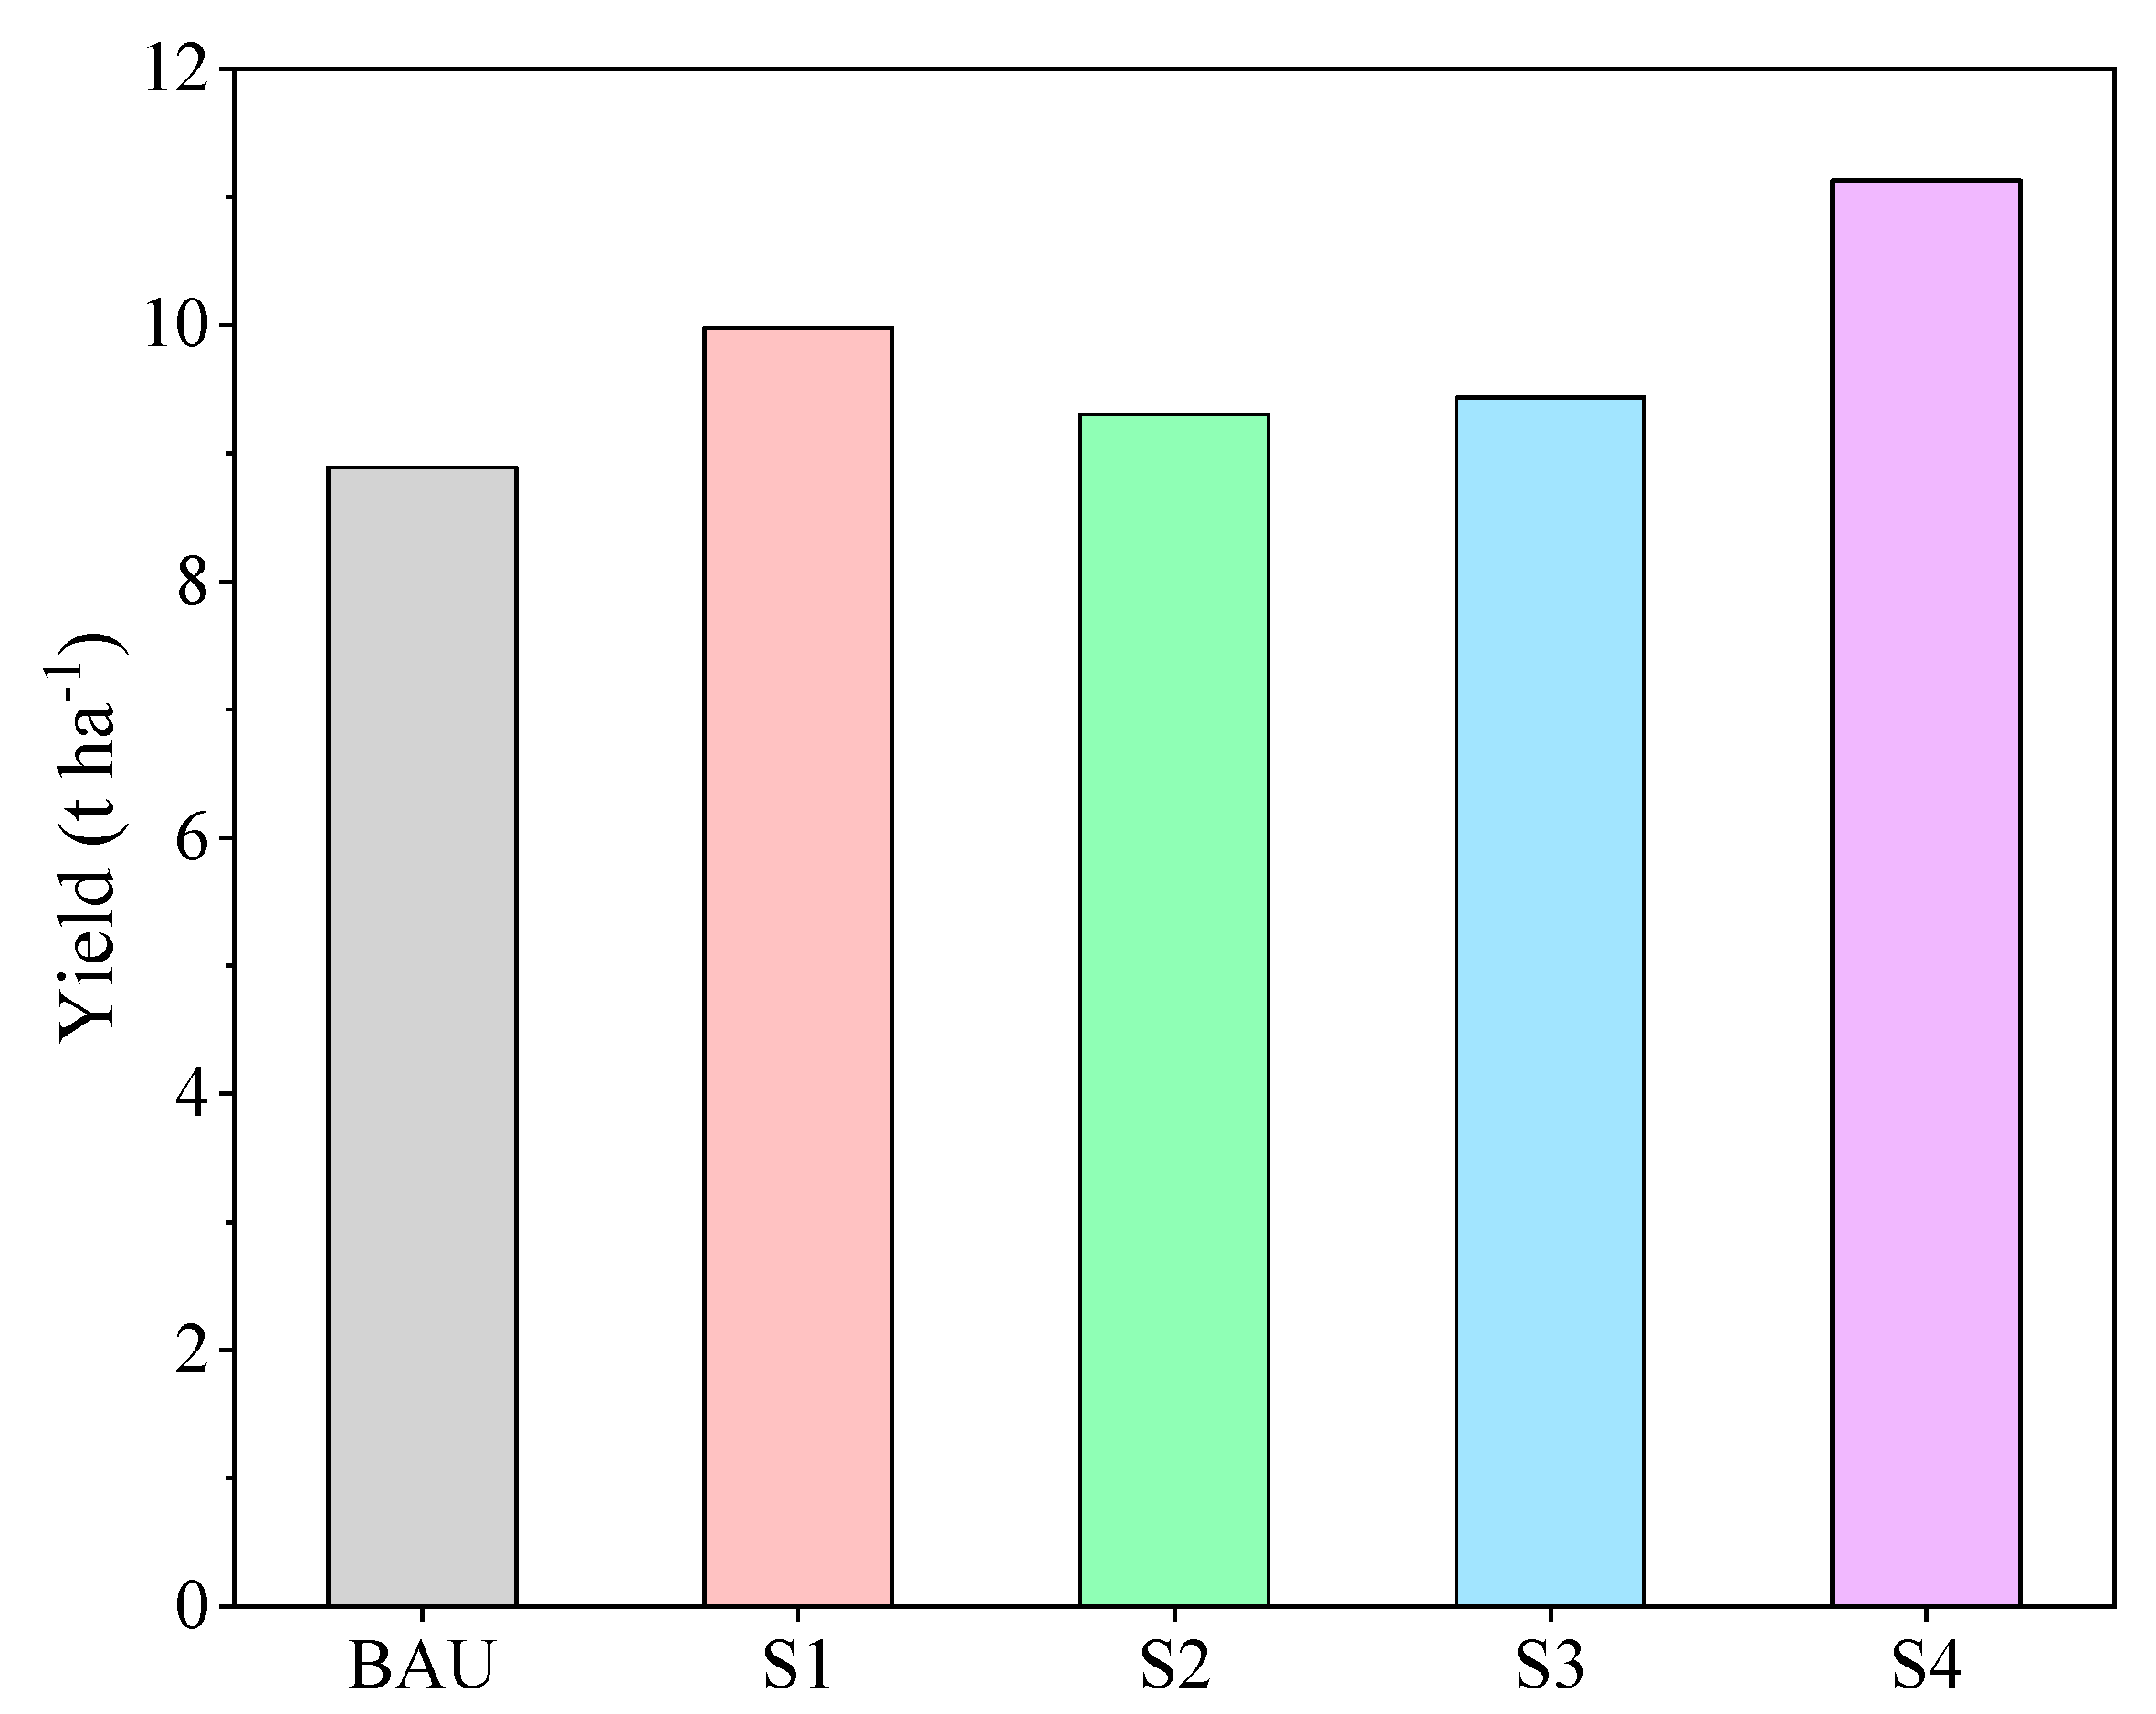
3.3. Effects of Density Loss on Yield and Scenario Analysis Results

The results of the SEM showed INCREASE 2 had a direct and positive effect on NME; on the contrary, the total agronomic losses had a direct and negative effect on NME (Figure 6a). INCREASE 2, LOSS 4, LOSS 5, total agronomic losses and NME all had direct or indirect effects on the yield (Figure 6b), and the 38.0% variation of the maize yield was explained. The NME had direct and positive effects (standardized total path coefficient: 0.61) on the maize yield; INCREASE 2 had indirect and positive effects (0.19) on the maize yield and LOSS 4 (−0.18), LOSS 5 (−0.09) and total agronomic losses (−0.21) had indirect and negative effects on the maize yield (Figure 6). The results of the scenario analysis showed that the yield increased by 12.3%, 4.7% and 6.2% after controlling the density differences and losses caused by farmer decisions and the mechanical and agronomic factors, respectively (Figure 7). If all the density loss pathways are controlled, the yield increase would be up to 25.2%.

4. Discussion

4.1. Systematic Methodology of Analyzing the Primary Causes for Density Difference and Loss

In modern agricultural production, the highest maize yield per unit area is mostly achieved in high density plantings [32,33]. However, the current average density is far below the optimal density, which limits the yield increase [1,12]. This problem is more serious on the North China Plain, where smallholders predominate in maize production [11]. Many attempts have been made to improve the density management practices of farmers. For example, the precision of seeders has been optimized by the addition of straw-shifting anti-blocking devices, thereby reducing the plant density loss [20] and improving the awareness of farmers about increasing the plant density through training [10]. Although these methods are useful, they have minimal effects, because the plant density differences between experiments to farmer fields are driven by the whole process of farmer decision-making and agricultural production. Therefore, in order to identify the key problems to be solved, it is necessary to diagnose and analyze the whole process, rather than individual aspects. In this paper, a systematic analysis method of the whole process was constructed by combining farmer decision-making, sowing machinery and agronomic management. It was demonstrated earlier that both mechanical and agronomic factors can cause plant density loss [19], but the specific contribution of each factor remains unclear. In this study, the density difference caused by farmer decision-making was clarified. In addition, given that the theory of planned behavior can provide a theoretical basis for explaining the decision-making process of individual behaviors [34], it was included in this study to further analyze the main factors that affect the decision-making of the density of smallholders (Figure 5). The SEM was used to quantify the direct and potential relationships between different density loss paths (Figure 6). The results showed that this method was effective in identifying the primary cause of the sowing density differences and plant density losses and determining the priority of reducing the density loss.
The research framework, as well as the methodology in the process of analyzing the causes of density loss, could serve as references for other areas. For example, there is also a large density loss from sowing to harvest in Northeast China, and those farmers have a limited awareness of density loss [19]. The demonstration and causes analysis of the density difference and loss throughout the whole process from production decisions to practices were helpful for identifying the priorities and stakeholders who share the responsibility for reducing the density loss to effectively address the issue. Other countries, such as India [2], have some agricultural production and social economy conditions that are similar to China (for example, smallholder-dominant crop production, the stagnation of maize yield growth and a large crop yield gap). In Africa, such as Ethiopia, there is more space and demand for smallholders to increase the maize yield; however, the maize productivity is limited by low plant populations and poor agronomic management [35,36]. The adaptive adjustment and application of the research framework and methodology in local areas could help to formulate specific solutions for reducing the density loss, narrow the crop yield gap and ensure national food security.

4.2. Density Difference between Agronomists and Smallholders

In practice, affected by many factors such as conservative concepts of farmers, the risks associated with technology, the social and economic factors and the acquisition and utilization of resources [34,37], there is a big gap between farmer willingness towards sowing density and the optimal sowing density recommended by agronomists. In the present study, the decision-making of farmers directly led to a 15.5% sowing density difference. This was mainly due to their perception that an increased plant density was associated with a higher risk of lodging (Figure 5), rather than a restriction on action. Sher et al. [38] and Shao et al. [39] also reported that a higher sowing density (>75,000 plants ha−1) will lead to poor light interception by individual plants, a limited carbohydrate supply and increased internode elongation and plant height. It also increases the remobilization of dry matter from stem to ear, which, in turn, weakens the stem strength and increases the risk of lodging [40].
However, the plant density achieved by farmers on the North China Plain is not excessive [41]. The cause of maize lodging is not unique. The characteristics of the cultivar and management practices of the farmers are closely related to its occurrence [42,43]. For example, excessive nitrogen input can significantly increase the plant height and ear height, reduce the stem diameter and, thus, increase the lodging rate of maize, and it can also increase the bald tip length of ears [27]. Farmers may attribute all of these causes of lodging to a higher plant density. Although a high plant density can also increase competition among plants for resources and reduce the yield per plant, the negative effects of competition can be overcome by increasing the number of ears [44]. Therefore, the maize yield per unit area will not decrease. Farmers may be unaware of this, so that a reduced size of maize ears could also be seen as a limiting factor for them.

4.3. Density Loss Caused by Mechanical and Agronomic Factors

During crop production, the flatness of the ground, the unevenness of wheat straw crushing and distribution will all affect the precision of the seed metering device, which leads to the gaps between the mechanical set plant spacing and the actual plant spacing. The results of this study showed that this gap was a loss (−4.3%) on the whole (Figure 4), which was consistent with the results of Zhao et al. [19]. In addition, all the wheat straw returned to the field resulted in a large amount of soft and damp straw in the field. This can easily lead to the blockage of the seeder when sowing and increase the possibility of missed seeding, seeds leaving the seedbed and seed aggregation [20]. Seed aggregation will lead to poor ventilation and reduce the transmission of light and exacerbate leaf senescence, thereby reducing the net photosynthetic rate [14,45]. Additionally, it will lead to a strong competition for water, nutrients and other resources, causing resource stress, resulting in a variety of molecular, biochemical and physiological changes in the plants, thus affecting the growth and development of maize [46,47,48] and resulting in the loss of plant density and decreased yield (Figure 6).
Additionally, many agronomic factors directly lead to plant density loss (Figure 4). For example, seed quality, soil type, sowing depth and soil moisture content all directly affect seed germination and growth [21,49,50], thereby leading to the loss of seedlings. During the growth of maize, pests, diseases on the ground and underground and poor water and fertilizer management practices seriously limit the growth and development of plants, resulting in the loss of mature plants and ears and limiting the yield (Figure 6). Above and belowground insect pests and diseases, as well as poor water and fertilizer management practices, can severely limit maize growth and development [22,44], resulting in the loss of mature plants and ears, which limit the increase in yield (Figure 6).

4.4. Potential Optimization Approach of Reducing Density Loss

Reducing the density loss, especially caused by farmer decision-making, can significantly increase the yield (Figure 7). Overall, the key to reduce the density loss lies in changing farmer attitudes and understanding, especially their risk awareness. This requires the participation of different stakeholders [10,34]. For the government, it should strengthen the construction of a technology extension service system, improve the service functions of different subjects and enhance the impact of social referents on farmer behaviors, which is relatively small at present (Figure 5). Additionally, the government can provide corresponding insurance services or subsidies to encourage small farmers to face risks. There is a need to enhance smallholder awareness and competencies and increase farmer confidence and willingness [10]. For example, it is important to improve farmer adoption of the optimal water and fertilizer management, pest control, chemical control and lodging prevention through field demonstration, education and training [51] in order to optimize the growth and development of maize and reduce the risk of lodging [28,52]. At the same time, this can reduce the plant density loss caused by other agronomic factors.

5. Conclusions

In order to identify the plant density loss in existing production systems and its primary causes and narrow yield gap, this paper presents a research methodology for diagnosing the process contribution to plant density difference between the experimental optimum and that achieved in farmer fields. The application of the framework showed that plant density achieved by smallholders was, at best, 72.3% of the optimal density. The greatest difference (15.5%) was caused by farmer attitude, especially the fear of lodging risk. In contrast, the density losses caused by mechanical and agronomic factors were 5.5% and 6.8%, respectively. Therefore, improving farmer attitudes and perceptions, especially their risk awareness, should be a priority for reducing the density loss. Overall, the methodology effectively demonstrated the relatively contribution of different factors across the whole process of sowing density difference and plant density loss from production decision to practices. This comprehensive and systematic analysis could help to identify the priorities and stakeholders who share the responsibility for reducing the density loss. Additionally, this methodology could also be applied in other areas and crops to address plant density losses and narrow the yield gap to ensure food security.

Supplementary Materials

The following are available online at https://www.mdpi.com/article/10.3390/agriculture11060480/s1, Table S1: The factors that may affect farmer decisions to increase the plant density of maize.

Author Contributions

Conceptualization, Z.A. and W.M.; Data curation, Z.A.; Formal analysis, Z.A.; Funding acquisition, F.Z.; Investigation, Z.A., Z.K. and W.J.; Methodology, Z.A., C.W. and X.J.; Project administration, F.Z.; Software, Z.A. and D.Z.; Supervision, X.J.; Validation, X.J. and F.Z.; Visualization, Z.A.; Writing—original draft, Z.A. and Writing—review and editing, C.W. and X.J. All authors have read and agreed to the published version of the manuscript.

Funding

This research was funded by the Key Consulting Project of the Chinese Academy of Engineering, grant number 2019-XZ-25 and 2019-XZ-69.

Institutional Review Board Statement

Not applicable.

Informed Consent Statement

Not applicable.

Data Availability Statement

The data presented in this study are available on request from the corresponding author.

Acknowledgments

We thank Yuzhou Science and Technology Backyard for supporting the farmer household survey and filed density monitoring. Thanks to the local farmers for their cooperation in the research.

Conflicts of Interest

The authors declare no conflict of interest.

References

  1. Xu, W.; Liu, C.; Wang, K.; Xie, R.; Ming, B.; Wang, Y.; Zhang, G.; Liu, G.; Zhao, R.; Fan, P.; et al. Adjusting maize plant density to different climatic conditions across a large longitudinal distance in China. Field Crops Res. 2017, 212, 126–134. [Google Scholar] [CrossRef]
  2. Ray, D.K.; Ramankutty, N.; Mueller, N.D.; West, P.C.; Foley, J.A. Recent patterns of crop yield growth and stagnation. Nat. Commun. 2012, 3, 1293. [Google Scholar] [CrossRef] [Green Version]
  3. Liu, B.; Chen, X.; Meng, Q.; Yang, H.; van Wart, J. Estimating maize yield potential and yield gap with agro-climatic zones in China distinguish irrigated and rainfed conditions. Agric. For. Meteorol. 2017, 239, 108–117. [Google Scholar] [CrossRef]
  4. Meng, Q.; Hou, P.; Wu, L.; Chen, X.; Cui, Z.; Zhang, F. Understanding production potentials and yield gaps in intensive maize production in China. Field Crops Res. 2013, 143, 91–97. [Google Scholar] [CrossRef] [Green Version]
  5. Ray, D.K.; Gerber, J.S.; MacDonald, G.K.; West, P.C. Climate variation explains a third of global crop yield variability. Nat. Commun. 2015, 6, 5989. [Google Scholar] [CrossRef] [PubMed] [Green Version]
  6. Liu, Z.; Yang, X.; Lin, X.; Hubbard, K.G.; Lv, S.; Wang, J. Narrowing the agronomic yield gaps of maize by improved soil, cultivar, and agricultural management practices in different climate zones of Northeast China. Earth Interact. 2016, 20, 1–18. [Google Scholar] [CrossRef] [Green Version]
  7. Ren, H.; Li, Z.; Cheng, Y.; Zhang, J.; Liu, P.; Li, R.; Yang, Q.; Dong, S.; Zhang, J.; Zhao, B. Narrowing yield gaps and enhancing nitrogen utilization for summer maize (Zea mays L.) by combining the effects of varying nitrogen fertilizer input and planting density in DSSAT simulations. Front. Plant Sci. 2020, 11, 1787. [Google Scholar] [CrossRef]
  8. National Bureau of Statistics. Main Data Bulletin of the Third National Agricultural Census. Beijing. 2017. Available online: http://www.stats.gov.cn/ (accessed on 7 January 2021).
  9. Mueller, N.D.; Gerber, J.S.; Johnston, M.; Ray, D.K.; Ramankutty, N.; Foley, J.A. Closing yield gaps through nutrient and water management. Nature 2012, 490, 254–257. [Google Scholar] [CrossRef] [PubMed]
  10. Zhang, W.; Cao, G.; Li, X.; Zhang, H.; Wang, C.; Liu, Q.; Chen, X.; Cui, Z.; Shen, J.; Jiang, R.; et al. Closing yield gaps in China by empowering smallholder farmers. Nature 2016, 537, 671–674. [Google Scholar] [CrossRef]
  11. Chen, G.; Cao, H.; Liang, J.; Ma, W.; Guo, L.; Zhang, S.; Jiang, R.; Zhang, H.; Goulding, K.W.T.; Zhang, F. Factors affecting nitrogen use efficiency and grain yield of summer maize on smallholder farms in the North China Plain. Sustainability 2018, 10, 363. [Google Scholar] [CrossRef] [Green Version]
  12. Sun, H.; Zhang, X.; Wang, E.; Chen, S.; Shao, L.; Qin, W. Assessing the contribution of weather and management to the annual yield variation of summer maize using APSIM in the North China Plain. Field Crops Res. 2016, 194, 94–102. [Google Scholar] [CrossRef]
  13. Timlin, D.J.; Fleisher, D.H.; Kemanian, A.R.; Reddy, V.R. Plant density and leaf area index effects on the distribution of light transmittance to the soil surface in maize. Agron. J. 2014, 106, 1828–1837. [Google Scholar] [CrossRef]
  14. Ren, B.; Liu, W.; Zhang, J.; Dong, S.; Liu, P.; Zhao, B. Effects of plant density on the photosynthetic and chloroplast characteristics of maize under high-yielding conditions. Sci. Nat. 2017, 104, 12. [Google Scholar] [CrossRef]
  15. Han, K.; Yin, F.; Liu, P. Planting density and N application rate balance maize agronomic and environmental effect. Nutr. Cycl. Agroecosyst. 2020, 117, 337–349. [Google Scholar] [CrossRef]
  16. Li, J.; Wu, M.; Wang, K.; Ming, B.; Chang, X.; Wang, X.; Yang, Z.; Xie, R.; Li, S. Identifying ways to narrow maize yield gaps based on plant density experiments. Agronomy 2020, 10, 281. [Google Scholar] [CrossRef] [Green Version]
  17. Sher, A.; Khan, A.; Cai, L.J.; Irfan Ahmad, M.; Asharf, U.; Jamoro, S.A. Response of maize grown under high plant density; Performance, issues and management—A critical review. Adv. Crop Sci. Technol. 2017, 5, 275. [Google Scholar] [CrossRef] [Green Version]
  18. Li, T.; Liu, J.; Wang, S.; Zhang, Y.; Zhan, A.; Li, S. Maize yield response to nitrogen rate and plant density under film mulching. Agron. J. 2018, 110, 996–1007. [Google Scholar] [CrossRef] [Green Version]
  19. Zhao, Y.; Xing, S.; Zhang, Q.; Zhang, F.; Ma, W. Causes of maize density loss in farmers’ fields in Northeast China. J. Integr. Agric. 2019, 18, 1680–1689. [Google Scholar] [CrossRef]
  20. Huang, X.; Yang, W.; Wang, W.; Li, Z.; Chen, L. Design and experiment of straw shifting anti-blocking maize seed drill. Int. Agric. Eng. J. 2018, 27, 166–175. [Google Scholar]
  21. Tabakovic, M.; Simic, M.; Stanisavljevic, R.; Milivojevic, M.; Secanski, M.; Postic, D. Effects of shape and size of hybrid maize seed on germination and vigour of different genotypes. Chil. J. Agric. Res. 2020, 80, 381–392. [Google Scholar] [CrossRef]
  22. Chapwanya, M.; Matusse, A.; Dumont, Y. On synergistic co-infection in crop diseases. The case of the maize lethal necrosis disease. Appl. Math. Model. 2021, 90, 912–942. [Google Scholar] [CrossRef]
  23. Lu, H.; Hu, L.; Zheng, W.; Yao, S.; Qian, L. Impact of household land endowment and environmental cognition on the willingness to implement straw incorporation in China. J. Clean. Prod. 2020, 262, 121479. [Google Scholar] [CrossRef]
  24. Kamanga, B.C.G.; Waddington, S.R.; Robertson, M.J.; Giller, K.E. Risk analysis of maize-legume crop combinations with smallholder farmers varying in resource endowment in central Malawi. Exp. Agric. 2010, 46, 1–21. [Google Scholar] [CrossRef] [Green Version]
  25. Wang, C.; Li, X.; Gong, T.; Zhang, H. Life cycle assessment of wheat-maize rotation system emphasizing high crop yield and high resource use efficiency in Quzhou County. J. Clean. Prod. 2014, 68, 56–63. [Google Scholar] [CrossRef]
  26. FAO. World Reference Base for Soil Resources 2014 International Soil Classification System; FAO: Rome, Italy, 2015; ISBN 9789251083697. [Google Scholar]
  27. Assefa, Y.; Prasad, P.V.V.; Carter, P.; Hinds, M.; Bhalla, G.; Schon, R.; Jeschke, M.; Paszkiewicz, S.; Ciampitti, I.A. Yield Responses to Planting Density for US Modern Corn Hybrids: A Synthesis—Analysis. Crop Sci. 2016, 56, 2802–2817. [Google Scholar] [CrossRef]
  28. Zhao, Y.; Huang, Y.; Li, S.; Chu, X.; Ye, Y. Improving the growth, lodging and yield of different density-resistance maize by optimising planting density and nitrogen fertilisation. Plant Soil Environ. 2020, 66, 453–460. [Google Scholar] [CrossRef]
  29. Ajzen, I. The theory of planned behavior. Org. Behav. Hum. Decis. Proc. 1991, 50, 179–211. [Google Scholar] [CrossRef]
  30. Hijbeek, R.; Pronk, A.A.; van Ittersum, M.K.; Verhagen, A.; Ruysschaert, G.; Bijttebier, J.; Zavattaro, L.; Bechini, L.; Schlatter, N.; Ten Berge, H.F.M. Use of organic inputs by arable farmers in six agro-ecological zones across Europe: Drivers and barriers. Agric. Ecosyst. Environ. 2019, 275, 42–53. [Google Scholar] [CrossRef]
  31. Schipanski, M.E.; Smith, R.G.; Gareau, T.L.P.; Jabbour, R.; Lewis, D.B.; Barbercheck, M.E.; Mortensen, D.A.; Kaye, J.P. Mul-tivariate relationships influencing crop yields during the transition to organic management. Agric. Ecosyst. Environ. 2014, 189, 119–126. [Google Scholar] [CrossRef]
  32. Li, J.; Xie, R.Z.; Wang, K.R.; Ming, B.; Guo, Y.Q.; Zhang, G.Q.; Li, S.K. Variations in maize dry matter, harvest index, and grain yield with plant density. Agron. J. 2015, 107, 829–834. [Google Scholar] [CrossRef]
  33. Assefa, Y.; Carter, P.; Hinds, M.; Bhalla, G.; Schon, R.; Jeschke, M.; Paszkiewicz, S.; Smith, S.; Ciampitti, I.A. Analysis of long term study indicates both agronomic optimal plant density and increase maize yield per plant contributed to yield gain. Sci. Rep. 2018, 8, 4937. [Google Scholar] [CrossRef] [PubMed] [Green Version]
  34. Zhang, T.; Hou, Y.; Meng, T.; Ma, Y.; Tan, M.; Zhang, F.; Oenema, O. Replacing synthetic fertilizer by manure requires adjusted technology and incentives: A farm survey across China. Resour. Conserv. Recycl. 2021, 168, 105301. [Google Scholar] [CrossRef]
  35. Assefa, B.T.; Chamberlin, J.; Reidsma, P.; Silva, J.V.; van Ittersum, M.K. Unravelling the variability and causes of small-holder maize yield gaps in Ethiopia. Food Secur. 2020, 12, 83–103. [Google Scholar] [CrossRef] [Green Version]
  36. Anbessa, F.; Abraham, T.; Ashagre, H. Performance of maize (Zea mays L.) influenced by NPSB blended fertilizer rates and plant population on yield and economic analysis at Bako. Green Farm. 2020, 11, 111–117. [Google Scholar] [CrossRef]
  37. Liu, Z.; Yang, X.; Lin, X.; Hubbard, K.G.; Lv, S.; Wang, J. Maize yield gaps caused by non-controllable, agronomic, and socioeconomic factors in a changing climate of Northeast China. Sci. Total Environ. 2016, 541, 756–764. [Google Scholar] [CrossRef]
  38. Sher, A.; Khan, A.; Ashraf, U.; Liu, H.H.; Li, J.C. Characterization of the effect of increased plant density on canopy morphology and stalk lodging risk. Front. Plant Sci. 2018, 9, 1047. [Google Scholar] [CrossRef]
  39. Shao, H.; Shi, D.; Shi, W.; Ban, X.; Chen, Y.; Ren, W.; Chen, F.; Mi, G. The impact of high plant density on dry matter remobilization and stalk lodging in maize genotypes with a different stay-green degree. Arch. Agron. Soil Sci. 2020, 67, 504–518. [Google Scholar] [CrossRef]
  40. Robertson, D.J.; Julias, M.; Lee, S.Y.; Cook, D.D. Maize stalk lodging: Morphological determinants of stalk strength. Crop Sci. 2017, 57, 926–934. [Google Scholar] [CrossRef] [Green Version]
  41. Shi, D.; Li, Y.; Zhang, J.; Liu, P.; Zhao, B.; Dong, S. Increased plant density and reduced N rate lead to more grain yield and higher resource utilization in summer maize. J. Integr. Agric. 2016, 15, 2515–2528. [Google Scholar] [CrossRef] [Green Version]
  42. Ma, D.; Xie, R.; Liu, X.; Niu, X.; Hou, P.; Wang, K.; Lu, Y.; Li, S. Lodging-related stalk characteristics of maize varieties in China since the 1950s. Crop Sci. 2014, 54, 2805–2814. [Google Scholar] [CrossRef]
  43. Wang, Q.; Xue, J.; Zhang, G.; Chen, J.; Xie, R.; Ming, B.; Hou, P.; Wang, K.; Li, S. Nitrogen split application can improve the stalk lodging resistance of maize planted at high density. Agriculture 2020, 10, 364. [Google Scholar] [CrossRef]
  44. Rossini, M.A.; Maddonni, G.A.; Otegui, M.E. Inter-plant competition for resources in maize crops grown under contrasting nitrogen supply and density: Variability in plant and ear growth. Field Crops Res. 2011, 121, 373–380. [Google Scholar] [CrossRef]
  45. Piao, L.; Qi, H.; Li, C.; Zhao, M. Optimized tillage practices and row spacing to improve grain yield and matter transport efficiency in intensive spring maize. Field Crops Res. 2016, 198, 258–268. [Google Scholar] [CrossRef]
  46. Seilsepour, M.; Jafari, P.; Molahoseini, H. The effects of drought stress and plant density on yield and some agronomic traits of maize (Sc301). Res. Agric. Sci. 2007, 2, e12–e13. [Google Scholar]
  47. Ciampitti, I.A.; Murrell, S.T.; Camberato, J.J.; Tuinstra, M.; Xia, Y.; Friedemann, P.; Vyn, T.J. Physiological dynamics of maize nitrogen uptake and partitioning in response to plant density and nitrogen stress factors: II. Reproductive phase. Crop Sci. 2013, 53, 2588–2602. [Google Scholar] [CrossRef]
  48. Oury, V.; Tardieu, F.; Turc, O. Ovary apical abortion under water deficit is caused by changes in sequential development of ovaries and in silk growth rate in maize. Plant Physiol. 2016, 171, 986–996. [Google Scholar]
  49. Knappenberger, T.; Koller, K. Simulation of germination and emergence of corn to gain information for sitespecific drilling. Bulletin of University of Agricultural Sciences and Veterinary Medicine Cluj-Napoca. Agriculture 2008, 65, 147–152. [Google Scholar]
  50. Zhao, X.; Mei, P.; Zhang, F.; Wu, F.; Xue, H.; Zhang, J.; Huang, R.; Tang, B.; Li, C. Effects of seed grading on growth and yield of summer maize under no-tilling precision sowing conditions. Bangladesh J. Bot. 2016, 45S, 803–810. [Google Scholar]
  51. Zhao, P.; Cao, G.; Zhao, Y.; Zhang, H.; Chen, X.; Li, X.; Cui, Z. Training and organization programs increases maize yield and nitrogen-use efficiency in smallholder agriculture in China. Agron. J. 2016, 108, 1944–1950. [Google Scholar] [CrossRef]
  52. Kamran, M.; Cui, W.; Ahmad, I.; Meng, X.; Zhang, X.; Su, W.; Chen, J.; Ahmad, S.; Fahad, S.; Han, Q.; et al. Effect of paclobutrazol, a potential growth regulator on stalk mechanical strength, lignin accumulation and its relation with lodging resistance of maize. Plant Growth Regul. 2018, 84, 317–332. [Google Scholar] [CrossRef]
Figure 1. Research conceptual framework for sowing the density difference and plant density loss assessment. The upper layer shows the primary causes of and assessment methods for density loss. The middle layer shows the process of density loss. The lower layer shows the methods of data collection. ODRA, MSD, TSD, ASD, ED, MPD and NME represent the optimal density recommended by agronomists, mechanical set density, theoretical seed density, actual seed density, emergence density, mature plants density and number of maize ears, respectively. DIFFERENCE 1 refers to the sowing density difference between ODRA and MSD; LOSS 1, LOSS 2, LOSS 3, LOSS 4 and LOSS 5 refer to the plant density losses from MSD to TSD, TSD to ASD, ASD to ED, ED to MPD and MPD to NME, respectively; INC. 2 represents INCREASE 2 and refers to plant density increase due to multiple seedlings in one position.
Agriculture 11 00480 g001
Figure 2. The fields distribution of the farmers surveyed in the study (n = 50). The green zone on the left is the North China Plain, in the middle is Yuzhou County, the yellow dots on the right are the tracking field sites and the red dots are the density experiment location. Maps were adopted from the Resource and Environment Data Cloud Platform (http://www.resdc.cn (accessed on 7 January 2021)) and Earth Online (https://www.earthol.com/ (accessed on 7 January 2021)).
Agriculture 11 00480 g002
Figure 3. Seeder used and schematic diagrams of density loss. (a) The control lever used to adjust the interplant distance of the seeded; (b) the seeder in the field; (c) a representative image of seedling emergence in the field; (df) diagrams of LOSS 2, INCREASE 2, LOSS 3, LOSS 4 and LOSS 5. LOSS 2, LOSS 3, LOSS 4 and LOSS 5 refer to the plant density losses from TSD to ASD, ASD to ED, ED to MPD and MPD to NME, respectively. INCREASE 2 (INC. 2) refers to a plant density increase due to multiple seedlings in one position.
Agriculture 11 00480 g003
Figure 4. Pathways of the sowing density difference and plant density losses in smallholder maize crops. The cylinder represents the progress of density difference and loss. The upper exits are the density dif-ference and loss path and quantity and the lower entrance is an increase path and quantity; the values in parentheses are the ratio of the differences and losses to ODRA. The values inside the cylinder were the average densities at different stages with the loss or increase of density, and the values in white round brackets were the ratios of the current density to ODRA; the values in black round brackets were the coefficient of variations of density of 50 farmers. The ODRA, MSD, TSD, ASD, ED, MPD and NME represent the optimal density recommended by agronomists, mechanical set density, theoretical seed density, actual seed density, emergence density, mature plants density and number of maize ears, respectively. DIFFERENCE 1 refers to the sowing density difference between ODRA and MSD; LOSS 1, LOSS 2, LOSS 3, LOSS 4 and LOSS 5 refer to the plant density losses from MSD to TSD, TSD to ASD, ASD to ED, ED to MPD and MPD to NME, respectively. INCREASE 2 refers to the plant density increase due to multiple seedlings in one position.
Agriculture 11 00480 g004
Figure 5. Drivers and barriers to the adoption of increasing density practices for smallholder farmers (n = 50). (a) Farmer attitudes toward increasing the density, (b) perceived influence of social referents and (c) perceived behavior controls. The positive values represent drivers and negative represent barriers. The error bars are standard deviations.
Agriculture 11 00480 g005
Figure 6. Structural equation model showed the causal relationship between the maize yield and the process of density losses. (a) The relationship between the variables, and (b) the direct, indirect and total path coefficients of INCREASE 2, LOSS 4, LOSS 5, total agronomic losses and NME toward the yield. The solid and dotted lines represent positive and negative correlations, respectively. Adjacent number that are labeled in the same direction as the arrow represents path coefficients, and the width of the arrow is in proportion to the degree of path coefficients. R2 values indicate the proportion of variance explained by each variable. The root mean square error of the approximation index was used to test the adequacy of the models. The single and double asterisks indicate significant differences at p < 0.05 and p < 0.01, respectively. The NME represents the number of maize ears. LOSS 4 and LOSS 5 refer to the density losses from ED to MPD and MPD to NME, respectively. INCREASE 2 refers to the plant density increase due to multiple seedlings in one position.
Agriculture 11 00480 g006
Figure 7. The maize yield according to the business as usual (BAU) scenario and four other scenarios. Scenario 1 (S1) represents the yield after controlling the sowing density difference caused by farmer decision-making, Scenario 2 (S2) and Scenario 3 (S3) after controlling the plant density losses caused by the mechanical and agronomic factors, respectively, and Scenario 4 (S4) after controlling all causes of the density differences and losses.
Agriculture 11 00480 g007
Publisher’s Note: MDPI stays neutral with regard to jurisdictional claims in published maps and institutional affiliations.

