Article

Patterns of Use of Residue Biomass in Cereal–Sheep Production Systems of North Africa: Case of Tunisia

1
Institut Supérieur D’agriculture de Chott Mariem (ISA CM), University of Sousse, 4042 Sousse, Tunisia
2
International Center for Agricultural Research in the Dry Areas (ICARDA), INRAT-Rue HédiKarray-CP, 2049 Ariana, Tunisia
3
Ecole Supérieure D’agriculture Morgane (ESAM), University of Carthage, 1100 Zaghouan, Tunisia
*
Author to whom correspondence should be addressed.
Agriculture 2021, 11(7), 612; https://doi.org/10.3390/agriculture11070612
Submission received: 18 May 2021 / Revised: 10 June 2021 / Accepted: 11 June 2021 / Published: 30 June 2021

Abstract

:
This paper analyzes the complex relationships of factors influencing residue biomass management in cereal–sheep production systems in semi-arid areas of Tunisia. The Bayesian belief network (BBN) methodology was applied to identify factors enabling the better management of crop residue (CR) at the farm level. Data were collected from 152 farms located in the governorate of Siliana in north-west Tunisia. After designing the complex interactions between different variables that have an influence on the allocation of CR, BBN was also applied as a predictive model by inserting evidence conditional probabilities on the quantity of CR left on the soil and simulating the incurrent changes in the probability state of the remaining network variables. The results show that around 70% of farmers in our sample retain an overall quantity of CR lower than 200 kg/ha. The share of livestock income, livestock herds, cost of livestock feed, and off-farm income are all factors that have a strong influence on residue biomass management.

1. Introduction

Conservation agriculture (CA) is one of the practices promoted to enhance the sustainable intensification of agriculture. Retaining crop residue (CR) as surface mulch, together with minimum soil disturbance and crop rotation and associations, forms the basis of CA [1,2]. In this regard, covering the soil is strongly recommended for reducing surface runoff, improving rainwater infiltration and soil moisture, and suppressing and controlling weed growth [3,4,5,6]. Thus, keeping a big quantity of CR is an objective leading to an increase of soil productivity. Soil cover is also considered as a highly valuable agroecological practice. Agroecology applies ecological theory to the design and management of sustainable agroecosystems [7]. Animals play an essential role in agroecosystems by producing protein-rich food for humans from inedible resources (e.g., crop residues), providing ecosystem services, recycling plant nutrients, and providing social benefits [7,8]. One of the most important principle of the agroecology is to reduce inputs by rather relying on natural processes, such as the retention of high quantities of crops residues and the introduction of livestock in the farm to enhance soil fertility over the years.
Sheep breeding combined with cereal production for feed and food are the dominant agricultural production systems covering very large semi-arid areas in North Africa [9]. Integrated crop–livestock systems are efficient in terms of cycling nutrients, preserving natural resources, improving soil quality, and enhancing biodiversity [10,11]. This integration is considered necessary to achieve long-term agricultural productivity and sustainable intensification. Complementarities between these activities refer to the ability of animals in valorizing natural and cultivated biomass resources. However, integrated crop–livestock systems in semi-arid North Africa, and particularly north-west Tunisia, are characterized by poor cereal rotations and lack of biomass, including CR, for animal feed. Feeding livestock with crop residues is a common practice in developing countries [12,13,14]. Short-term economic and social benefits of livestock justify their importance and drive many of smallholder farmers’ decisions concerning the allocation of farm and even neighboring biomass. For these reasons, CR is the subject of competition related to its usage as livestock feed or permanent soil cover. The major problem of integrated crop–livestock within the context of CA is related to management of residue biomass. This is mostly due to the low availability of biomass, especially in semi-arid and arid areas, the increasing demand of biomass for livestock production, and the low availability of alternative resources. Therefore, trade-offs concerning the use of natural resources are often dependent on the specific biophysical farming characteristics in addition to other fundamental factors affecting their availability and demand. Trade-offs also depend substantially on individual preferences, time scale, spatial scale, and the biophysical and socioeconomic conditions. They may occur between agricultural and broader environmental or socio-cultural objectives [15] or between short- and long-term motivations and decisions.
Assessing trade-offs related to residue biomass use has been frequently debated in the literature. This is the case of integrated crop–livestock systems based on maize and dairy production in eastern and western parts of Kenya, which face problems of CR allocation [6]. The same is also observed in other sub-Saharan African countries [12,14]. Ref. [16] demonstrated that only 3% of farmers in the Ethiopian Rift Valley retain more than 1 t/ha of CR. In addition [17] demonstrate that farmers’ decisions about CR allocation in sub-Saharan Africa and South Asia usually depend on their preferences, crop production levels, access to alternative biomass resources, and level of biomass demand used as livestock feed. Type of production system (extensive or intensive) is also a major factor influencing farmers’ decisions on biomass allocation [14]. Ref. [18] indicate that, due to low biomass production, farmers in Zimbabwe face a big challenge concerning CR management in an integrated crop–livestock system. They suggest some options for CR management such as fencing of fields to reduce access and so reduce the chances of residue biomass grazing by free roaming cattle during the dry season and construction of rakes to pile up residue biomass where cattle cannot access it. Ref. [19] demonstrated that the specific practices of small farmers and socioeconomic circumstances are the major barriers for CA adoption in mixed farm in southern Africa. Moreover, Ref. [20] assessed the major problem of CR management in mixed crop-livestock in Mexico’s central highland. They suggest that partial residue retention, sequential introduction, and a combination of technologies may facilitate CA uptake in mixed system. Ref. [21], also indicate that there is an increase of pressure on CR in mixed system in Sub Saharan Africa (SSA) due to the increase of human and livestock. To reduce the rely on CR, authors suggest increasing the overall biomass production, fodder quality and increasing the efficiency of livestock production. In addition, in the semi-arid Zimbabwe [22,23] indicate that farmers face strong trade-offs due to the limited biomass resources and the competing on CR use as mulch or as livestock feed.
Despite the large number of studies illustrating and characterizing CR management in sub-Saharan Africa, a large gap exists in regard to similar studies focusing on the typical production systems of North Africa (including Tunisia, Algeria, and Morocco). The objective of this paper is to contribute to closing this knowledge gap, by providing a characterization of a cereal–sheep production system, highly representative of the whole cereal–sheep belt across all semi-arid areas of North Africa. The paper provides a comprehensive assessment of the drivers that affect CR management in the cereal–sheep production systems of northern Tunisia.
The above studies show the significant potential for applying a Bayesian belief network (BBN) in context of CR management due to its capacity to assess the influences and interdependencies of different types of factors, and accordingly weightage and ranking of the contributing factors for an “outcome event.” The aim of this research is (a) to identify factors enabling the achievement of better management of CR at farm level and (b) analyzing policy scenarios by imposing conditional probabilities (using the BBN approach) on some policy-oriented variables and analyzing probability changes in the remaining variables [24] in order to elaborate a possible future outcome for better management of CR in cereal–sheep production systems of semi-arid Tunisia. An embedded part of our BBN application will be CR quantification by applying the method of harvest index (HI). This paper is divided into five sections: we commence with an introduction stating the problem of residue biomass in the studied cereal–sheep production systems. Then, we present a literature review about the application of BBN for natural resources management and decision. The third section provides an overview of the methodology used, and the fourth and fifth sections present the results and discussion, respectively. The last section provides the conclusion.
  • Literature review: BBN for analyzing natural resources management
Given that CR management is affected by various types of factors, we opted for a Bayesian approach (i.e., BBN), which allows the integration of these different variables. Bayesian belief networks are a useful tool to account for uncertainty since most problems of naturelle resources are characterized by uncertainty and risks. It also can be used to incorporate stakeholder understanding of how a system works. By doing so, BBNs provide a framework to visualize interactions between variables and a communication space between scientists, stakeholders, and decision-makers from multi-disciplinary backgrounds [25,26,27,28,29]. BBN was used in many natural resources domains to support decision making [30] such as water management, allowing policy makers to better understand local perspectives and be better able to consider the most acceptable options [31,32], ecological modelling to represent species–habitat relationships and population viability of terrestrial and aquatic vertebrates [24,33], land management [34], etc.
One of their strongest benefits is the possibility of integrating ecology, economics, and social sciences [27,35,36,37] within the same analytical decision model and use it to improve policy making. Another important advantage of BBN is the possibility of covering both subjective probabilities (based on experts’ opinions and other minimum data approaches) and probabilities based on objective and real data. In fact, BBN incorporates the qualitative beliefs and attitudes of stakeholders, so-called prior knowledge, along with quantitative data which allows an optimal combination of qualitative information with quantitative data collected from surveys [38]. The BBN models are powerful tools for probabilistically simulating natural systems and emulating process models. They have been used to clarify some causal linkages, through probabilistic relationships (evidenced through observed data of farm samples), leading to specific residue management patterns.

2. Materials and Methods

2.1. Study Area

The governorate of Siliana, the object of this study, is located in north-west Tunisia (Figure 1). It covers a total area of 4642 km2 and represents 2.8% of the total country area. Cereal crops occupy 39% of the total cultivated area, followed by 20% for olive trees, 14% for forage crops, and the remainder is distributed across horticultural and fruit trees. Forests and rangelands represent 23% of the total agricultural area in the governorate. Siliana was chosen due to the importance of cereal cultivation, the abundance of poor cereal rotations (barley followed by wheat, or wheat after wheat), the importance of sheep breeding activity, and the abundance of small-size farms. The dry summer period in Siliana is characterized by a shortage of biomass for animal feed, which creates high competition for CR during this period. The average daily temperature range in Siliana during the coldest period 3.2–13 °C, and average daily temperature range during the hottest period is 19.7–35.7 °C. Snowfall occurs quite frequently in the areas of Siliana located at more than 700 m of altitude. Average annual rainfall is 250–600 mm and can reach around 800 mm in some high plateaus of the region. Rainfall statistics indicate significant annual and inter annual irregularity. The total cereal production in the delegation of Makther is about 8677 tons in 2014 which represent 8% of the total production of the governorate. Forage production is about 8885 tons for the same year thus representing only 4% of the total governorate production. Cereal production in the delegation of Makther increased by 15% between 2014 and 2017. Durum wheat production in Siliana hold the highest percentage across the cereals (61% of total cereal production in 2014) whilst barley and soft wheat productionrepresented 29% and 10% respectively in 2014 [39].
Data used in this research were collected during the 2013/2014 season. A random sample of 152 farmers was selected in the delegation of Makther (Figure 1), community of Chouarnia. Farmers practice the rotation of four types of cereal crops barley, durum wheat, soft wheat and oat. Vetch and other forage mixtures have been newly introduced in the site and are cultivated by some farmers. Farmers use very low quantity of fertilizers after ploughing which is due to many economic factors including lack of market supply. Ref. [40] in their study suggested that the level of the nitrogen supplied to the soil with fertilizer should be around 170 Kg N/ha Farmers in our study case usually added very modest quantities of nitrogen 88% lower than the recommended quantity. Other quantities of Di Ammonium phosphates are also added in some cases. Carbon cycle based on residues mineralization would be the most important source of soil organic carbon (SOC) in the soil in the long term in the selected site. Most farmers are using mechanization for ploughing, seeding and harvesting. After the harvest, farmers usually keep a small quantity of the total biomass on the field. They further graze these residual parts with their livestock for an average of 6 h per day during the three driest months on the year (June to July). They further use concentrate, barley, and bran to complement their livestock feed requirements during this period. The questionnaire was composed of eight basic sections: the first section concerned general information of farmers; the second included questions about farms (e.g., size and land use); the third was about mechanization; the fourth concerned technical–economic information; the fifth included questions about livestock production; the sixth was about commercialization; the seventh included questions about perception of farmers and contingency assessment; and the last concerned the role of women in the agriculture sector.

2.2. BBN Method

2.2.1. BBN Framework

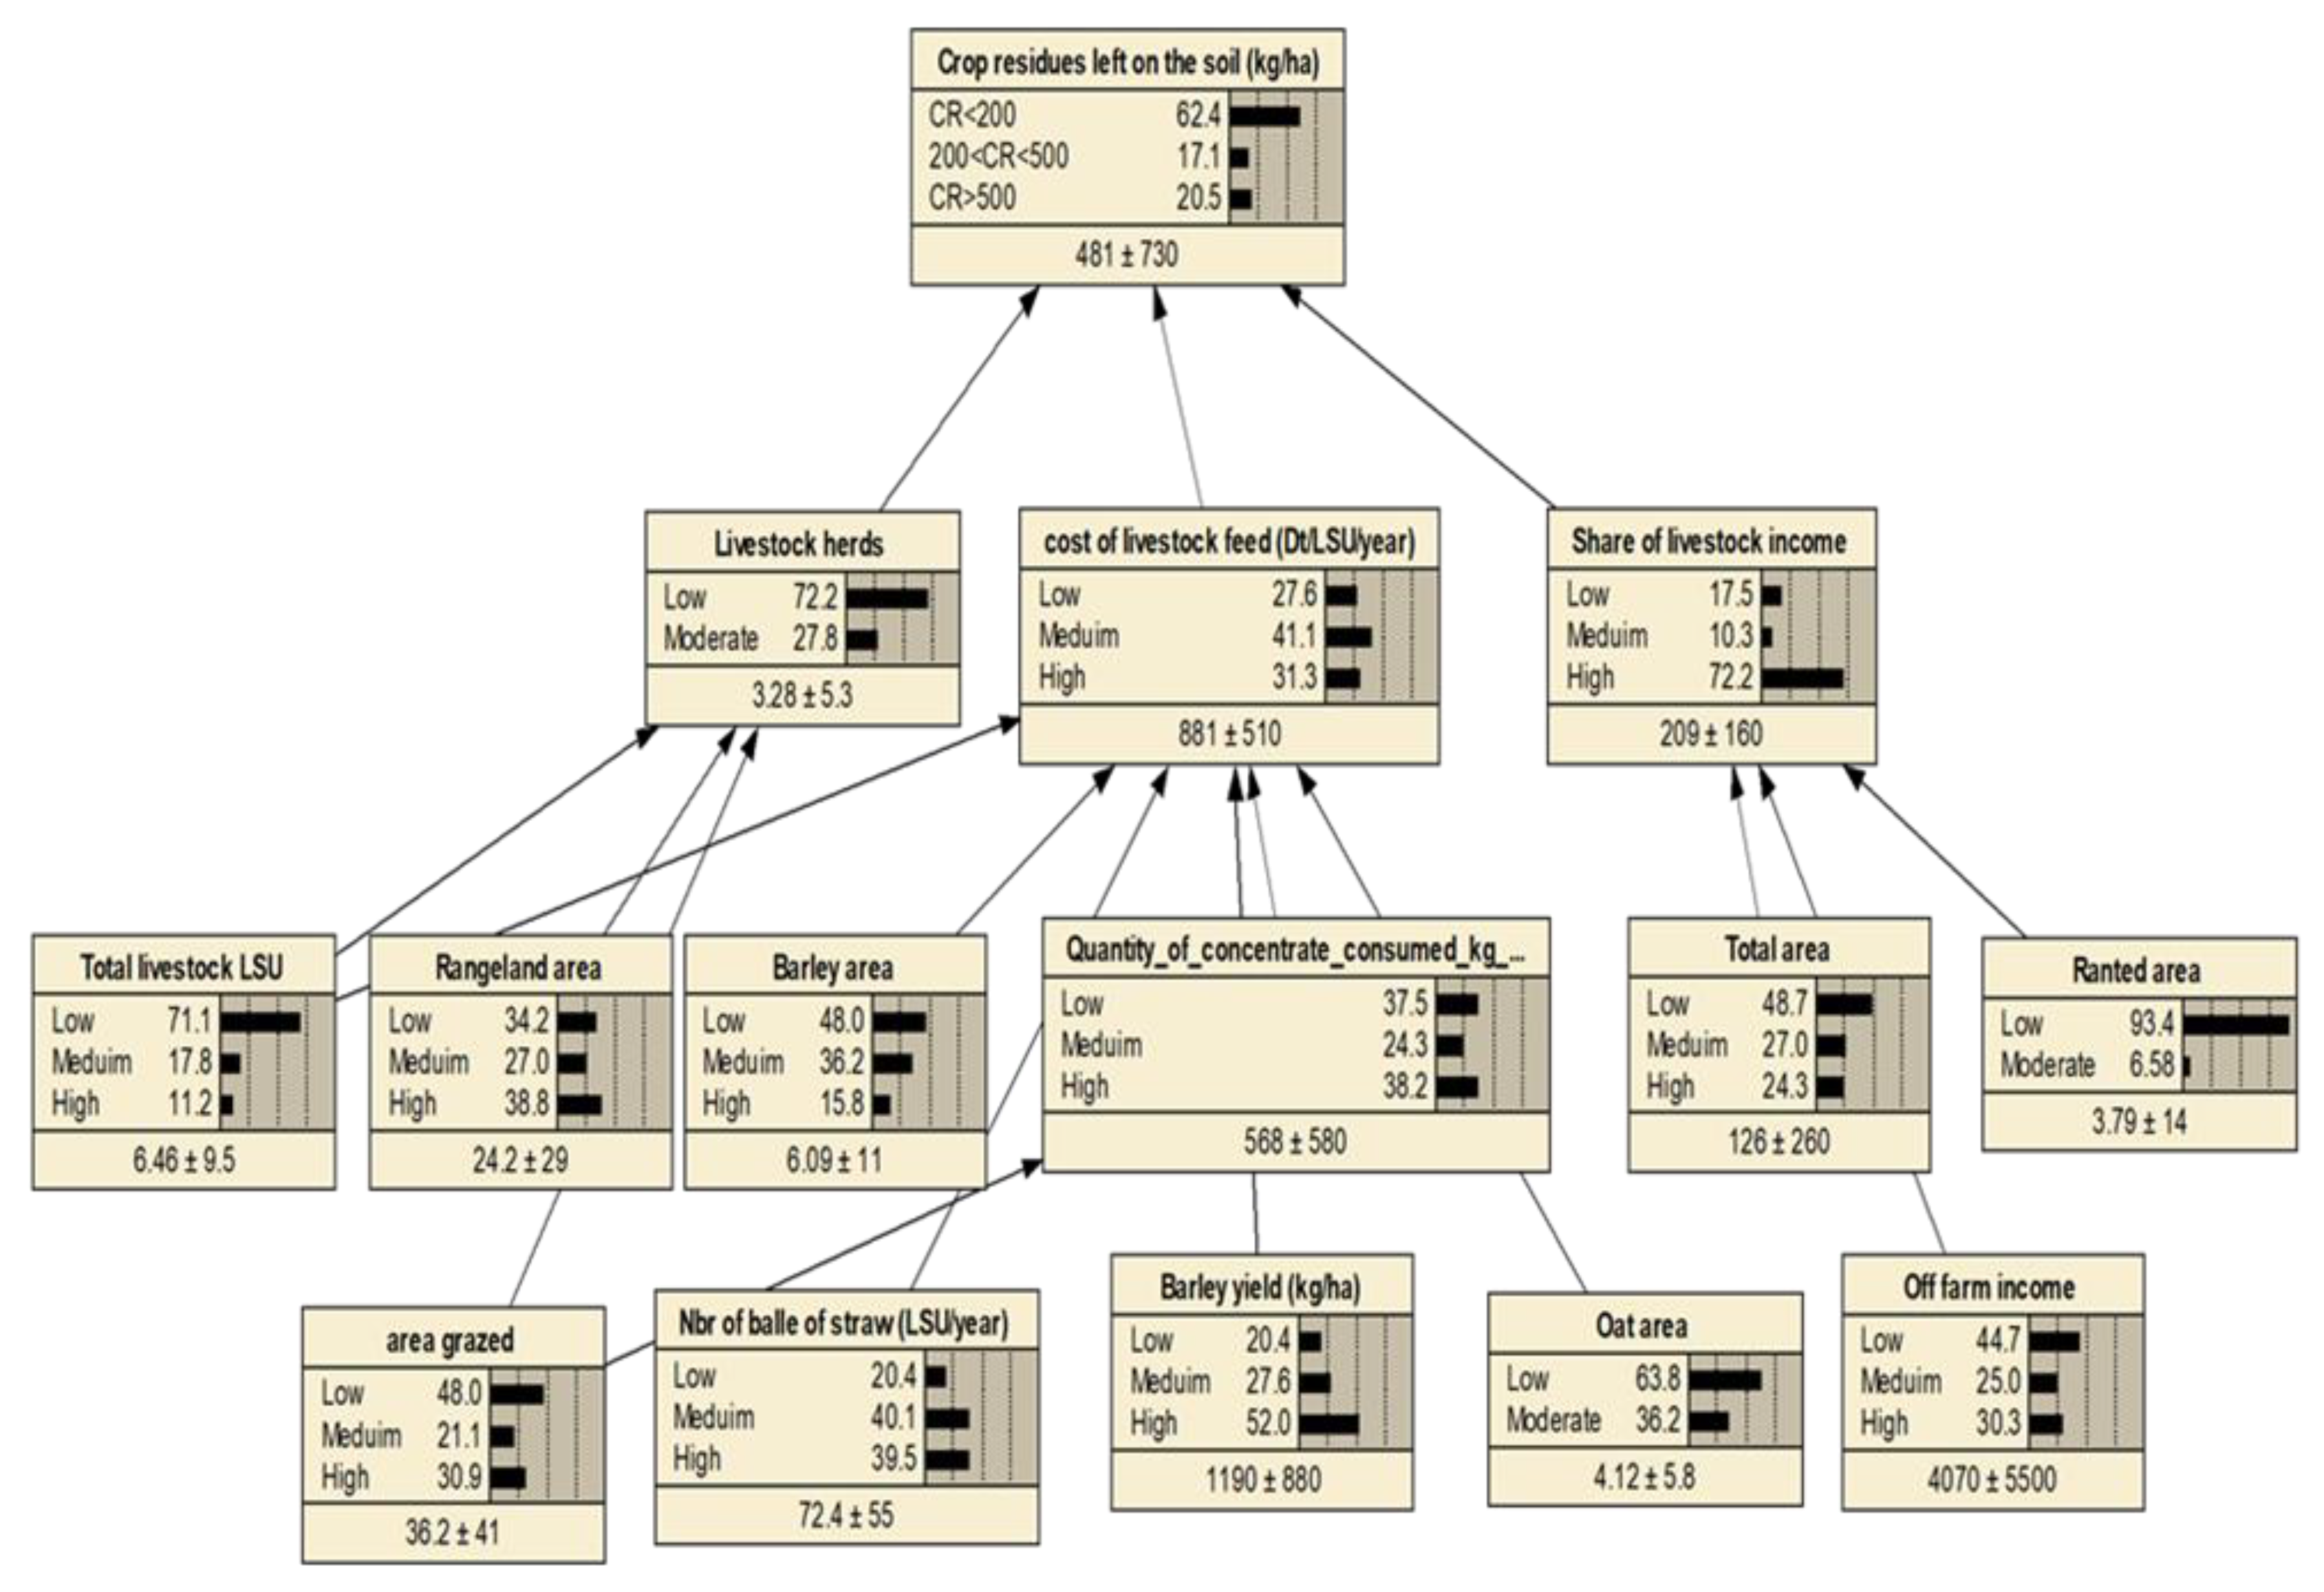
To develop the BBN structure for our case we start by defining and presenting the target issue that needs to be modeled (Figure 2), which usually reflects the final causal link (or also the outcome of our causality network) which we aim to depict. A child node is also called an “outcome event,” which is the quantity of the CR left on the soil—this should be a discrete variable and take three states: CR ≤ 200 kg/ha, 200 < CR < 500 kg/ha, and CR ≥ 500 kg/ha. We then tried to choose three (or more) primary variables that directly influence the probability of the different discrete states of the outcome event (the CR left on the soil). These variables, also called “parent nodes,” are the share of livestock income in total farm income, the cost of livestock feed, and livestock herds (number of livestock per hectare). The third layer of nodes is called “secondary variables” and influence the probability of the parent nodes (primary variables) in different ways. Examples of these variables are total area, barley area, rangeland area, quantity of concentrate consumed, and off-farm income. Once the task of designing the causality network is achieved, the first step of defining the BBN structure is considered complete. The outcome, primary, and secondary variables used, their discretization and the results of Anova and post hoc test: Least Significant Difference test (LSD) which is a tool used in this paper to identify which pairs of means are statistically different are presented in Table 1 and Figure 2. Anova test shows the difference of means of variables across groups. The LSD test is the same as Duncan’s MRT, but with t-values instead of Q values. The results of the LSD test show significant differences across groups (see Table 1).
After the development of the BBN structure, the following step consists of collecting data that will serve for “training the BBN model” through calculation of conditional probability tables (CPTs) using the “expectation maximization algorithm” [41]. Prior probabilities are assigned to source nodes, and conditional probabilities are associated with arcs. The CPT is a set of conditional probability distributions that define a probability distribution over the output variable given all combinations of values of the input variables included in the Bayesian network. CPT stores every possible combination of the states of the parent. Once the CPTs of the variables are learned from Data, the BBN can be compiled and used for analysis. This is performed by altering the states of some nodes while observing the effect on others. In fact, the initial, so called prior probability of an event A can be updated by collecting appropriate information about its driver event B. The Netica software calculates CPTs based on Bayes theorem, whereby new information that becomes available revises the prior probability, which is then used to calculate the likelihood that the linked variables of interest are in particular states (referred to as posterior probability). The CPT can also be used for the simulation of different options and scenarios including test on the structure, sensitivity analysis, etc. Scenario simulation using BBN can be done by fixing a prior probability of a given influencing variables and checking which state of other variables could slightly enhance the probability of having high quantity of crop residues left on the field by farmers.
In addition to the calculation of CPTs, a sensitivity analysis is conducted to identify the variables that reveal the most information and influence on a target node (CR). Sensitivity analysis can be done for any node of the resulting BBN. Mutual information is an indicator used to identify the variable that reveals the most information on a target node.

2.2.2. BBN Scenario Building

In addition to the presentation and analysis of different factors affecting CR management at farm level, BBN is used in our case to elaborate the possible future enhancement of CR management. Thus, the objective of scenario analysis is the formulation of pathways and policy recommendations that can help better understanding changes in order to shift more sustainable CR management pattern. The BBN scenarios analyzed in this paper follow:
  • Scenario S1: simply check for posterior probabilities of a given set of variables (Table 1) which help to keep a high quantity of CR (>500 kg/ha) on the soil. In S1, we do not impose any prior condition on the rest of the parent and secondary nodes. We simply select the target node “CR left on the soil” particularly for its state “CR > 500 kg/ha” (Figure 2) and explore the different changes that accrue to the probability distributions of primary and secondary variables. This will help us understand the key elements on which we have to act if aiming to maximize the probability of having “CR > 500 kg/ha” left on the soil in the study area. The quantity of CR > 500 kg/ha was taken only as a benchmark since this is the best average value, we were able to record for the identified small farm groups. The recommended quantities of CR can go from 1000 kg up to 1500 kg per ha.
Testing the sensitivity of the “target” node “quantity of CR left on the soil” to the list of variables illustrated in the BBN causality network shows that this node is the most sensitive to the “share of livestock in total farm income.” The latter variable is then chosen to build further scenarios as follow:
  • Scenario S2: we fixed a prior condition of “CR > 500 kg/ha” (100% of probability) + prior condition of the “share of livestock income < 30%” (farms with small contribution of livestock to total revenue) (at 100% of probability).
  • Scenario S3: we fixed a prior condition of “CR > 500 kg/ha” (100% of probability) + prior condition of the “share of livestock income of 30–60%” (farms with medium contribution of livestock to total revenue) (100% of probability).
  • Scenario S4: we fixed a prior condition of “CR > 500 kg/ha” (100% of probability) + prior condition of the “share of livestock income > 60%” (farms with high contribution of livestock to total revenue) (100% of probability).
The list of primary and secondary nodes (whole network structure) does not change from one scenario to another. What is changing is the state value of given primary and secondary nodes (which are actually discrete variables) (Table 2).

2.3. Quantification of CR Left on the Soil

Measuring CR using only primary survey data remains challenging. In this study, we build on [42] by developing an innovative formula based on the HI. The HI is not a new method, but we use it in an innovative way as we combine it with other real primary data to extract information about CR left on the soil. The HI values for the selected crops in our study area are taken from previous studies in the same region [43,44,45,46,47]. The HI is defined in this paper as the ratio of observed grain yield to above ground biomass:
HIi = GYij/AGMij
where HIi is the harvest index of crop i, which is the same for a given crop variety across all farmers of the same area, GYij (kg) is observed grain yield of crop i for farmer j, and AGMij (kg) is aboveground biomass of crop i measured at farm j. In our case, we calculate AGMij as follows:
AGMij = TQGij + CRSij + GYij + SSij
where TQGij is the total quantity of crop i residues grazed on the field of farmer j, CRSij (kg/ha) is the quantity of crop i residues left on the soil of farmer j, and SSij is the weight of the bales of straw sold or consumed by farmer j. Note that we are only interested in calculating the quantity of CR left on the soil (CRSij), which will then be calculated as:
CRSij = AGMij − (TQGij + GYij + SSij)
The total quantity of CR grazed by each type of livestock on the field is separately calculated based on the formula below:
TQGij = NbrDj × 0.3 × NbrLSUt
where NbrDj is the number of days farmer j spends grazing CR obtained from the farmer survey, NbrLSUt is the number of livestock units (LSUs) obtained after converting all livestock into the equivalent LSU using a specific coefficient for each type t of livestock, t = {sheep, goat, cattle} (For a precise calculation of fodder demand, we convert all ruminant livestock (cattle, sheep, and goats) into equivalent livestock units (ELU). The ELU is 1.0 for cattle, and 0.1 for sheep and goats [9]). To calculate the quantities of CR left on soil we use an estimate of the “average quantity of residues consumed by a sheep LSU during the whole summer grazing period” equivalent to 0.3 kg per day [48,49]. This value was estimated in the same study area as for our paper. Complementary measures and field assessments, including interviews with farmers and rapid field assessment, show that most of the crop residues are grazed after the first month, and that the daily intake is usually close to zero after two months of grazing. The remaining variables in Equation (2) (i.e., SSij and GYij) are captured through the farmer questionnaire implemented in the study area.

3. Results

3.1. Quantification of CR Left on the Soil

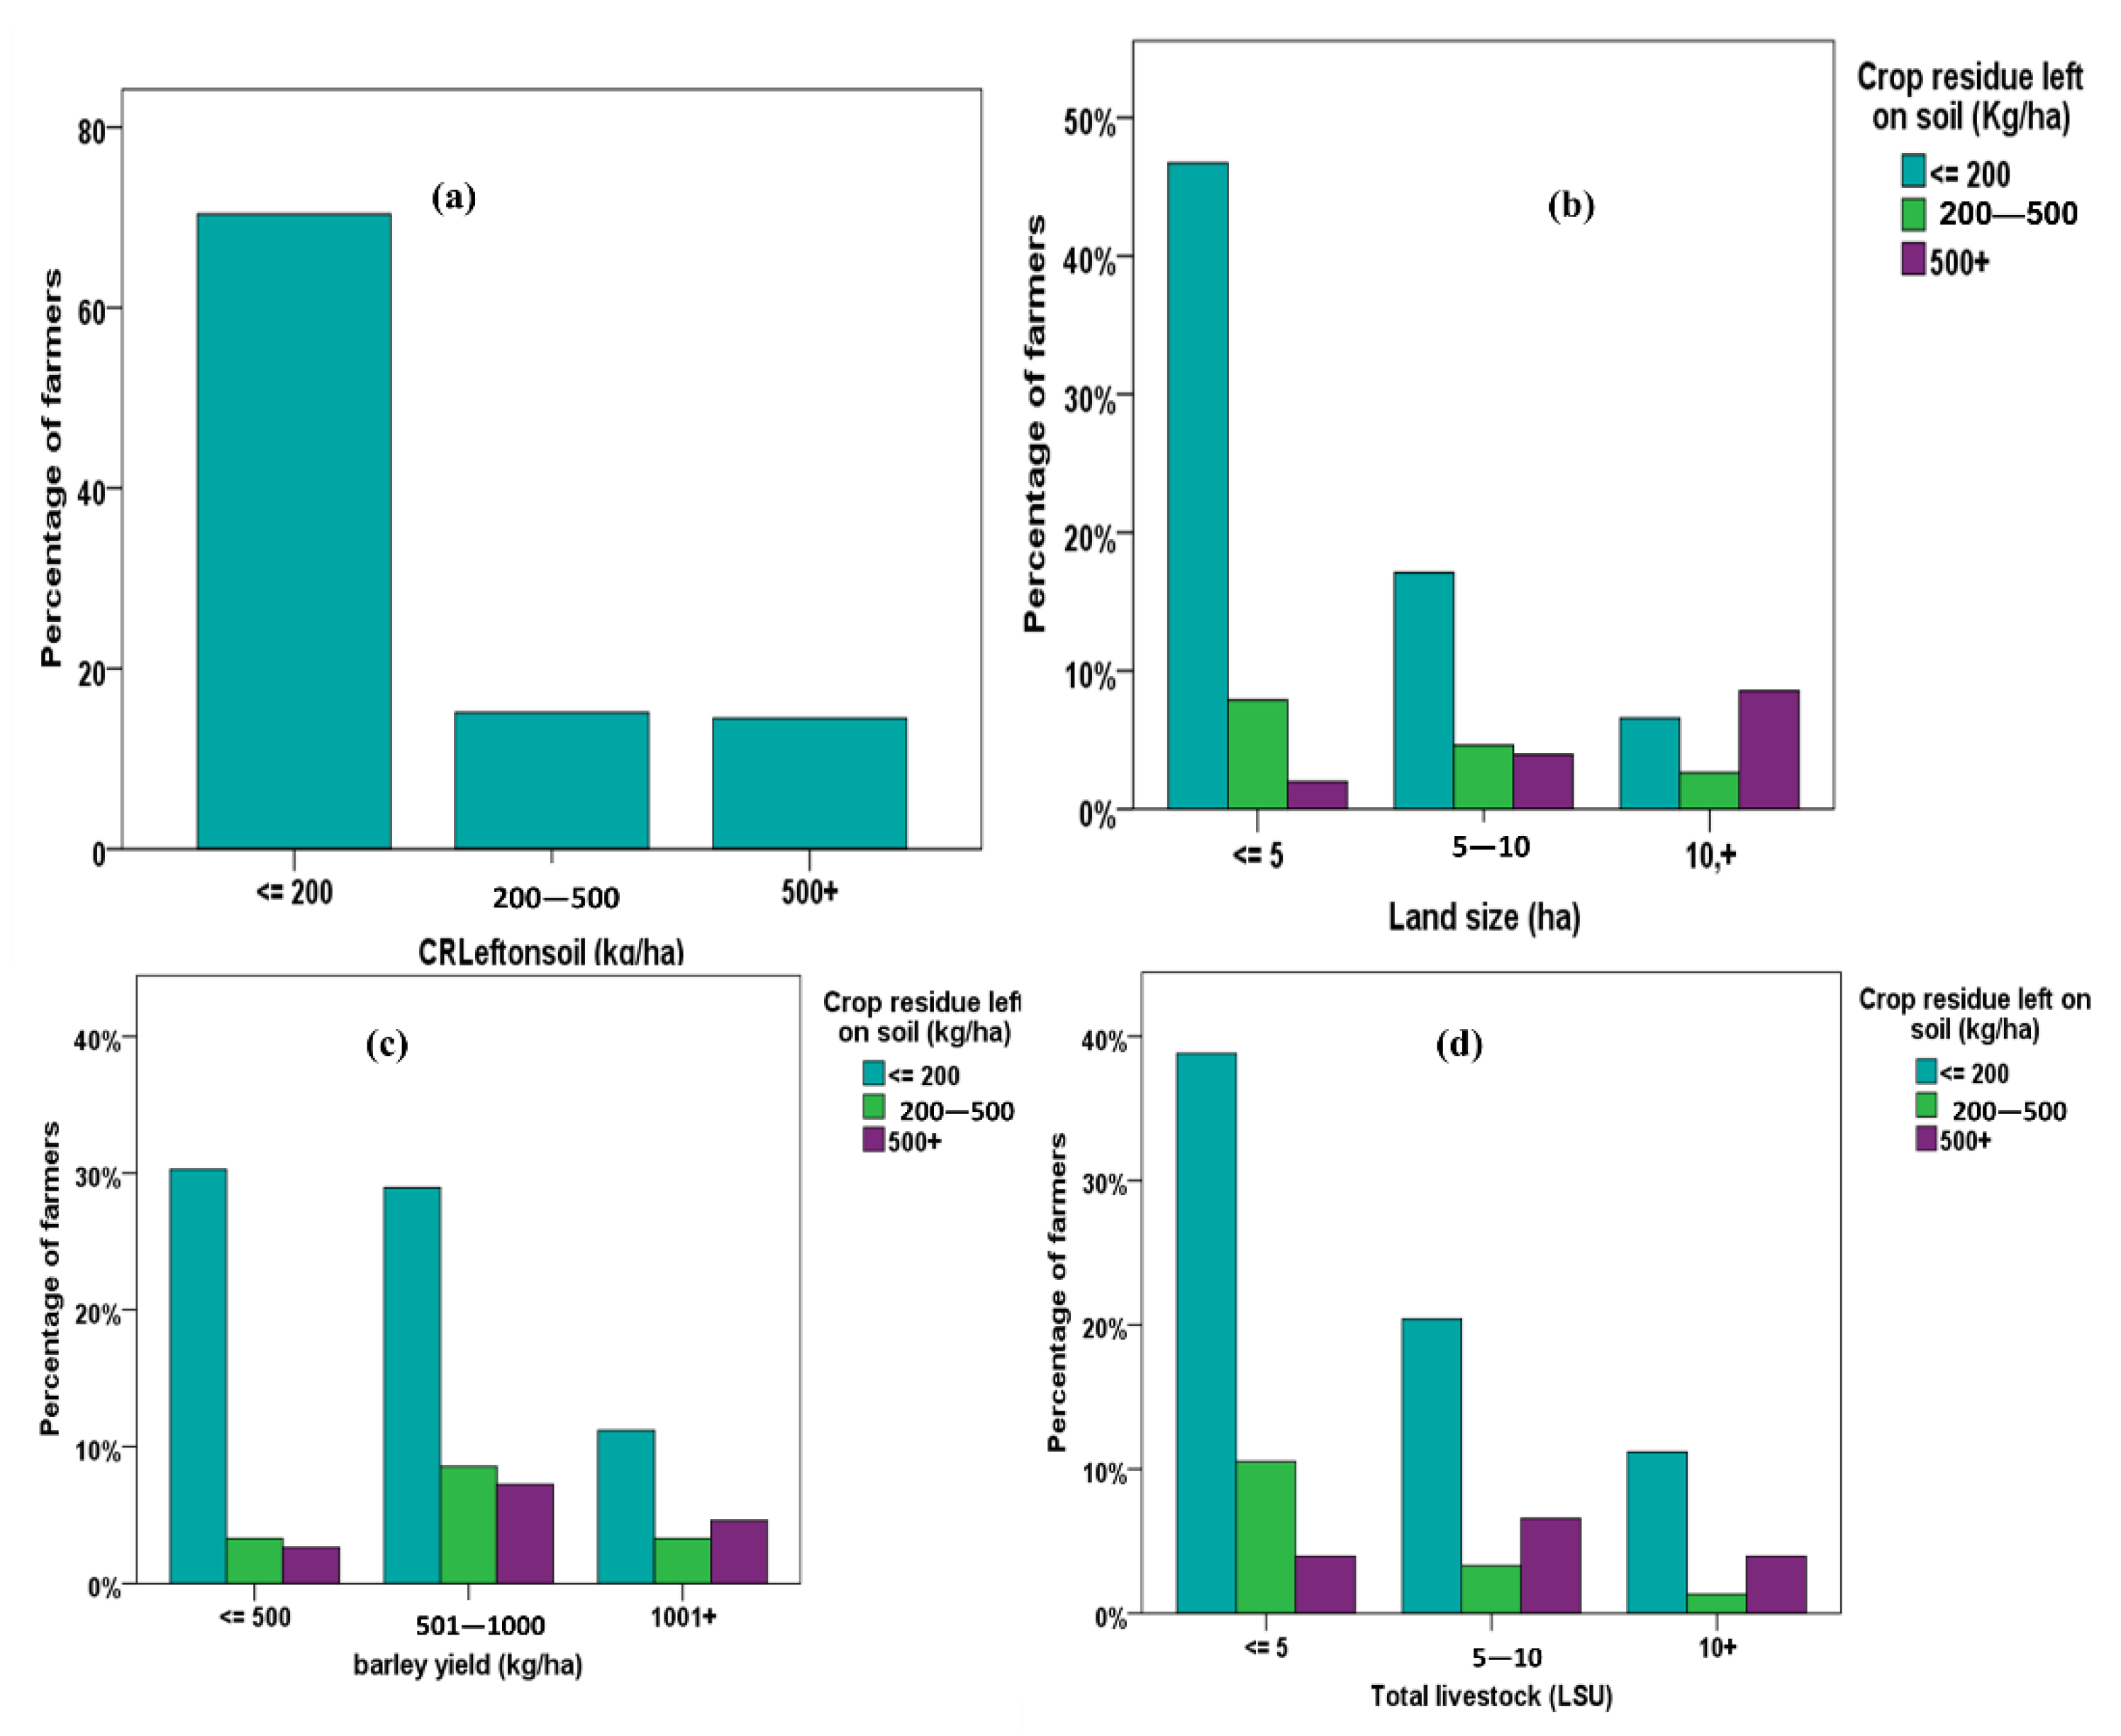
The farmer survey shows that 56% of farmers in our sample have a total land size less than 5 ha, 26% have 5–10 ha, and 18% have more than 10 ha. In regard to the cereal area, 72% of farmers cultivate less than 5 ha (small farms), 17% cultivate 5–10 ha (medium farms), and only 11% cultivate more than 10 ha (large farms). The percentage of small, medium, and large farms with less than 5 LSUs are 95%, 79%, and 52%, respectively. Around 70.4% of farmers retain an overall quantity of CR below 200 kg/ha, while 15.1% keep 200–500 kg/ha, and only 14.5% retain more than 500 kg/ha. Of the small and medium farms, there was 83% and 67% mulch with a quantity of CR less than 200 kg/ha, respectively (Figure 3b). This is not the case for large farms, with 48% mulch with CR higher than 500 kg/ha. Most farmers in the three farm groups retain low quantities of CR as soil cover (Figure 3c). Furthermore, descriptive statistics show that 84% of farmers who have barley (mostly used as feed) yield lower than 0.5 t/ha mulch CR at less than 200 kg/ha. About 65% and 59% of farmers who have barley yields of 0.5–1 and >1 t/ha, respectively, also mulch with less than 200 kg/ha. Additionally, 73% of farmers who have less than 5 LSUs mulch less than 200 kg/ha (Figure 3d).
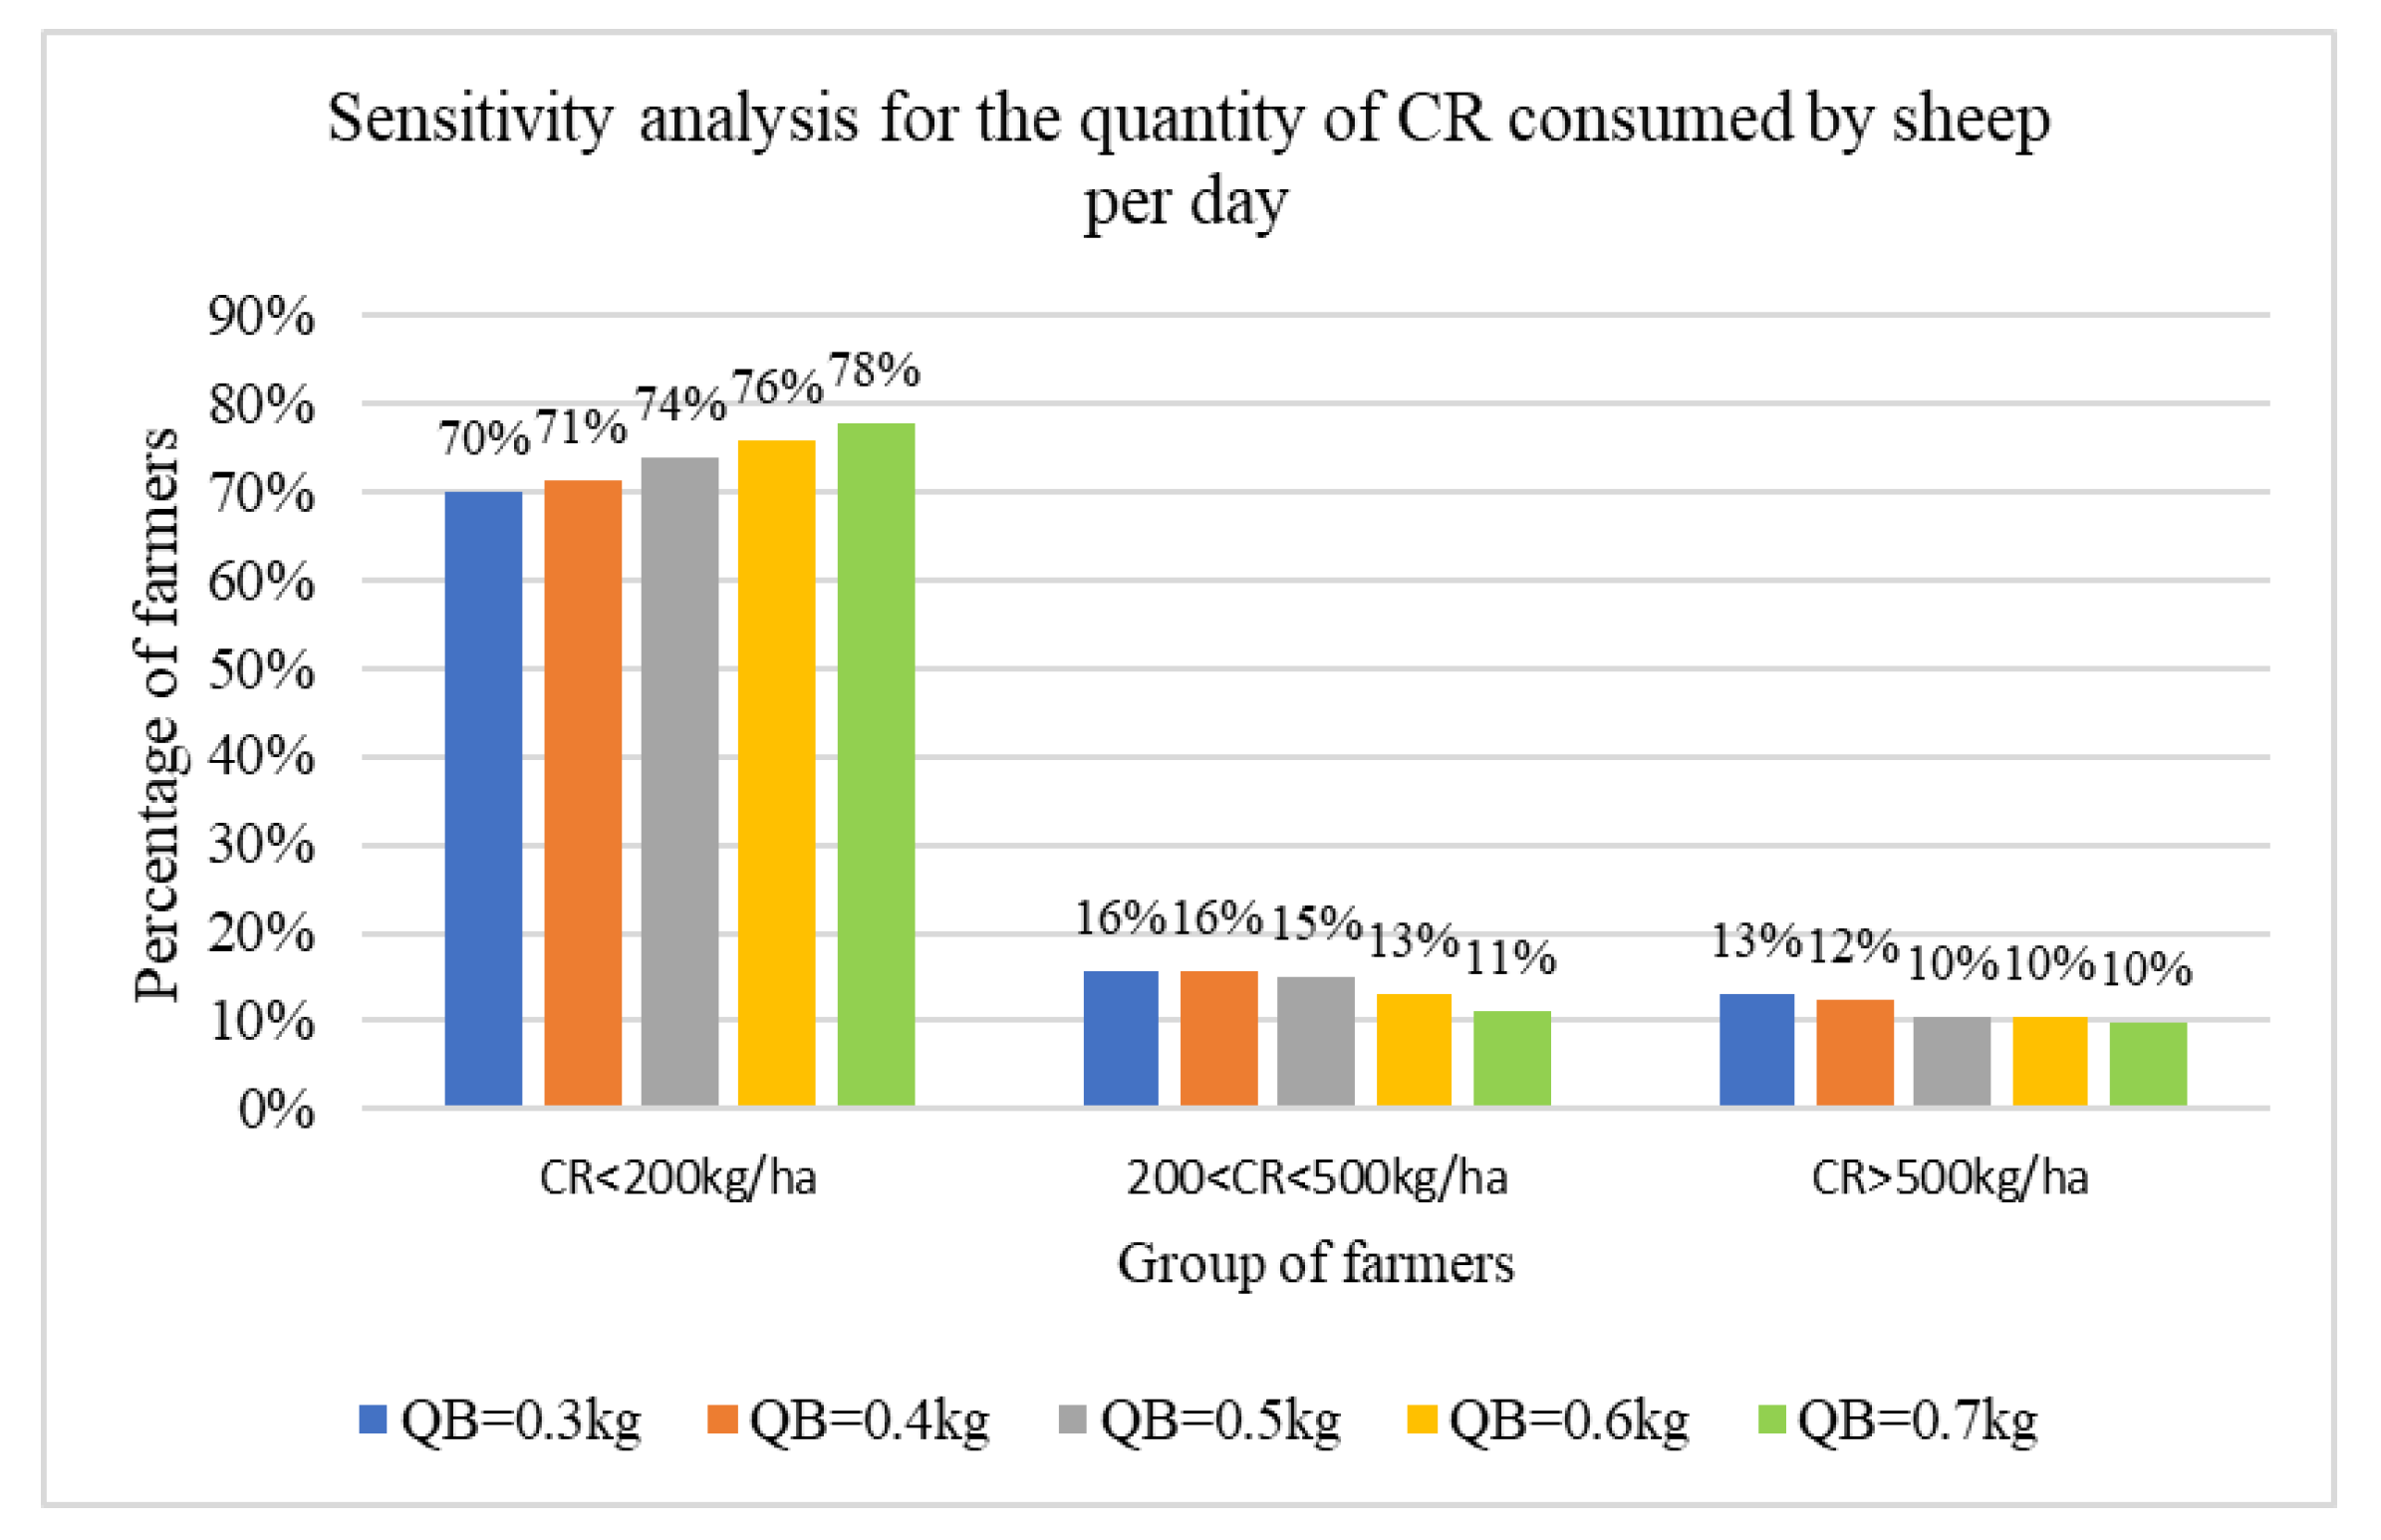
One important coefficient in our calculations is the quantity of crop residues grazed per day/head, estimated as being 0.3 kg/day/sheep in average over the whole summer grazing period. This variable has been estimated, in the study area, by other experimental studies to be between 0.5 and 0.6 kg/day/sheep [48,49] over a period of less than two months. However, given that most of farmers in our sample are grazing more than 60 days, we decided to use an average daily intake of crop residue of about 0.3 kg/day/sheep. To check the robustness of this coefficient value, we proceeded with a sensitivity test to check the effect of this coefficient on the final “crop residue left on the soil” parameter. The results of the sensitivity test show that changing the intake coefficient from 0.3 to 0.6 kg/day/sheep leads to an increase of 6% in the percentage of farmers leaving less than 200 kg of residues per ha. Other results of the sensitivity test are shown in Figure 4. This sensitivity analysis shows that the “quantity of residues left on the soil” is not highly sensitive to the “quantity of crop residues grazed per day/head” coefficient, and that the value of 0.3 kg/day/sheep is not significantly affecting the overall results of this study.

3.2. Drivers of Different CR Allocations: Resulting Conditional Probabilities from BBN Analysis

The resulting network structure from the survey data (Figure 5) illustrates the complexity and importance of many interacting variables on CR allocation in the study area. The probability distributions of the variable states indicate that more than 62.4% of interviewed farmers retained very low quantities of CR on the soil (<200 kg/ha) and only 20.5% retained more than 500 kg/ha. More than 48% of farms were of small size (i.e., <5 ha). It is also clear that about 69% of farmers have low to medium costs of livestock feed and only 31.1% of farmers have high feed cost for their livestock. Most farmers in our sample have more than 60% as a share of livestock income. Moreover, about 72% of farmers have less than 1 LSU/ha. Concerning the quantity of concentrate consumed by livestock, 37.5% of farmers use less than 200 kg/LSU. On the other hand, 48% of farmers have less than 2 ha of barley and only 15.8% have more than 5 ha. The majority of farmers (48%) have a grazed area of crop residues less than 15 ha and 30% have more than 30 ha.
Sensitivity analysis conducted over the child node “CR left on the soil” shows that the residue management pattern is the most sensitive to livestock variables, including the share of livestock in the total farm income, size of the livestock herd, and cost of livestock feed (Figure 6). This demonstrates that farmers in the studied cereal–sheep production systems are looking at CA using a “livestock lens.” Solutions to enhance soil fertility need to be channeled through enhanced (or alternative) feeding systems.
This section reports the scenarios (see Section 2.2.2) in which we fixed a prior condition on the quantity of the CR left on the soil and the share of livestock income in order to report the changes that the BBN structure defines on the other nodes. These scenarios will give us pathways for better CR management at the farm level under such conditions.
  • Scenario S1: increasing the quantity of CR left on the soil (>500 kg/ha)
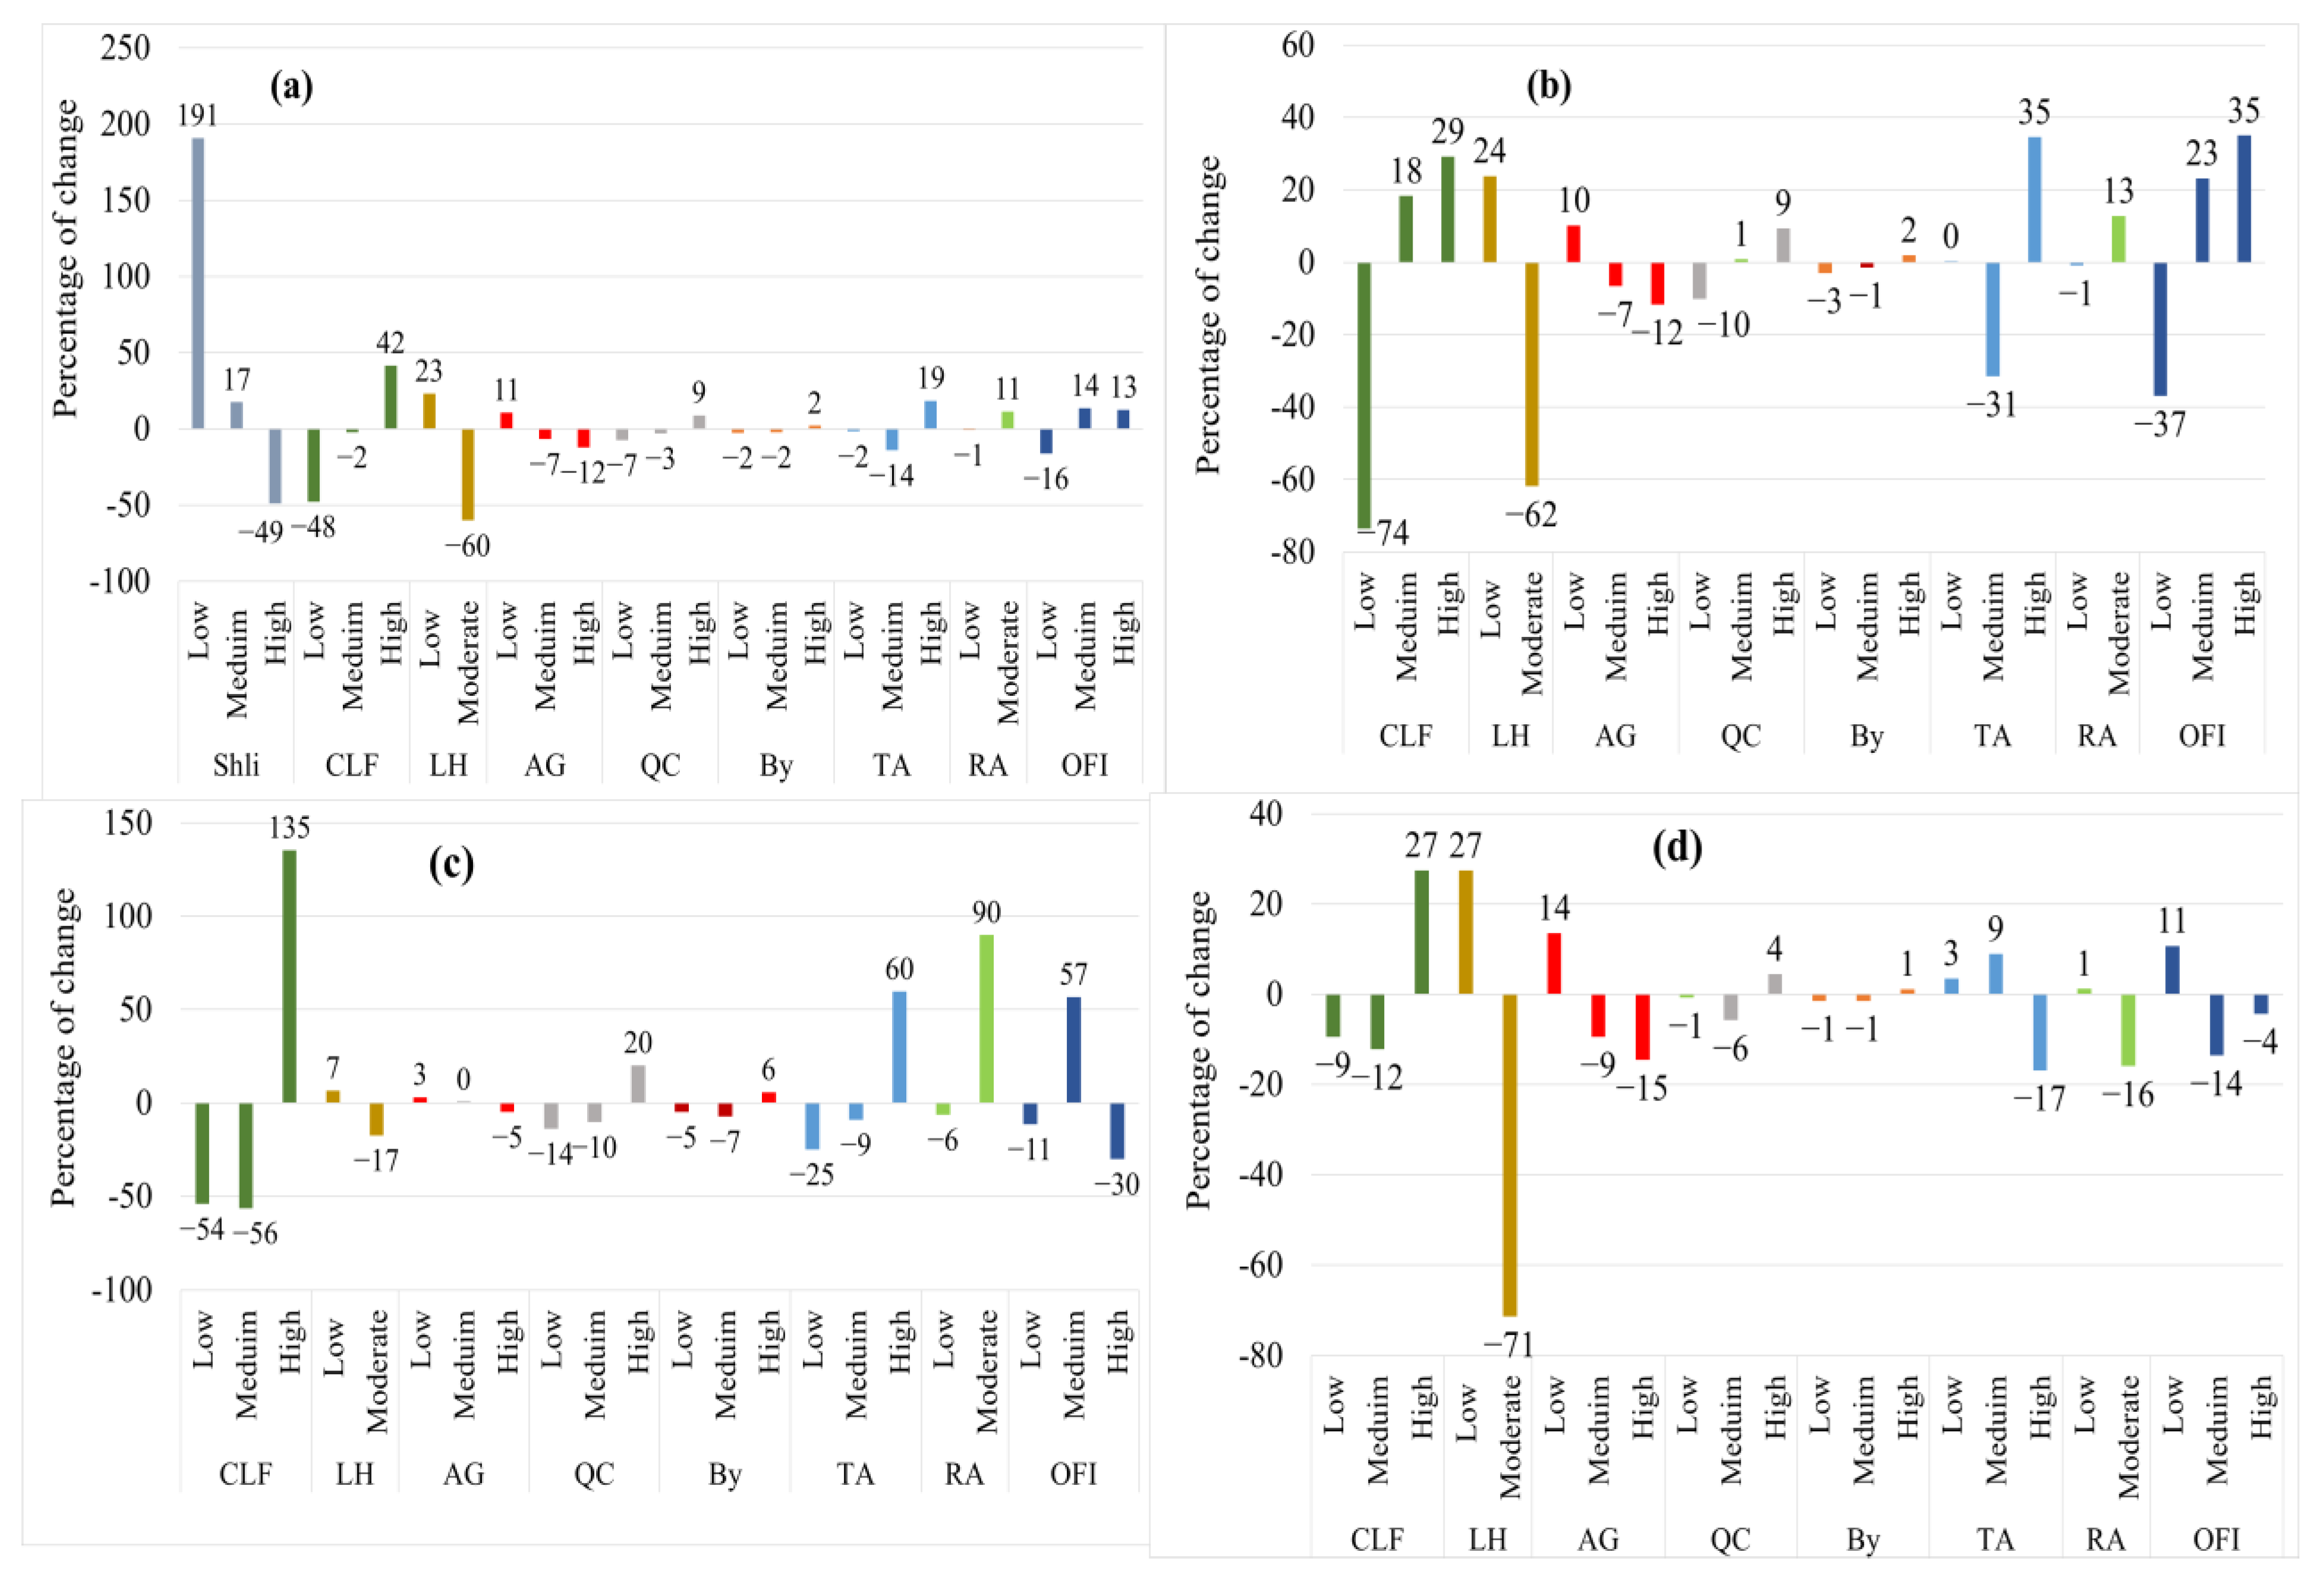
The objective of scenario S1 is to explore all changes needed to get a posterior condition of 100% probability of a “quantity of CR left on the soil higher than 500 kg/ha.” For doing so, we fix this posterior probability of the child (target) node (see BBN network in Figure 5) and assess changes that the BBN structure defines on the other nodes. This scenario provides evidence that enhancing CR management can only happen when we reduce the probability of having farms with high share of livestock in the farm income (>30%), in addition to farms with low overall cost of feed. Keeping a high quantity of CR can also be met if we have higher probability of farmers with medium to high cost of livestock feed (due to higher quantity of concentrate and other supplements). The results of this first scenario also suggest that farmers with higher off-farm income keep higher quantities of mulch (Figure 7a).
  • Scenario S2: increasing quantity of CR for farms with a share of livestock income less than 30%
Scenario S2 consists of fixing two posterior probabilities (100% probability for “CR > 500 kg/ha” and 100% probability of “share of livestock <30%”). This condition requires acting on the cost of livestock feed (increasing the probability of having farms with relatively medium and high costs by 18% and 29%, respectively) (Figure 7b). For this posterior condition, there is also a need to decrease the probability (with 62%) of having a high number of livestock per hectare. High residue retention for this category of farmers can also be met if there is a higher probability of high total cultivated area per farm (as percentage of total farm area).
  • Scenario S3: increasing quantity of CR for farms with a share of livestock income of 30–60%
Maintaining a high quantity of CR in this category of farms requires that farmers invest more in livestock feed availability (Figure 7c). The BBN model suggests that the increase in the probability of having more biomass used as mulch for this category of farmers requires a higher probability of farmers with high livestock feed costs. This means that even within this category of farmers, those who are minimizing feeding costs are also putting more pressure on biomass. Another important result for this farm type is the need to reduce the “stocking rate” if we want to maximize the probability of having more soil cover. More results are shown in Figure 7c.
  • Scenario S4: increasing quantity of CR within farms where the share of livestock income exceeds 60%
The sensitivity analysis (combined with the results of S1) shows that this last category of farmers uses the least biomass as soil cover. Enhancing the use of biomass for this farm type requires a moderate change in their feeding systems (investing more in animal feed) and a reduction in the “stocking rate,” thus releasing some of the pressure on residue grazing. The results also suggest that specialized farmers who have a low percentage of off-farm contribution to their respective income tend to mulch with higher quantity of residues (Figure 7d).

4. Discussion

Using more crop residues as soil cover is a way to enhance soil fertility and reduce chemical inputs to the farming systems in place. Enhanced CR management builds on the natural processes of organic and nutrient cycles, which can solve some of the problems of soil nutrition and fertility depletion. Biomass management is also a key aspect in all agro-ecological transitions throughout the world. Collective and on farm biomass in general and crop residues in particular are more and more in demand for different purposes (feed, mulch, composting), and they will need additional attention, especially from an agroecological transition perspective.
The quantity of CR retained on the soil for mulching in the study area is strongly related to farm size, structure, and stocking rate. Increasing the total land area is accompanied by an increase in the CR quantity left on the soil. The majority of farmers, who have less than 5 ha, do not mulch more than 200 kg/ha of CR. This result is in line with empirical results of the study of [50,51,52]. In our study, the quantity of CR retained as a mulch is obtained after calculation of aboveground biomass. The dry season of 2013/2014 resulted in low aboveground biomass production as well as low yields. As the CR left on the soil is a component of aboveground biomass, the quantity kept on the soil was very low for the considered year. However, this is still a representative case of variable weather conditions, which frequently occur in the study area and across many similar regions in North Africa. These results are also consistent with those of [14], who argued that CR use depends on the total biomass supply.
There are several explanations for the results. In fact, most farmers are smallholders with land size less than 5 ha, and their main income is from crop and/or livestock production. Thereby, farmers try to maximize total income, firstly by decreasing livestock costs (by compensating a share of feed by animal grazing). In fact, most farmers graze a great number of days (often >90 days) compared to the recommended 30 days [49]. The number of hours of grazing per day can exceed eight. Overgrazing significantly reduces the quantity of CR left on the field. The BBN results show that increasing the quantity of CR left on the soil in the study area is strongly related to the share of livestock income, livestock herds, and cost of livestock feed. “Share of livestock income” has the greatest effect on the decision of farmers to keep more than 500 kg/ha of CR. Consequently, we suggest increasing the quantity of CR with small, medium, and large farms distinguished by livestock income. Livestock constitute the most important source of income for the majority of farmers in the study area [20,53,54], suggesting significant trade-offs between the use of CR for soil cover and its role in farmers’ other livelihood activities especially when they rely on CR to feed livestock. Overall, high quantities of CR are retained on soil for mulching when farmers have livestock herds of less than 1 LSU/ha and when the grazed area is less than 15 ha. Our result confirms that the solution of [49], of not grazing cereal residues for longer than 30 days, would have many benefits for increasing soil cover in the study area. This result suggests that the use of high quantity of concentrate as an alternative source of feed could decrease the reliance on and overuse of CR by livestock. Therefore, these solutions should be suggested in a set of incentives that might include providing other cheap sources of feed by local and regional government livestock agencies.
Maintaining a high quantity of CR within small farms where farmers have less than 30% as livestock income, involve a combination of a set of conditions that should be adopted by farmers. In fact, we should act especially on increasing the category of farmers who have high costs of livestock feed, the quantity of concentrate consumed by livestock, and the number of bales of straw consumed by livestock and decreasing the size of livestock herds. These factors constitute good drivers to obtain high quantities of CR left on the field. It seems likely that such practices will be more easily adopted by farmers in the study area. In addition, the model shows that increasing the quantity of CR within medium and large farms needs to satisfy the needs of livestock more in terms of feed since crops and livestock are integral components of most smallholder livelihoods [14]. Our paper provides evidence that farmers should invest more in livestock feed in order to decrease reliance on grazing of CR. Our research thereby suggests that increasing soil cover in the three types of farms requires interactive work between stakeholders and farmers to elaborate comprehensive strategies to enhance crop production. Moreover, government livestock agencies should suggest solutions that provide cheap alternative sources of feed rotations and feeding calendars in parallel. In addition, ensuring the timely availability of concentrate to farmers and providing solutions to decreasing livestock feed cost, will certainly help farmers to invest more in other types of feed and to graze less, and will thus reduce pressure on CR.

5. Conclusions

Integrated crop–livestock system within CA can constitute a suitable solution for both environmental and economic objectives of farmers. Stubble constitutes the main source of feed for livestock during summer when other crops are impossible to grow under rain-fed conditions in northern Tunisia. However, competition related to CR allocation by farmers is becoming a worrying issue, particularly in drylands where fodder potential is low. The results show that the majority of farmers in the cereal–sheep production system are keeping low quantities of CR on the soil (<200 kg/ha), which is very low compared to technical standards advising that 1500 kg/ha is necessary to main soil health and enhance organic matter in the soil. Thus, through this study, we focus on identifying the drivers of CR management and suggest pathways for better management of CR for different types of farms (small, medium, and large). The BBN demonstrates that share of livestock income is the first driver influencing farmers’ decisions concerning residue biomass allocation. It is clear also from the BBN outcome that retaining a high quantity of CR requires interactive work between different decision-makers to (i) elaborate comprehensive strategies for better crop production and (ii) ensure ways for farmers to invest more in alternative feed for livestock. Finally, it is also important to educate farmers about the long-term economic and environmental benefits of retaining residue biomass. Given that the issue of crop residues management in Tunisia is generally related to low biomass yield, the introduction of new technologies such as legume-cereal mixture, diversified cropping rotations, improved fallows would contribute indirectly to increase the quantity of CR kept on the field by farmers.

Author Contributions

Conceptualization, W.A.; Data curation, W.A.; Investigation, W.A.; Methodology, W.A., A.F. and M.A.A.; Software, W.A.; Supervision, A.F., M.A.A. and C.T.; Validation, A.F.; Writing—original draft, W.A.; Writing—review & editing, W.A., A.F., M.A.A. and C.T. All authors have read and agreed to the published version of the manuscript. We also confirm that this manuscript has been read and approved by all named authors and that there are no other persons who satisfied the criteria for authorship but are not listed. We further confirm that the order of authors listed in the manuscript has been approved by all of us.

Funding

This research was funded by the CGIAR Research Program (CRP) on WHEAT, led by the International Maize and Wheat Improvement Center (CIMMYT) (ICARDA agreement No. 200077), and the CLCA project Phase II (Use of conservation agriculture in crop–livestock systems in the dry lands for enhanced water use efficiency, soil fertility and productivity in NENA and LAC countries) funded by the International Fund for Agricultural Development (IFAD) (ICARDA agreement No. 200116).

Conflicts of Interest

All authors of this paper certify that they have NO affiliations with or involvement in any organization or entity with any financial interest (such as honoraria; educational grants; participation in speakers’ bureaus; membership, employment, consultancies, stock ownership, or other equity interest; and expert testimony or patent-licensing arrangements), or non-financial interest (such as personal or professional relationships, affiliations, knowledge or beliefs) in the subject matter or materials discussed in this new version of the manuscript.

References

  1. Kassam, A.; Kueneman, E.; Kebe, B.; Ouedraogo, S.; Youdeowei, A. Enhancing Crop-Livestock Systems in Conservation Agriculture for Sustainable Production Intensification. Integr. Crop Manag. 2009, 7, 42. [Google Scholar]
  2. Bonaudo, T.; Bendahan, A.B.; Sabatier, R.; Ryschawy, J.; Bellon, S.; Leger, F.; Magda, D.; Tichit, M. Agroecological principles for the redesign of integrated crop–livestock systems. Eur. J. Agron. 2014, 57, 43–51. [Google Scholar] [CrossRef]
  3. FAO. Investing in Sustainable Agricultural Intensification. The Role of Conservation Agriculture. A Framework for Action; Food and Agriculture Organization of the United Nation: Rome, Italy, 2008. [Google Scholar]
  4. Giller, K.E.; Witter, E.; Corbeels, M.; Tittonell, P. Conservation agriculture and smallholder farming in Africa: The heretics’ view. Field Crop. Res. 2009, 114, 23–34. [Google Scholar] [CrossRef]
  5. Hobbs, P.R. Paper Presented at International Workshop on Increasing Wheat Yield Potential, CIMMYT, Obregon, Mexico, 20–24 March 2006 Conservation agriculture: What is it and why is it important for future sustainable food production? J. Agric. Sci. 2007, 145, 127. [Google Scholar] [CrossRef] [Green Version]
  6. Jaleta, M.; Kassie, M.; Shiferaw, B. Tradeoffs in crop residue utilization in mixed crop–livestock systems and implications for conservation agriculture. Agric. Syst. 2013, 121, 96–105. [Google Scholar] [CrossRef]
  7. Dumont, B.; Fortun-Lamothe, L.; Jouven, M.A.; Thomas, M.; Tichit, M. Prospects from agroecology and industrial ecology for animal production in the 21st century. Animal 2012, 7, 1028–1043. [Google Scholar] [CrossRef] [Green Version]
  8. Gliessman, S. Animals in Agroecosystems. Agroecology: The Ecology of Sustainable Food Systems; CRC Press: Boca Raton, FL, USA, 2006; pp. 269–285. [Google Scholar]
  9. Ibidhi, R.; Frija, A.; Jaouad, M.; Ben Salem, H. Typology analysis of sheep production, feeding systems and farmers strategies for livestock watering in Tunisia. Small Rumin. Res. 2018, 160, 44–53. [Google Scholar] [CrossRef]
  10. Hoagland, L.; Hodges, L.; Helmers, G.A.; Brandle, J.R.; Francis, C.A. Labor Availability in an Integrated Agricultural System. J. Sustain. Agric. 2010, 34, 532–548. [Google Scholar] [CrossRef]
  11. Lemaire, G.; Franzluebbers, A.; Carvalho, P.C.D.F.; Dedieu, B. Integrated crop–livestock systems: Strategies to achieve synergy between agricultural production and environmental quality. Agric. Ecosyst. Environ. 2014, 190, 4–8. [Google Scholar] [CrossRef]
  12. Baudron, F.; Jaleta, M.; Okitoi, O.; Tegegn, A. Conservation agriculture in African mixed crop-livestock systems: Expanding the niche. Agric. Ecosyst. Environ. 2014, 187, 171–182. [Google Scholar] [CrossRef]
  13. Herrero, M.; Thornton, P.K.; Notenbaert, A.M.O.; Wood, S.; Msangi, S.; Freeman, H.A.; Bossio, D.; Dixon, J.; Peters, M.; Van De Steeg, J.; et al. Smart Investments in Sustainable Food Production: Revisiting Mixed Crop-Livestock Systems. Science 2010, 327, 822–825. [Google Scholar] [CrossRef] [PubMed] [Green Version]
  14. Valbuena, D.; Erenstein, O.; Tui, S.H.-K.; Abdoulaye, T.; Claessens, L.; Duncan, A.J.; Gérard, B.; Rufino, M.C.; Teufel, N.; van Rooyen, A.; et al. Conservation Agriculture in mixed crop–livestock systems: Scoping crop residue trade-offs in Sub-Saharan Africa and South Asia. Field Crops Res. 2012, 132, 175–184. [Google Scholar] [CrossRef] [Green Version]
  15. Klapwijk, C.; van Wijk, M.; Rosenstock, T.; van Asten, P.; Thornton, P.; Giller, K. Analysis of trade-offs in agricultural systems: Current status and way forward. Curr. Opin. Environ. Sustain. 2014, 6, 110–115. [Google Scholar] [CrossRef] [Green Version]
  16. Baudron, F.; Delmotte, S.; Corbeels, M.; Herrera, J.M.; Tittonell, P. Multi-scale trade-off analysis of cereal residue use for livestock feeding vs. soil mulching in the Mid-Zambezi Valley, Zimbabwe. Agric. Syst. 2015, 134, 97–106. [Google Scholar] [CrossRef]
  17. Valbuena, D.; Tui, S.H.-K.; Erenstein, O.; Teufel, N.; Duncan, A.; Abdoulaye, T.; Swain, B.; Mekonnen, K.; Germaine, I.; Gérard, B. Identifying determinants, pressures and trade-offs of crop residue use in mixed smallholder farms in Sub-Saharan Africa and South Asia. Agric. Syst. 2015, 134, 107–118. [Google Scholar] [CrossRef] [Green Version]
  18. Mhlanga, B.; Muoni, T. Crop Residue Management in Conservation Agriculture Systems in Zimbabwe Smallholder Farming Sector: Importance, Management Challenges and Possible Solutions. Asian J. Agric. Rural Dev. 2014, 4, 333–340. [Google Scholar]
  19. Andersson, J.; D’Souza, S. From adoption claims to understanding farmers and contexts: A literature review of Conservation Agriculture (CA) adoption among smallholder farmers in southern Africa. Agric. Ecosyst. Environ. 2014, 187, 116–132. [Google Scholar] [CrossRef]
  20. Beuchelt, T.D.; Villa, T.C.C.; Göhring, L.; Rodríguez, V.M.H.; Hellin, J.; Sonder, K.; Erenstein, O. Social and income trade-offs of conservation agriculture practices on crop residue use in Mexico’s central highlands. Agric. Syst. 2015, 134, 61–75. [Google Scholar] [CrossRef]
  21. Blümmel, M.; Tui, S.H.-K.; Valbuena, D.; Duncan, A.; Herrero, M. Biomass in crop-livestock systems in the context of the livestock revolution. Sécheresse 2013, 24, 330–339. [Google Scholar] [CrossRef] [Green Version]
  22. Tui, S.H.-K.; Valbuena, D.; Masikati, P.; Descheemaeker, K.; Nyamangara, J.; Claessens, L.; Erenstein, O.; van Rooyen, A.; Nkomboni, D. Economic trade-offs of biomass use in crop-livestock systems: Exploring more sustainable options in semi-arid Zimbabwe. Agric. Syst. 2015, 134, 48–60. [Google Scholar] [CrossRef] [Green Version]
  23. Rusinamhodzi, L.; Wijk, M.T.; Corbeels, M.; Rufino, M.; Giller, K.E. Maize crop residue uses and trade-offs on smallholder crop-livestock farms in Zimbabwe: Economic implications of intensification. Agric. Ecosyst. Environ. 2015, 214, 31–45. [Google Scholar] [CrossRef]
  24. McCann, R.K.; Marcot, B.G.; Ellis, R. Bayesian belief networks: Applications in ecology and natural resource management. Can. J. Res. 2006, 36, 3053–3062. [Google Scholar] [CrossRef]
  25. Campbell, D.; Chilton, S.; Clark, S.; Fitzsimmons, C.; Gazzola, P.; Hutchinson, G.; Metcalf, H.; Roe, M.; Rushton, S.; Schuchert, P.; et al. Bayesian Belief Networks as an Interdisciplinary Marine Governance and Policy Tool. Valuing Nat. Netw. Rep. 2012, 27, 1–27. [Google Scholar]
  26. Gonzalez-Redin, J.; Luque, S.; Poggio, L.; Smith, R.; Gimona, A. Spatial Bayesian belief networks as a planning decision tool for mapping ecosystem services trade-offs on forested landscapes. Environ. Res. 2016, 144, 15–26. [Google Scholar] [CrossRef] [PubMed]
  27. Kleemann, J.; Celio, E.; Fürst, C. Reprint of Validation approaches of an expert-based Bayesian Belief Network in northern Ghana, West Africa. Ecol. Model 2018, 371, 101–118. [Google Scholar] [CrossRef]
  28. McNay, R.S.; Marcot, B.G.; Brumovsky, V.; Ellis, R. A Bayesian approach to evaluating habitat for woodland caribou in north-central British Columbia. Can. J. Res. 2006, 36, 3117–3133. [Google Scholar] [CrossRef]
  29. Smith, R.I.; Barton, D.N.; Dick, J.; Haines-Young, R.; Madsen, A.L.; Rusch, G.M.; Termansen, M.; Woods, H.; Carvalho, L.; Giucă, R.C.; et al. Operationalising ecosystem service assessment in Bayesian Belief Networks: Experiences within the OpenNESS project. Ecosyst. Serv. 2018, 29, 452–464. [Google Scholar] [CrossRef]
  30. Singto, C.; Fleskens, L.; Vos, J.; Quinn, C. Applying Bayesian belief networks (BBNs) with stakeholders to explore and codesign options for water resource interventions. Sustain. Water Resour. Manag. 2020, 6, 23. [Google Scholar] [CrossRef] [Green Version]
  31. Crossman, N.; Pollino, C.A. An ecosystem services and Bayesian modelling approach to assess the utility of water resource development in rangelands of north Australia. J. Arid Environ. 2018, 159, 34–44. [Google Scholar] [CrossRef]
  32. Carmona, G.; Varela-Ortega, C.; Bromley, J. Participatory modelling to support decision making in water management under uncertainty: Two comparative case studies in the Guadiana river basin, Spain. J. Environ. Manag. 2013, 128, 400–412. [Google Scholar] [CrossRef] [Green Version]
  33. Marcot, B.G. Natural resource assessment and risk management. In Rbeaux Bayisiens [Bayesian Networks]; Naim, P., Wuillemin, P.H., Leray, P., Pourret, O., Becker, A., Eds.; Editions Eyrolles: Paris, France, 2007. [Google Scholar]
  34. Aalders, I. Modeling Land-Use Decision Behavior with Bayesian Belief Networks. Ecol. Soc. 2008, 13. [Google Scholar] [CrossRef] [Green Version]
  35. Bashari, H.; Smith, C. Accommodating Uncertainty in Rangeland Condition Assessment Using Bayesian Belief Networks. In Bayesian Network; IntechOpen: London, UK, 2010. [Google Scholar]
  36. Stephenson, F.; Mill, A.C.; Scott, C.L.; Stewart, G.B.; Grainger, M.J.; Polunin, N.V.; Fitzsimmons, C. Socio-economic, technological and environmental drivers of spatio-temporal changes in fishing pressure. Mar. Policy 2018, 88, 189–203. [Google Scholar] [CrossRef] [Green Version]
  37. Yamada, Y. Can a regional-level forest management policy achieve sustainable forest management? For. Policy Econ. 2018, 90, 82–89. [Google Scholar] [CrossRef]
  38. Newton, C.A.; Young, S. Financial Implications of Glycemic Control: Results of an Inpatient Diabetes Management Program. Endocr. Pr. 2006, 12, 43–48. [Google Scholar] [CrossRef] [Green Version]
  39. Ministère du Développement, de L’investissement et de la Cooprération International and Office de Développement du Nord-Ouest. Gouvernorat de Siliana en Chiffres. 2015. Available online: http://www.odno.nat.tn/upload/files/Siliana%20en%20Chiffres%202015%20.pdf (accessed on 18 May 2021).
  40. Kamil, K.R.; Anita, K.; Roman, K.K.; Konieczna, A. Evaluation of a different fertilisation in technology of corn for silage, sugar beet and meadow grasses production and their impact on the environment in Poland. Afr. J. Agric. Res. 2015, 10, 1351–1358. [Google Scholar] [CrossRef] [Green Version]
  41. Zhu, Z.J.A.; McBean, E. Selection of water treatment processes using Bayesian decision network analyses. J. Environ. Eng. Sci. 2007, 6, 95–102. [Google Scholar] [CrossRef]
  42. Wnuk, A.; Grzegorz, G.A.; Bocianowski, J.; Kozak, M. Visualizing harvest index in crops. Commun. Biometry Crop Sci. 2013, 8, 48–59. [Google Scholar]
  43. Mghirbi, Y.B.Z. Analyse des Compromis Entre la Production et L’efficience de L’eau et de L’azote Dans les Systèmes Céréaliers Méditerranéens à Base de Blé Dur. Ph.D. Thesis, l’Institut National d’Etudes Supérieures Agronomiques Montpellier SupAgro, Montpellier, France, 2017. [Google Scholar]
  44. Aouji, M.R.; Salem, M.B. Comportement Varietale de L’orge (hordeum vulgare l.) en Double Exploitation; Annales de l’INRAT: Beja, Tunisia, 2010. [Google Scholar]
  45. Boussen, H.; Asr, N.; Mechlia, N.B. Efficience d’utilisation de l’eau et de l’azote chez le blé dur!: Etude comparative de deux variétés à haut potentiel de production. Food Secur. Options Perspect. 2005, 1–11. [Google Scholar]
  46. Amal, B.M.; Boutheina, D.; Kalthoum, H. Yield Components of Barley on Different Climates Stages in the North of Tunisia. Acta Sci. Agric. 2019, 3, 138–141. [Google Scholar]
  47. Cherif, M.; Rezgui, S. Genotype× Environment Interactions and Heritability Estimates of Agronomic Traits in Selected Tunisian Barley Cultivars. J. Plant Breed. Crop Sci. 2010, 2, 110–116. [Google Scholar]
  48. Hajer, G.; Salah, B.Y.; Mohamed, C.; Darej, C.; Abidi, S.; Ben Salem, H.; Moujahed, N. Wheat Stubble from Conventional or Conservation Agriculture Grazed by Ewes: Biomass Dynamics and Animal Performances. Anim. Nutr. Feed Technol. 2020, 20, 187–200. [Google Scholar] [CrossRef]
  49. Moujahed, N.; Abidi, S.; Ben Youssef, S.; Darej, C.; Chakroun, M.; Ben Salem, H. Effect of stocking rate on biomass variation and lamb performances for barley stubble in Tunisian semi-arid region and under conservation agriculture conditions. Afr. J. Agric. Res. 2015, 10, 4584–4590. [Google Scholar]
  50. Moujahed, N. Perception and use of crop residues in CA practicing farms in CLCA II targeted project areas: Results of a field study and survey. In Proceedings of the CLCA-II Project Traveling Workshop: Integrating Livestock in CLCA Project, Siliana, Tunisia, 1–4 July 2019. [Google Scholar]
  51. Rekik, M.; Ridaura, S.L.; M’hamed, H.C.; Djender, Z.; Dhehibi, B.; Frija, A.; Wasti, M.D.; Rudiger, U.; Bonaiuti, E.; Najjar, D.; et al. Use of Conservation Agriculture in Crop-Livestock Systems (CLCA) in the Drylands for Enhanced Water Use Efficiency, Soil Fertility and Productivity in NEN and LAC Countries—Project Progress Report: Year I—April 2018 to March 2019; International Center for Agricultural Research in the Dry Areas (ICARDA): Tunis, Tunisia, 2019. [Google Scholar]
  52. Rekik, M.; Loudi, Z.; Ridaura, S.L.; Frija, A. Use of Conservation Agriculture in Crop-Livestock Systems (CLCA) in the Drylands for Enhanced Water Use Efficiency, Soil Fertility and Productivity in NEN and LAC Countries—Project Progress Report: Year (II)—April 2019 to March 2020; International Center for Agricultural Research in the Dry Areas (ICARDA): Beirut, Lebanon, 2021. [Google Scholar]
  53. Erenstein, O.; Sayre, K.; Wall, P.; Hellin, J.; Dixon, J. Conservation Agriculture in Maize- and Wheat-Based Systems in the (Sub)tropics: Lessons from Adaptation Initiatives in South Asia, Mexico, and Southern Africa. J. Sustain. Agric. 2012, 36, 180–206. [Google Scholar] [CrossRef]
  54. Wall, P.C. Tailoring conservation agriculture to the needs of small farmers in developing countries: An analysis of issues. J. Crop Improv. 2007, 19, 137–155. [Google Scholar] [CrossRef]
Figure 1. Location of the study area.
Agriculture 11 00612 g001
Figure 2. Conceptualization of a BBN structure diagram developed around a selected priority issue.
Agriculture 11 00612 g002
Figure 3. Distribution of the quantity of crop residues left on the soil (a) and quantity of crop residue left on the soil as function of total land size (b), barley yield (c), and number of livestock (expressed as LSU) (d).
Agriculture 11 00612 g003
Figure 4. Sensitivity analysis for the quantity of residues biomass consumed per sheep per day; (QB: quantity of residues biomass consumed per sheep per day).
Agriculture 11 00612 g004
Figure 5. BBN learning results with factors driving different residue management patterns.
Agriculture 11 00612 g005
Figure 6. Sensitivity analysis of crop residues left on the soil.
Agriculture 11 00612 g006
Figure 7. Changes of conditional probabilities of the most relevant variables following scenario S1 (a) and change of conditional probabilities for better crop residues use for farms with low livestock income in scenario S2 (b), for farms with medium contribution of livestock in scenario S3 (c), and for large farm in scenario S4 (d).
Agriculture 11 00612 g007
Table 1. Definition of discretization of variables used in the BBN causality for determining factors affecting the patterns of residue use in the study area.
Variable NamesVariable DiscretizationsGroup Descriptionsp ValuePost Hoc Test (LSD Test)
(sig)
Crop residues left on the soil (CR; kg/ha)CR ≤ 200Low
200 < CR < 500Medium
CR ≥ 500High
Share of livestock income (Shli; %)Shli < 30%Low0.042Meduim0.03 **
High0.04 **
30% ≤ Shli ≤ 60%Medium Low0.03 **
High0.025 **
Shli > 60%High Low0.04 **
Meduim0.025 **
Off-farm income (OFI; TND)OFI < 1000 TNDLow0.022Meduim0.09 *
High0.05 **
1000 ≤ OFI ≤ 2500 TNDMedium Low0.09 *
High0.024 **
OFI> 2500 TNDHigh Low0.05 **
Meduim0.024 **
Rented area (RA; ha) 1RA ≤ 1 haLow0.022
RA > 1 haModerate
Cost of livestock feed (CLF; DT/LSU/year) XCLF < 600Low0.01Meduim0.098 *
High0.03 **
600 ≤ CLF ≤ 1000Medium Low0.098 *
High0.054 *
CLF > 1000High Low0.03 **
Meduim0.054 *
Livestock herds (LH; LSU/ha)LH ≤ 1Low0.01
LH > 1Moderate
Area of crop residues grazed 2 (AG; ha)AG < 15 haLow0.05Meduim0.002 **
High0.015 ***
15 ≤ AG ≤ 30Medium Low0.002 ***
High0.069 *
AG > 30 haHigh Low0.015 **
Meduim0.069 *
Total livestock (TL; LSU)TL ≤ 5Low0.001Meduim0.05 **
High0.001 ***
5 < TL ≤ 10Medium Low0.09 *
High0.001 ***
TL > 10High Low0.09 *
Meduim0.05 **
Rangeland area (RGA; ha)RGA < 5 haLow0.015Meduim0.09 *
High0.004 ***
5 ≤ RGA ≤ 10 haMedium Low0.09 *
High0.096 *
RGA > 10 haHigh Low0.004 ***
Meduim0.09 *
Barley area (BA; ha)BA < 2Low0Meduim0.00 ***
High0.00 ***
2 ≤ BA ≤ 5Medium Low0.00 ***
High0.00 ***
BA > 5High Low0.00 ***
Meduim0.00 ***
Quantity of concentrate consumed (QC; kg/LSU/year)QC < 200Low0.035Meduim0.09 *
High0.018 *
200 ≤ QC ≤400Medium Low0.09 *
High0.079 *
QC > 400High Low0.018 **
Meduim0.079 *
Number of bales of straw (NBS; LSU/year)NBS < 30Low0.018Meduim0.09 *
High0.005 ***
30 ≤ NBS ≤ 60Medium Low0.09 *
High0.09 *
NBS > 60High Low0.005 ***
Meduim0.09 *
Barley yield (BY; kg/ha)BY < 400Low0.002Meduim0.09 *
High0.001 ***
400 ≤ BY ≤ 800Meduim Low0.09 *
High0.014 **
BY > 800High Low0.001 ***
Meduim0.014 **
Oat area (OA; ha)OA ≤ 1Low0
OA > 1Moderate
Total area (TA; ha)TA < 5Low0Meduim0.054 *
High0.00 ***
5 ≤ TA ≤ 10Medium Low0.054 *
High0.0 ***
TA > 10High Low0.0 ***
Meduim0.0 ***
1 Post hoc test (LSD) don’t show the variable if the number of groups is less than 3. 2 We did not include the “rangeland area” as part of the “grazed area” variable used in the BBN model. “Grazed area” as used in this paper only refers to the crop residue grazed area. X CLF: cost of livestock feed per year after converting Livestock to livestock units. *** significant at level of 1%. ** significant at level of 5%. * Significant of level of 10%.
Table 2. Scenario simulations using BBN.
S1S2S3S4
Condition 1: CR ≥ 500 kg/haXXXX
Condition 2: Share of livestock income (Shli) Shli < 30%30% ≤ Shli ≤ 60%Shli > 60%
Publisher’s Note: MDPI stays neutral with regard to jurisdictional claims in published maps and institutional affiliations.