Abstract
This study reports the phenotypic trends for wool, growth, and reproductive traits in mixed-age ewes after twenty years of genetic selection. Data were obtained from the Merino nucleus flock in Uruguay between 1999 and 2020. Overall, the aim of this selection flock was to reduce the fiber diameter (FD) and increase both the clean fleece weight (CFW) and live weight (LW). Data on ewe wool traits, LW, body condition score (BCS), the total number of lambs weaned (TLW), and the total LW of lambs weaned (TWW) across all lambing opportunities (1–8 mating seasons) were analyzed. Between 1292 and 2063 ewes were measured, depending on the trait considered. Ewe FD decreased by approximately 3 µm (19–16 µm), whereas greasy fleece weight (GFW) increased by 0.2 kg. This improvement in wool traits was accompanied by increases in LW at mating (3 kg), decreases in BCS at mating (approximately by 1 unit), and a small positive change in TWW across years. This study demonstrated that increasing farmer income by selecting for finer wool, heavier fleeces, and heavier animals can be obtained without compromising ewe lifetime reproduction.
1. Introduction
During the 1990s, the Uruguayan wool industry processed mainly mid-micron wool (25.0–30.0 µm) [1]. A decrease in demand for this wool type led to a reduction in the overall number of sheep in Uruguay, but at the same time an increase in the number of fine-micron Merinos [2]. Between 1997 and 2019, the Uruguayan sheep population decreased from 18.2 to 6.6 million [3,4], while, fine-micron wool (≤22.5 µm) production increased by approximately 135% (3.2–7.5 million kg). Currently, fine-micron wool (≤22.5 µm) accounts for 32% of the total wool production [2] and superfine wool (15.6–18.0 μm) represents 37% of the total wool finer than 20 µm [2]. Over the last two decades, superfine wool has obtained the highest values, although the price differentials between finer and coarser wool types have varied [5,6,7].
Sheep production systems focused on either wool or meat production are both interested in improving reproduction performance [8,9]. Some studies have reported that the reduced fiber diameter (FD) can be associated with poorer reproduction performance, such as the number of fetuses identified at pregnancy scanning [10]. Although the effect of selection for reduced FD on lamb survival is inconsistent [10,11]. Positive genetic correlations between FD and ewe body condition score (BCS) at mating [12,13,14] indicate that selection for reduced FD will result in lower BCS, which could negatively influence reproduction performance [15,16,17]. In addition, selection for increased clean fleece weight (CFW) can have unintentional consequences, which varies across environments and breeds [18]. A high negative genetic correlation (−0.65 ± 0.14) between CFW and the number of lambs weaned per ewe joined in superfine Merino sheep also suggests that selection for increased CFW could reduce reproductive performance [10]. This is consistent with a negative association between CFW and singleton lamb survival [19]. Furthermore, adult CFW expressed as a proportion of live weight at mating appears to be negatively associated with ewe reproduction [20]. By contrast, other studies have shown that selection for increased CFW as a component of a multitrait breeding program can be achieved without compromising the reproduction rate [21,22,23]. Most of these studies have been conducted in Australia and the inconsistencies in research findings may be associated with the animal genotype and nutritional conditions [10,18]. There is currently no scientific information focused on the potential effects of selection for reduced FD and increased CFW on ewe growth and reproductive traits in the Uruguayan Merino population.
Between 1999 and 2020, two combined research projects entitled the Fine Merino Project (FMP) and the Regional Consortium for Innovation in Ultrafine Wool (CRILU) were developed in Uruguay, as described by Ramos et al. [24]. Briefly, the FMP (1999–2010) focused on FD reduction (19 µm or finer), whereas during the CRILU period (2011–2020), the selection objective was to reduce FD (15.5 µm or finer) and to increase both CFW and live weight (LW). In the context of these breeding goals, it is of interest to know if selection for reduced FD and increased CFW influenced other economically relevant traits in adult ewes. This study aimed to evaluate the phenotypic responses in mixed-age ewes to these two combined selection programs (FMP and CRILU) over the period 1999–2020.
2. Materials and Methods
2.1. Period and Location
Data were obtained from the Merino nucleus flock, which was run between 1999 and 2020 at the Glencoe Experimental Unit of National Institute of Agricultural Research of Uruguay (INIA) (32°00′21″ S and 57°08′06″ W). In this region, annual pasture production varies from 2885 to 4580 kg of dry matter (DM)/ha [25]. During the study period (1999–2020), total annual rainfall ranged between 830 and 2800 mm [26]. This study analyzed data from mixed-age ewes over the period 1999–2020. All procedures were approved by INIA Animal Ethics Committee (INIA_2018.2).
2.2. Animals, Nutrition, and Management
Data from ewes (2–10 years of age) born in the Merino nucleus flock between 1999 and 2018 were recorded. The animal selection process applied in this nucleus flock has been described by Ramos et al. ([24], Section 2.3). Each year, ewes were managed as a single flock under the same health and nutritional conditions, as recommended for commercial flocks [27,28]. Ewes grazed on native pastures (6–15% of crude protein and 7.5–9.2 MJ/kg metabolizable energy) [29], with access to improved pastures or supplements as described by Ramos et al. [24].
Each year ewes were inseminated with either imported frozen semen or fresh semen from nucleus-born rams [24]. Estrus was synchronized using intravaginal sponges impregnated with progesterone (Intervet®, Montevideo, Uruguay, SFGA 40 mg) for 12–14 days followed by a single intramuscular injection of equine chorionic gonadotropin (Folligon®, Intervet, Montevideo, Uruguay, 200–300 UI/a) at the time of sponge removal. At 56–60 h after sponge removal, intrauterine insemination (IUAI) was performed. If a second spontaneous estrus occurred, which is an indicator of the failure of conception, ewes were bred with Uruguayan Merino rams using either cervical insemination (CAI) or natural mating (NM). This breeding protocol was applied each year between 2001 and 2016.
In 2017, for the first estrus cycle, IUAI was utilized on 23% of the flock, with the remaining ewes being covered by CAI. For this insemination method, estrus was synchronized utilizing two injections of Delprostenate (Glandinex®, Universal, Uruguay) or D-Cloprostenol (Enzaperost®, Biogenesis Bagó, Uruguay) 9 days apart. Fourteen days after the last injection, estrus was detected in all ewes every 12 h, using vasectomized rams, and cervical insemination was performed 12–24 h after onset of estrus. If the second estrus occurred, ewes were naturally mated. In 2018, the breeding protocol was as described for 2017, but in this case, for the first estrus cycle, 21, 25, and 54% of the flock was covered by IUAI, CAI, and NM, respectively. In 2019, ewes were single-sire mated over 5 weeks, whereas in 2020, all ewes were bred with multiple rams in teams for 35 days.
Pregnancy diagnosis via transabdominal ultrasonography (Aloka SSD 500VW/2X real-time scanner, Tokyo, Japan) occurred each year at approximately 45 days after ram removal or the end of the second artificial insemination. Pregnancy rate (pregnant ewes/treated ewes), lambing potential (number of fetuses/ewes treated) and estimated lambing date were identified. Between one and two months before lambing (July–August), all ewes were shorn using the Tally-Hi method [30]. Prior to the last third of pregnancy, ewes were separated into two groups according to the number of fetuses carried (single- or multiple-bearing). Generally, multiple-bearing ewes were assigned to improved pastures whereas those carrying a single fetus grazed on native pastures. Additionally, approximately one month prior to lambing, all pregnant ewes were group fed 400 g of grain/ewe/day (sorghum or commercial rations). Ewe and newborn lamb management at lambing time is described in Ramos et al. [24].
All ewes were annually immunized (August) with a clostridial vaccine (Sintoxan® 9TH Merial, or Ultravac®, Boehringer Ingelheim, Montevideo, Uruguay) and treated for external parasites (Mixan®, La Buena Estrella or Elimix®, Nutritec, Montevideo, Uruguay) (January or February). Internal parasite control was done by oral drench with an effective anthelmintic prior to mating (March to April), lambing (July to August), at lamb marking (September to November) and weaning (December to February). In addition to these internal parasite control treatments, fecal egg counts were monitored as described by Ramos et al. [24].
2.3. Measurements
Each year, ewe unfasted LW and BCS (according to a five-point scale, minimum unit = 0.25 or 0.50 point) [31] were recorded prior to breeding (March–April), pre-lambing (approximately one month before estimated lambing date), and at weaning (December–February). At shearing (July–August), greasy fleece weight (GFW) was recorded, and a mid-side wool sample was taken from each ewe. The sample was sent to a commercial wool laboratory (Uruguayan Wool Secretariat, Montevideo, Uruguay) and analyzed for FD, coefficient of variation of FD (CVfd), staple length (SL), and scoured yield (SY) utilizing the procedures described by Ramos et al. [24,32].
2.4. Total Wool and Reproductive Traits Calculations
Data on fleece weight, number of lambs weaned, and lamb live weight at weaning per lambing opportunity across each ewe’s reproductive lifetime (2–10 years of age) were collected. In this study, lambing opportunities corresponded to the number of mating seasons each ewe had over her lifetime. Total wool production (TWool), which did not include one-year-old fleece, was calculated as the sum of GFW across all lambing opportunities (1–8 mating seasons). Total number of lambs weaned over n lambing opportunities (TLWn) was computed by adding the number of lambs weaned each ewe had over her lifetime. The weaning live weight for all lambs was adjusted to 120 days of age. Total lamb live weight at weaning over n lambing opportunities (TWWn) was calculated by adding the live weight at weaning (adjusted to 120 days of age) of all lambs each ewe had across her lifetime. In all cases, ewe ages ranged between 2 and 10 years.
2.5. Estimated Gross Income per Ewe Lifetime
It has been established that the first four lambing opportunities can be utilized as indicative of lifetime reproductive performance in Merino sheep [33,34]. In this study, TWool and TWW per ewe over four lambing opportunities were calculated and then utilized as indicative of lifetime wool and reproduction performance, respectively. From these data, the impact of reducing FD on gross income per ewe lifetime in the nucleus flock was calculated. Both TWool and TWW were assumed constant across years. For simplification, it was assumed that all lambs were sold at weaning. The annual average FD of the nucleus flock was calculated and then utilized in this analysis. Average wool and meat prices were calculated for the period 2013–2019 [3,35] and utilized for the entire period (1999–2018).
The same analysis was performed for 40 Merino sheep farmers who, since 2001, had utilized either rams or frozen semen from the nucleus flock. In this case, the impact of reducing FD on gross income per ewe lifetime was calculated for two years only (1999 and 2018). The average FD utilized for commercial flocks was 21 and 18.5 µm for ewes born in 1999 and 2018, respectively. This assumption was based on previously reported FD in adult animals of the same commercial flocks [36,37]. In all flocks, FD was measured as described for the nucleus flock [24,32,37]. It was assumed that TWool and TWW were the same as the nucleus flock. Average wool and meat prices were calculated for the period 2013–2019 [3,35] and utilized for both 1999 and 2018 calculations.
2.6. Statistical Analysis
2.6.1. Wool and Growth Traits
Statistical analyses were undertaken utilizing the SAS program (version 9.4, SAS Institute Inc., Cary, NC, USA). Outliers were examined and removed utilizing a robust regression model (PROC ROBUSTREG). A general linear model (PROC GLM) was applied for the wool and growth traits analysis. The model for mixed-age ewe wool traits included “age” (3 levels: 2-year-old; 3–6 years old; ≥7 years old), “period” (2 levels: FMP, 2001–2010, and CRILU, 2011–2020), “calendar year” (20 levels: from 2001 to 2020) nested within the period as fixed effects, and “days of wool growth” (number of days between shearing, 268–399 days) as a covariate. Pregnancy-rank and interactions between fixed effects were either non-significant or had little effect and were therefore not included in the model.
The model for LW at mating was as described for wool traits but in this case, “days of wool growth” corresponded to the number of days between shearing and the day the weight was measured (148–274 days). Ewe LW pre-lambing and weaning were analyzed as described for LW at mating but with “pregnancy-rank” added (3 levels: non-pregnant; single fetus; ≥2 fetuses) as a fixed effect. The model for BCS across all stages of the annual cycle (at mating, pre-lambing, and weaning) was as described for LW but without “days of wool growth” and, in this case, a GENMOD procedure using a Poisson distribution was applied. For LW and BCS at weaning, the lamb rearing type was also tested as a fixed effect.
To examine FD, GFW, and LW at mating trends, a second-degree orthogonal polynomial regressions model (PROC ORTHOREG) was utilized. The regression model for these traits included the same fixed effects described above. The second order was applied in “calendar year” whereas all other effects were treated as first-degree terms. The polynomial regression model for BCS included “age” (3 levels: 2-year-old; 3–6 years old; ≥7 years old), “period” (2 levels: FMP, 2002–2010, and CRILU, 2011–2020), and “calendar year” (19 levels: from 2002 to 2020) nested within the period as fixed effects. For this trait, a third-degree polynomial was applied in “calendar year”. The wool and growth traits trends were performed for each age group separately (2-year-old; 3–6 years old; ≥7 years old), including a 95% confidence interval (CI).
2.6.2. Total Wool and Reproduction Performance per Lambing Opportunity
Total wool and reproductive data were analyzed utilizing a general linear model (PROC GLM). The model for reproductive traits (TLW and TWW) considered “year of birth” (20 levels: from 1999 to 2018), “number of lambing opportunities” (8 levels: 1–8 mating seasons), and “mating method” (4 levels according to the mating method utilized in the first estrus cycle: 100% IUAI (1), between 40 and 88% of the services covered by IUAI (2), between 17 and 43% of the services covered by IUAI (3), and 100% of the services covered by either CAI or NM (4)), as fixed effects. The total wool production across all lambing opportunities was analyzed as described for reproductive traits but without “mating method”. To evaluate the trend in TWW and TWool across all lambing opportunities (1–8 mating seasons), a second-degree orthogonal polynomial regression model (PROC ORTHOREG) including the same fixed effects described above was utilized. The second order was applied in the “year of birth” whereas all other effects were treated as first-degree terms.
3. Results
The descriptive statistics for wool, growth, and reproductive traits are shown in Table 1. Over the study period (1999–2020), mixed-age ewe FD, GFW, and LW at mating fluctuated between 15.0 and 19.1 µm, 3.1 and 4.1 kg, and 43.1 and 52.3 kg, respectively (Table 2).

Table 1.
Descriptive statistics for mixed-age ewe wool, growth, and reproductive traits over the entire study period (1999–2020).
Table 2.
Ewe annual mean, standard deviation (SD), and number of records of the fiber diameter (FD, μm), greasy fleece weight at shearing (GFW, kg), and live weight at mating (LWM, kg) (1999–2020).
3.1. Wool Traits
FD, GFW, CVfd, SL, and SY were all affected by the period (p < 0.05, Table 3). During the FMP phase, ewes had coarser and longer fibers than those produced in the CRILU period. During the FMP, ewes had lighter fleeces, higher CVfd, and greater SY compared with the CRILU phase.
Table 3.
Least square means (LSMs) and standard errors of the mean (SEMs) of the fiber diameter (FD, μm), greasy fleece weight (GFW, kg), coefficient of variation of the fiber diameter (CVfd, %), staple length (SL, cm), and scoured yield (SY, %) by period and ewe age (1999–2020).
All wool traits were affected by ewe age (p < 0.05, Table 3). Ewe FD increased as animals aged. Two-year-old ewes had the longest fibers and ewes aged seven or older had the shortest fibers. Ewes aged seven or older had the lightest fleeces, the highest CVfd, and the lowest SY, with no differences between the other two age groups for these traits.
3.2. Growth Traits
Ewe LW across all stages of the annual cycle (at mating, pre-lambing, and weaning) was affected by period, pregnancy-rank (pre-lambing and weaning), and age group (p < 0.05, Table 4). Ewe LW at mating, pre-lambing, and weaning was higher (2–5%) in the CRILU period compared to the FMP phase. Among pregnancy-ranks, non-pregnant ewes had the lightest LW pre-lambing and multiple-bearing ewes had the heaviest LW pre-lambing. Ewes carrying singles or multiple fetuses were lighter (9–11%) at weaning than non-pregnant ewes. Among pregnant ewes, multiple-bearing ewes were lighter at weaning than those bearing singles. Ewe LW across all stages of the annual cycle increased as animals aged.
Table 4.
Least square means (LSMs) and standard errors of the mean (SEMs) of the live weight at mating (LWM, kg), pre-lambing (LWL, kg), and at weaning (LWW, kg) and the body condition score at mating (BSCM), pre-lambing (BCSL), and at weaning (BCSW) by the period, pregnancy-rank, and age group (1999–2020).
Ewe BCS at mating, pre-lambing, and weaning was lower (between 0.4 and 0.6 units less) in the CRILU period compared to the FMP phase (p < 0.05, Table 4). Ewe BCS pre-lambing was unaffected by pregnancy-rank (p > 0.05, Table 4). At weaning, non-pregnant ewes had the highest (p < 0.05) and multiple-bearing ewes the lowest BCS (p < 0.05). Within pregnant ewes, multiple-bearing ewes had lower (p < 0.05) BCS at weaning than their single-bearing counterparts. Among age groups, BCS at mating decreased (p < 0.05) as animals aged, whereas BCS pre-lambing was unaffected (p > 0.05) by animal age. Ewes aged seven or older had lower BCS at weaning than the other two age groups (p < 0.05, Table 4).
The model for LW and BCS at weaning also tested lamb rearing type as a fixed effect. Both LW and BCS at weaning were affected by lamb rearing type (p < 0.05, data not shown). Non-pregnant ewes were the heaviest and ewes rearing multiple lambs were the lightest at weaning (51.8 ± 0.33 vs. 46.1 ± 0.25 kg). The same trend was observed for BCS (3.5 ± 0.03 and 2.5 ± 0.02, for non-pregnant and ewes rearing multiples, respectively). Ewes rearing multiple lambs were lighter (46.1 ± 0.25 vs. 47.3 ± 0.14 kg) and had lower BCS (2.5 ± 0.02 vs. 2.8 ± 0.01) at weaning than those rearing single lambs.
3.3. Wool Traits Trends
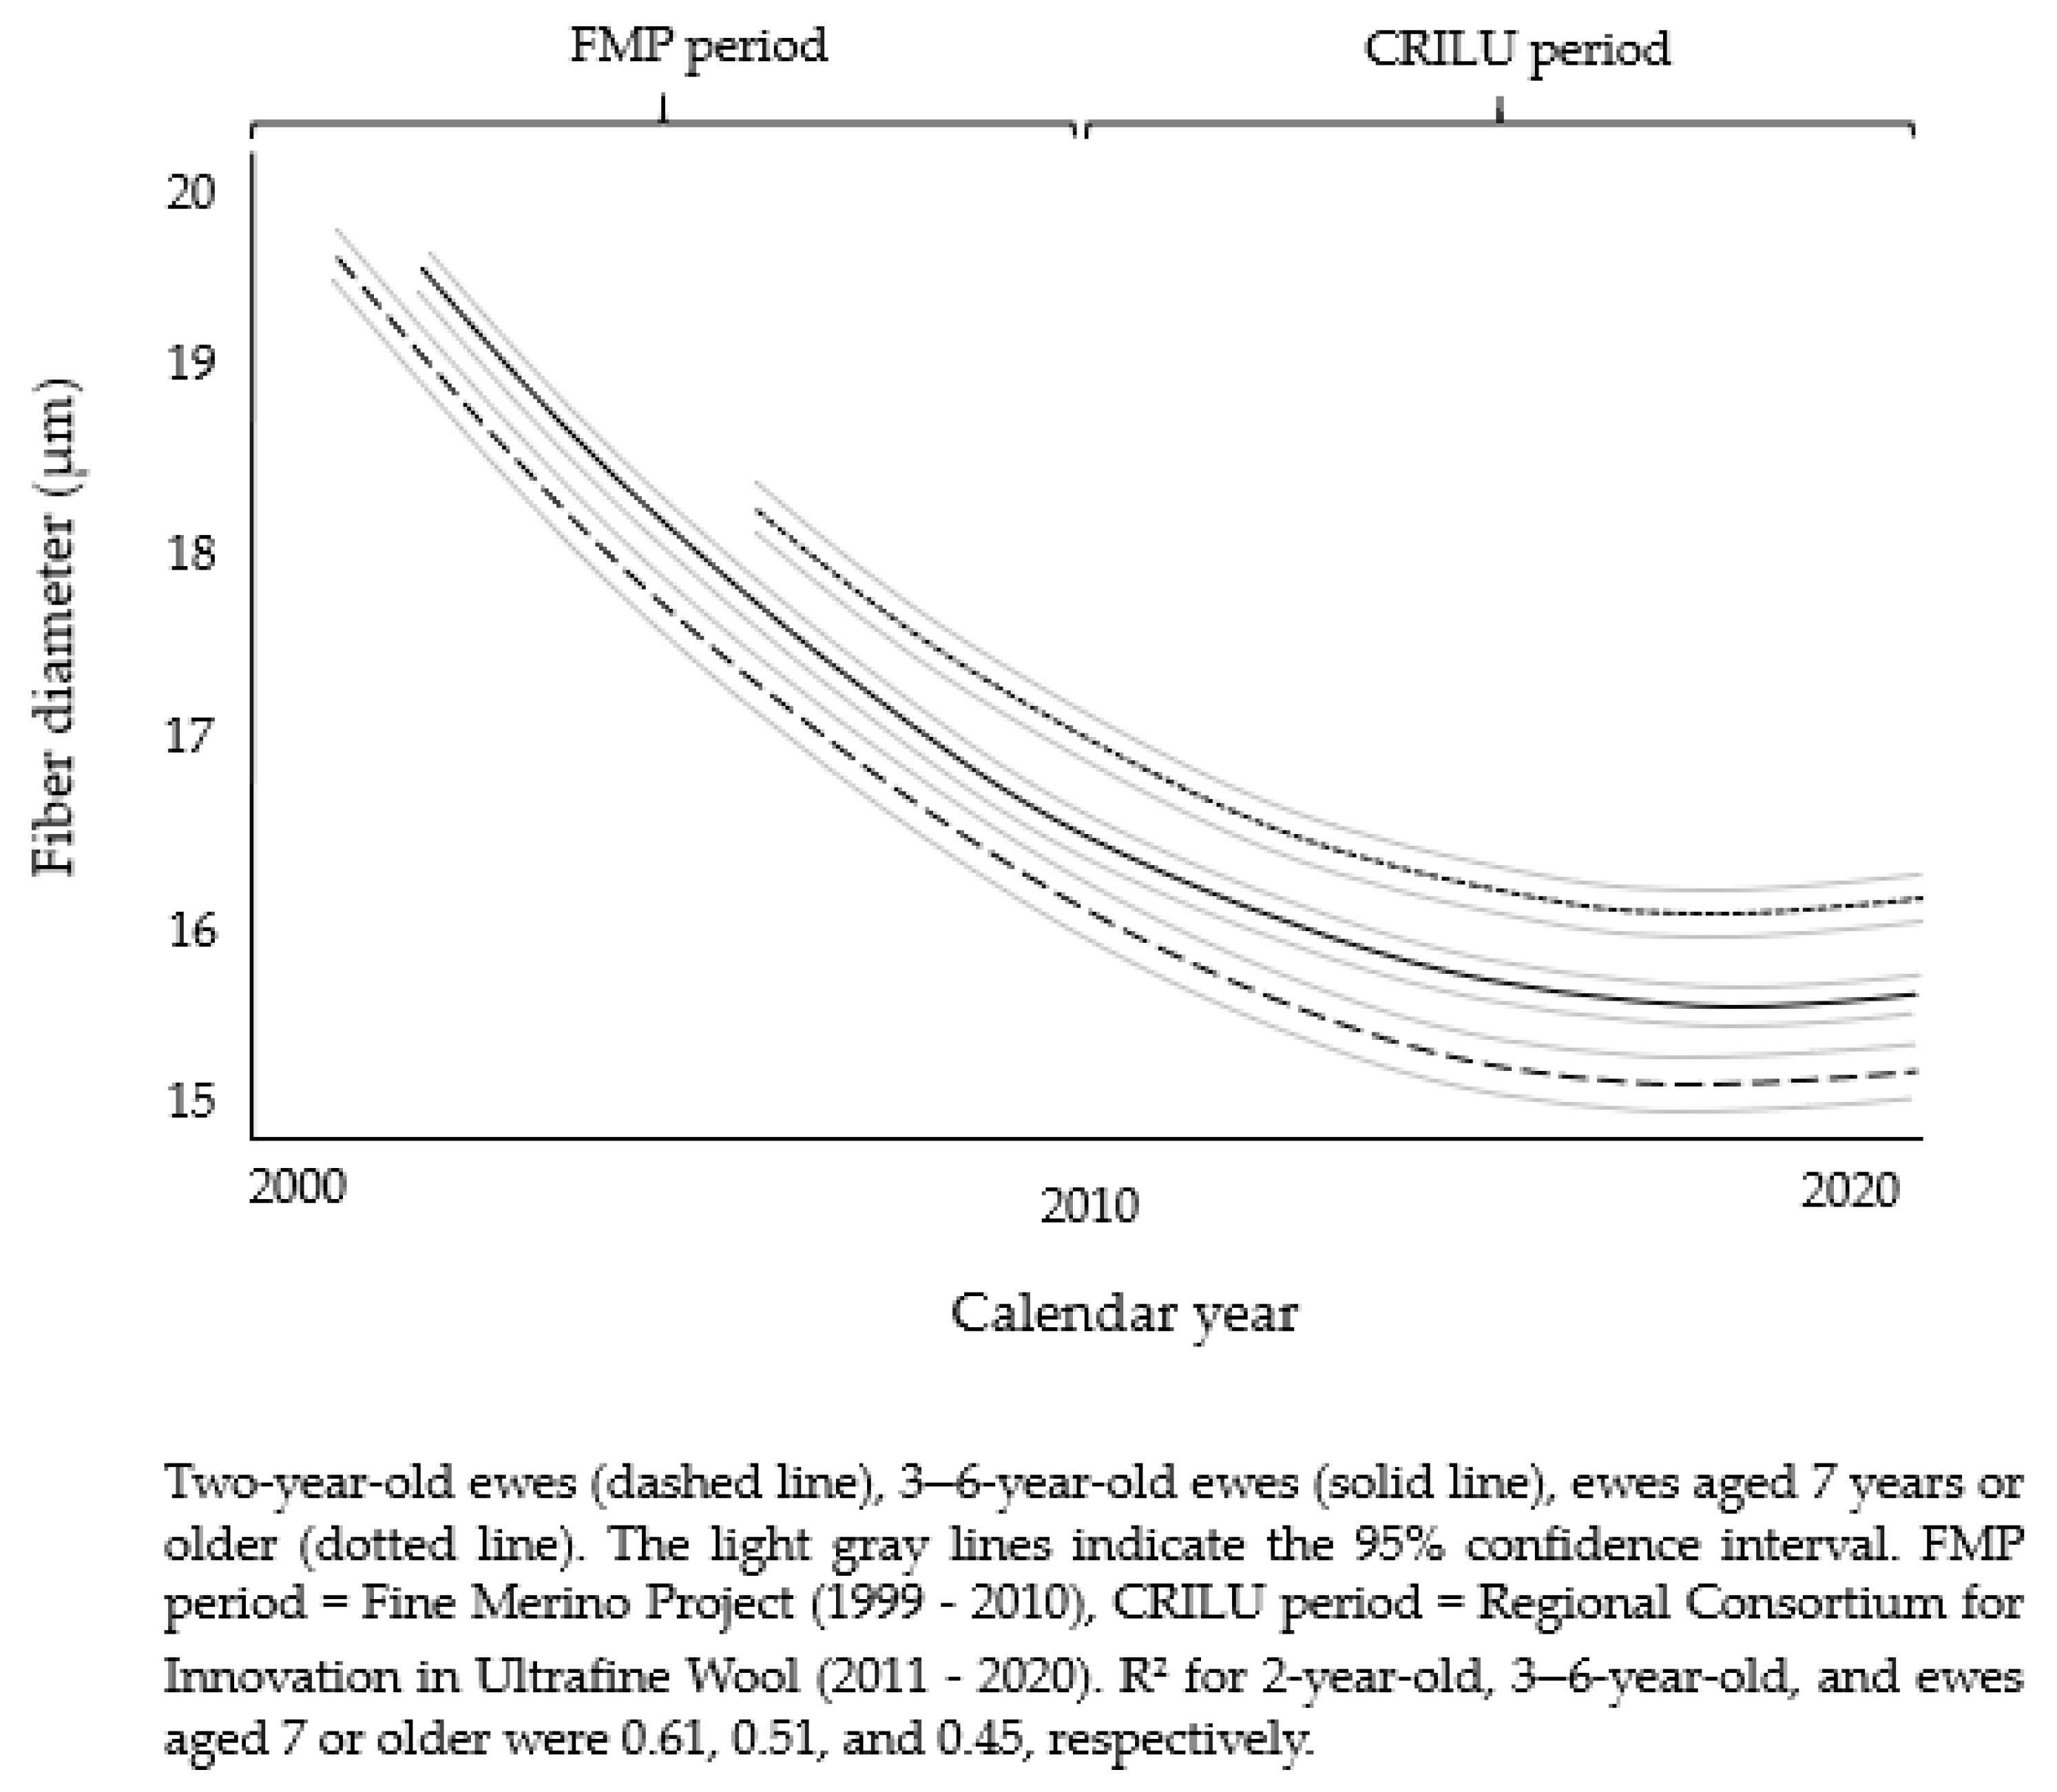
Throughout the study period (1999–2020), the second-degree polynomial regression model (second order for the “calendar year”) explained 61%, 51%, and 45% of the FD changes in 2-year-old, 3–6, and ewes aged seven or older, respectively (Figure 1). During the entire study period and across age groups, ewe FD decreased by approximately 3 µm. Two-year-old ewes had the finest (p < 0.05) and those aged seven or older the coarsest (p < 0.05) fibers, with ewes aged 3–6 being intermediate.
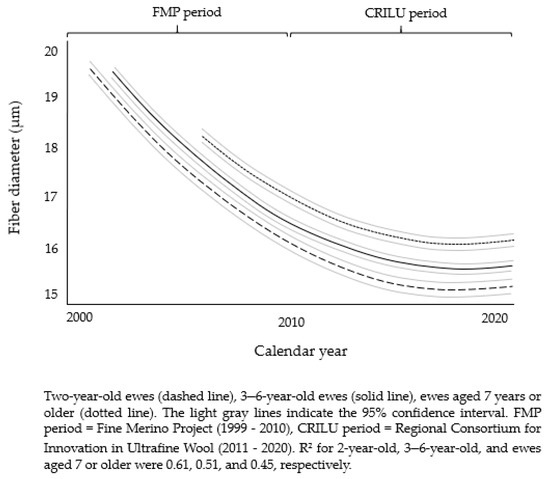
Figure 1.
Two-year-old ewes, 3–6-year-old ewes, and ewes aged seven years or older phenotype trends using a second-degree polynomial regression model for the average fiber diameter across calendar years (2001–2020).
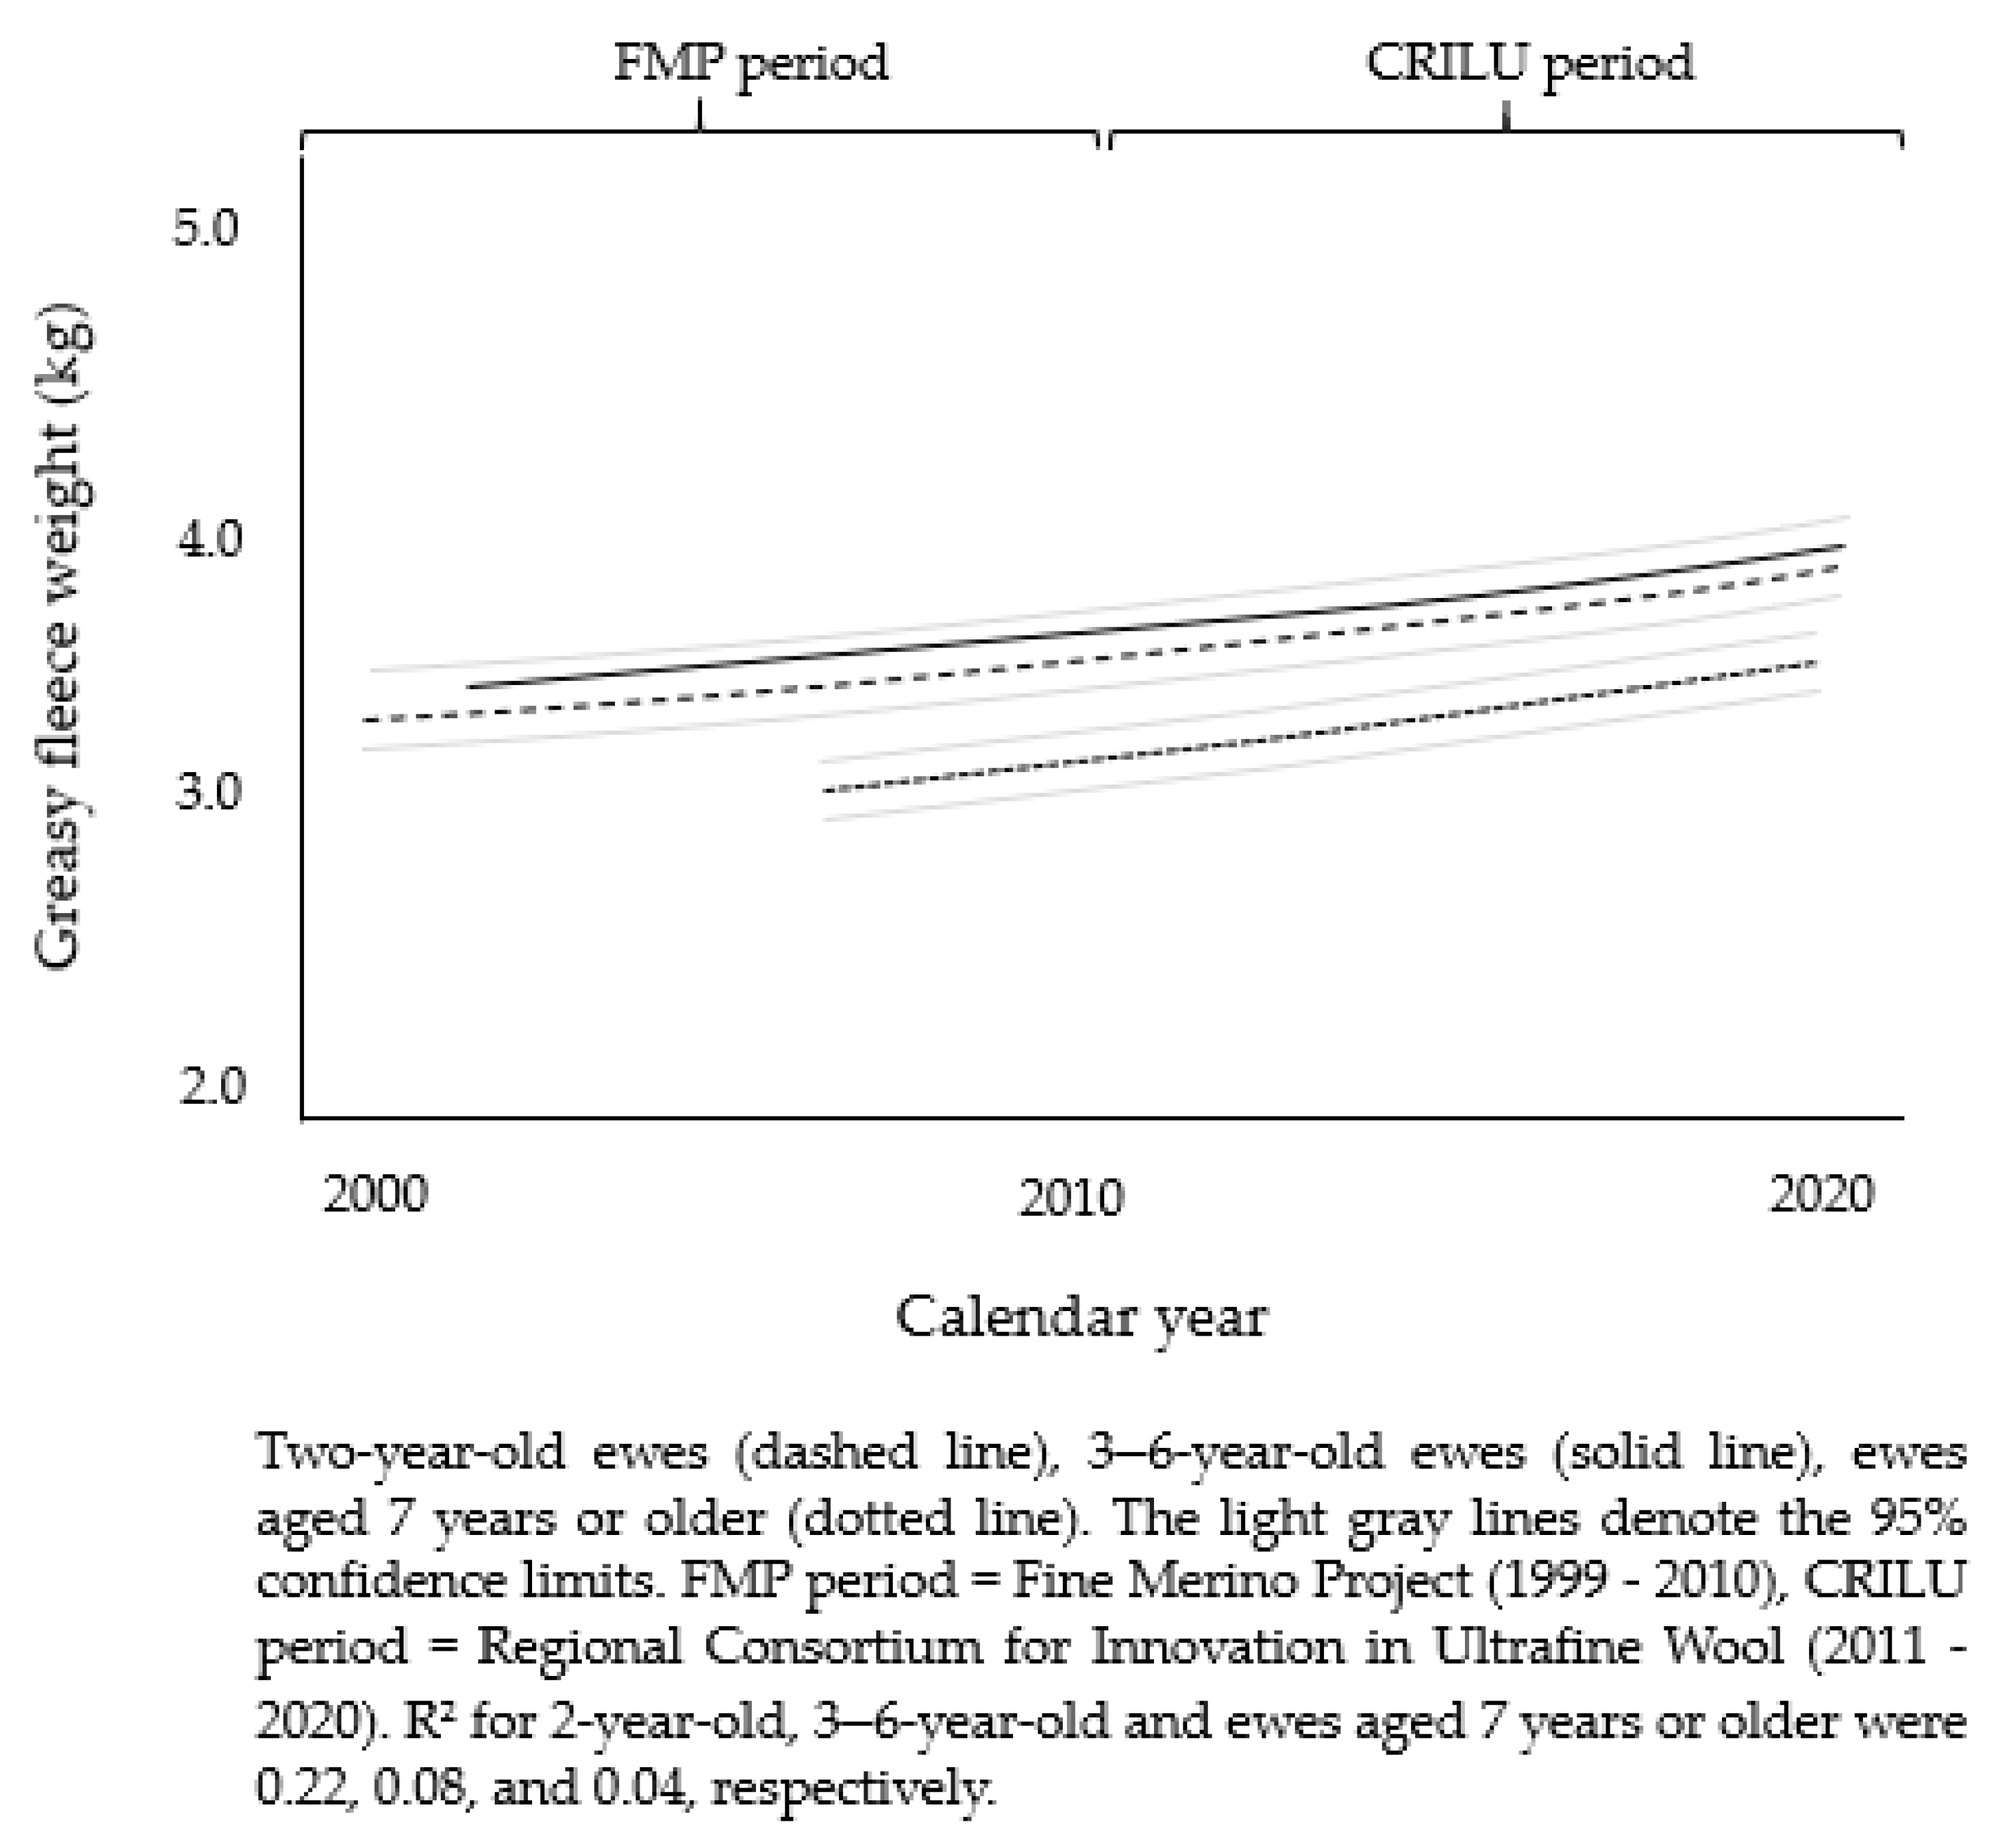
Regardless of ewe age, GFW increased over time (Figure 2). Two-year-old ewes had the highest R2 value (0.22) whereas, the R2 for 3–6 years old ewes and those aged seven or older were 0.08 and 0.04, respectively. Ewes aged seven or older had the lightest (p < 0.05) GFW, with no differences (p > 0.05) between the other two age groups.

Figure 2.
Two-year-old ewes, 3–6-year-old ewes, and ewes aged seven years or older phenotype trends using a second-degree polynomial regression model for the average greasy fleece weight across calendar years (2001–2020).
3.4. Growth Traits Trends
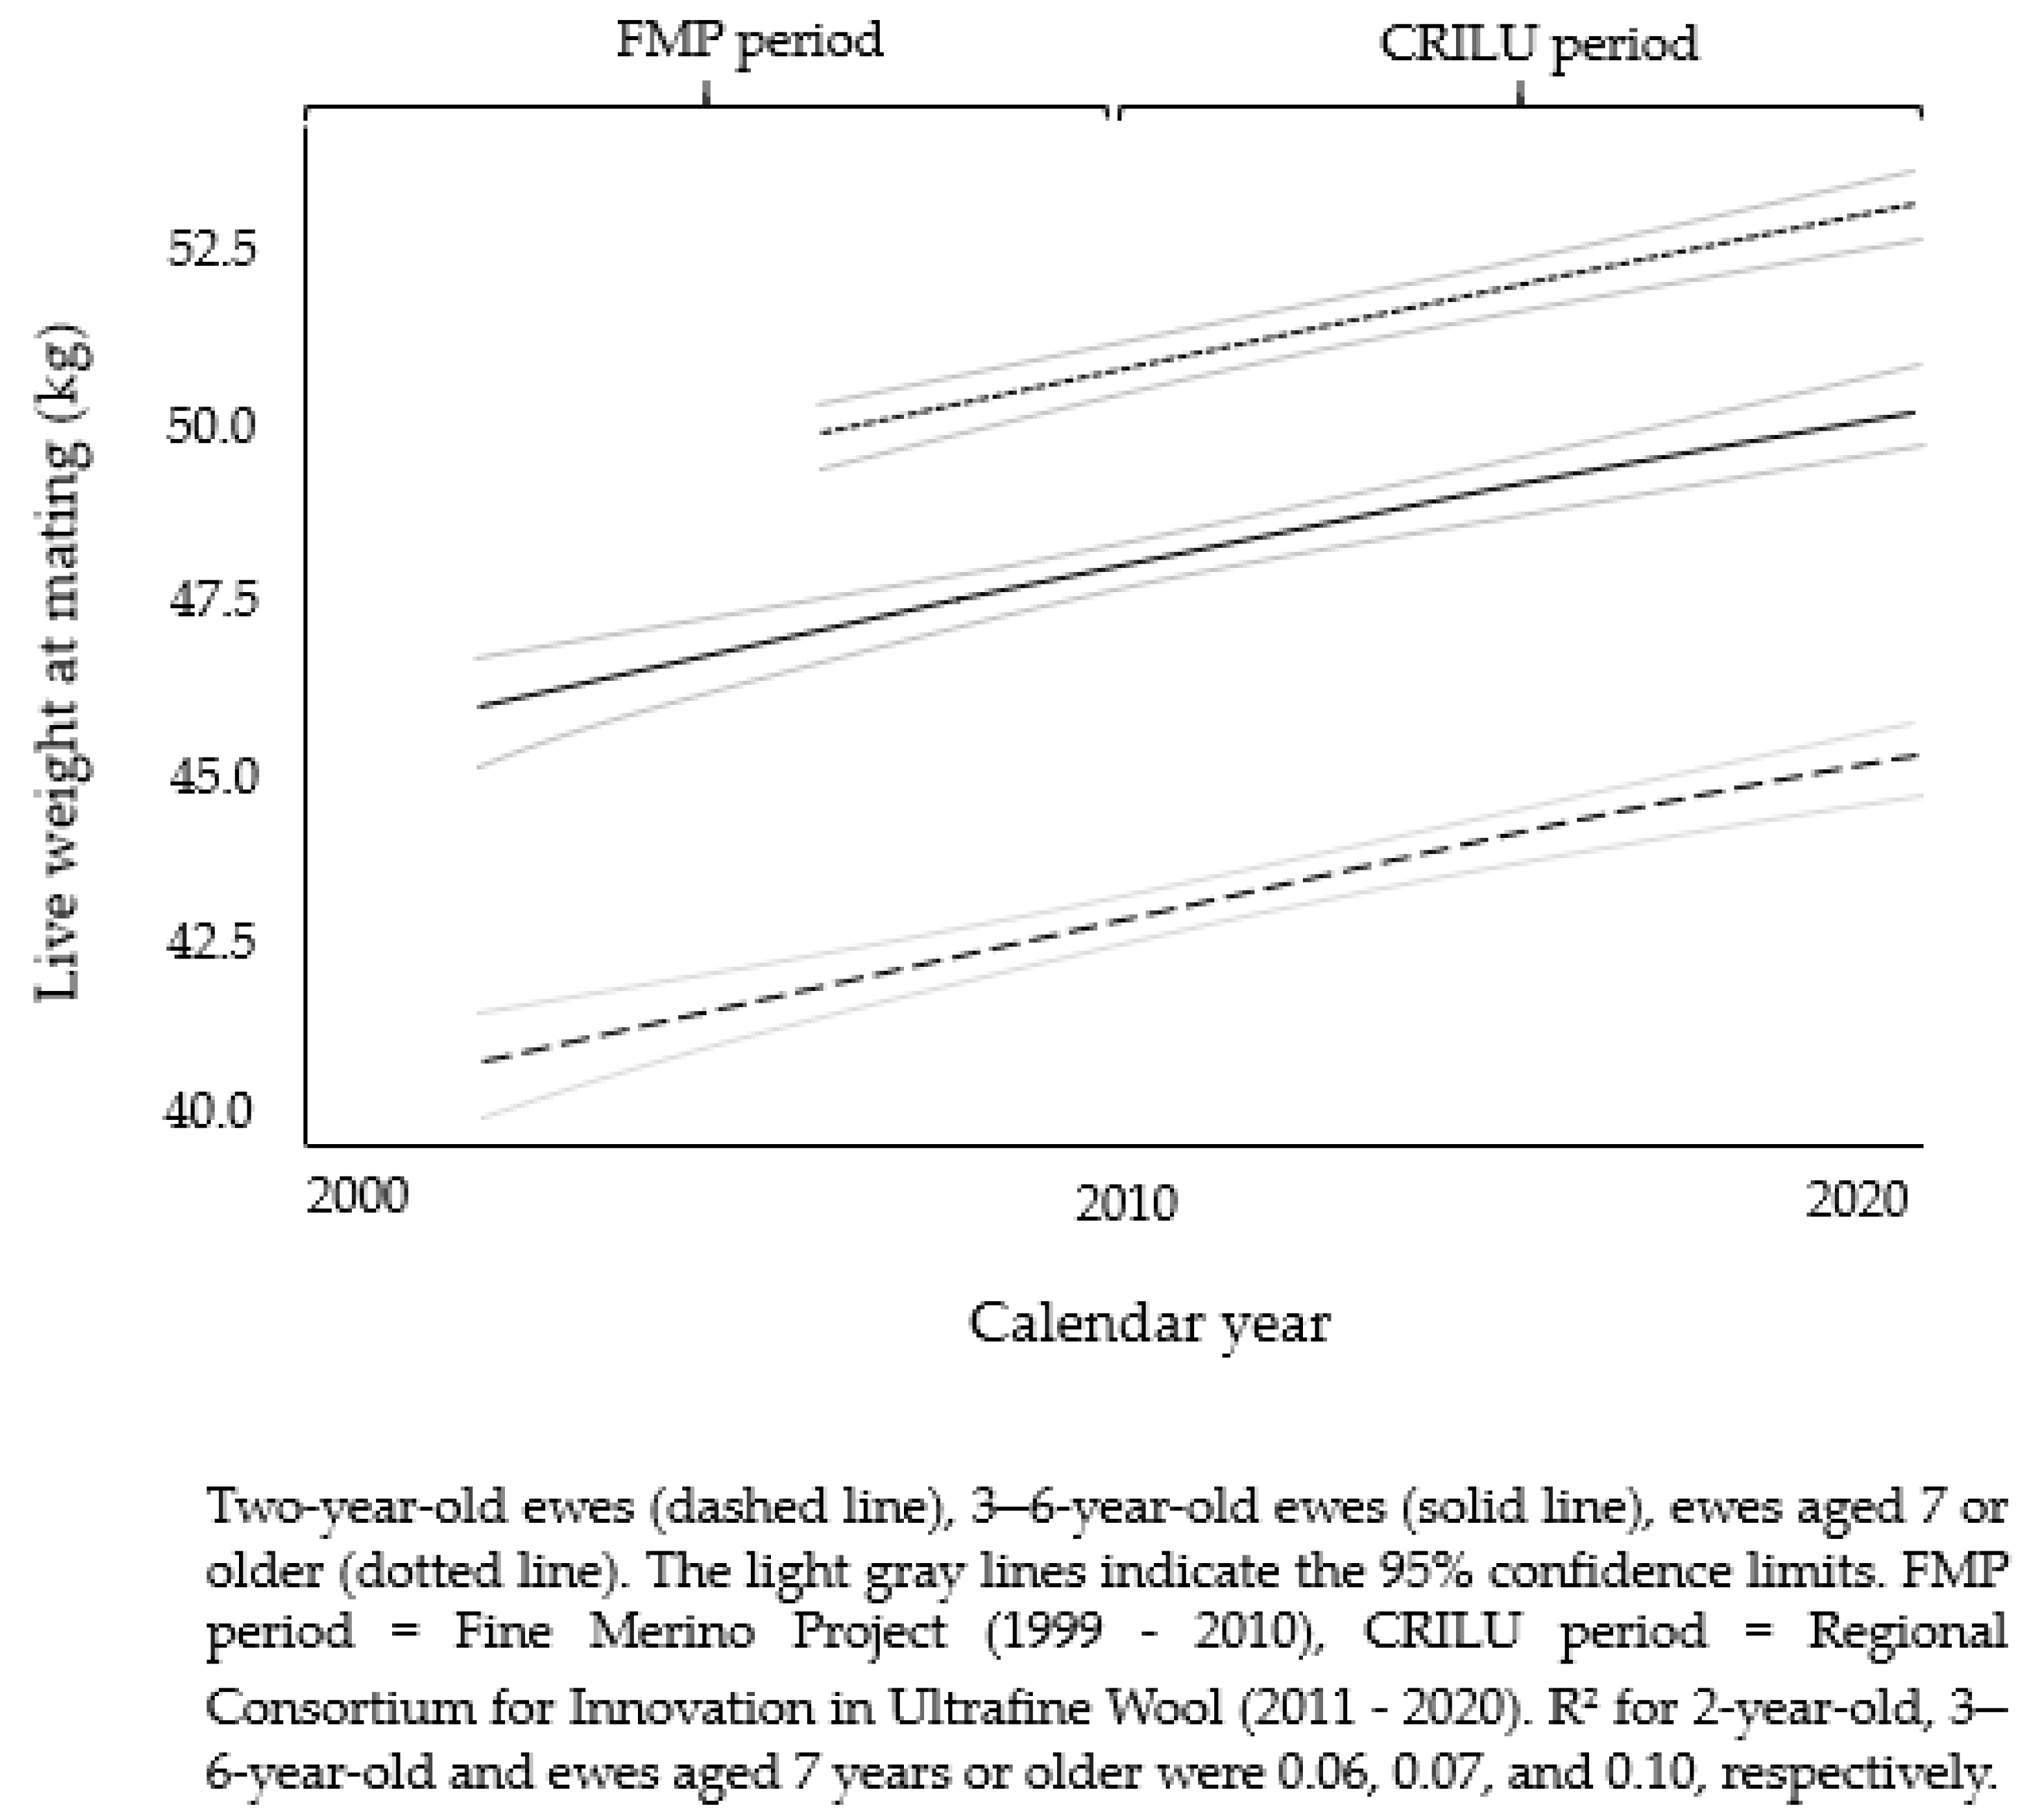
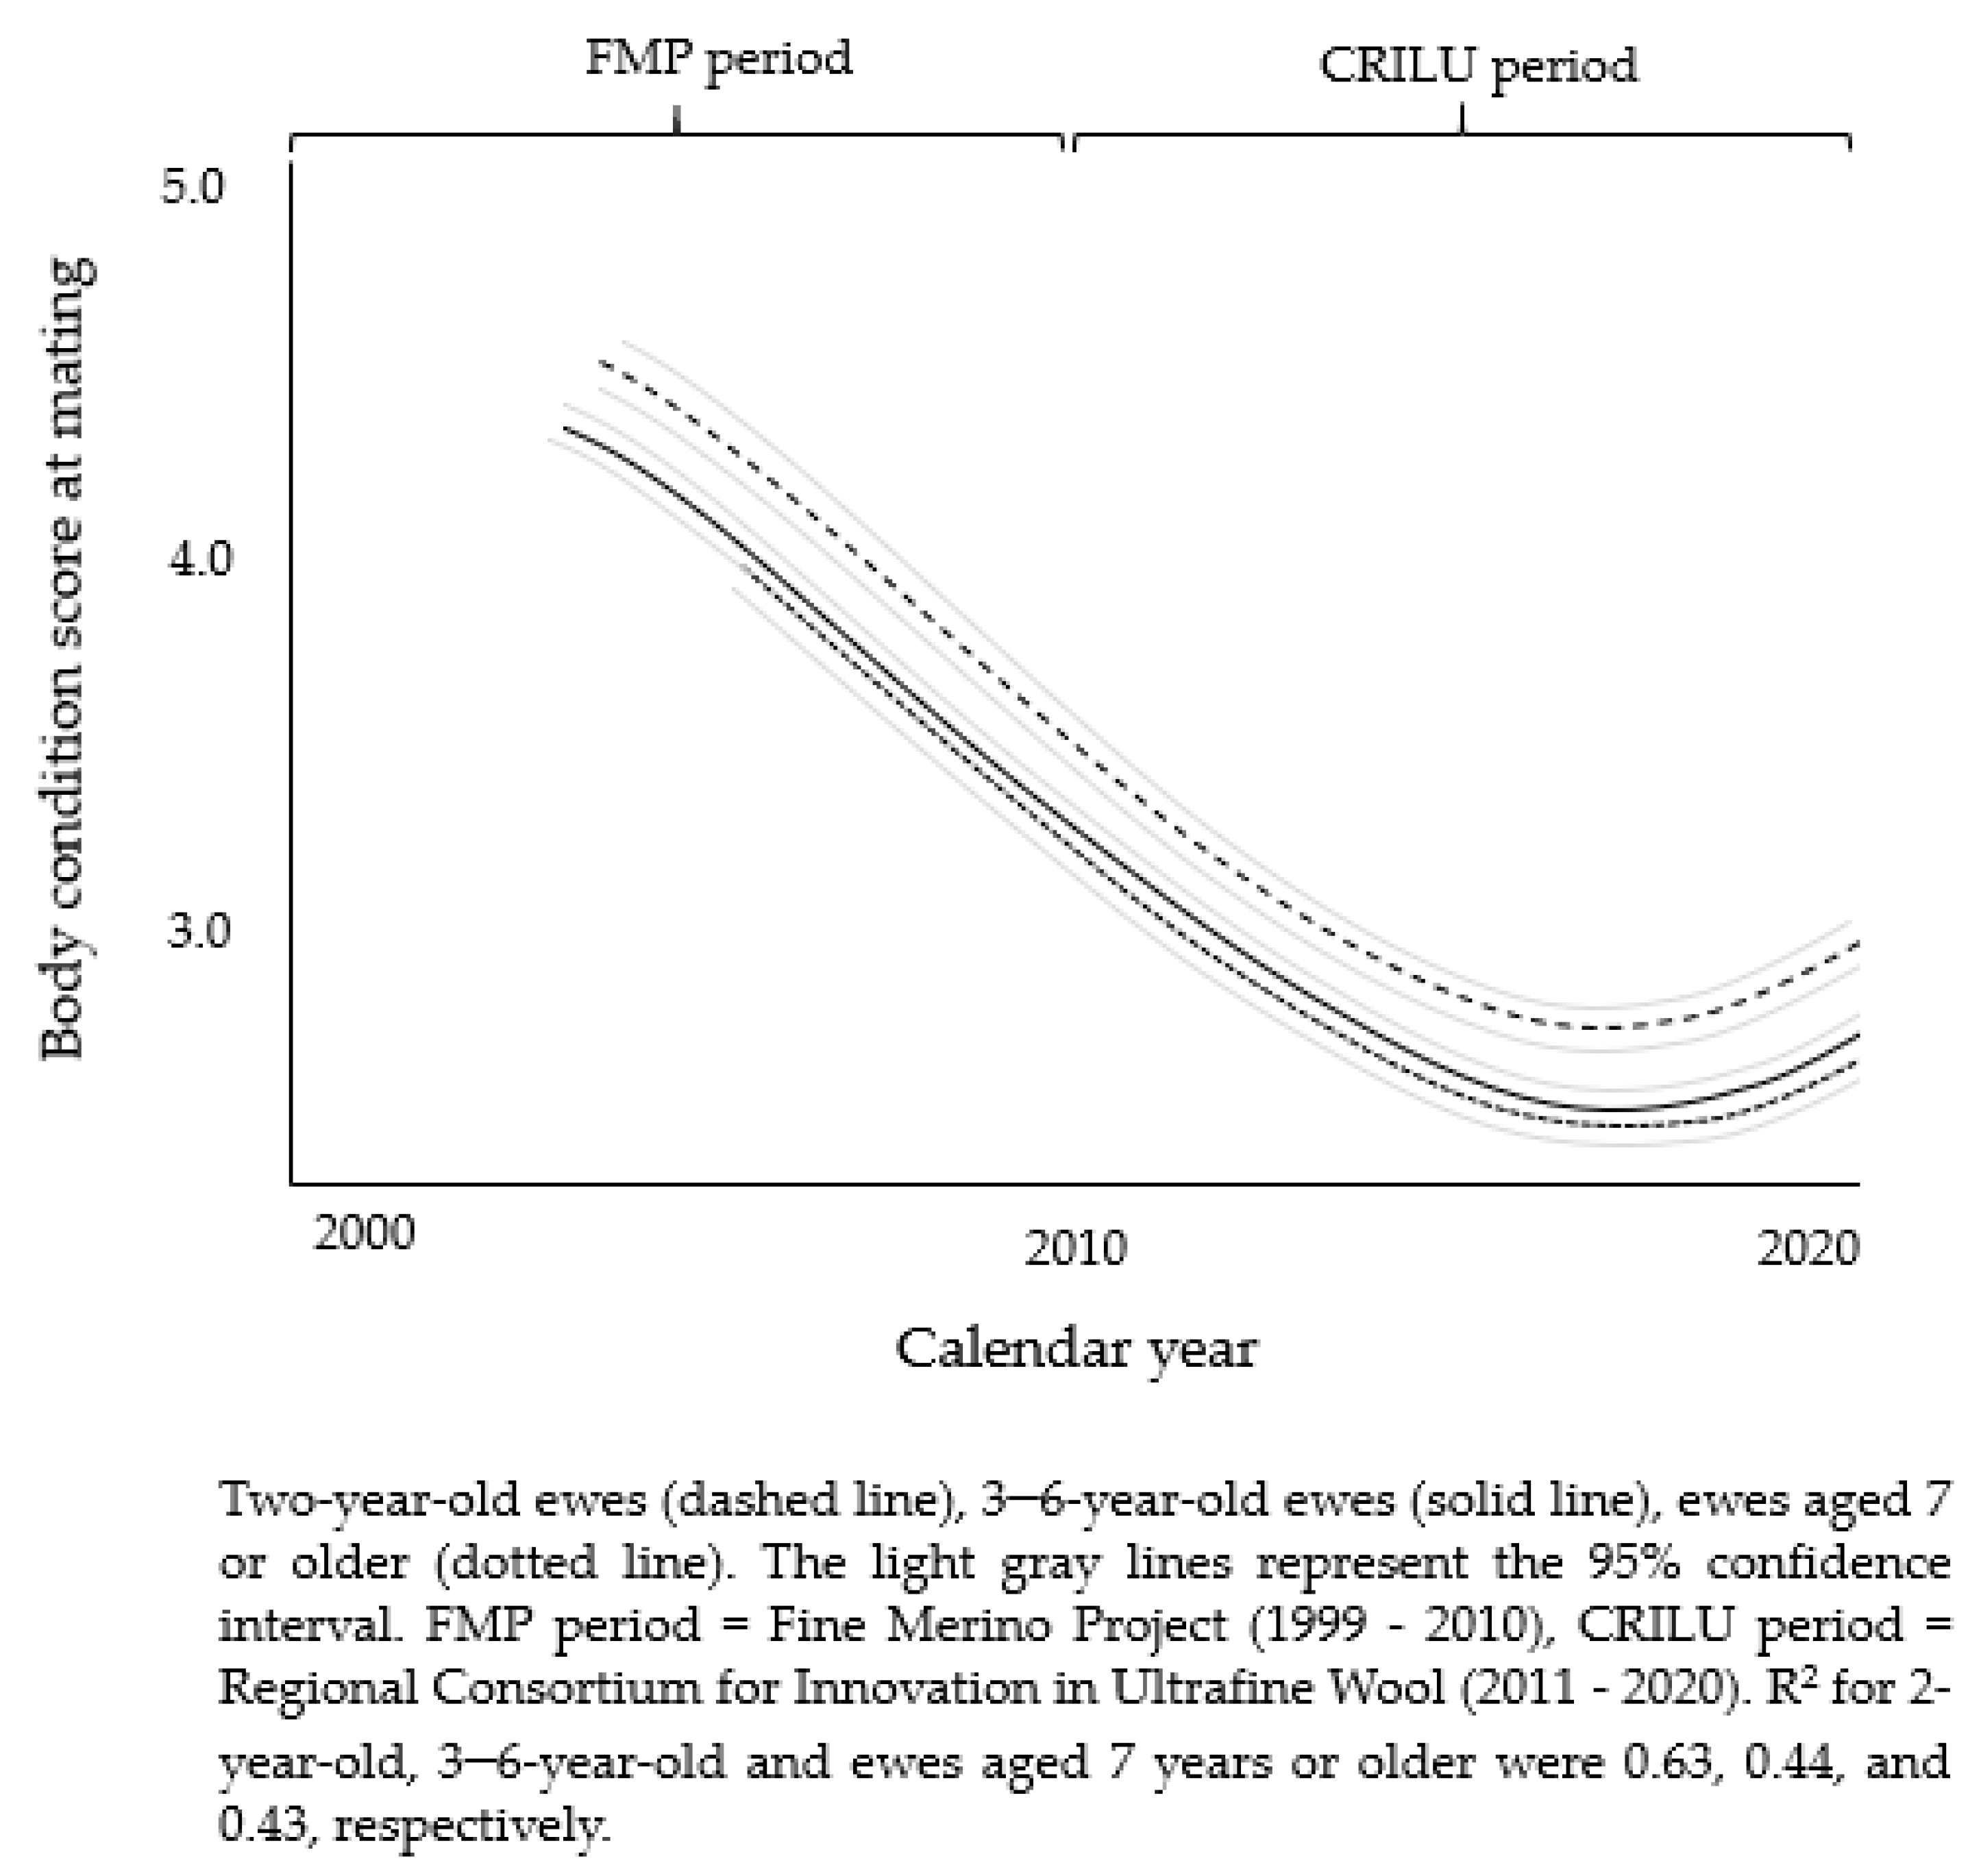
The second-degree polynomial regression model for LWM is displayed in Figure 3. The R2 of LWM for each age group ranged between 0.06 and 0.10. Ewes aged seven years or older were the heaviest (p < 0.05) and 2-year-old ewes the lightest (p < 0.05) at mating. Across all age groups, ewe LWM increased over time (Figure 3). Regardless of ewe age, BCSM decreased over time, with scores lower than 3.0 towards the end of the study period. The R2 value for this trait was higher (0.63) in 2-year-old ewes compared to the other age groups (0.44 and 0.43, Figure 4).

Figure 3.
Two-year-old ewes, 3–6-year-old ewes, and ewes aged seven or older phenotype trends using a second-degree polynomial regression model for the average live weight at mating across calendar years (2001–2020).

Figure 4.
Two-year-old ewes, 3–6-year-old ewes, and ewes aged seven or older phenotype trends using a third-degree polynomial regression model for the average BCS at mating across calendar years (2002–2020).
3.5. Total Wool and Reproductive Traits
The means and standard errors of accumulative TWool, TLW, and TWW across all lambing opportunities (1–8 mating seasons) are presented in Table 5. For a given lambing opportunity, wool production, the number of lambs weaned, and the live weight of lamb weaned per ewe fluctuated between 3.1 and 3.6 kg, 0.7 and 0.8 lambs, and 15.7 and 19.3 kg, respectively. Both TLW and TWW were affected by the mating method (p < 0.05).
Table 5.
Least square means (LSMs) and standard errors of the mean (SEMs) of accumulative total wool production (TWool, kg), total number of lambs weaned (TLW, n), and total lamb live weight at weaning (TWW, kg) by lambing opportunity (1999–2020).
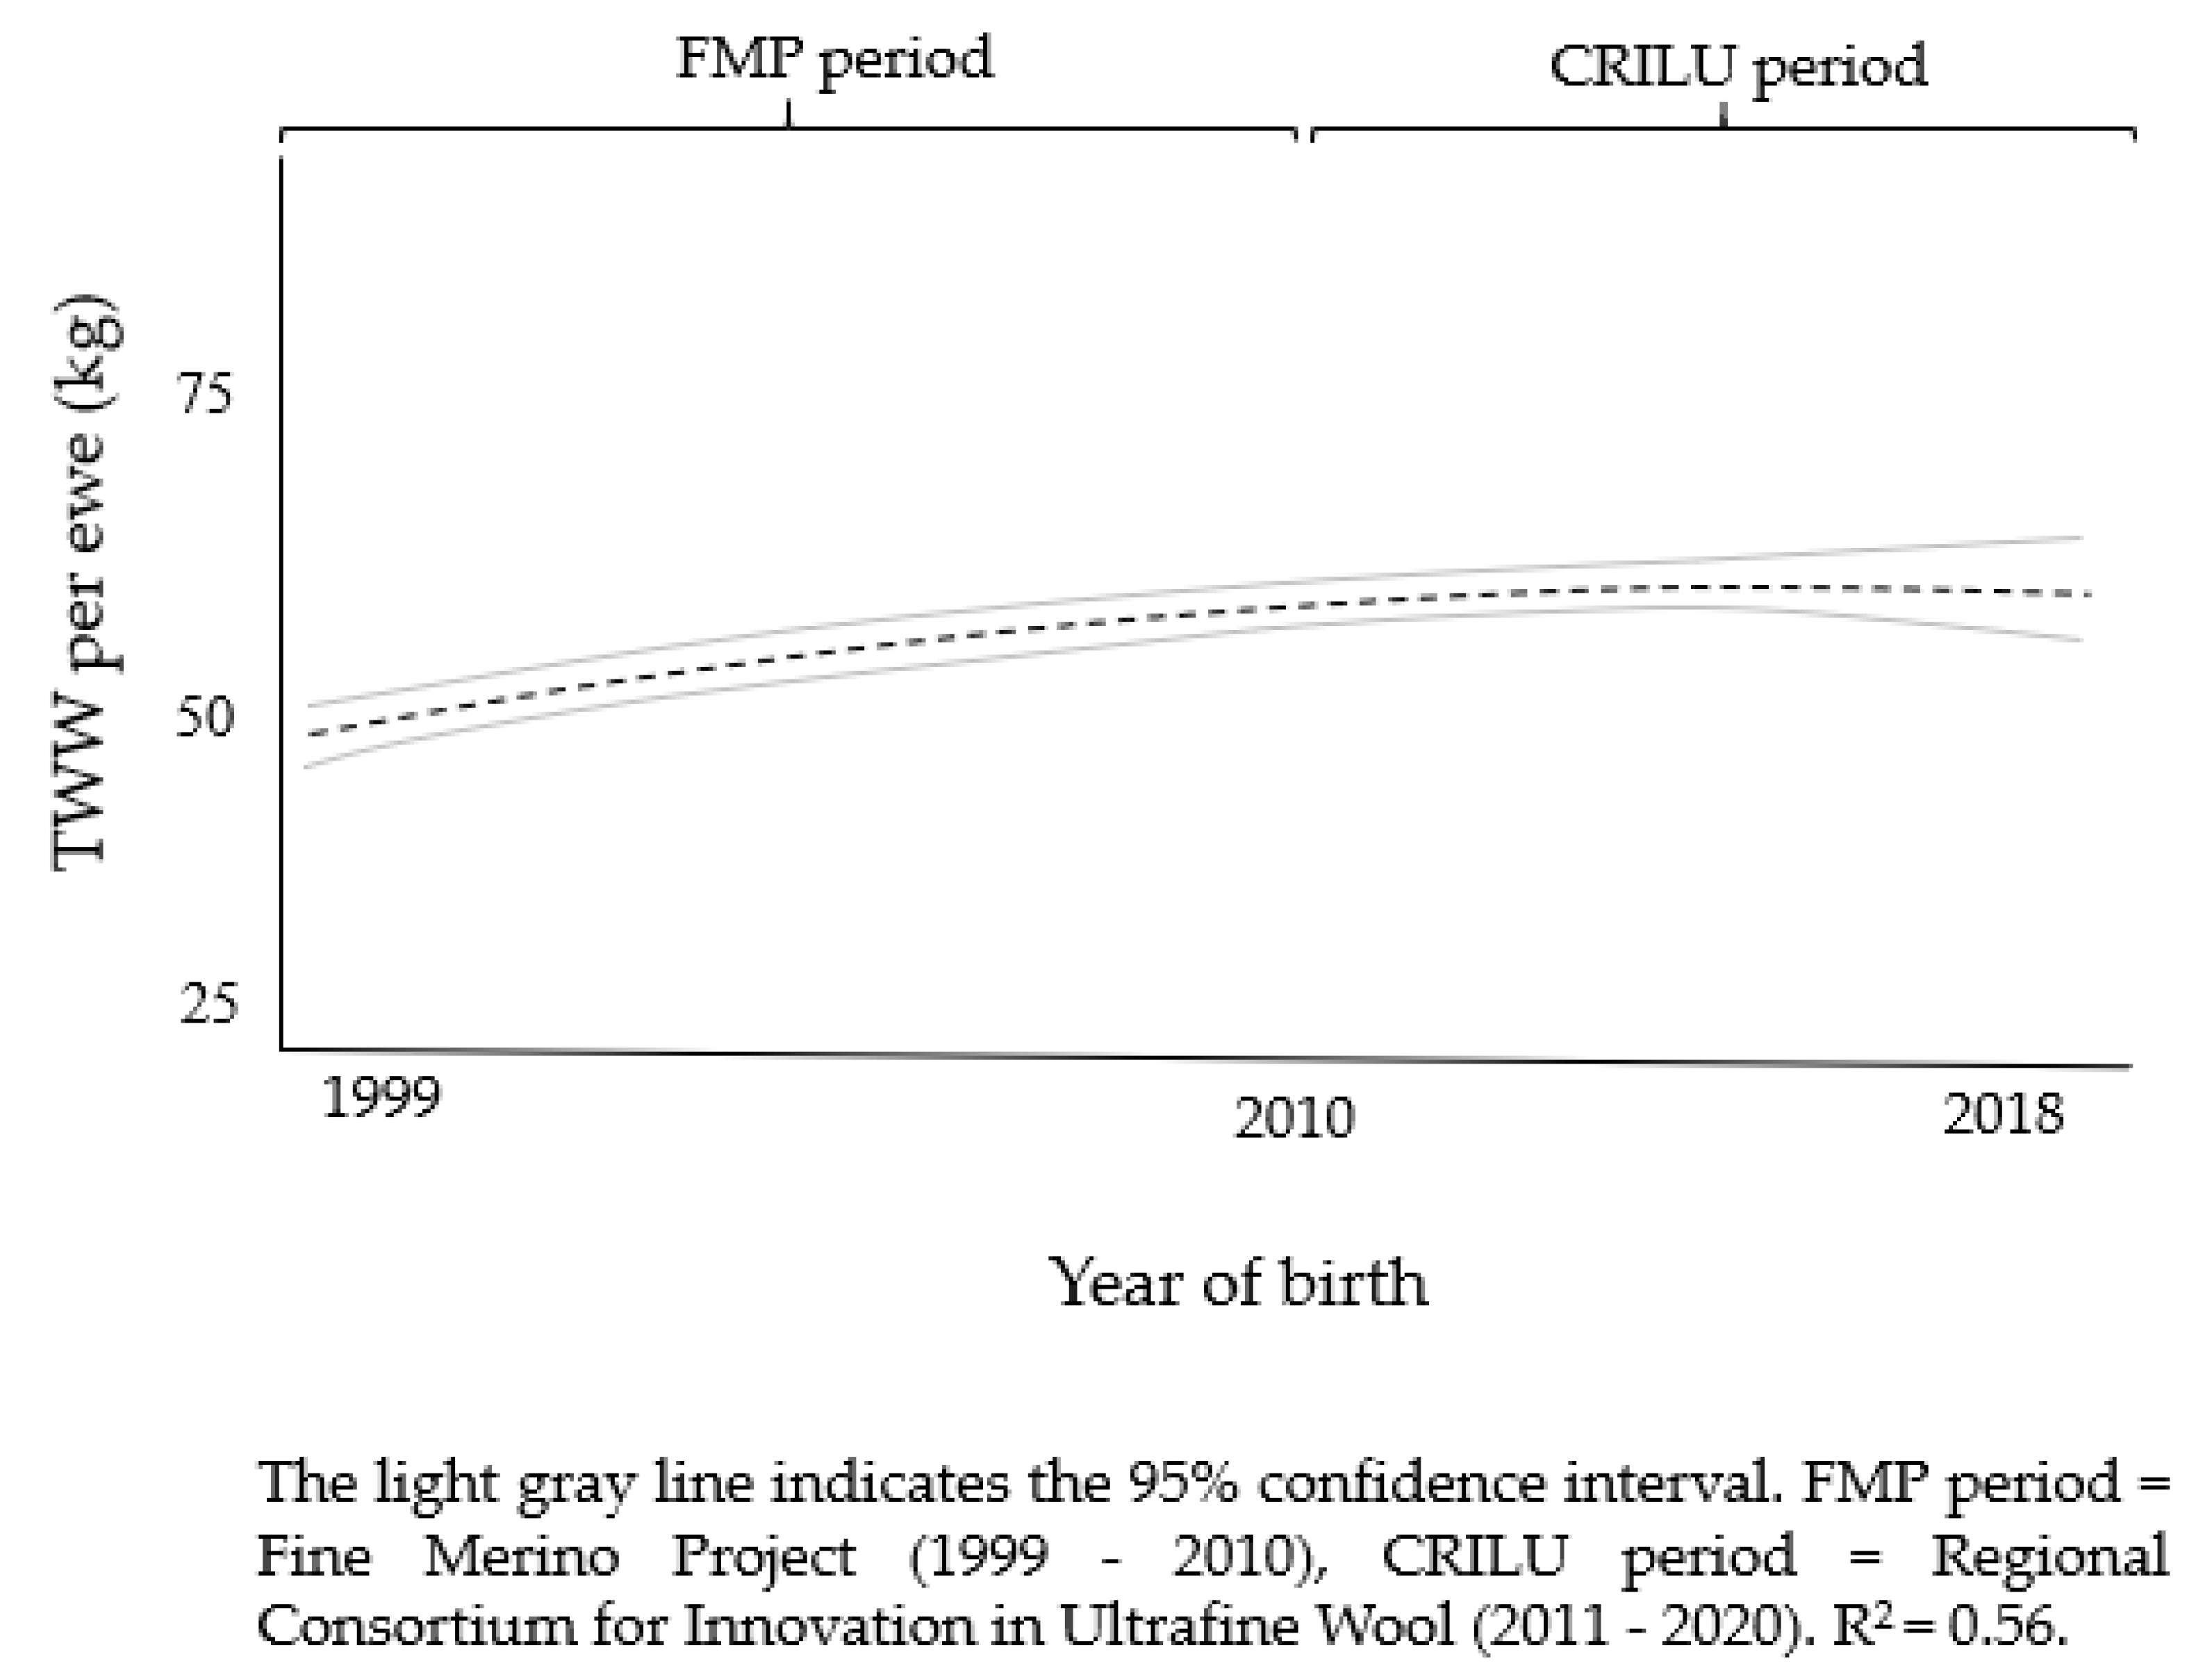
The phenotypic trend for TWW and TWool for the combined lambing opportunities (1–8 mating seasons) by year of birth is displayed in Figure 5 and Figure 6, respectively. TWW was affected by year of birth (p < 0.05, R2 = 0.56), whereas this effect was not significant (p > 0.05) for TWool. Both traits showed little change across time.

Figure 5.
Mixed-age ewe phenotype trend for the accumulative total lamb live weight at weaning across all lambing opportunities (1–8) per year of birth (1999–2018) using a second-degree polynomial regression. Lambing opportunities correspond to the number of mating seasons each ewe had over her lifetime.
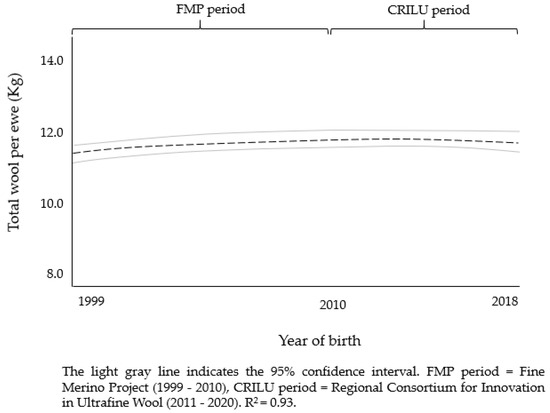
Figure 6.
Mixed-age ewe phenotype trend for accumulative total wool production across all lambing opportunities (1–8) per year of birth (1999–2018) using a second-degree polynomial regression. Lambing opportunities correspond to the number of mating seasons each ewe had over her lifetime.
3.6. Estimated Gross Revenue per Ewe Lifetime
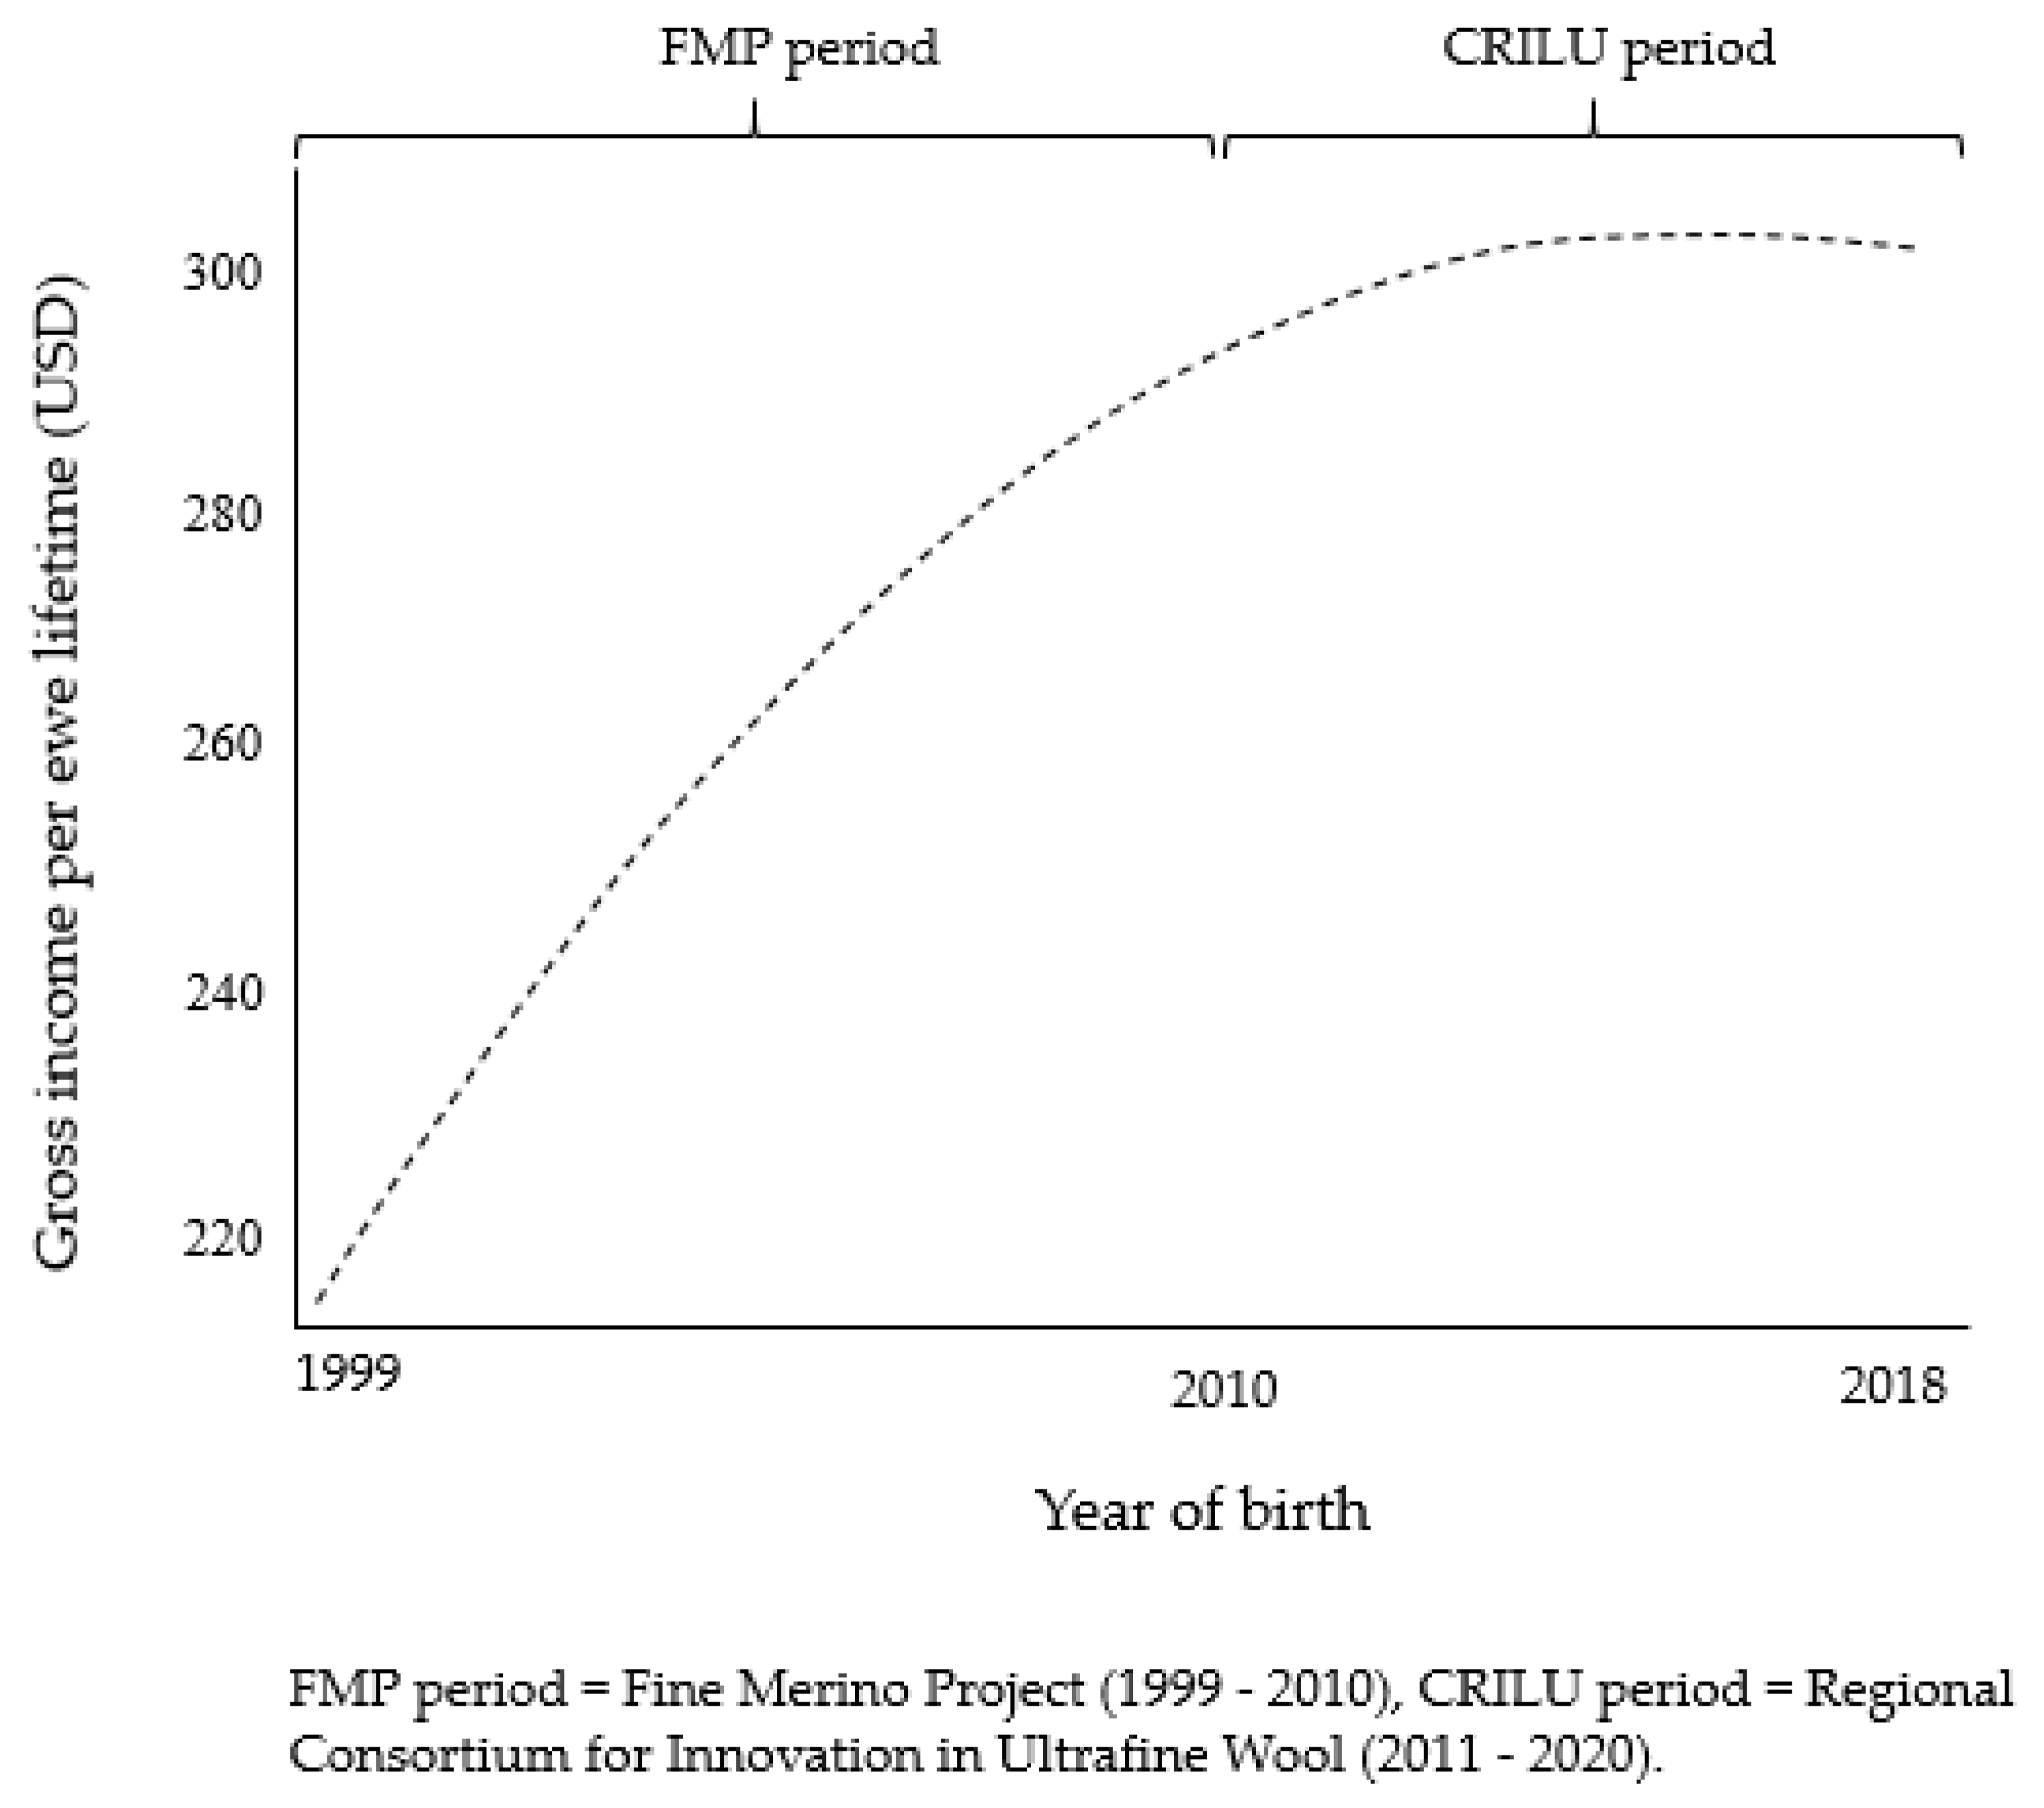
Gross income per ewe lifetime (across four lambing opportunities) [33,34] over the entire study period is displayed in Figure 7. During the FMP (1999–2010), gross income increased by approximately 26%, with little change towards the end of the study period. Overall, during the study period (1999–2018), gross income per ewe lifetime increased by 32% and 21% in the nucleus and in commercial flocks, respectively (Figure 8).

Figure 7.
Gross income per ewe lifetime (across four lambing opportunities) per year of birth (1999–2018) in the nucleus flock. Total wool production and total lamb live weight at weaning across four lambing opportunities were assumed constant across years. It was assumed that all lambs were sold at weaning. Average wool and meat prices were calculated for the period 2013–2019 [3,35] and utilized for the entire analysis period (1999–2018).
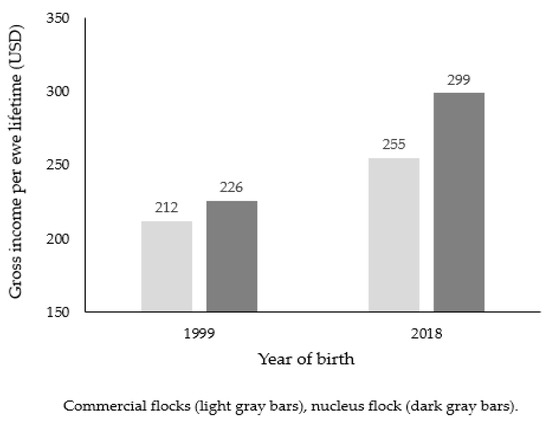
Figure 8.
Estimated gross income per ewe lifetime (across four lambing opportunities) in commercial flocks and in the nucleus at the beginning and end of the study period. These commercial farmers have utilized either rams or frozen semen from the nucleus flock. Total wool production and total lamb live weight at weaning across four lambing opportunities were assumed constant. Both TWool and TWW were assumed to be the same for the nucleus and commercial flocks. It was assumed that all lambs were sold at weaning. In the nucleus flock, the average FD was 19 and 16 µm for ewes born in 1999 and 2018, respectively. In commercial flocks, the average FD was 21 and 18.5 µm for ewes born in 1999 and 2018, respectively. This assumption was based on previously reported FD in adult animals of the same commercial flocks [36,37]. Average wool and meat prices were calculated for the period 2013–2019 [3,35] and utilized for both 1999 and 2018 calculations.
4. Discussion
This study analyzed data from two joint projects (FMP and CRILU), over the period 1999–2020 in a single flock. The FMP (1999–2010) focused on FD reduction based on selection at 12 months of age, whereas in the CRILU project period (2011–2020), the selection objective was to reduce FD while increasing both CFW and LW. This paper reports the phenotypic trends observed in mixed-age ewes across a twenty-year period.
Adult ewe wool traits are key determinants of Merino flock income [38,39]. Wool micron accounts for 80% of the fleece value, with finer wool obtaining the highest prices [40,41,42]. During the FMP period (1999–2010), ewe FD decreased by approximately 3 µm, from 19 to 16 µm, which is comparable with previously reported reductions in FD in yearling lambs of the same flock [24]. This similar trend between one-year-old lambs and adult animals for FD is not unexpected given the high repeatability of this trait (0.76, 0.74, and 0.67) ([43,44,45], respectively) and the ewe replacement strategy based on including in the adult flock only the genetically finest ewe hoggets. In the present study, fleeces became coarser as ewes aged, which is consistent with that previously reported [45,46]. Despite this, wool micron remained within the highest price category (≤18 µm) [6].
Over the study period, decreases in ewe FD were accompanied by increases in GFW. This result is supported by other studies [24,47] that have reported that reductions in FD while increasing GFW can be made by selecting for these traits simultaneously with appropriate weightings. Reducing FD without reducing CFW requires changes in other components of the fleece weight such as, surface area, fiber length, and follicle density [48,49]. In this study, ewes with finer wools were heavier (more surface area) likely due to selection on LW and had shorter fibers, which is consistent with positive genetic and phenotypic correlations between FD and SL in adult ewes [12,50,51]. In addition, fine wool and high CFW are associated with increased follicle density [48] but this trait was not examined in this flock.
Throughout the study period, ewe LW increased by approximately 3 kg, which is consistent with increases in LW in yearling lambs of the same flock [24]. This finding is supported by other authors [43,52] who reported that selection for increased LW at a given age will increase LW at all ages. Previous studies have shown that ewe LW increases with age up to 5 years old and can then either plateau [53] or decrease [54]. In this study, ewe LW increased across all age groups.
Ewe LW is a combination of frame size and BCS [17]. Over the study period, increases in LW at mating were accompanied by decreases in BCS, indicating that ewes became heavier but leaner over time. This loss in BCS is consistent with positive phenotypic and genetic correlations between BCS at mating and FD [12,13,14]. The increased GFW in our study likely contributed to reduced BCS, given the negative phenotypic association between CFW and fat depth [55]. Furthermore, it has been reported that fine wool and high fleece weight together are associated with reduced subcutaneous fat levels [48].
In addition to genetic factors, phenotypic changes in LW and BCS are influenced by reproductive performance and the production environment [9]. In this study, at pre-lambing, both single- and multiple-bearing ewes were heavier than their non-pregnant counterpart, but this relationship was reversed by weaning. This finding is not surprising given the influence of conceptus weight and milk production demands during late pregnancy and lactation, respectively [56,57]. In the current study, lower BCS at weaning in ewes rearing twins than those rearing single lambs is consistent with a higher milk production demand in multiple-rearing ewes [9,14,58]. This result can also be associated with higher internal parasite load in ewes that suckled twins than those that suckled only one lamb [59]. Overall, the average ewe BCS reported exceeded the recommended minimum threshold at mating (BCS 3), during gestation (BCS > 2.5), and at weaning (BCS > 2) [17,60].
It has been well established that ewe BCS influences her reproductive performance [17]. Ewe BCS at mating between 3 and 3.5 units are positively associated with conception rate and fecundity [14]. Over the study period, ewe BCS at mating decreased by approximately 1 unit, although there was a small increase at the end of the study period. This small improvement in ewe BCS is likely associated with improved feeding of the native pasture plus supplement during the summers of 2018 and 2019. During the CRILU period, an average BCS of 3 at mating indicates that 50% of the flock is in a BCS below the optimum [17]. The reduced BCS did not affect TWW (data not shown), which is consistent with earlier findings [14]. The absence of an effect of BCS at mating on TWW is not unexpected given that there are several environmental and management factors that influence lamb live weight at weaning between mating and weaning [14]. In this study, better nutritional status in pregnant and lactating ewes likely attenuated the impact of low BCS on lamb live weight at weaning [28,61]. In addition, it has been reported that ewes inseminated with fresh semen have higher reproductive performance than those covered by frozen semen [62,63]. In this study, the use of different mating methods towards the end of the study period (increased use of fresh semen at the expense of frozen semen) may have confounded the results.
Both fine wool and high CFW are associated with lower reproductive performance [48]. In this study, selection for reduced FD and increased CFW were accompanied by a small positive change in ewe lifetime reproduction. This result is consistent with negligible phenotypic correlations (0.03 and 0.01) between these two wool traits (FD and CFW) and the total number of lambs weaned per ewe [10]. However, a high negative genetic correlation between CFW and the number of lambs weaned per ewe joined has been reported in superfine Merino sheep [10]. As this study suggested, this inconsistency may be associated with the type of trait analyzed (total number of lambs weaned as a single trait across all lambing opportunities vs. number of lambs weaned as repeated records). Furthermore, it has been reported that the negative effects of increased CFW on reproductive performance occur in ewes reared under poor nutrition [18]. In this study, ewes were fed according to their nutrient requirement, which likely attenuated the potential negative effect of selection for increased CFW on reproductive performance. In addition, increased ewe LW in this study likely contributed to increased reproductive performance [51]. Collectively, these results suggest that phenotypic reductions in FD and increases in both GFW and LW can be obtained without compromising phenotypic ewe lifetime reproduction.
In the Uruguayan wool industry, the highest economic reward from Merino sheep is driven by wool income [64]. During the FMP period (1999–2010), estimated gross income per ewe lifetime (across four lambing opportunities) increased by approximately 26%, with little apparent change towards the end of the study period. This result is not unexpected given that over the last decade, the greatest price differentials (+50%) have been observed between the 19- and 17-micron categories [35], although 16-micron wool has the highest value with a maximum of 15 USD/kg greasy [65]. During the CRILU period, there was only a small effect of finer wool on gross income due to this trait changing little over time. However, gross income would have increased if one-year-old lambs were included in the analysis given that the finest wool (14.6–15.6 µm) was produced by yearling lambs [24]. In addition, a small positive change in net reproduction performance by the end of the study period would also positively impact on gross income but, this scenario was not evaluated in this paper. Overall, this study indicates that reducing FD from 19 to 16 µm would increase the gross income per ewe by approximately 32%.
Since 1999, more than 18,500 frozen semen doses and 900 rams of the nucleus flock have been disseminated to commercial farmers throughout Uruguay [66]. At the same time, adult animal FD of commercial farmers who have utilized rams or semen from the nucleus flock, decreased from 21 to 18.5 µm [36,37]. This reduction in FD represented an increase of at least 20% in estimated gross income per ewe lifetime. In commercial flocks, estimated gross income per ewe lifetime could increase 18% (from 255 to 299 USD) if ewe FD was reduced from 18.5 to 16 microns.
5. Conclusions
This study demonstrated that selection programs (FMP and CRILU) applied between 1999 and 2020 in Uruguay resulted in improvements in economically relevant wool traits in mixed-age ewes. Ewe FD decreased from 19 to 16 μm and GFW increased by approximately 0.2 kg. These favorable phenotypic trends in wool traits were accompanied by an increase of approximately 3 kg in LW at mating but a decrease in BCS at mating, with a small positive change in net reproduction performance. Increased estimated farmer gross income due to finer wool was obtained without compromising lifetime reproduction. However, farmers may wish to consider the potential impacts of increased body size and reduced fatness in adult ewes, especially if the ewes are raised under extensive conditions, facing continuous internal parasite challenges and periods of nutritional deficit. Further research, to evaluate genetic trends in the nucleus flock and genomic associations between wool, body, and reproductive traits is warranted to assist with the optimization of future selection programs in Uruguay.
Author Contributions
Conceptualization, H.T.B., P.R.K., I.D.B., G.C., F.M. and Z.R.; data collection, F.M., I.D.B. and Z.R.; formal analysis and supervision, H.T.B. and P.R.K.; analysis, results interpretation, and preparation of the manuscript, Z.R.; writing—review and editing, H.T.B., P.R.K., I.D.B., G.C. and F.M. All authors have read and agreed to the published version of the manuscript.
Funding
This research was funded by the National Institute for Agriculture Research (INIA) and Regional Consortium for Innovation in Ultrafine Wool (CRILU). This study was supported by two Ph.D. scholarships (from the National Agency for Investigation and Innovation of Uruguay, ANII, and from Massey University, New Zealand) awarded to Zully Ramos.
Institutional Review Board Statement
The study was approved by INIA Animal Ethics Committee (INIA_2018.2).
Informed Consent Statement
Not applicable.
Data Availability Statement
The data presented in this study are available within the article.
Acknowledgments
The authors gratefully acknowledge contributions from all staff of Glencoe Experimental Unit, INIA Tacuarembó, SUL, SCMAU, INIA, and CRILU. The first author acknowledges the financial support received through Massey University, New Zealand, and the National Agency for Investigation and Innovation of Uruguay, ANII, to undertake her Ph.D.
Conflicts of Interest
The authors declare no conflict of interest.
References
- Cardellino, R.; Wilcox, C.; Trifoglio, J.L. El Mercado de la Lana Y Su Efecto en la Producción Ovina Uruguaya; El País Agropecuario: Montevideo, Uruguay, 2018; pp. 22–24. Available online: http://actualidadagropecuaria.com.uy (accessed on 20 May 2020).
- Cardellino, R. La Producción de Lanas Merino Superfinas en El Uruguay; un Excelente Proyecto con Resultados Positivos y Medibles Durante las Últimas dos Décadas; DELTA Consultores en Producción Animal: Montevideo, Uruguay, 2020; pp. 1–7. Available online: http://www.camaramercantil.com.uy (accessed on 20 February 2021).
- DIEA-Dirección de Estadísticas Agropecuarias. Anuario Estadístico Agropecuario; Ministerio de Ganadería, Agricultura y Pesca: Montevideo, Uruguay, 2020; p. 58. Available online: https://mgap.gub.uy/DIEA/Anuarios/Anuario2020 (accessed on 20 February 2021).
- INAC-Instituto Nacional de Carnes. Serie Anual Stock Bovino Y Ovino; Montevideo, Uruguay, 2020; Available online: https://www.inac.uy (accessed on 24 February 2021).
- Rowe, J.B. The Australian sheep industry–undergoing transformation. Anim. Prod. Sci. 2010, 50, 991–997. [Google Scholar] [CrossRef]
- Pattinson, R.; Wilcox, C.H.; Williams, S.; Curtis, K. Wool Industry and Future Opportunities; Department of Primary Industry: Perth, Australia, 2015; pp. 1–69. Available online: https://www.dpi.nsw.gov.au (accessed on 20 May 2020).
- Wei, C.; Luo, H.; Zhao, B.; Tian, K.; Huang, X.; Wang, Y.; Fu, X.; Tian, Y.; Di, J.; Xu, X.; et al. The Effect of Integrating Genomic Information into Genetic Evaluations of Chinese Merino Sheep. Animals 2020, 10, 569. [Google Scholar] [CrossRef] [Green Version]
- Huisman, A.E.; Brown, D.J.; Ball, A.J.; Graser, H.U. Genetic parameters for bodyweight, wool, and disease resistance and reproduction traits in Merino sheep. 1. Description of traits, model comparison, variance components and their ratios. Aust. J. Exp. Agric. 2008, 48, 1177–1185. [Google Scholar] [CrossRef]
- Walkom, S.F.; Brien, F.D.; Hebart, M.L.; Mortimer, S.I.; Pitchford, W.S. Season and reproductive status rather than genetics factors influence change in ewe weight and fat over time. 3. Analysis of Merino ewes. Anim. Prod. Sci. 2014, 54, 821–830. [Google Scholar] [CrossRef]
- Dominik, S.; Swan, A.A. Genetic and phenotypic parameters for reproduction, production and bodyweight traits in Australian fine-wool Merino sheep. Anim. Prod. Sci. 2018, 58, 207–212. [Google Scholar] [CrossRef]
- Walkom, S.F.; Thompson, A.N.; Bowen, E.; Brown, D.J. Weaner survival is heritable in Australian Merinos and current breeding objectives are potentially leading to a decline in survival. Anim. Prod. Sci. 2019, 59, 35–47. [Google Scholar] [CrossRef]
- Walkom, S.F.; Brown, D.J. Genetic evaluation of adult ewe bodyweight and condition: Relationship with lamb growth, reproduction, carcass and wool production. Anim. Prod. Sci. 2017, 57, 20–32. [Google Scholar] [CrossRef]
- Tait, I.M.; Kenyon, P.R.; Garrick, D.J.; Pleasants, A.B.; Hickson, R.E. Genetic and phenotypic correlations between production traits and adult body condition scores in New Zealand Merino ewes. N. Z. J. Anim. Sci. Prod. 2018, 78, 71–75. [Google Scholar]
- Tait, I.M. Genetic Parameters of Body Condition Score (BCS) and Effects of BCS and BCS Change on Ewe Performance. Ph.D. Thesis, Massey University, Palmerston North, New Zealand, 2020. [Google Scholar]
- Kleemann, D.O.; Walker, S.K. Fertility in South Australian commercial Merino flocks: Relationships between reproductive traits and environmental cues. Theriogenology 2005, 63, 2416–2433. [Google Scholar] [CrossRef] [PubMed]
- Yilmaz, M.; Altin, T.; Karaca, O.; Cemal, I.; Bardakcioglu, H.E.; Yilmaz, O.; Taskin, T. Effect of body condition score at mating on the reproductive performance of Kivircik sheep under an extensive production system. Trop. Anim. Health Prod. 2011, 43, 1555–1560. [Google Scholar] [CrossRef]
- Kenyon, P.R.; Maloney, S.K.; Blache, D. Review of sheep body condition score in relation to production characteristics. N. Z. J. Agric. Res. 2014, 57, 38–64. [Google Scholar] [CrossRef]
- Masters, D.G.; Ferguson, M.B. A review of the physiological changes associated with genetic improvement in clean fleece production. Small. Rumin. Res. 2019, 170, 62–73. [Google Scholar] [CrossRef]
- Ferguson, M.B.; Adams, N.R.; Robertson, I.R.D. Implications of selection for meat and wool traits on maternal performance in Merinos. In Proceedings of the Association for the Advancement of Animal Breeding and Genetics, Armidale, New South Wales, Australia, 23–26 September 2007; pp. 195–198. [Google Scholar]
- Greeff, J. Genetic trade-offs between lamb and wool production in Merino breeding programs. Ovine Obs. 2020. Available online: https://www.agric.wa.gov.au (accessed on 1 March 2021).
- Piper, L.R.; Swan, A.A.; Brewer, H.G. Is increased fleece weight associated with reduced reproduction rate? Results from long term multi-trait selection flocks. In Proceedings of the Association for the Advancement of Animal Breeding and Genetics, Armidale, New South Wales, Australia, 23–26 September 2007; pp. 103–106. [Google Scholar]
- Piper, L.R.; Swan, A.A.; Brewer, H.G. Effects on lifetime reproductive performance of phenotypic selection for fleece weight, fiber diameter, body weight and related selection indexes. In Proceedings of the Association for the Advancement of Animal Breeding and Genetics, Barossa Valley, South Australia, 28 September–1 October 2009; pp. 374–377. [Google Scholar]
- Piper, L.R.; Swan, A.A.; Brewer, H.G. Current flock effects on lifetime reproductive performance of simulated selection at hogget age in Merino sheep for fleece weight, fiber diameter, body weight and relevant selection indexes. III. High rainfall region results. In Proceedings of the Association for the Advancement in Animal Breeding Genetics, Napier, New Zealand, 20–23 October 2013; pp. 102–105. [Google Scholar]
- Ramos, Z.; Blair, H.T.; De Barbieri, I.; Ciappesoni, G.; Montossi, F.; Kenyon, P.R. Phenotypic Responses to Selection for Ultrafine Wool in Uruguayan Yearling Lambs. Agriculture 2021, 11, 179. [Google Scholar] [CrossRef]
- Berretta, E. Principales características climáticas y edáficas de la región de basalto en Uruguay. In Seminario de Actualización en Tecnologías Para Basalto; Berretta, E., Ed.; Serie Técnica INIA 102; Unidad de Comunicación y Transferencia de Tecnología: Montevideo, Uruguay, 1998; pp. 3–10. [Google Scholar]
- Información del CLIMA INIA Tacuarembó. Available online: http://www.inia.uy/gras/Clima/Banco-datos-agroclimatico (accessed on 19 July 2021).
- Bonino, J.; Casaretto, A. Principales patologías de los actuales sistemas de producción ovina del Uruguay. Una puesta al día. In Proceedings of the XL Jornadas Uruguayas de Buiatría, Paysandú, Uruguay, 14–16 June 2012; pp. 19–29. [Google Scholar]
- Ramos, Z.; Montossi, F. Alternativas tecnológicas para aumentar la supervivencia de corderos: Control Integrado de Parición en Ovinos. Rev. INIA 2014, 38, 11–15. [Google Scholar]
- Berretta, E.; Risso, D.; Montossi, F.; Pigurina, G. Campos in Uruguay. In Grassland Ecophysiology and Grazing Ecology; Lemaire, G., Hodgson, J., de Moraes, A., Nabinger, C., Carvalho, P.C., Eds.; CABI Publishing: Wallingford, UK, 2000; pp. 377–394. [Google Scholar]
- Shearing Training. Available online: http://www.shearingworld.com/training.htm (accessed on 1 July 2021).
- Jefferies, B.C. Condition scoring and its use in management. Tasm. J. Agric. 1961, 32, 19–21. [Google Scholar]
- Ramos, Z.; De Barbieri, I.; Van Lier, E.; Montossi, F. Body and wool growth of lambs grazing on native pastures can be improved with energy and protein supplementation. Small Rumin. Res. 2019, 171, 92–98. [Google Scholar] [CrossRef]
- Snyman, M.A.; Olivier, J.J.; Erasmus, G.J.; Van Wyk, J.B. Genetic parameter estimates for total weight of lamb weaned in Afrino and Merino sheep. Livest. Prod. Sci. 1997, 48, 111–116. [Google Scholar] [CrossRef]
- Duguma, G.; Schoeman, S.J.; Cloete, S.W.P.; Jordaan, G.F. Genetic and environmental parameters for ewe productivity in Merinos. S. Afr. J. Anim. Sci. 2002, 32, 154–159. [Google Scholar] [CrossRef]
- Cámara Mercantil de productos del País. Mercado Lanero; Montevideo, Uruguay, 2020; Available online: http://www.camaramercantil.com.uy/softis/documentos/dl/lanas/ (accessed on 1 April 2021).
- Montossi, F.; De Barbieri, I.; Ciappesoni, G.; Ravagnolo, O.; De Mattos, D.; Pérez Jones, J.; Grattarola, M.; Mederos, A.; Soares de Lima, M. Núcleo fundacional de Merino fino y superfino de la unidad experimental “GLENCOE”–INIA Uruguay: Una experiencia innovadora de mejoramiento genético asociativo y participativo. Agrociencia 2005, 9, 609–616. [Google Scholar]
- Pérez, V.; Bonner, M.; Montossi, F.; Ramos, Z.; Sacchero, D.; De Barbieri, I. Estudio de características vinculadas al procesamiento textil en lanas del Consorcio Regional de Innovación en Lanas Ultrafinas. Rev. Lab. Tecnológico Urug. 2017, 13, 58–65. [Google Scholar] [CrossRef]
- Swan, A.A.; Brown, D.J. The impact of measuring adult fleece traits with genomic selection on economic gain in Merino selection indexes. In Proceedings of the Association for the Advancement of Animal Breeding and Genetics, Napier, New Zealand, 20–23 October 2013; pp. 233–236. [Google Scholar]
- Brown, D.J.; Swan, A.A.; Gill, J.S. Genetic correlations across ages for greasy fleece weight and fiber diameter in Merino sheep. In Proceedings of the Association for the Advancement of Animal Breeding and Genetics, Napier, New Zealand, 20–23 October 2013; pp. 103–110. [Google Scholar]
- McGregor, B.A.; Butler, K.L. Coarser wool is not a necessary consequence of sheep aging: Allometric relationship between fiber diameter and fleece-free liveweight of Saxon Merino sheep. Animal 2016, 10, 2051–2060. [Google Scholar] [CrossRef] [Green Version]
- Shahinfar, S.; Kahn, L. Machine learning approaches for early prediction of adult wool growth and quality in Australian Merino sheep. Comput. Electron. Agric. 2018, 148, 72–81. [Google Scholar] [CrossRef]
- Nolan, E. The economic value of wool attributes phase 2. In A Report Prepared for Australian Wool Innovation; University of Sydney: Sydney, Australia, 2014; Available online: https://www.wool.com/globalassets/start/about-awi/publications/woolattributes.pdf (accessed on 19 September 2016).
- Manson, D.A.; Gallagher, J.R.; Hynd, P.I.; Pitchford, W.S. Repeatability of performance ranking and wool production characteristics of Merino ewes in a semiarid farming environment. In Proceedings of the Association for the Advancement of Animal Breeding and Genetics, Madurah, Australia, 4–7 July 1999; pp. 94–97. [Google Scholar]
- Murray, W.K.; Mortimer, S.I.; Atkins, K.D.; Taylor, P.J.; Anderson, S.L. Style and production changes across ages in Merino sheep. In Proceedings of the Association for the Advancement of Animal Breeding and Genetics, Queenstown, New Zealand, 30 July 2001; pp. 493–496. [Google Scholar]
- Hatcher, S.; Atkins, K.D.; Thornberry, K.J. Age changes in wool traits of Merino sheep in western NSW. In Proceedings of the Association for the Advancement of Animal Breeding and Genetics, Queensland, Australia, 25–28 September 2005; pp. 314–317. [Google Scholar]
- Cloete, S.W.P.; Gilmour, A.R.; Olivier, J.J.; Van Wyk, J.B. Age trends in economically important traits of Merino ewes subjected to 10 years of divergent selection for multiple rearing ability. S. Afr. J. Anim. Sci. 2003, 33, 43–51. [Google Scholar] [CrossRef] [Green Version]
- Taylor, P.; Bird-Gardiner, T.; Mortimer, S.; Atkins, K. Selection Indexes Work for All Merino Strains and Breeding Objectives; Department of Primary Industry: Perth, Australia, 2007. Available online: https://www.dpi.nsw.gov.au (accessed on 1 October 2020).
- Adams, N.R.; Cronjé, P.B. A review of the biology linking fiber diameter with fleece weight, liveweight, and reproduction in Merino sheep. Aust. J. Agric. Res. 2003, 54, 1–10. [Google Scholar] [CrossRef]
- Zhang, L.; Sun, F.; Jin, H.; Dalrymple, B.P.; Cao, Y.; Wei, T.; Vuocolo, T.; Zhang, M.; Piao, Q.; Ingham, A.B. A comparison of transcriptomic patterns measured in the skin of Chinese fine and coarse wool sheep breeds. Sci. Rep. 2017, 7, 1–12. [Google Scholar] [CrossRef] [PubMed]
- Huisman, A.E.; Brown, D.J. Genetic parameters for bodyweight, wool, and disease resistance and reproduction traits in Merino sheep. 4. Genetic relationships between and within wool traits. Anim. Prod. Sci. 2009, 49, 289–296. [Google Scholar] [CrossRef]
- Safari, E.; Fogarty, N.M.; Gilmour, A.R. A review of genetic parameter estimates for wool, growth, meat and reproduction traits in sheep. Livest. Prod. Sci. 2005, 92, 271–289. [Google Scholar] [CrossRef]
- Huisman, A.E.; Brown, D.J. Genetic parameters for bodyweight, wool, and disease resistance and reproduction traits in Merino sheep. 2. Genetic relationships between bodyweight traits and other traits. Aust. J. Exp. Agric. 2008, 48, 1186–1193. [Google Scholar] [CrossRef]
- Semakula, J.; Corner-Thomas, R.A.; Morris, S.T.; Blair, H.T.; Kenyon, P.R. The Effect of Age, Stage of the Annual Production Cycle and Pregnancy-Rank on the Relationship between Liveweight and Body Condition Score in Extensively Managed Romney Ewes. Animals 2020, 10, 784. [Google Scholar] [CrossRef]
- Wuliji, T.; Dodds, K.G. Effect of fleece weight selection on reproduction, live weight and wool characteristics in mature Romney ewes. Small Rumin. Res. 2011, 97, 55–59. [Google Scholar] [CrossRef]
- Refshauge, G.; Hatcher, S.; Hinch, G.N.; Hopkins, D.L.; Nielsen, S. Fat depth, muscle depth, fat score and wool growth in Merino dams selected for high or low clean fleece weight and bodyweight. Anim. Prod. Sci. 2010, 50, 479–484. [Google Scholar] [CrossRef]
- Lee, G.J.; Atkins, K.D. Consequences of reproduction on the liveweight, fat depth, wool growth, and intake of grazing Merino ewes in the short and long term. Aust. J. Exp. Agric. 1995, 35, 153–159. [Google Scholar] [CrossRef]
- Geenty, K.G. Lactation and lamb growth. In International Sheep and Wool Handbook; Cottle, D.J., Ed.; Nottingham University Press: Nottingham, UK, 2010; pp. 259–276. [Google Scholar]
- Hatfield, P.G.; Snowder, G.D.; Head, W.A., Jr.; Glimp, H.A.; Stobart, R.H.; Besser, T. Production by ewes rearing single or twin lambs: Effects of dietary crude protein percentage and supplemental zinc methionine. J. Anim. Sci. 1995, 73, 1227–1238. [Google Scholar] [CrossRef]
- Notter, D.R.; Burke, J.M.; Miller, J.E.; Morgan, J.L. Factors affecting susceptibility to gastrointestinal nematode parasites in periparturient Katahdin ewes and their lambs. In Proceedings of the XLI reunión de la asociación Mexicana para la producción animal y seguridad alimentaria AC (AMPA) and VII reunión nacional de sistemas agro y silvopastoriles, Mérida, Yucatán, México, 2–4 July 2014; pp. 19–27. [Google Scholar]
- Hocking Edwards, J.E.; Copping, K.J.; Thompson, A.N. Managing the nutrition of twin-bearing ewes during pregnancy using Lifetime wool recommendations increases production of twin lambs. Anim. Prod. Sci. 2011, 51, 813–820. [Google Scholar] [CrossRef]
- Thompson, A.N.; Ferguson, M.B.; Campbell, A.J.D.; Gordon, D.J.; Kearney, G.A.; Oldham, C.M.; Paganoni, B.L. Improving the nutrition of Merino ewes during pregnancy and lactation increases weaning weight and survival of progeny but does not affect their mature size. Anim. Prod. Sci. 2011, 51, 784–793. [Google Scholar] [CrossRef] [Green Version]
- Hill, J.R.; Thompson, J.A.; Perkins, N.R. Factors affecting pregnancy rates following laparoscopic insemination of 28,447 Merino ewes under commercial conditions: A survey. Theriogenology 1998, 49, 697–709. [Google Scholar] [CrossRef]
- Langford, G.A.; Marcus, G.J.; Hackett, A.J.; Ainsworth, L.; Wolynetz, M.S.; Peters, H.F. A comparison of fresh and frozen semen in the insemination of confined sheep. Can. J. Anim. Sci. 1979, 59, 685–691. [Google Scholar] [CrossRef]
- Chalkling, D.; Dutra, D.; Platero, P.; Ramos, Z. Una mirada a Los Predios CRILU-FPTA. Décima Jornada de Distribución de Reproductores CRILU: Tacuarembó, Uruguay. Available online: http://www.inia.uy (accessed on 1 March 2021).
- Productor Sanducero Vendió Lana en El Lomo Con Finura 2017 de 16,5 Micras a U$S 15 El Kilo. Available online: www.eltelegrafo.com (accessed on 20 April 2021).
- De Barbieri, I.; Ciappesoni, G.; Ramos, Z.; Mederos, A.; Pérez Jones, J.; Donagaray, F.; Fros, A.; Dutra, F.; Grattarola, M.; Gimeno, D.; et al. Innovaciones institucionales en el complejo textil-lanero del Uruguay: Los casos del Proyecto Merino Fino y el Consorcio Regional de Innovación de Lanas Ultrafinas. In Proceedings of the Congreso de la Asociación Latinoamericana de Producción Animal, Puerto Varas, Chile, 13 November 2015; p. 764. [Google Scholar]


Publisher’s Note: MDPI stays neutral with regard to jurisdictional claims in published maps and institutional affiliations. |
© 2021 by the authors. Licensee MDPI, Basel, Switzerland. This article is an open access article distributed under the terms and conditions of the Creative Commons Attribution (CC BY) license (https://creativecommons.org/licenses/by/4.0/).