Article

Riparian Zone Nitrogen Management through the Development of the Riparian Ecosystem Management Model (REMM) in a Formerly Glaciated Watershed of the US Northeast

1
Department of Geosciences, University of Rhode Island, Kingston, RI 02881, USA
2
Department of Natural Resource Sciences, University of Rhode Island, Kingston, RI 02881, USA
3
Sustainable Resources Management Department, The State University of New York College of Environmental Science and Forestry, Syracuse, NY 13210, USA
*
Authors to whom correspondence should be addressed.
Agriculture 2021, 11(8), 743; https://doi.org/10.3390/agriculture11080743
Submission received: 11 June 2021 / Revised: 30 July 2021 / Accepted: 2 August 2021 / Published: 5 August 2021

Abstract

:
The Riparian Ecosystem Management Model (REMM) was developed, calibrated and validated for both hydrologic and water quality data for eight riparian buffers located in a formerly glaciated watershed (upper Pawcatuck River Watershed, Rhode Island) of the US Northeast. The Annualized AGricultural Non-Point Source model (AnnAGNPS) was used to predict the runoff and sediment loading to the riparian buffer. Overall, results showed REMM simulated water table depths (WTDs) and groundwater NO3-N concentrations at the stream edge (Zone 1) in good agreement with measured values. The model evaluation statistics showed that, hydrologically REMM performed better for site 1, site 4, and site 8 among the eight buffers, whereas REMM simulated better groundwater NO3-N concentrations in the case of site 1, site 5, and site 7 when compared to the other five sites. The interquartile range of mean absolute error for WTDs was 3.5 cm for both the calibration and validation periods. In the case of NO3-N concentrations prediction, the interquartile range of the root mean square error was 0.25 mg/L and 0.69 mg/L for the calibration and validation periods, respectively, whereas the interquartile range of d for NO3-N concentrations was 0.20 and 0.48 for the calibration and validation period, respectively. Moreover, REMM estimation of % N-removal from Zone 3 to Zone 1 was 19.7%, and 19.8% of N against actual measured 19.1%, and 26.6% of N at site 7 and site 8, respectively. The sensitivity analyses showed that changes in the volumetric water content between field capacity and saturation (soil porosity) were driving water table and denitrification.

1. Introduction

Riparian zones occur at the interface of terrestrial and aquatic components of the landscape. They regularly receive and process large amounts of excess nitrogen (N), draining out of agricultural fields towards open water bodies. They are often characterized as “filters” or “buffers” and are vital elements in watershed management schemes for water quality maintenance and stream ecosystem habitat protection [1,2,3].
Agriculture (cropland, pasture, managed forest) is an important component of many watersheds of the USA Northeast where N losses to major estuaries is of substantial concern. Decades of research on riparian zone hydrology and biogeochemistry has shown that riparian zones can serve as best management practices (BMPs) to mitigate the impact of agriculture (excessive leaching of nutrients, mostly N) on the quality of our waters [4,5,6]. Nevertheless, the buffering capacity of riparian zones (mostly for N) varies enormously due to the hydrogeomorphic setting such as topography, depth to water table, soil type, and surficial geology of the riparian zone [7,8,9,10,11,12]. Upland land use/land cover affects both the water quantity and quality of the water entering the riparian zone. Hydrogeomorphic setting can influence the flow-paths and hydrologic connections between upland sources of nitrate and the biologically active (i.e., upper 1–2 m) portions of the riparian zone [7,13,14]. Thus, a number of key attributes related to location are critical in determining the potential impact of a riparian zone on water. These attributes are incorporated in models such as the Riparian Ecosystem Management Model (REMM) [15,16]. Given the interest in expanding riparian zone BMPs, there is a critical need to advance our understanding of riparian functions at the site scale. Site-specific models can improve riparian zone management decisions that seek to place, restore and protect riparian zones more effectively.
Despite the acknowledged value of riparian zones in mitigating N pollution, only a limited number of numerical models or landscape-based approaches have been developed that can improve the use and management of riparian zones to achieve water quality improvements in physiographic settings associated with landscapes that were formed by glaciation. Several past studies include: statistical models to develop functional relationships between riparian characteristics and N removal [17,18,19]; conceptual models to generalize riparian zone functions [7,14]; landscape-based approaches for the estimation of the riparian width required for achieving a 90% nitrate removal [20]; spatially distributed model for estimating nitrogen removal [21]; 3-D high-resolution reactive transport modeling to investigate the spatial and temporal variability of nitrogen fluxes in the riparian zone [22]; GIS-based tools to assess and target riparian buffers placements [23] or identify the connection between the upslope area runoff and the storage capacity of riparian buffer; overall potential estimates of riparian zones for N removal at the landscape-scale [6,24,25]; study of long term nitrate removal in stream riparian zones [26,27,28].
Added to these approaches, a process-based model, REMM has been used to simulate hydrology, carbon and nutrient dynamics, and plant growth in riparian zones [15,16]. REMM has been used to simulate managed riparian ecosystems in a number of settings in USA including Chesapeake Bay Watershed [29]; Delaware [30]; Mississippi [31]; North Carolina [32,33,34]; Georgia [12,35,36]; California [37]; and Puerto Rico [38]. Globally, SWAT-REMM integration has been used in a glaciated landscape in New Brunswick, Canada by [39] to examine the effect of different levels of dividing up the watershed into sub-watersheds, for SWAT on the performance of the model. Reference [40] used REMM in China for the evaluation of riparian zones as BMP. However, REMM has not yet been integrated with the AnnAGNPS model and applied to evaluate management at the field scale in the glaciated settings of the Northeast region, even though the agricultural lands are linked to excessive nutrient pollution and riparian zones are widely used in these regions to mitigate N losses to streams. Therefore, our focus on field scale analyses with AnnGNPS provides more insight into site scale behavior.
Although REMM offers users the potential for quantitative assessments of riparian functions at the site scale, it requires a considerable amount of site-specific information to parameterize and run, including information on water and nutrient flux from source areas that contribute to the riparian zone. The absence of site specific data frequently results in users relying on default parameters. REMM simulations are also not bounded by maximum or minimum values, which can lead to unrealistic simulation results if the model is poorly parameterized or not validated adequately with empirical data. Therefore, we suggest there exists a critical need to determine the usability of REMM in glaciated settings of the USA Northeast that is informed by (1) field data to offer an independent way of generalizing riparian function in these regions; (2) site-specific estimates of water flux and nutrient loading from uplands to the riparian zones.
The goals of this field scale study were to test the ability of the REMM model in formerly glaciated setting of Rhode Island (RI), USA for riparian zone nitrate dynamics. Specifically, this modeling study demonstrates these aspects via evaluation of the REMM model’s ability to simulate the basic hydrologic (water table depths or WTDs) and water quality (groundwater nitrate (NO3-N) concentrations) parameters by using site-specific field data. This process involved (i) REMM model set-up, including site-specific inputs from uplands to a number of monitored riparian sites in RI, (ii) improvements to the model’s capacity for water table depth and groundwater nitrate concentration simulation through calibration of the developed model by means of comparing model outputs with field data collected from eight buffer sites in RI, (iii) validation of model’s output with the improved calibrated parameters, (iv) conduct a parameter sensitivity analysis. Ultimately, this approach will facilitate the use of this model in this region and improve its functionality with respect to nitrogen transformations and flux.

2. Materials and Methods

2.1. Site Description

Our study focused on eight riparian sites from the state of RI, USA. All the sites are located in upper Pawcatuck River Watershed, Washington County, set in the New England Hydrologic Region of southern RI (41°32′30″ N, 71°35′ W) (Figure 1) and all were monitored for hydrology and water quality. The area of this watershed is about 258 km2. It consists mainly of forests (above 65% of the total watershed) and agricultural fields (about 32%). The soil parent materials in the watershed are comprised mostly of glacial till, glacial outwash, and organic and alluvial deposit [13]. Agricultural lands (mostly turf farms) are predominately located on loess soils over glacial outwash. Forested settings are usually on till. The elevation of the watershed ranges from 16 m (shoreline) to 144 m (gently rolling hills inland). It has a humid continental climate, with warm summers and cold winters. The temperature in the watershed ranges from a 30-year (1982–2011) mean of 20.8 °C in summer to a mean of −0.4 °C in winter (PRISM Climate Group, accessed on 21 March 2019). The 30 years (1982–2011) average annual precipitation is approximately 1290 mm, about 50.8% of which occurs during the spring and the fall months. The 14 years (2000–2013) average annual snowfall was 79 mm.
All sites were forested riparian wetlands dominated by red maple (Acer rubrum L.). Half the sites were located on first or second streams, one site was located along a pond, two sites were on a 4th order stream and one riparian site bordered an intermittent stream. The upland land use at seven of the sites was for commercial turf operations and only one site had forested uplands. Irrigation was routinely applied on a number of turf farms. Details on the soils, slope and buffer dimensions are provided in Table 1 and Table 2.

2.2. Description of The REMM Model

REMM is a field-scale process-based, two dimensional, daily time-step model that simulates interactions between hydrology, nutrient dynamics, sediment transport, and vegetation growth. REMM computes the loading of water, sediments, carbon, and nutrients coming from the upland into the riparian buffer. The model was designed such that water and total N are transported from upland to field edge (Zone 3), field edge to mid-buffer (Zone 2), mid-buffer to stream edge (Zone 1), and ultimately from stream edge to open water body by means of surface runoff, seep flow, and subsurface flow [15,16].
REMM file version 0.1.1.46 (United States Department of Agriculture (USDA)-Agricultural Research Service (ARS)) was used for all simulations. A broad description of the REMM model is available in several publications, including [12,15,16,35]. Briefly, REMM is a computer simulation model of riparian forest buffer systems. The structure of REMM is consistent with the three zone riparian system as mentioned in [4]. REMM was originally field tested using a five-year hydrologic and nutrient dataset collected from an experimental riparian buffer site in Tifton, Georgia [12,35]. We used this model, and prepared the model set-up for each riparian site, parameterized, calibrated and validated for both hydrologic and nutrient simulation.
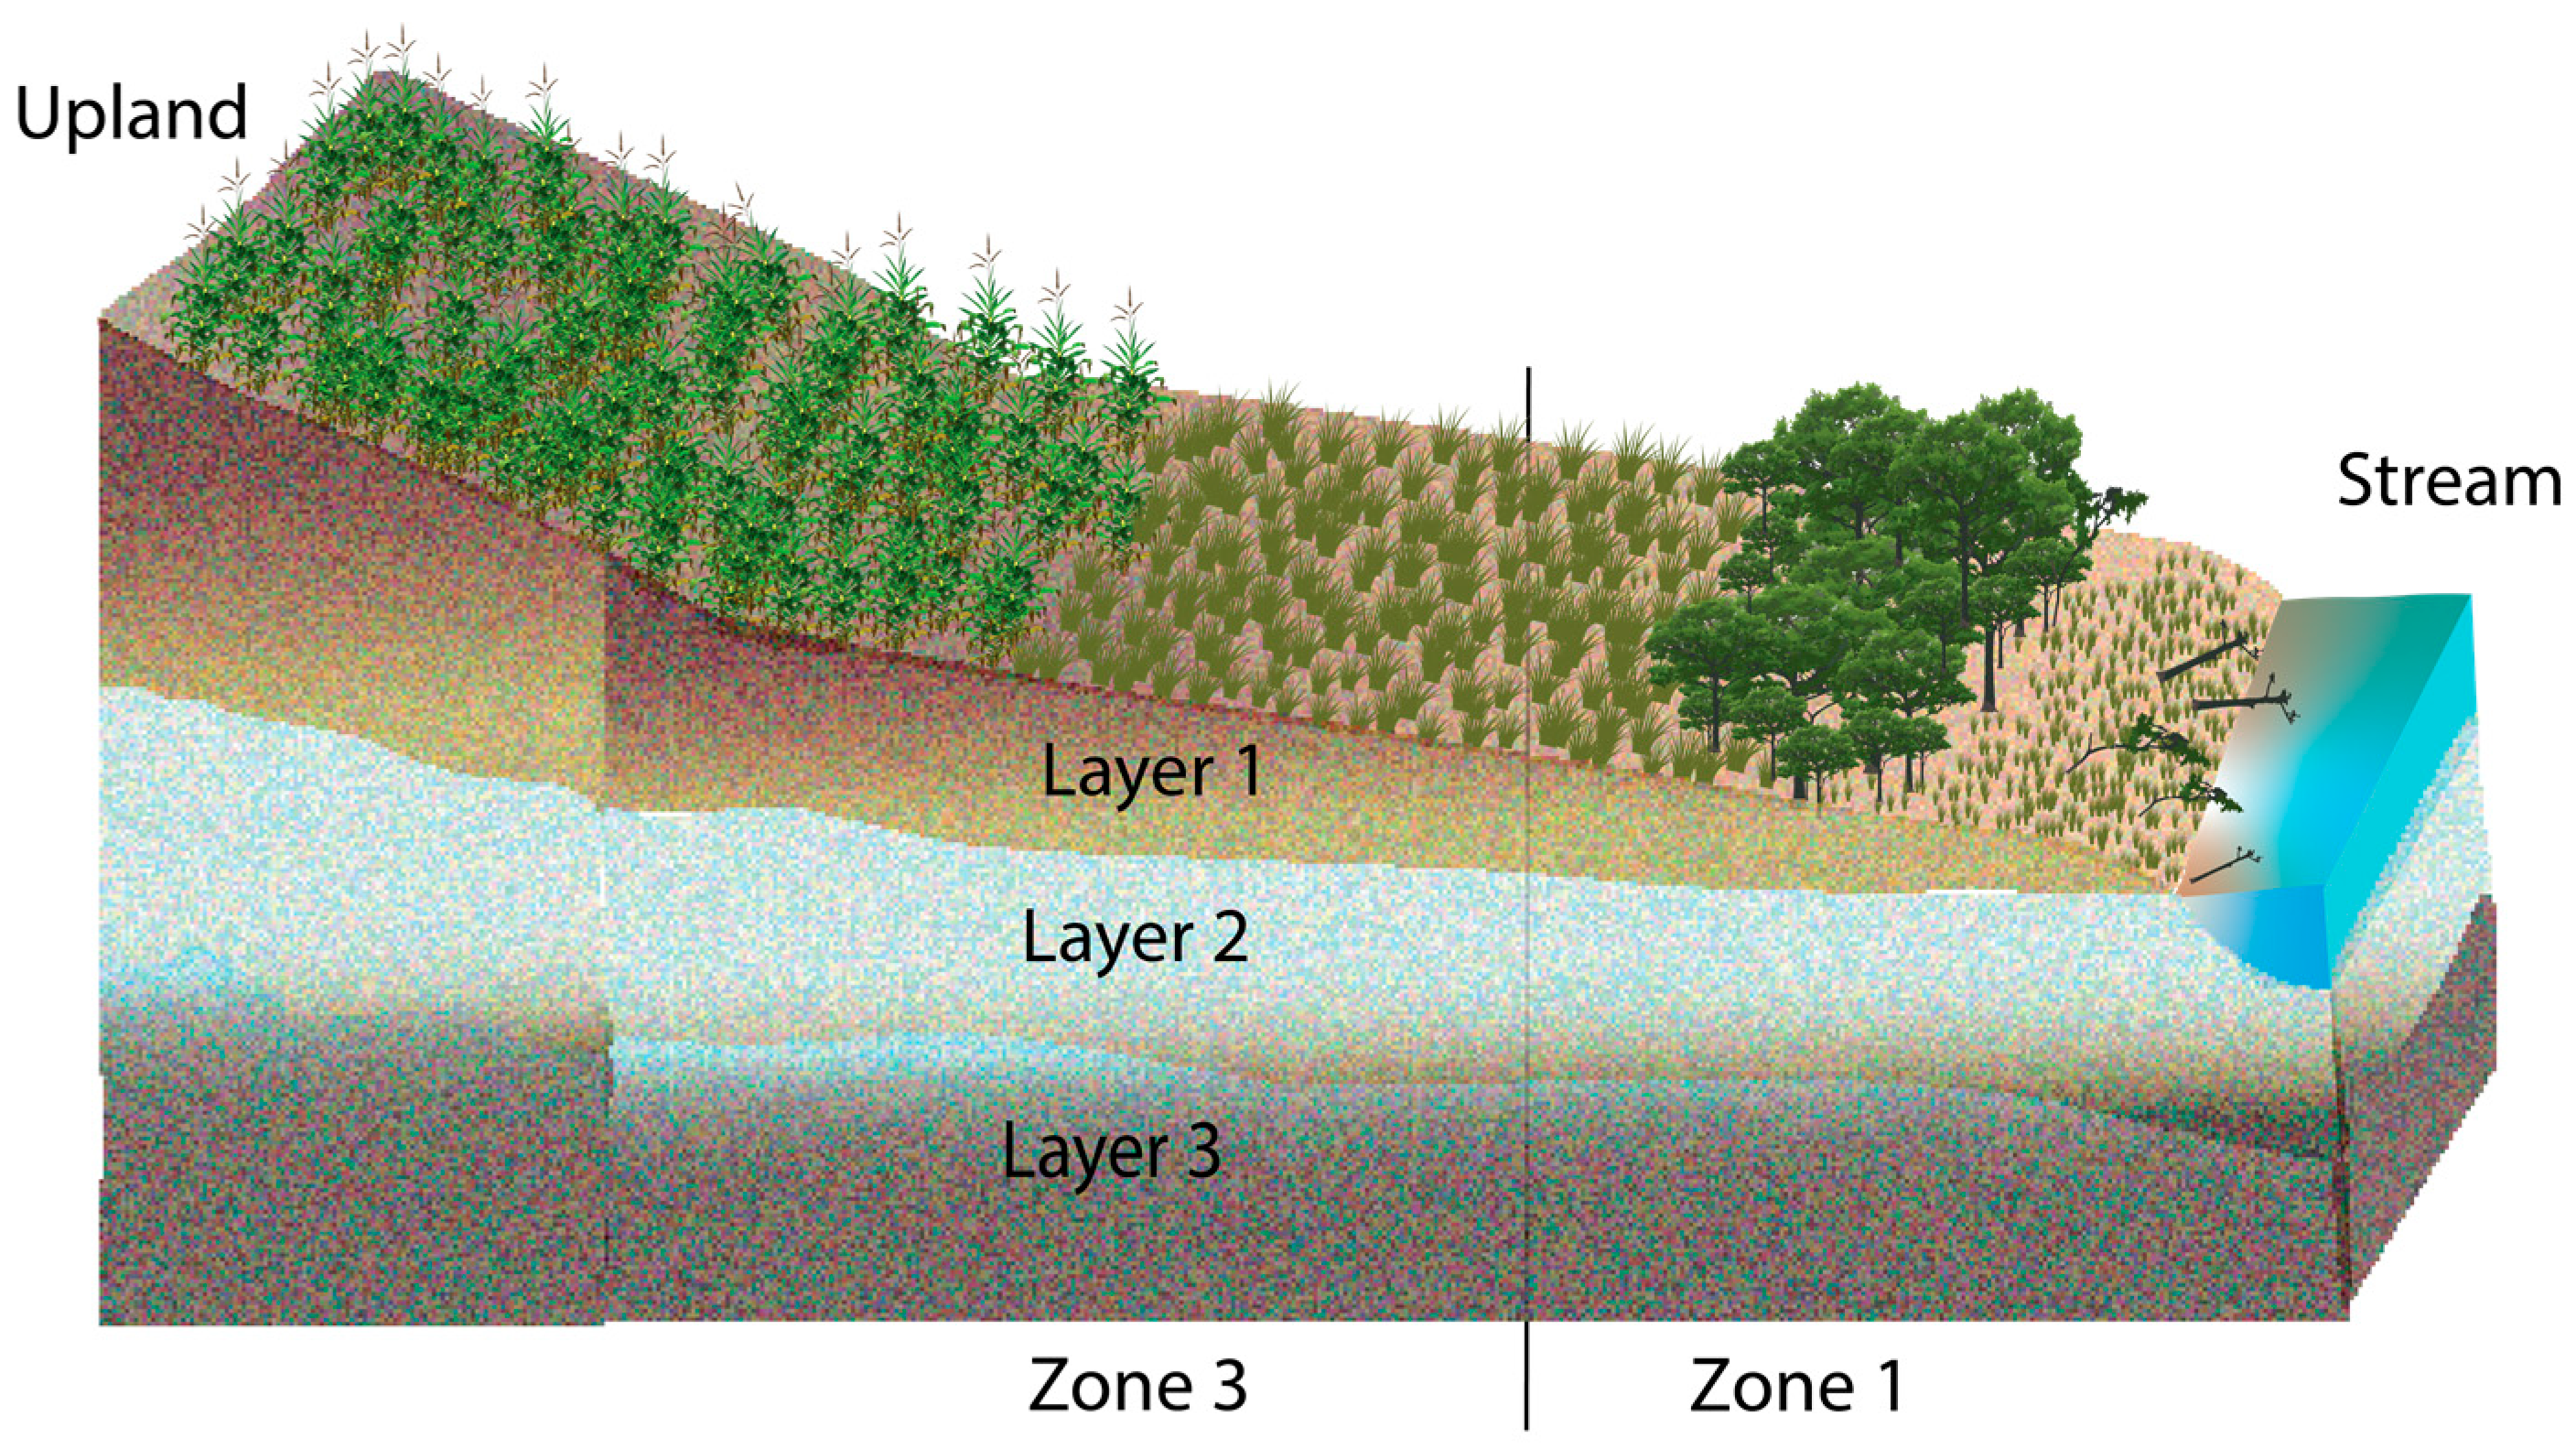
Within the model, the riparian system is considered to consist of three zones (parallel to a stream) between the field and the water body. However, zone 2 is not visibly distinguished at the riparian sites in this study, as they tend to move abruptly from zone 1 to zone 3 (Figure 2). Each zone includes litter and three soil layers (through which the vertical and horizontal movement of water takes place) that terminate at the bottom of the plant root system, and a plant community that can include six plant types in two canopy levels. The riparian system characterized in REMM was originally designed to represent increasing levels of management away from the stream [15]. REMM is written in the C++ programming language.
In the REMM module, movement of water and storage is defined by several processes, i.e., interception, evapotranspiration (ET), infiltration, vertical drainage, surface runoff, subsurface lateral flow, upward flux from the water table in response to ET, and seepage or exfiltration. These processes are simulated for Zone 3, Zone 2, and Zone 1. The water movement and storage between the zones is based on a combination of mass balance and rate-controlled approaches. Equation (1) presents the mass balance of water within each soil layer:
S M ( t ) = S M ( t 1 )   + Q V i n ( t ) Q V o u t ( t ) + Q H i n ( t ) Q H o u t ( t ) E T ( t )
where S M ( t ) (mm) is the soil moisture on day t, S M ( t 1 ) (mm) is the soil moisture from the preceding day, Q V i n (mm) is the addition of water as a result of infiltration in case of the upper soil layer, or drainage from upper soil layer for intermediate soil layers, Q V o u t (mm) is drainage out of the layer, Q H i n (mm) is contribution because of lateral subsurface flow, Q H o u t (mm) is the outflow of water to lateral subsurface downslope flow, and ET (mm) is evapotranspiration [12]. REMM hydrologic outputs generated from the water balance simulation include daily surface and subsurface losses to the water body, evapotranspiration and deep seepage. Deep seepage is specified by the user for each zone as input only, such that the water that is lost through the deep seepage never comes back into REMM computations [16,35].
Reference [35] described the equation used in REMM model to simulate denitrification. Denitrification is calculated as the function of the interaction of factors representing the degree of anaerobiosis, temperature, nitrate—N, and available carbon:
N i t r a t e N   d e n i t r i f i c a t i o n ,   t                                                       = M i n i m u m   o f   { N i t r a t e N t   o r   ( K d   × S d   × A f                                                         × T d e n i t r i f i c a t i o n , t × ( α × N f + C f )   )   }  
where Kd is the rate of denitrification under optimal conditions (kgcm−1 ha−1), Sd is the depth of the soil layer (cm), Af is the scaler factor representing the effect of anaerobiosis on denitrification (0–1), Tdenitrification,t is the scaler factor representing the effect of temperature on denitrification (0–1), Nf is the scaler factor representing the effect of nitrate–N on denitrification (0–1), Cf is the scaler factor representing the effect of available carbon on denitrification (0–1), and α is a coefficient determining the influence of nitrate on denitrification set at 0.19.
According to [43], REMM has been developed as a hillslope-scale mechanistic model to predict how the width and composition of riparian habitats impact material loadings to streams. Particularly, when loadings of sediment and nutrients to the riparian zone are known, then REMM can be used to simulate the effect of riparian buffers on stream chemistry. Similar to other mechanistic models, the application of REMM is limited by its complexity and large needs for input data. REMM operates at the hillslope rather than catchment scale. It cannot forecast effects on instream ecological endpoints.

2.3. REMM Model Input Data

Parameters are input into the model through four basic files that include: (1) contributions of daily outputs from the field draining into the riparian system including surface runoff and associated eroded sediment, organic material and plant nutrients (*.FIN), (2) weather data (*.WEA), (3) vegetation (*.VEG) characteristics, and (4) soil physical and chemical parameters (*.BUF). The last two of these describe in detail the morphology of the buffer system being modeled. One of the key reliable inputs needed to simulate riparian system in the REMM model is the water and nutrients originating from the upland source area. These can be field measured or simulated using models such as AnnAGNPS (AGricultural Non-Point Source) and APEX (Agricultural Policy/Environmental eXtender). We had to rely on AnnAGNPS simulated upland data due to lack of field measured data (surface runoff and sediment data) at the edge of the field. We calibrated and validated the AnnAGNPS generated runoff against USGS measured streamflow at the watershed outlet and used as field input to REMM. These calibrated inputs will increase the reliability of REMM buffer simulations.

2.3.1. Upland Inputs (*.FIN File)

Upland inputs comprise the daily flux of upland water, associated sediment, sediment-borne chemicals, and dissolved chemicals entering the upper side of the buffer system during the period of simulation. REMM requires daily subsurface and surface flow data from the field or upland area. In general, this information is missing from most REMM studies, which can hinder the ability of REMM to properly predict riparian functions at the site scale [39]. To offset this issue, a field-scale hydrological model, Annualized AGricultural Non-Point Source (AnnAGNPS), was used to predict the runoff and sediment loading to the riparian buffer [44,45]. AnnAGNPS [46,47] is a daily time step, watershed scale, pollutant-loading, distributed model developed to simulate long-term runoff, sediment, nutrients, and pesticide transport from agricultural watersheds [48,49,50]. The AnnAGNPS model defines cells of various sizes; contaminants are routed from these cells into the associated reaches, and the model either deposits pollutants within the stream channel system or transports them out of the watershed [47]. TOPAZ (one of the modules of AnnAGNPS) is the TOpographic PArameteriZation program which generates cell and stream network information from the watershed digital elevation model (DEM). It also provides all of the topographic related information for AnnAGNPS. DEM was acquired from the United States Geological Survey (USGS)—The National Map Viewer (TNM Viewer version 2.0, USGS, Washington, DC, USA)7.5-min digital elevation models (DEMs)—with a 10-m horizontal, 7-m vertical resolution [51]. The soil map [52] and land use map [53] were also incorporated for watershed delineation. The simulated runoff and sediment loading from AnnAGNPS was calibrated by comparing with observed data (USGS gauge). The calibrated daily runoff and the sediment loading were used as input data in .FIN (Field Data File). The rationale behind the use of AnnAGNPS model rather than other hydrological models, such as SWAT, is that AnnAGNPS divides the entire watershed into a number of cells and generates cell wise upland input data file compatible to *.FIN file format in REMM model. For this study, AnnAGNPS was used with a cell size of 1.8–0.4 km2 (interquartile range, IQR = Q3 − Q1, of cell size among a total of 185 cells in the watershed) to simulate input cells representing upland inputs to each of the eight riparian buffers within upper Pawcatuck River watershed. Details of the application of AnnAGNPS model on the study area can be found in our companion study [45]. Table 1 represents the upland characteristics for all the riparian sites. The sites are all in glacial outwash with sandy loam or fine sandy loam soil.

2.3.2. Weather Data (*.WEA File)

REMM requires daily rainfall, maximum and minimum air temperature, solar radiation, wind speed, and dew point temperature as its climate input files. All these data are obtained from the closest available national weather service cooperative observer program (NWS COOP) weather stations [54,55]. The data for three daily climate parameters, i.e., minimum air temperature, maximum air temperature, and precipitation, were acquired from PRISM website at 4 km spatial resolution (PRISM Climate Group, Oregon State University, http://prism.oregonstate.edu, accessed on 4 February 2004).

2.3.3. Vegetation Data (*.VEG File)

The vegetation (.VEG) data file contains plant specific information. Regional data sets are being developed that define plant characteristics typical of a region. The vegetation database created by REMM developers (USDA-ARS) separately for northeastern region was used during the simulation period. It is also accessible to other users. Maximum rooting depths (MRDs) influenced water uptake and plant transpiration which influenced ET and simulated WTDs. A maximum rooting depth of 200 cm was used for all zones for all plant species, as all riparian sites were forested, with hardwood red maple (Acer rubrum L.) the dominant species. This was the default value used by the model developers and also by the study of [33]. Therefore, whenever no local data were available, literature values were used. Initially we looked at the influence of MRDs on the simulated outputs, but found WTDs and nitrate concentration did change at a very low rate, so we did not include MRDs in our sensitivity part. The use of MRD as 200 cm in our study provided reasonable output for our area of study, so we did not change this parameter in our model. Ref. [15] also did not include MRDs as a parameter change input in their sensitivity analysis for streamflow, total N out, denitrification and N uptake. Besides, Ref. [56] stated from their REMM sensitivity study that REMM’s comparatively low sensitivity to vegetation parameters supports the use of regional vegetation datasets that would make model implementation simple without compromising results. A specific leaf area of 0.0045 ha/kg C was used for all zones for the buffer in all sites.

2.3.4. Site Characteristics (*.BUF File)

Most of the modification required for simulation was performed within the main data file (.BUF). Plant, litter and soil layer information are given in this data file. Soil characteristics for each of the three zones with three soil layers are entered in BUFFER DATA FILE (*. BUF). The characteristics include S10 Fraction, bubbling pressure, pore size distribution index, layer thickness, wilting point, field capacity, soil porosity, permeability (cm/hr), % sand, % silt, % clay, bulk density, pH, base saturation, etc. The data for most of these soil characteristics were obtained from REMM user manual based on the soil texture [57]. Also whenever there is no data available default value or value from published literature was used. The soil layers in the model are intended to correspond with horizons in the soil profile. According to [35], REMM keeps the soil physical properties constant during the simulation period. Soil parameters (saturated hydraulic conductivity, bulk density) which might change during conversion of cropland to permanent buffers may be changed at model user defined points in the simulation or can be set as intermediate point between field and mature buffer conditions. Ref. [15] stated that REMM is designed to be used at a hillslope scale to simulate the effects of buffer systems on edge-of-field loadings. REMM takes upland outputs supplied by the user and calculates loadings of water, nutrients, sediment, and carbon based on actual area of the zones of a buffer system. Similarly for plant and litter information, modifications were based on the guidelines described in the REMM User’s Manual [57]. Whenever no local data were available, literature values were used. Table 2 shows the site characteristics of the modeled buffer for all riparian sites. All sites were located on hydric soils with alluvial or glacial outwash parent materials. Although the land uses varied among watersheds, all riparian sites were forested, with red maple (Acer rubrum L.), the dominant species [58]. More details about land use are available in [11,58].

2.3.5. Collection of Field Data and Other Essential Inputs for REMM

All original or field data (including site characteristics) was collected by a team led by the authors of this manuscript, with decades of published research on riparian zones in glaciated settings of the USA Northeast regions, for the development and calibration of the REMM model. Water table levels were recorded in water table wells in the riparian zone, biweekly during spring and fall when water table depths were expected to change most rapidly, and bi-monthly during summer and winter. A network of mini-piezometer nests was installed across the riparian zone from the upland to the stream. The mini-piezometers allowed the collection of nitrate samples at discrete depths and the examination of groundwater denitrification in situ using the push–pull method [59]. The information regarding in-situ groundwater denitrification capacity measurement in the study sites 1, 2 [11] and sites 3,4 [58] were based on the studies done by [11,58]. For sites 1&2, the in-situ groundwater denitrification rates measured are within the range reported by previous studies [59]. For sites 3&4, in situ groundwater denitrification capacity measured in the shallow wells was not significantly different from that measured in deep wells; thus, shallow and deep wells were pooled (i.e., combined) for statistical analysis. A soil pit was dug and soil samples were taken from all soil horizons and analyzed for carbon content. Particle size distribution (percentage sand, silt, and clay) and soil carbon were determined for samples taken from the soil pits. The percentage sand, silt, and clay were used as inputs into REMM. The depth of the stream as 0.305 m has been used for all the sites [6].
Groundwater samples were analyzed for NO3–N using the SM 4500 NO3 F automated cadmium reduction method on an Alpkem RFA 300 Rapid Flow Auto-analyzer (O.I. Analytical, Wilsonville, OR, USA) [11,58]. Soil samples were also examined for denitrification enzyme activity (DEA). The DEA is the potential denitrification measured under fully anaerobic conditions and excess NO3-N and available carbon. The denitrification rate constant (Kd) is based on the denitrification potential measurement [60]. This was the only user input in REMM for simulating denitrification in all zones and layers within the buffer. For sites (1 and 2) and sites (3 and 4), field data (depth to water table, groundwater NO3–N concentrations) were collected for a five-year period (1999–2003) and a two-year period (2004–2005), respectively [11,58,61]. For sites (5, 6, 7 and 8), a simplified methodology (three-well approach) had been followed according to procedures described in [62] for the collection of field data (WTDs and NO3-N concentrations in the groundwater) for year 2018–2019.
The erosion factors, topsoil condition, Manning’s n, soil structural characteristics, soil pH and temperature, permeability class (referring to the saturated hydraulic conductivity in the soil profile), surface condition, inter-rill roughness, soil and litter characteristics, including physical properties related to soils by soil texture (bulk density, porosity, field capacity, wilting point), pore size distribution index and bubbling pressure were obtained from the REMM user’s manual based on soil texture of riparian sites [55]. Additional buffer topographic inputs consisting of buffer width, slope, and length and stream depth were obtained from a detailed topographic survey conducted in the field at the beginning of the study.

2.4. Model Assessment

The performance of the model was evaluated by comparing field collected/measured data and REMM modeled data for both WTD and groundwater NO3-N concentration. The assessment of the model was accomplished for daily WTD and groundwater NO3-N concentration. Assessment of model performance for WTD and groundwater NO3-N concentration included both qualitative and quantitative methods. Qualitative methods included comparing graphs of measured and modeled data.
We used the mean absolute error (MAE) to statistically compare the simulated and measured WTDs by quantitatively assessing the goodness-of-fit between simulated and measured WTDs. Equation (3) was used to determine the MAE
M A E =   | W m   W s   | / n
where Wm is measured WTD (cm), Ws is simulated WTD (cm), and n is the number of observations.
The simulated groundwater NO3–N concentrations were compared against the field measured by using the root mean square error (RMSE) and MAE. The RMSE was computed as:
R M S E = ( [ ( M i S i   ) 2 ] / n )
where Mi is the measured NO3-N (mg/L), Si is the simulated NO3-N (mg/L), and n is the number of observations.
The Willmott’s index of agreement (d) between simulated and measured data (WTDs and groundwater NO3-N concentration) was also calculated. The value of d is dimensionless and varies between 0 and 1, with an index of 1 corresponding to perfect agreement between simulated and measured data [63]. Equation (5) was used to compute Willmott’s index of agreement:
d = 1 [ ( M i S i   ) 2   /   ( ( |   ( S i   M )   | + |   M i M   | ) 2 ) ]
where d is the Willmott’s index of agreement, Mi is the measured data, Si is the simulated data, and M is the mean of the measured data.

2.5. REMM Model Calibration, Validation and Sensitivity Analysis

The Riparian Model was developed and evaluated first by testing the hydrologic component (measured WTDs) followed by the nutrient cycling component (measured groundwater NO3-N concentrations). The model was calibrated and validated for both hydrology and nutrient cycling in zone 1 and its three layers (similar to the procedures defined in [15,33]. The simulation period varies by site due to different field data collection periods. Simulation period ranged from 1999 to 2005 for sites 1 and 2 [11] and sites 3 and 4 [58] and from 2018 to 2019 for sites 5–8. The calibration and validation dates for each site is shown in tabulated form in Table 3.
The model was manually calibrated by changing the values of input parameters one at a time. The range of input parameters were either defined by field/laboratory measurements or obtained from literature or the REMM user’s manual.
  • We used field measured daily WTDs in order to calibrate and validate the hydrologic component of REMM.
  • Soil inputs of the upland area were first calibrated, but buffer parameters were kept constant. Soil parameters (soil porosity, field capacity, and wilting point) were then modified within recommended ranges consistent with the soil texture to reduce difference between simulated and measured WTDs.
  • We needed to adjust the soil layer thickness so that REMM generated buffer runoff and AnnAGNPS calibrated runoff, and simulated and measured WTDs were in close agreement.
  • For the improvement of REMM predictions of WTDs, saturated hydraulic conductivities were also adjusted. The REMM permeability class of 2 (saturated hydraulic conductivities ranging from 42–141 µm/s) was used for all the sites. Hydraulic conductivities significantly affected horizontal water movement between riparian zones and the vertical gravity drainage between soil layers [16].
  • The simulated WTDs were also sensitive to deep seepage from the bottom of the third layer (especially when the simulated water table was within layer 3) and were adjusted to improve model predictions of WTDs. Potential deep seep of 0.2 mm/day and 0.1 mm/day were used for all zones for site 5 and site 7, respectively. However, the other six sites had no potential deep seep in the model.
  • After the hydrologic calibration, the litter and soil carbon and nitrogen pools needed to be stabilized. Otherwise REMM might calculate irrational drop in soil organic carbon and associated high N mineralization. Followed by [64], several 35-year simulations (a period selected based on available local historical weather data) were performed by varying percentage of active, slow, and passive pools. Using the initial residue and humus pools, simulations were run and the carbon and nitrogen pools at the end of the period were then used as initial pool values for new simulations. The model was again rerun for another 35-year period which helped to stabilize the carbon and nitrogen pools. After stabilizing these pools, the denitrification rate constant (Kd) was modified to improve the goodness-of-fit between simulated and measured NO3-N concentrations in groundwater. The calibrated soil physical buffer inputs, and calibrated Kd inputs are available in Supplemental Tables S1 and S2, respectively.
  • The calibrated model that achieved the best goodness of fit with observed conditions for both WTDs and groundwater NO3-N concentrations had previously been saved. All the calibrated parameters were used without further changes to validate the model for the validation period. Model assessment guidelines defined in Section 2.4 were used to judge goodness of fit for WTDs and groundwater NO3-N concentrations in both calibration and validation phases.
  • Sensitivity analyses were performed to determine the effects of changing a number of key parameters associated with plant growth, nutrient cycling, surface runoff, and soil physical properties for REMM’s hydrological and nutrient simulation in Zone 1. We evaluated the sensitivity value of the most sensitive parameters (soil porosity, field capacity, wilting point) used for WTD estimation. In addition, we also evaluated the sensitivity value of the most sensitive parameters (soil porosity, field capacity, Kd) used for ground water nitrate concentration estimation. Each parameter was changed by +10% and −10% from the values used as the best estimates for each riparian site during calibration as described in [15]. Field capacity was always kept less than soil porosity during the change of these parameters. We utilized the integration of a local method into a global sensitivity method (the random one-factor-at-a-time) design proposed by [65]. This method consists of repetitions of a local method whereby the derivatives are calculated for each parameter by adding a small change to the parameter. The change in model outcome can then be measured by some lumped measure such as total mass export, sum of squares error between modeled and observed values or sum of absolute errors. The following equation has been used to perform sensitivity test for each parameter change—
%   c h a n g e   ( i n   d a i l y   a v e r a g e   W T D   o r   Nitrate ) = I C   I × 100 %
where I is the initial calibrated daily average WTD or Nitrate, and C is the changed daily average WTD or Nitrate after parameter change.
The sensitivity analysis and the calibration of REMM model were manually calibrated as in other studies [15,64,66,67].

3. Results

3.1. Water Table Depths Calibration and Validation

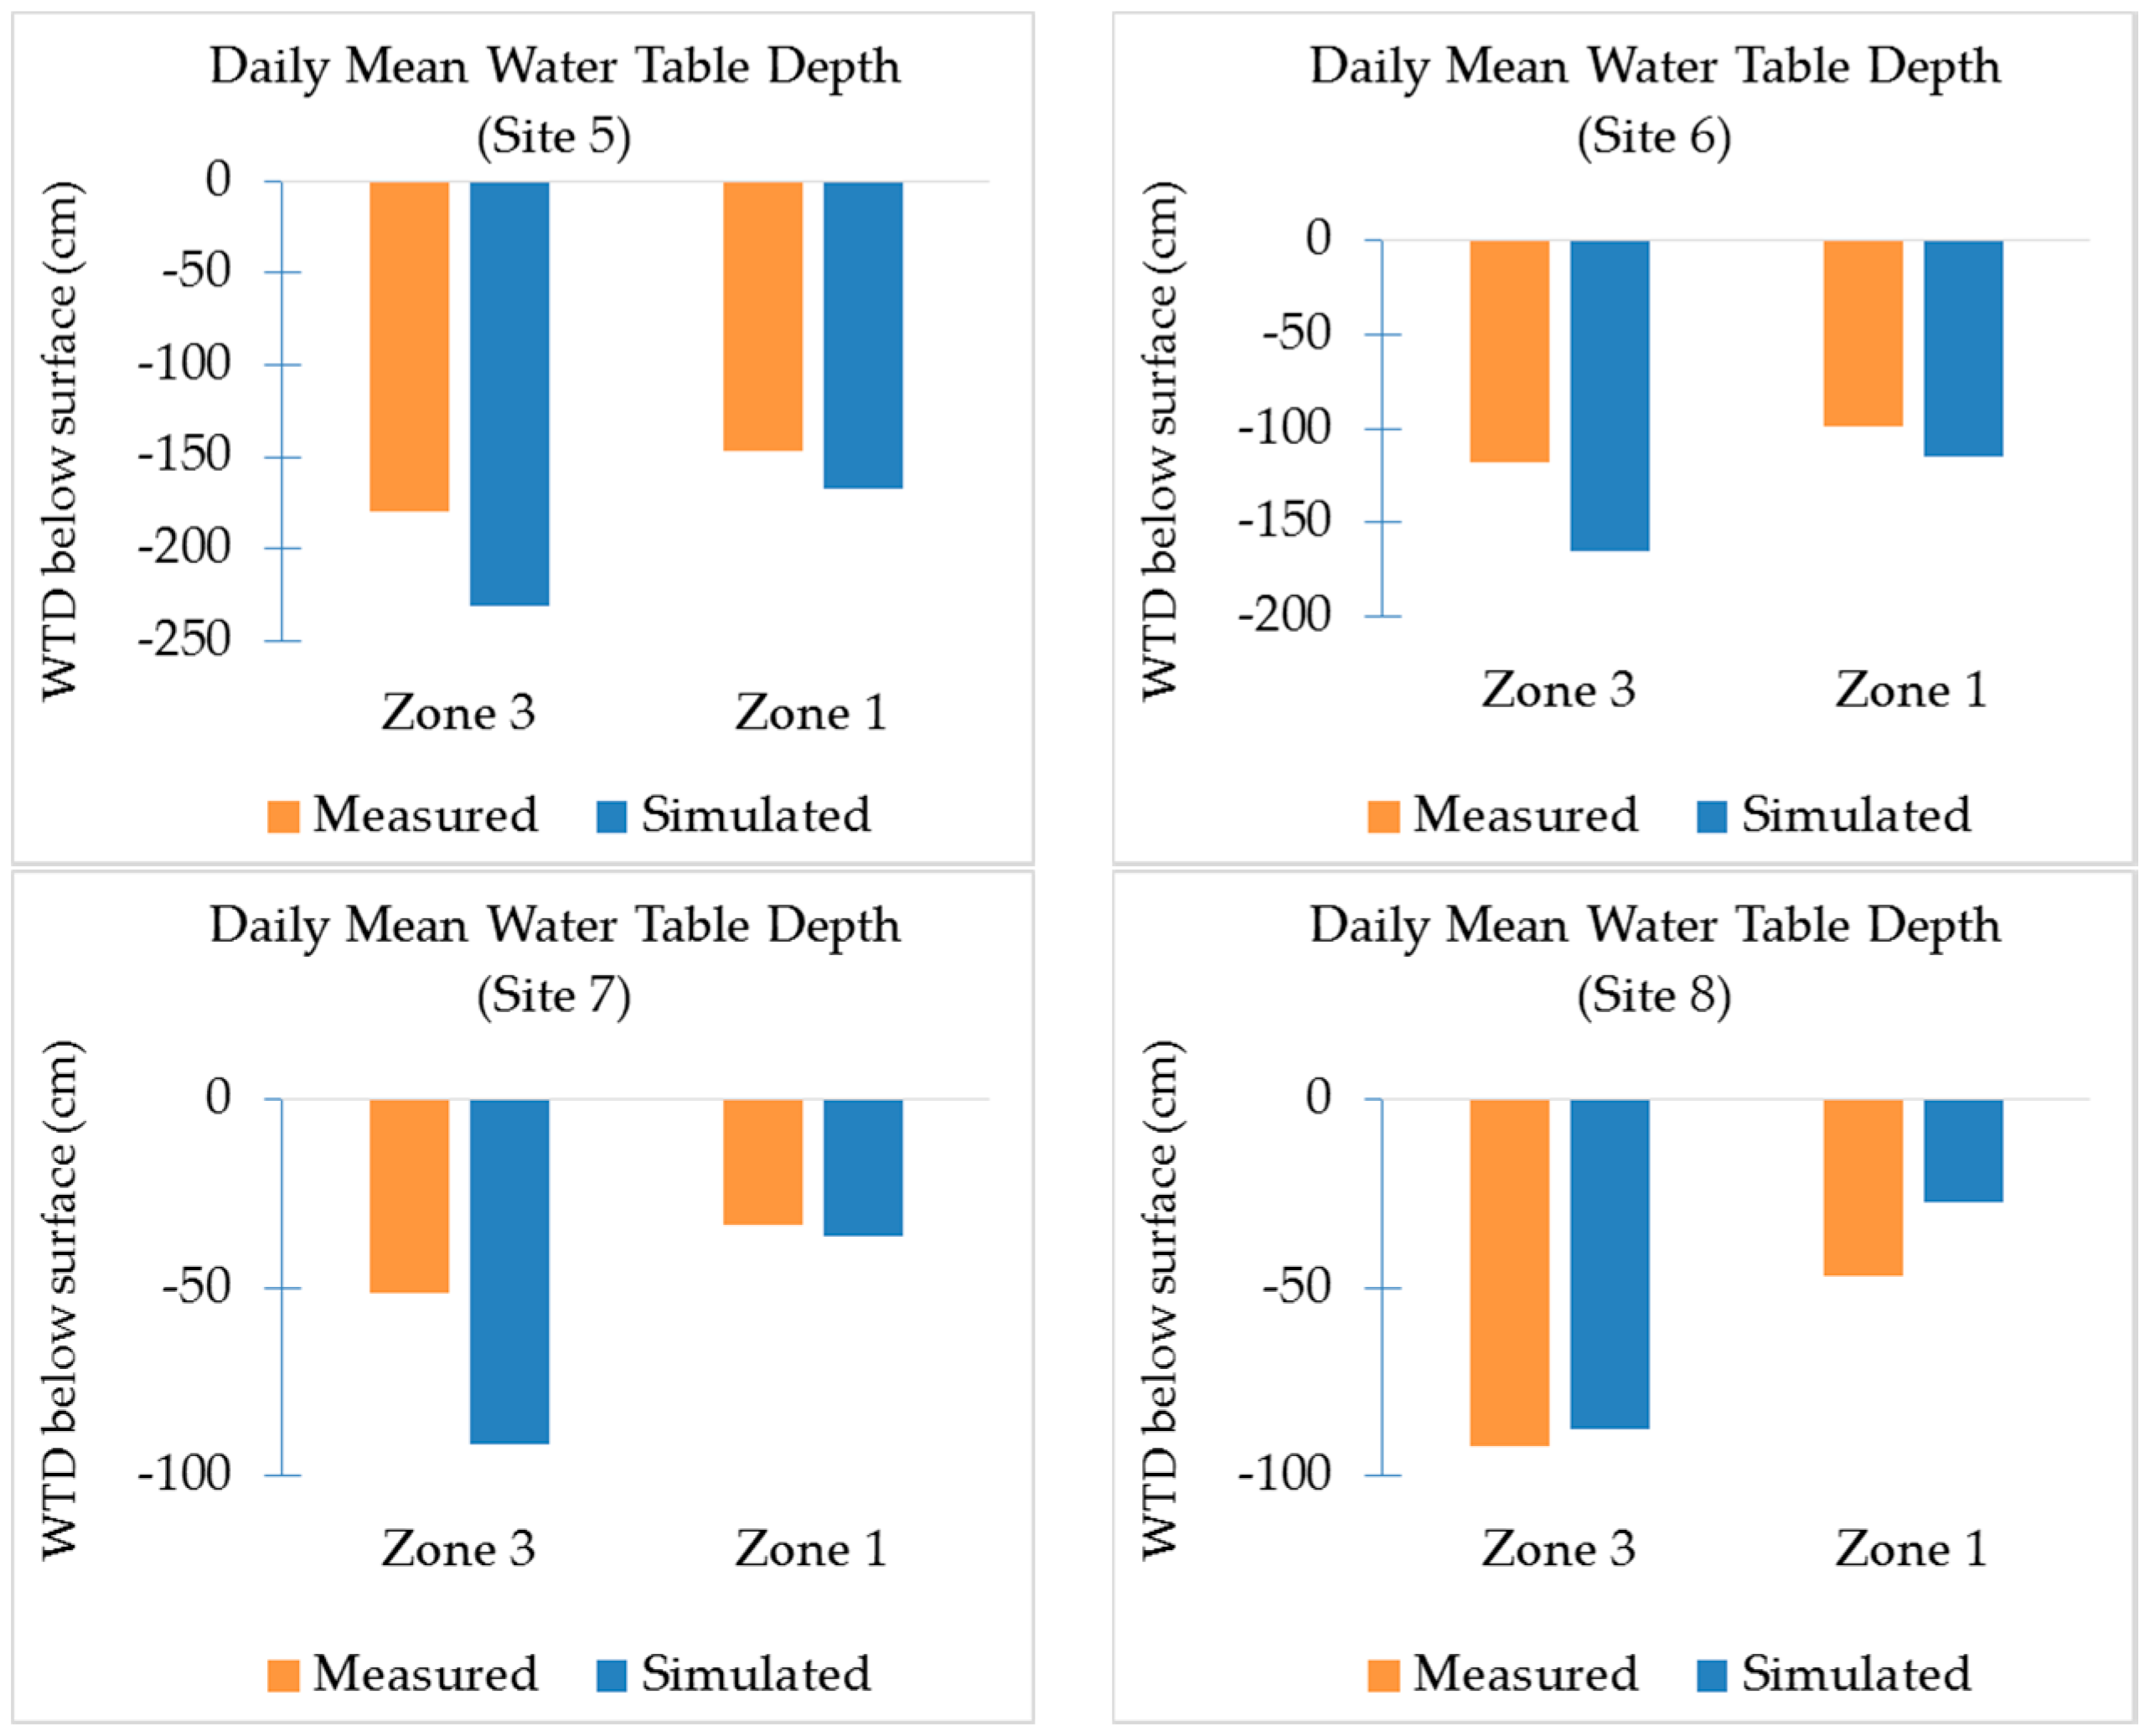
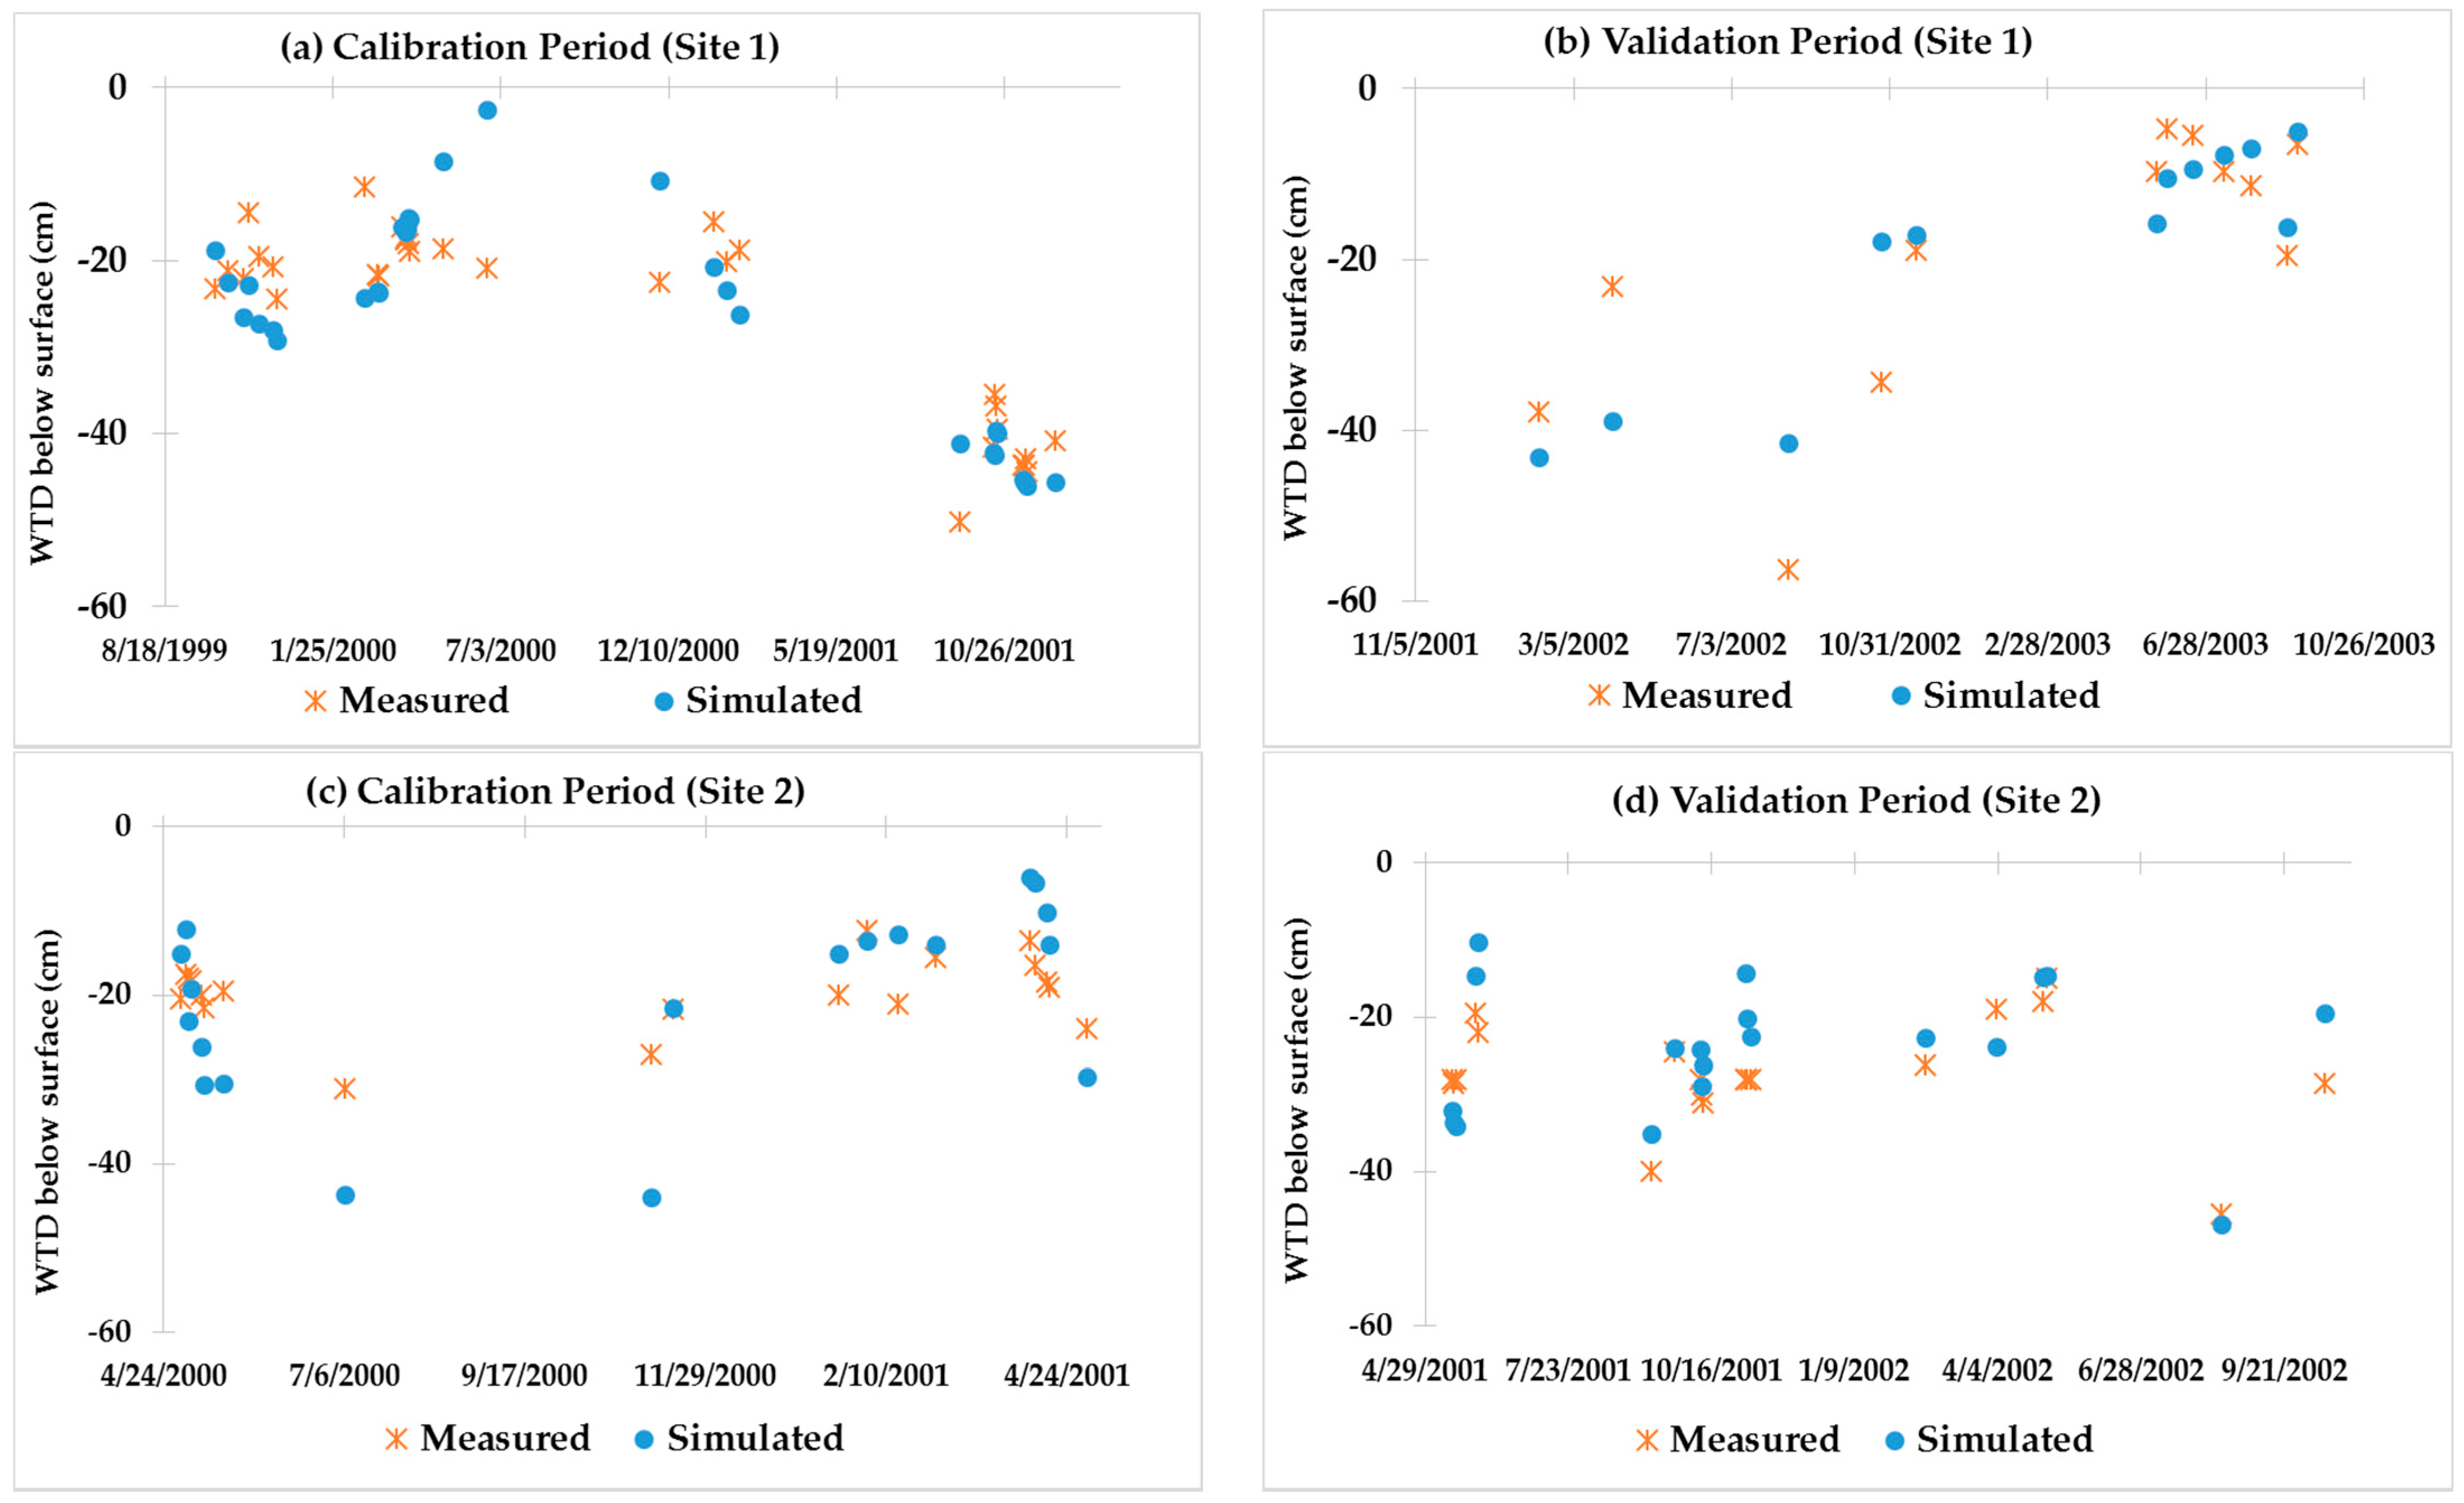
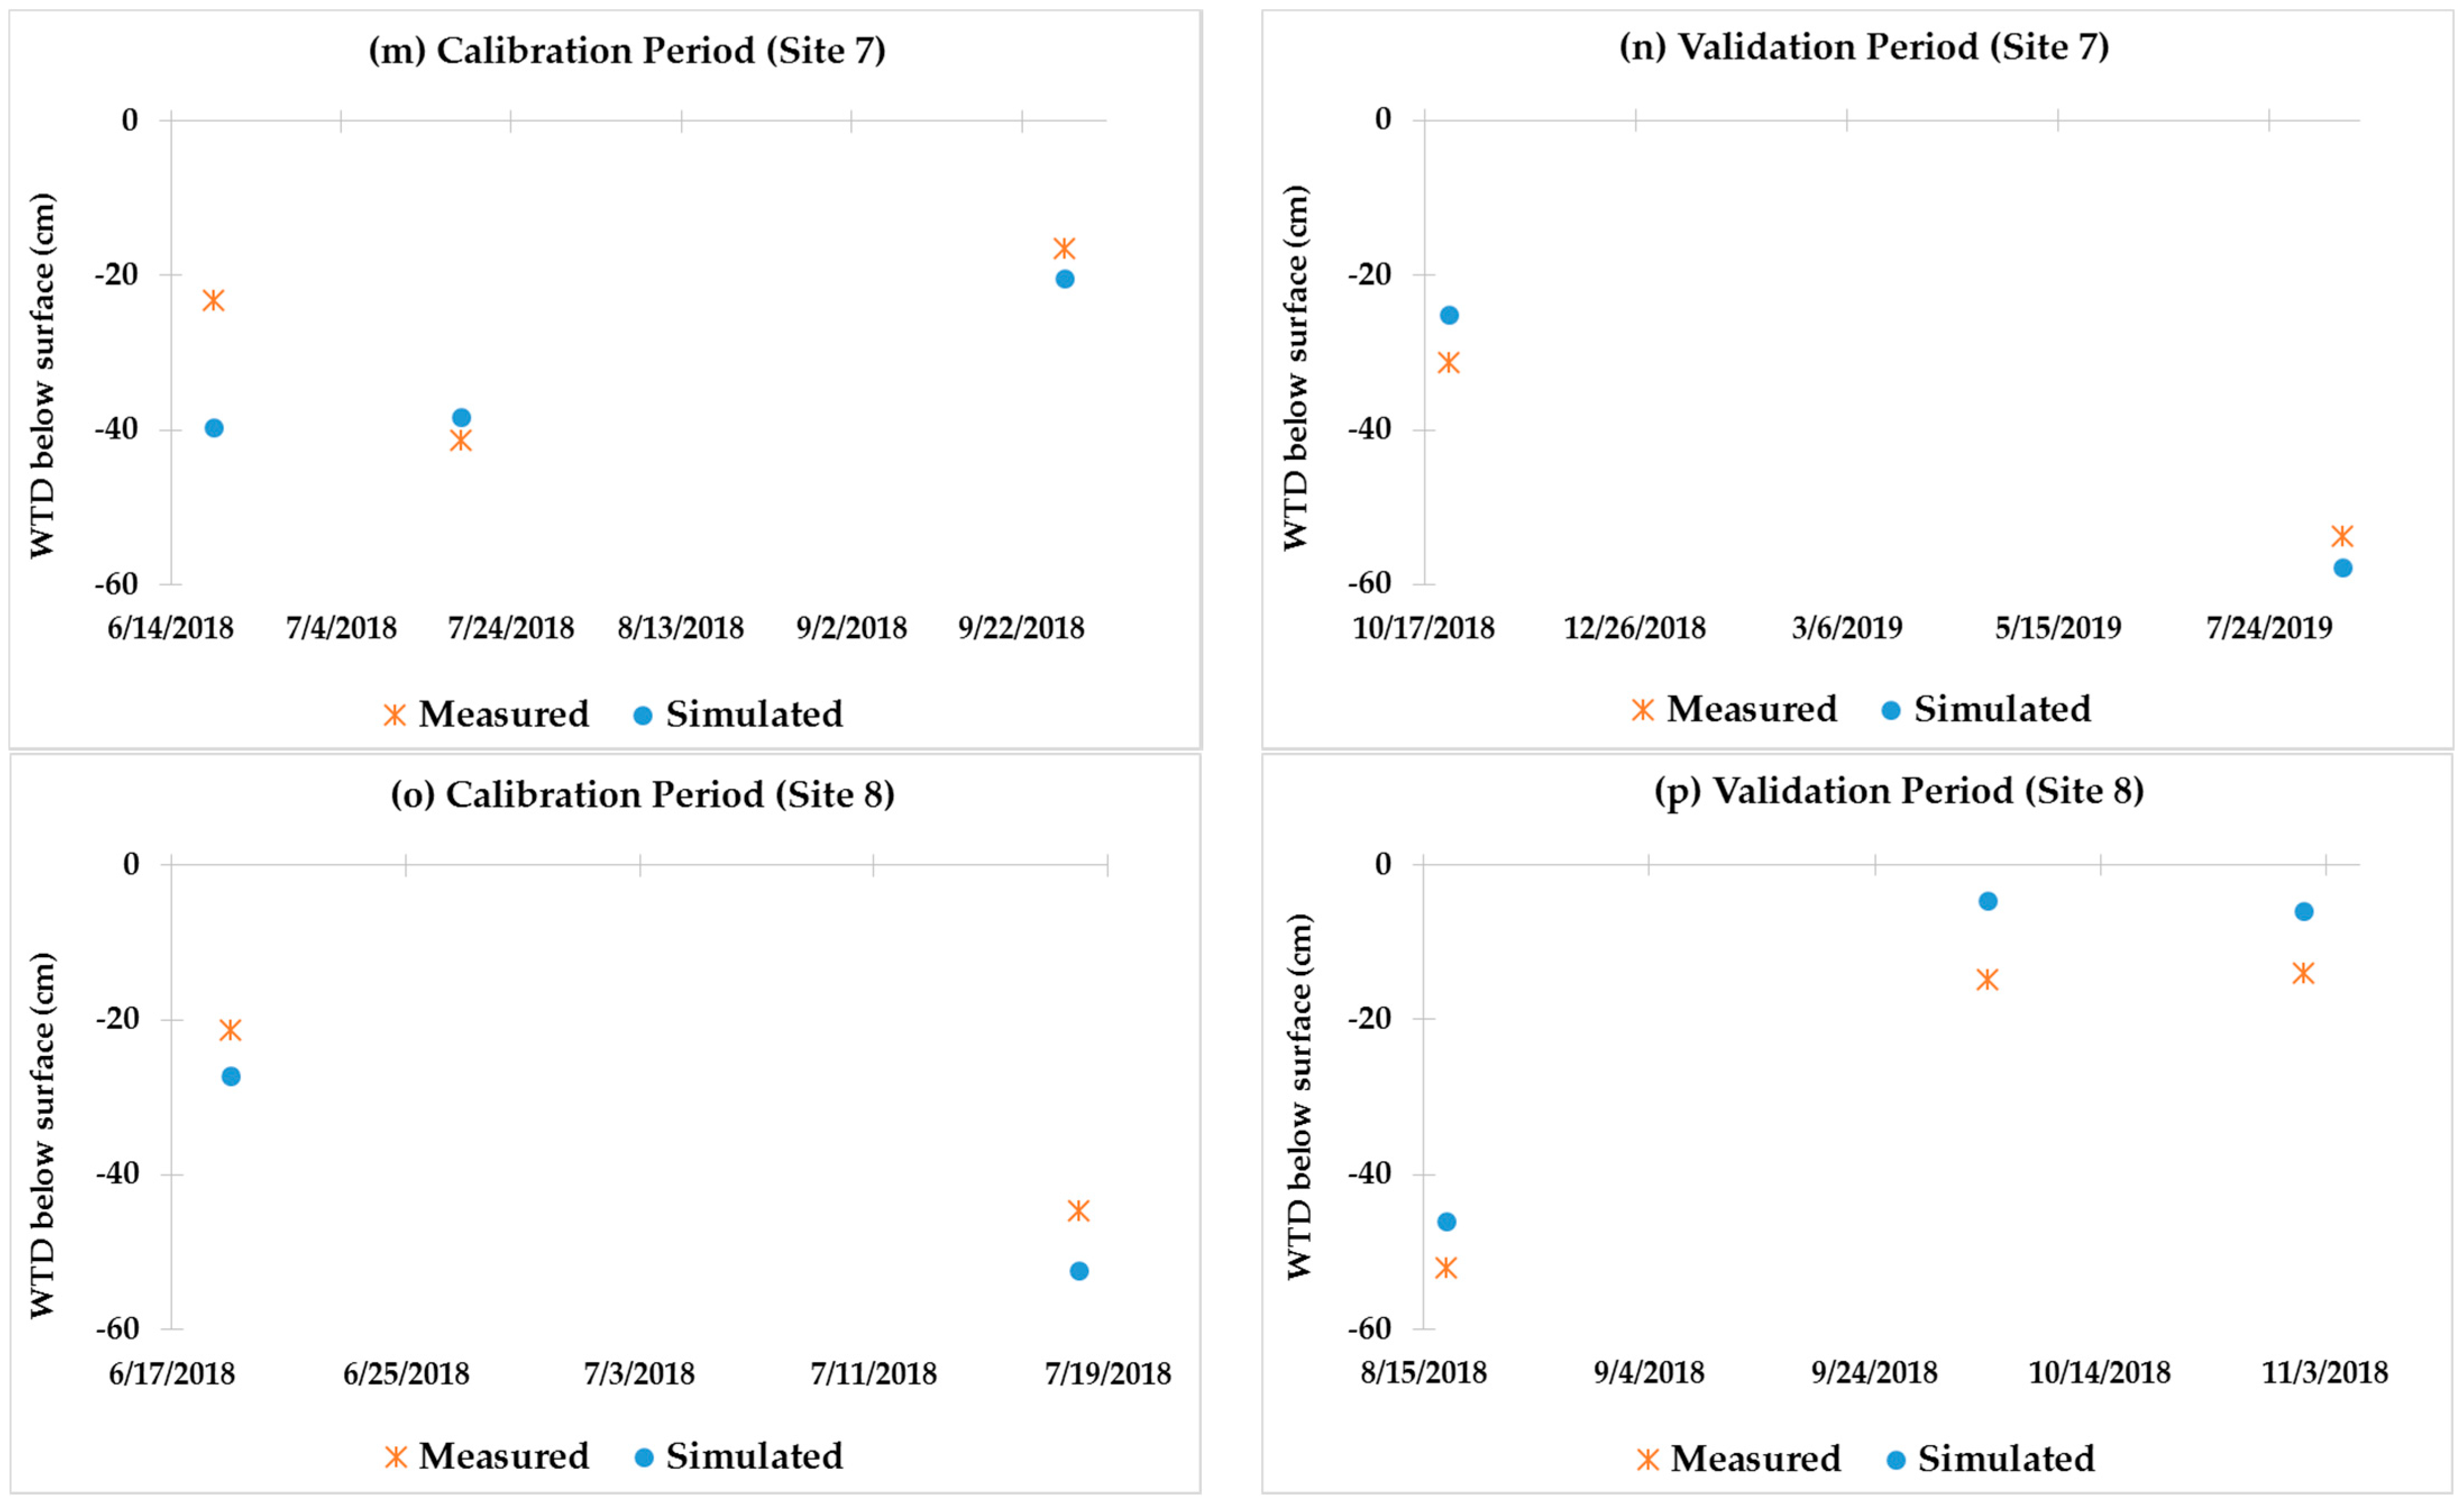
Field measured and REMM simulated daily WTD (cm below surface) dropped from field edge Zone 3 to Zone 1. Figure 3 displays the field measured and REMM simulated daily mean WTD (cm below surface) coming from field edge (Zone 3) to stream edge (Zone 1) for site 5, site 6, site 7, and site 8. Due to lack of measured field edge (Zone 3) data, we could not compare the Zone 3 REMM simulated WTDs for site 1–4. Simulated daily Water Table Depths (WTDs) were compared with those measured in the field in Zone 1 (closest to the stream) of the riparian buffer for all the sites. Simulated and measured WTDs in Zone 1 for the calibration and validation periods are shown in Figure 4. Simulated and field measured WTDs in Zone 1 were compared using mean absolute error (MAE) and Willmott’s index of agreement (d). In order to measure the variability of MAE and d among the eight riparian sites, the interquartile range (IQR) is shown as the difference between 75th and 25th percentiles, IQR = Q3 − Q1 (Table 4).
In general, among the riparian sites, the first Quartile (Q1), the second Quartile or median (Q2), and the third Quartile (Q3) of the MAE for WTDs in Zone 1 was 5.5 cm, 7.5 cm, and 9 cm for the calibration period, respectively. Likewise, for the validation period, the first Quartile (Q1), the second Quartile or median (Q2), and the third Quartile (Q3) of the MAE for WTDs in Zone 1 was 5 cm, 7 cm, and 8.5 cm, respectively. In case of Willmott’s index of agreement (d) between daily measured and simulated WTDs, the Q1, the Q2, and the Q3 of the d for WTDs in Zone 1 was 0.12, 0.34, and 0.62 for the calibration period, respectively. Similarly, for the validation period, the Q1, the Q2, and the Q3 of the d for WTDs in Zone 1 was 0.33, 0.64, and 0.75, respectively. The value of d was within the acceptable limit between 0 and 1 for both the calibration and validation periods.

3.2. Groundwater NO3-N Concentrations Calibration and Validation

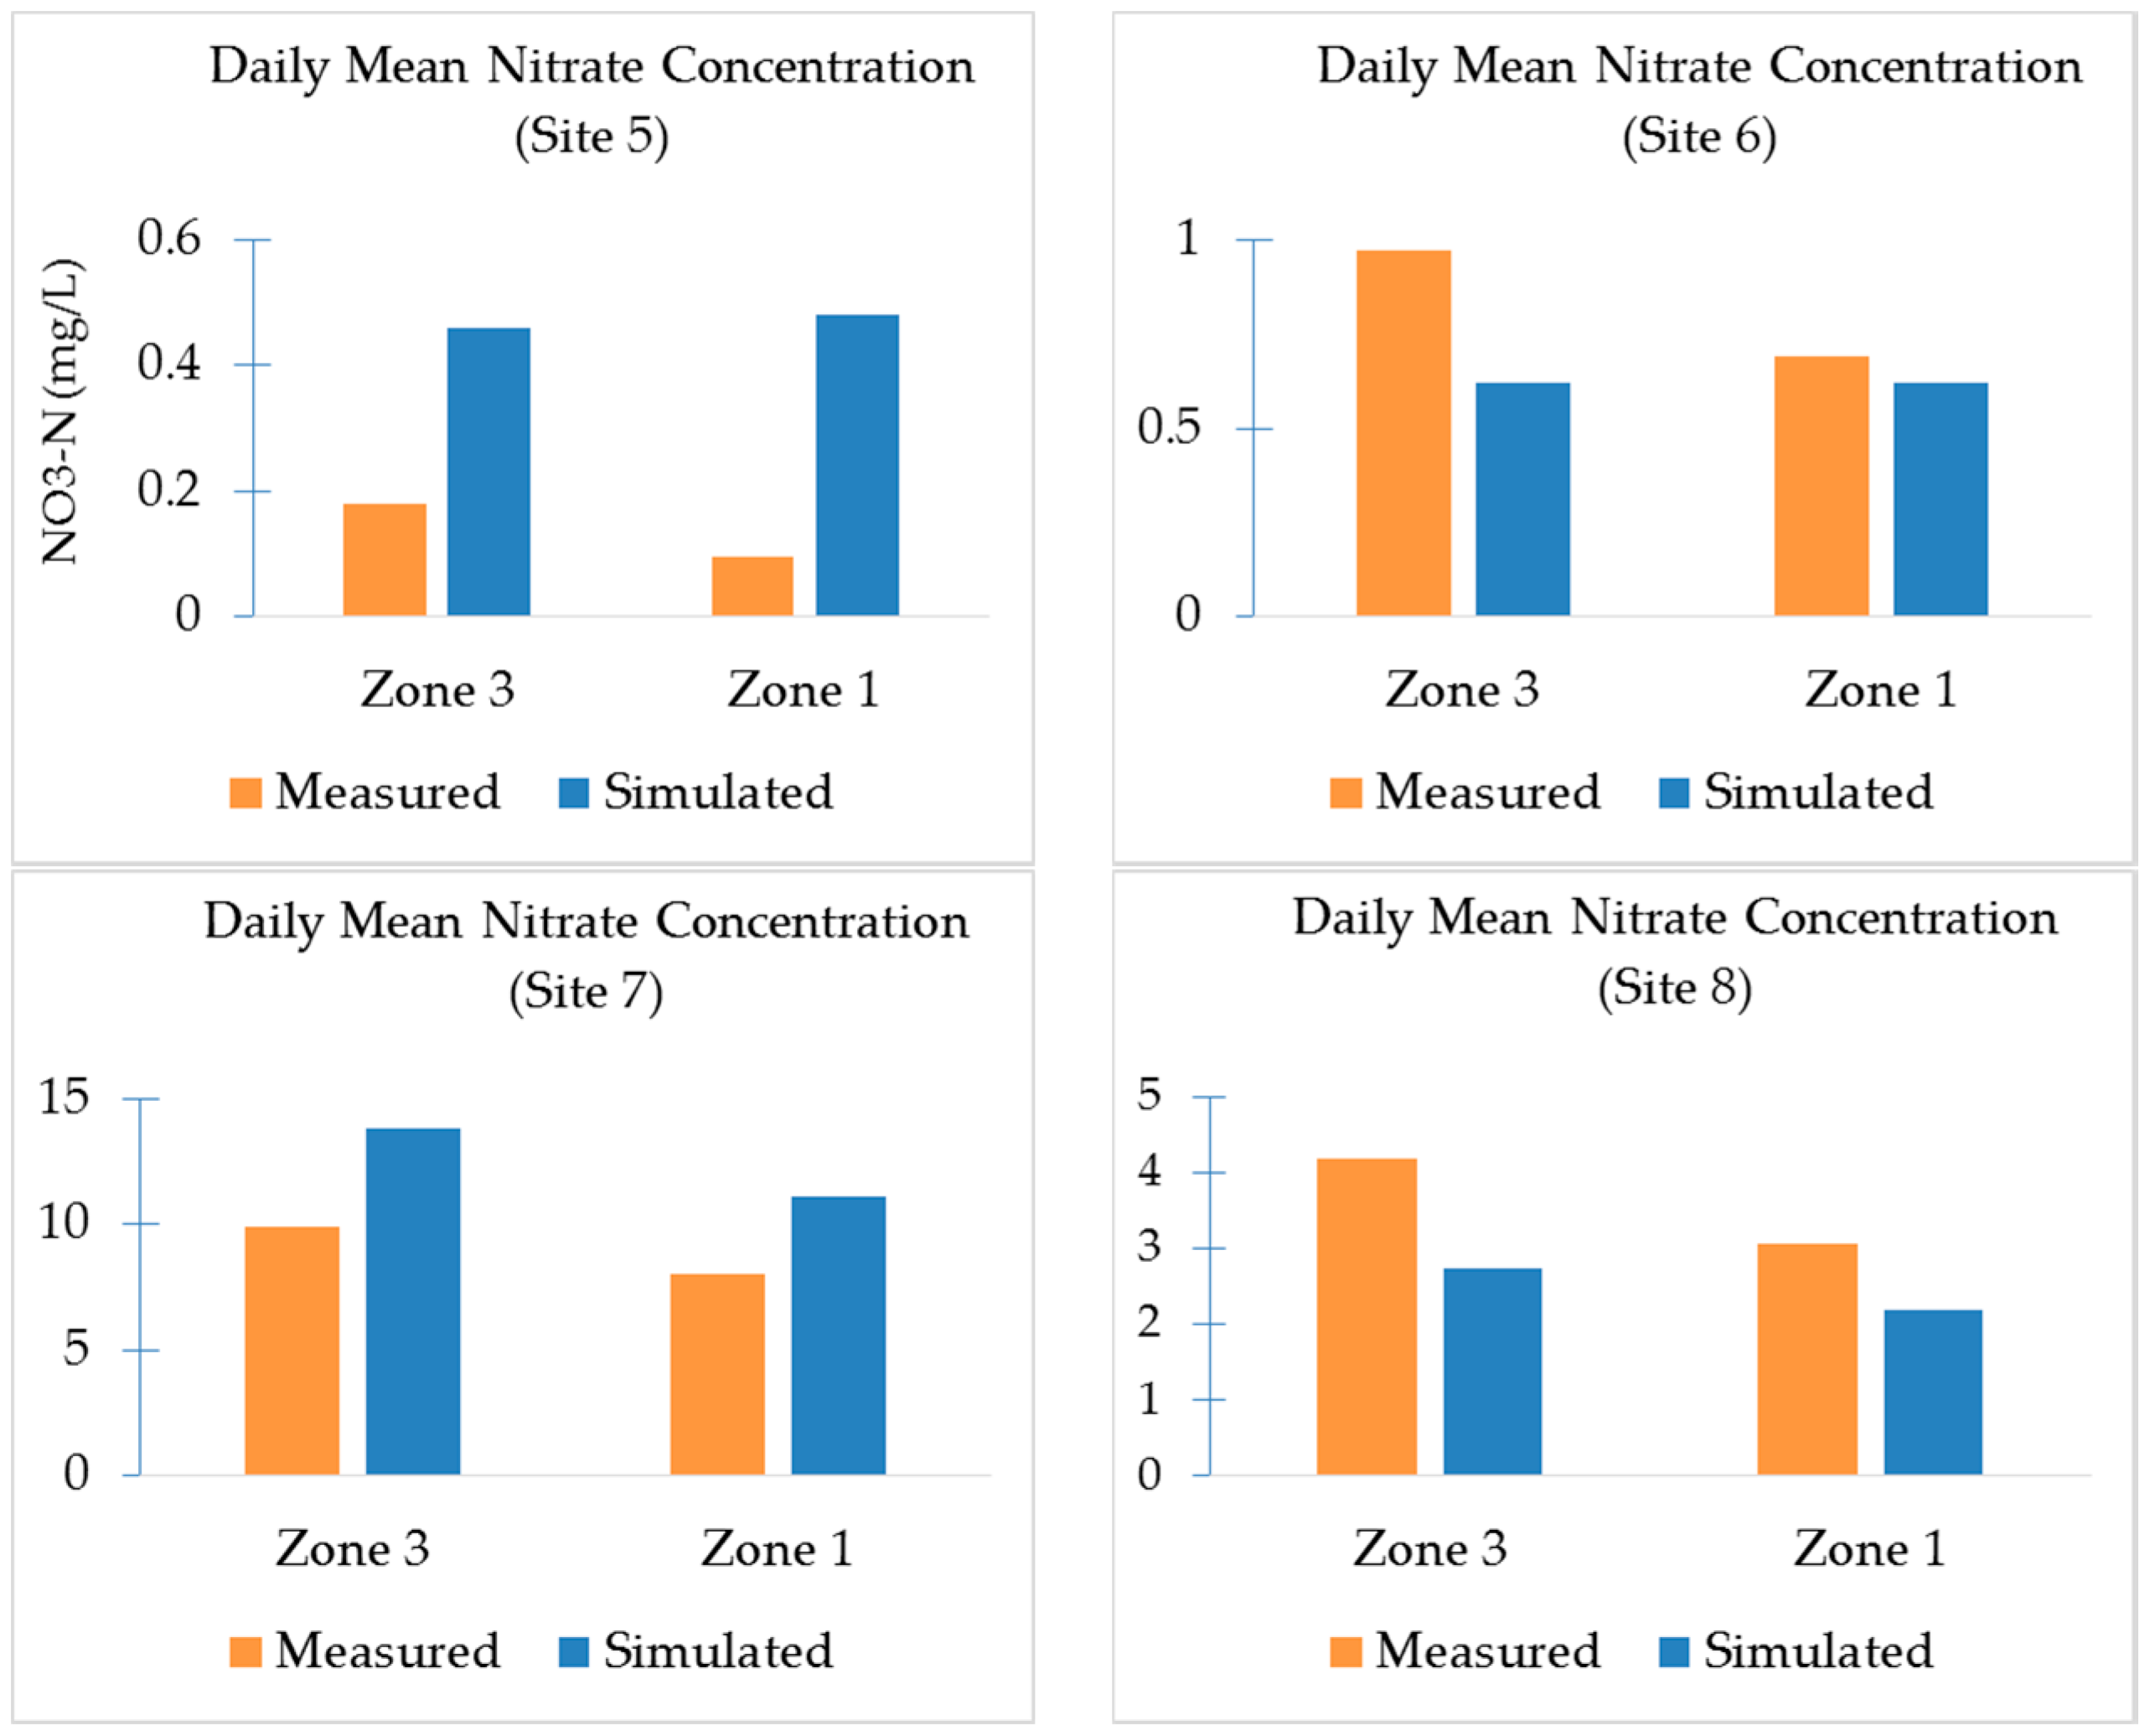
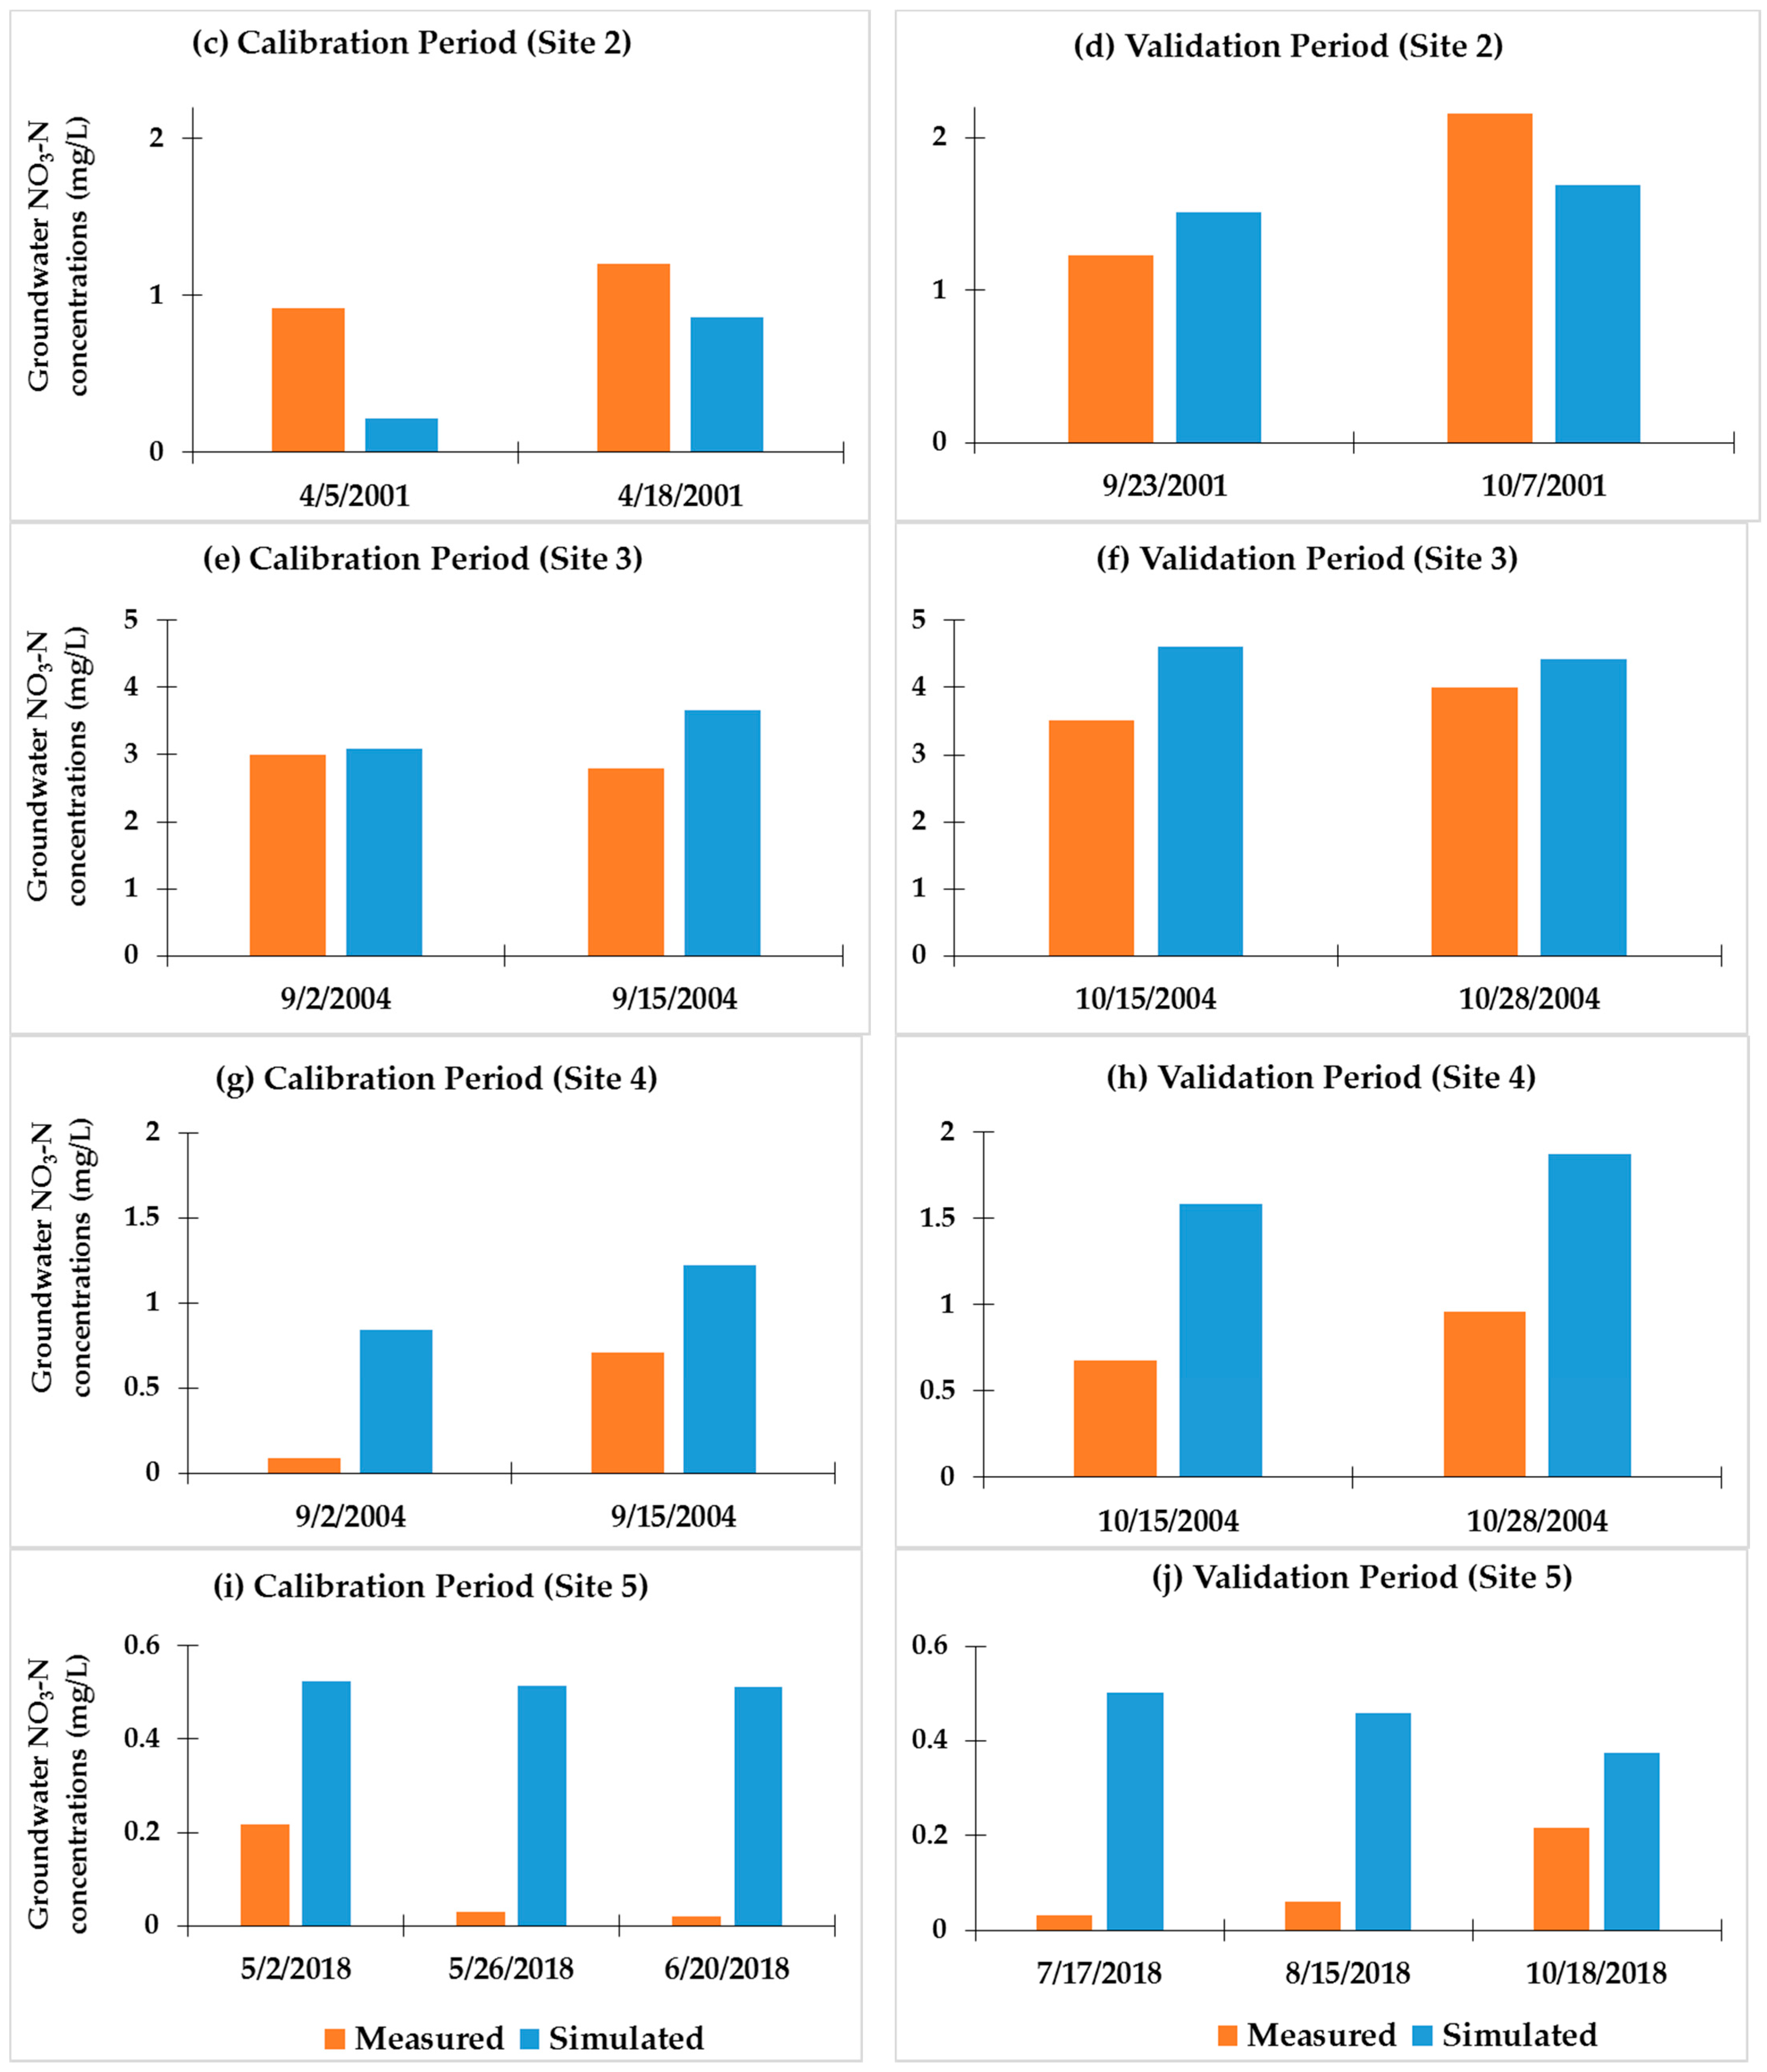
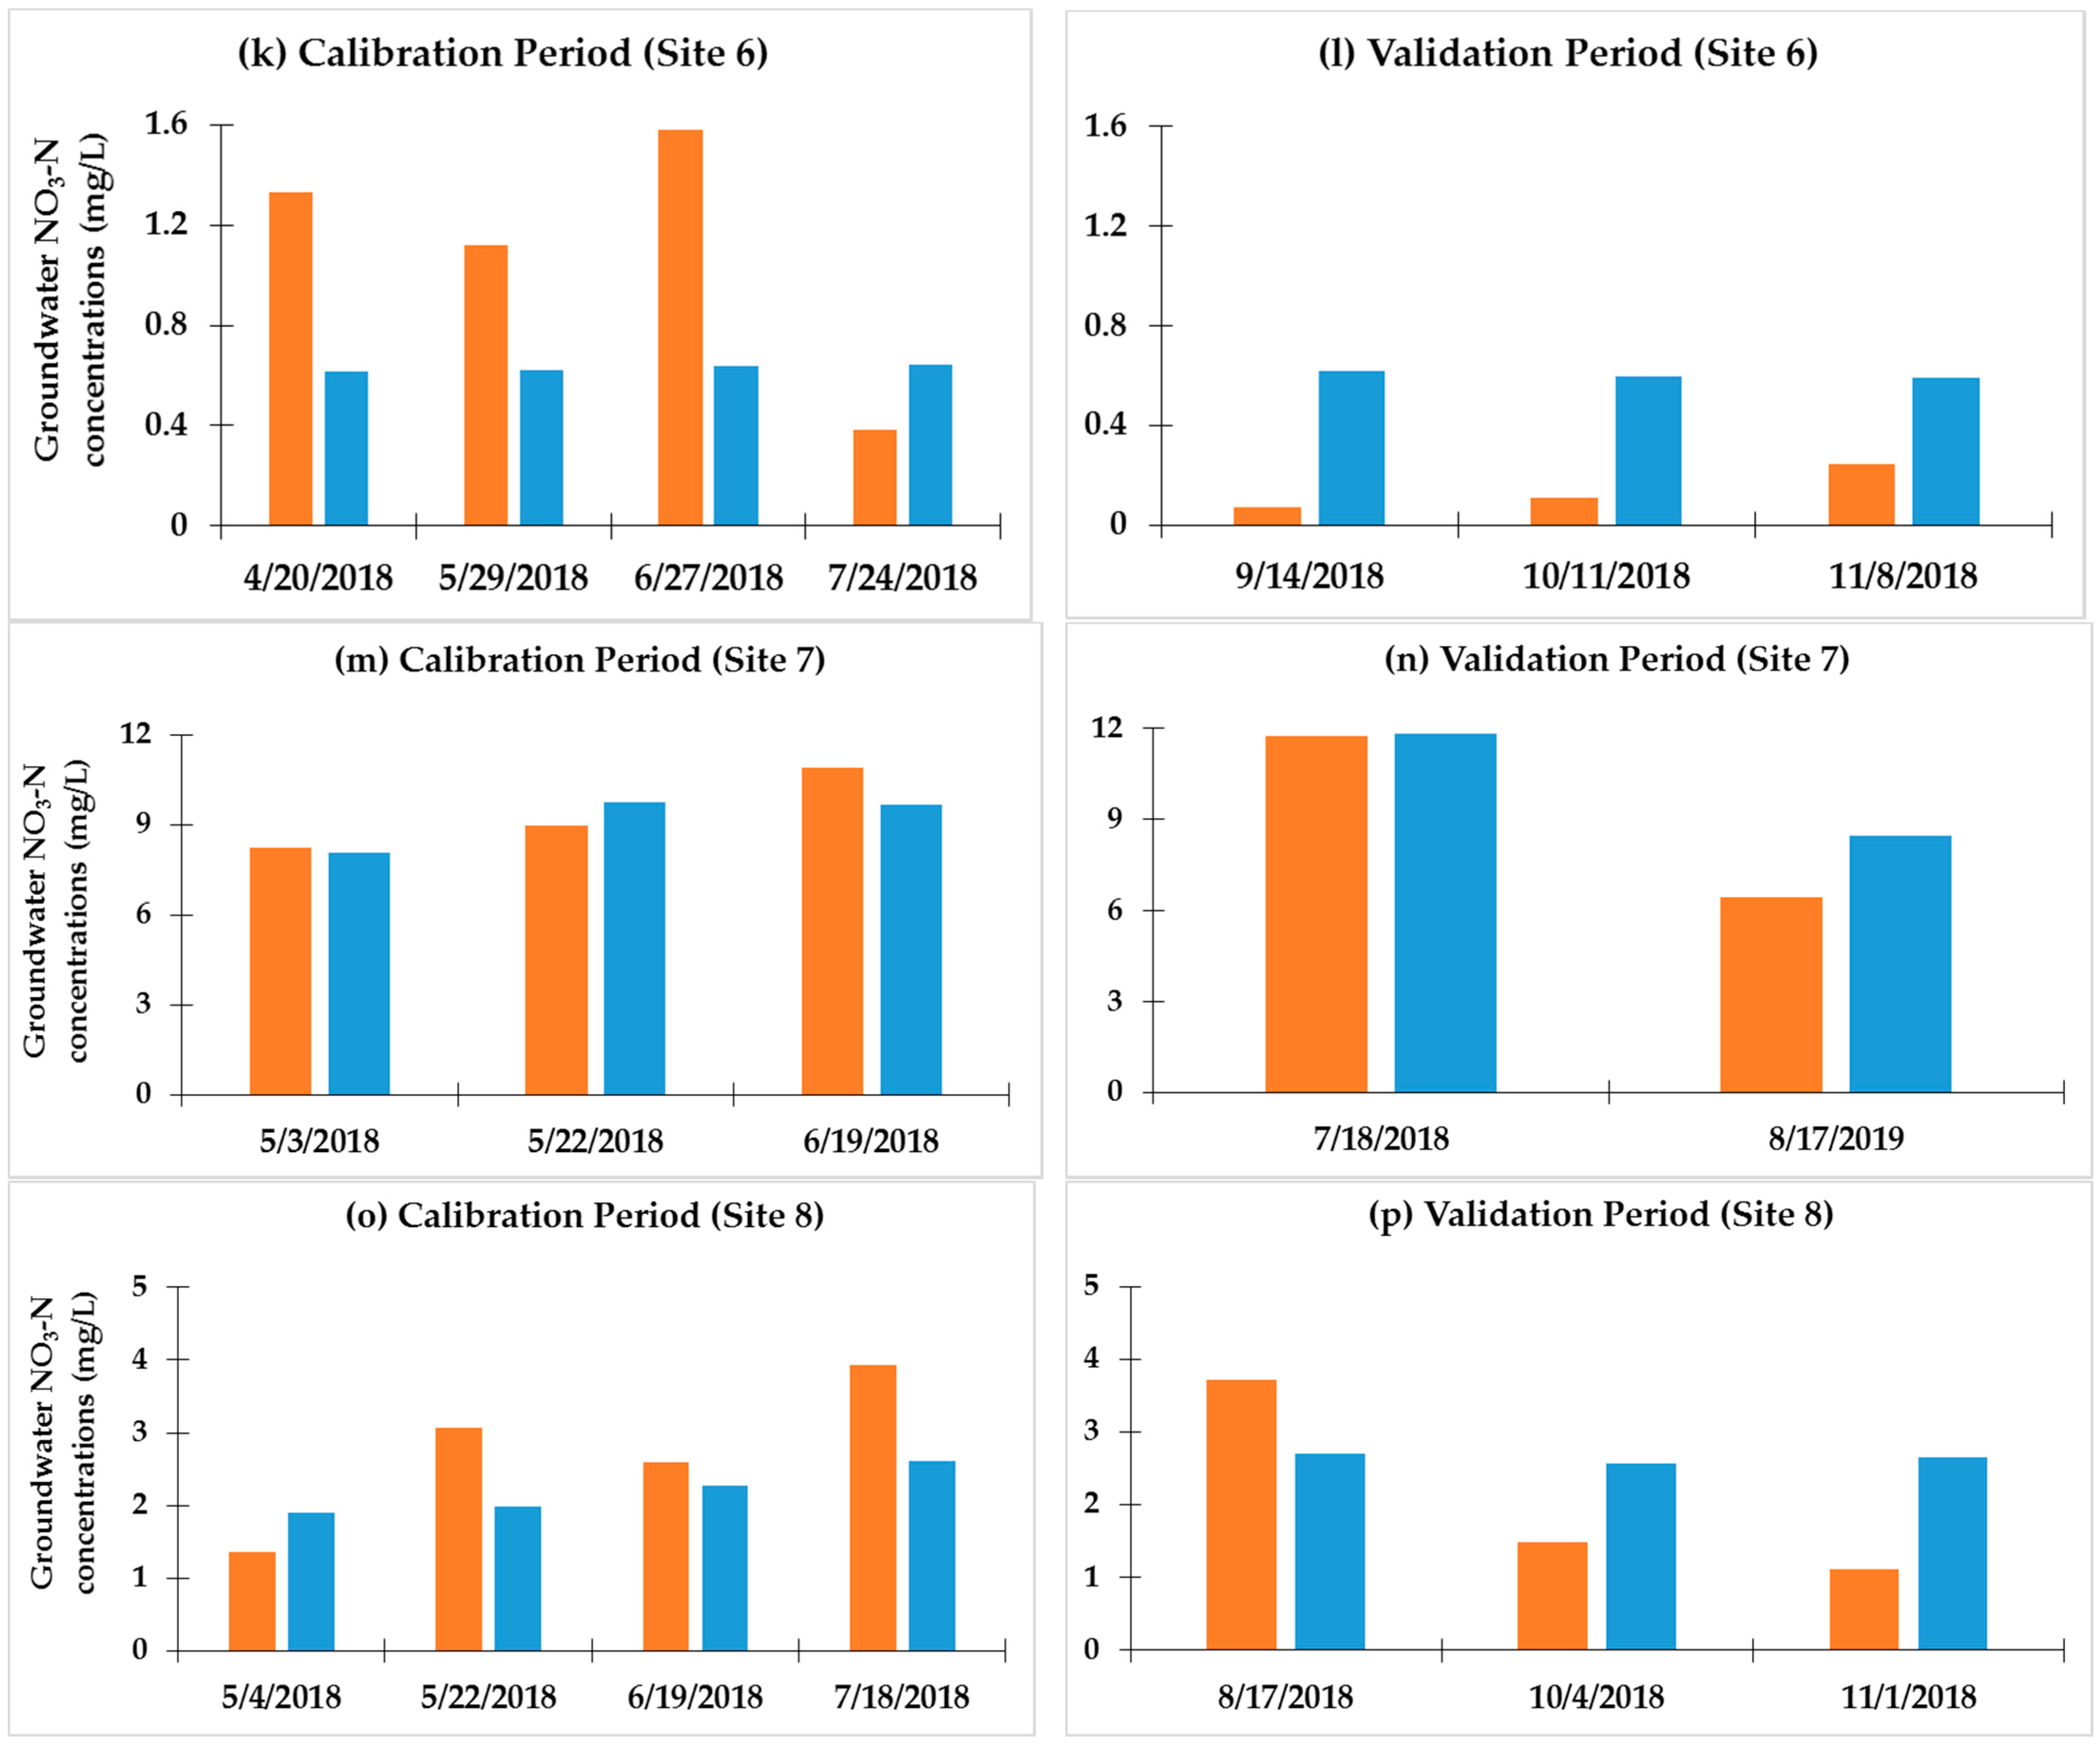
We noticed a decline in field measured and REMM simulated daily groundwater NO3-N concentrations in Zone 1 coming from the field edge of Zone 3. Figure 5 presents the field measured and REMM simulated daily mean NO3-N concentration (mg/L) coming from field edge (Zone 3) to stream edge (Zone 1) for site 5, site 6, site 7, and site 8. Hence, we could obtain an estimate of percentage N-removal from Zone 3 to Zone 1. In particular, for site 5, site 6, site 7, site 8, REMM showed 4.3% increase, no change, 19.7% removal, 19.8% removal of N against actual measured 46.7% removal, 28.9% removal, 19.1% removal, and 26.6% removal of N, respectively. Due to lack of measured field edge (Zone 3) nitrate data, we could not compare the Zone 3 REMM simulated nitrate concentration for site 1–4. Yet, it can be mentioned that the REMM simulated daily mean NO3-N coming from Zone 3 to Zone 1 were 8.4 mg/L to 0.4 mg/L, 25.7 mg/L to 1.1 mg/L, 8.8 mg/L to 3.9 mg/L, and 10.9 mg/L to 1.4 mg/L for site 1, site 2, site 3, and site 4, respectively. So the approximate simulated percentage N-removal rate becomes 95.2%, 95.7%, 55.7%, and 87.2% for site 1, site 2, site 3, and site 4, respectively. It is noted that the mean value is calculated only for the simulation dates for each site. Simulated and measured daily groundwater NO3-N concentrations in Zone 1 during the calibration and validation period are shown in Figure 6 and are compared statistically using the root mean square error (RMSE), the mean absolute error (MAE), and the Willmott’s index of agreement (d). In order to measure the variability of RMSE, MAE, and d among the eight riparian sites, the interquartile range (IQR) is shown as the difference between 75th and 25th percentiles, IQR = Q3 − Q1 (Table 5).
Overall, for the calibration period, the Q1, the Q2, and the Q3 of the RMSE for groundwater NO3-N concentrations in Zone 1 were 0.50 mg/L, 0.63 mg/L, and 0.75 mg/L among the riparian sites, respectively, whereas a slightly higher value of RMSE was found for the validation period, including the Q1, the Q2, and the Q3 of the RMSE for NO3-N in Zone 1 as 0.38 mg/L, 0.65 mg/L, and 1.07 mg/L, respectively. For the calibration period, the Q1, the Q2, and the Q3 of the MAE for groundwater NO3-N concentrations in Zone 1 were 0.45 mg/L, 0.56 mg/L, and 0.68 mg/L among the riparian sites, respectively. For the validation period, the Q1, the Q2, and the Q3 of the MAE for NO3-N in Zone 1 were 0.36 mg/L, 0.61 mg/L, and 0.99 mg/L among the riparian sites, respectively. In case of Willmott’s index of agreement (d) between daily measured and simulated groundwater NO3-N concentrations, the Q1, the Q2, and the Q3 of the d for NO3-N in Zone 1 were 0.40, 0.44, and 0.60 for calibration period, respectively. Similarly, for the validation period, the first Quartile (Q1), the second Quartile or median (Q2), and the third Quartile (Q3) of the d for WTDs in Zone 1 was 0.17, 0.52, and 0.65, respectively. The value of d was within the acceptable limit between 0 and 1 for both calibration and validation periods.

3.3. Parameter Sensitivity Analysis for Water Table Depths and Groundwater NO3-N Concentrations Simulation

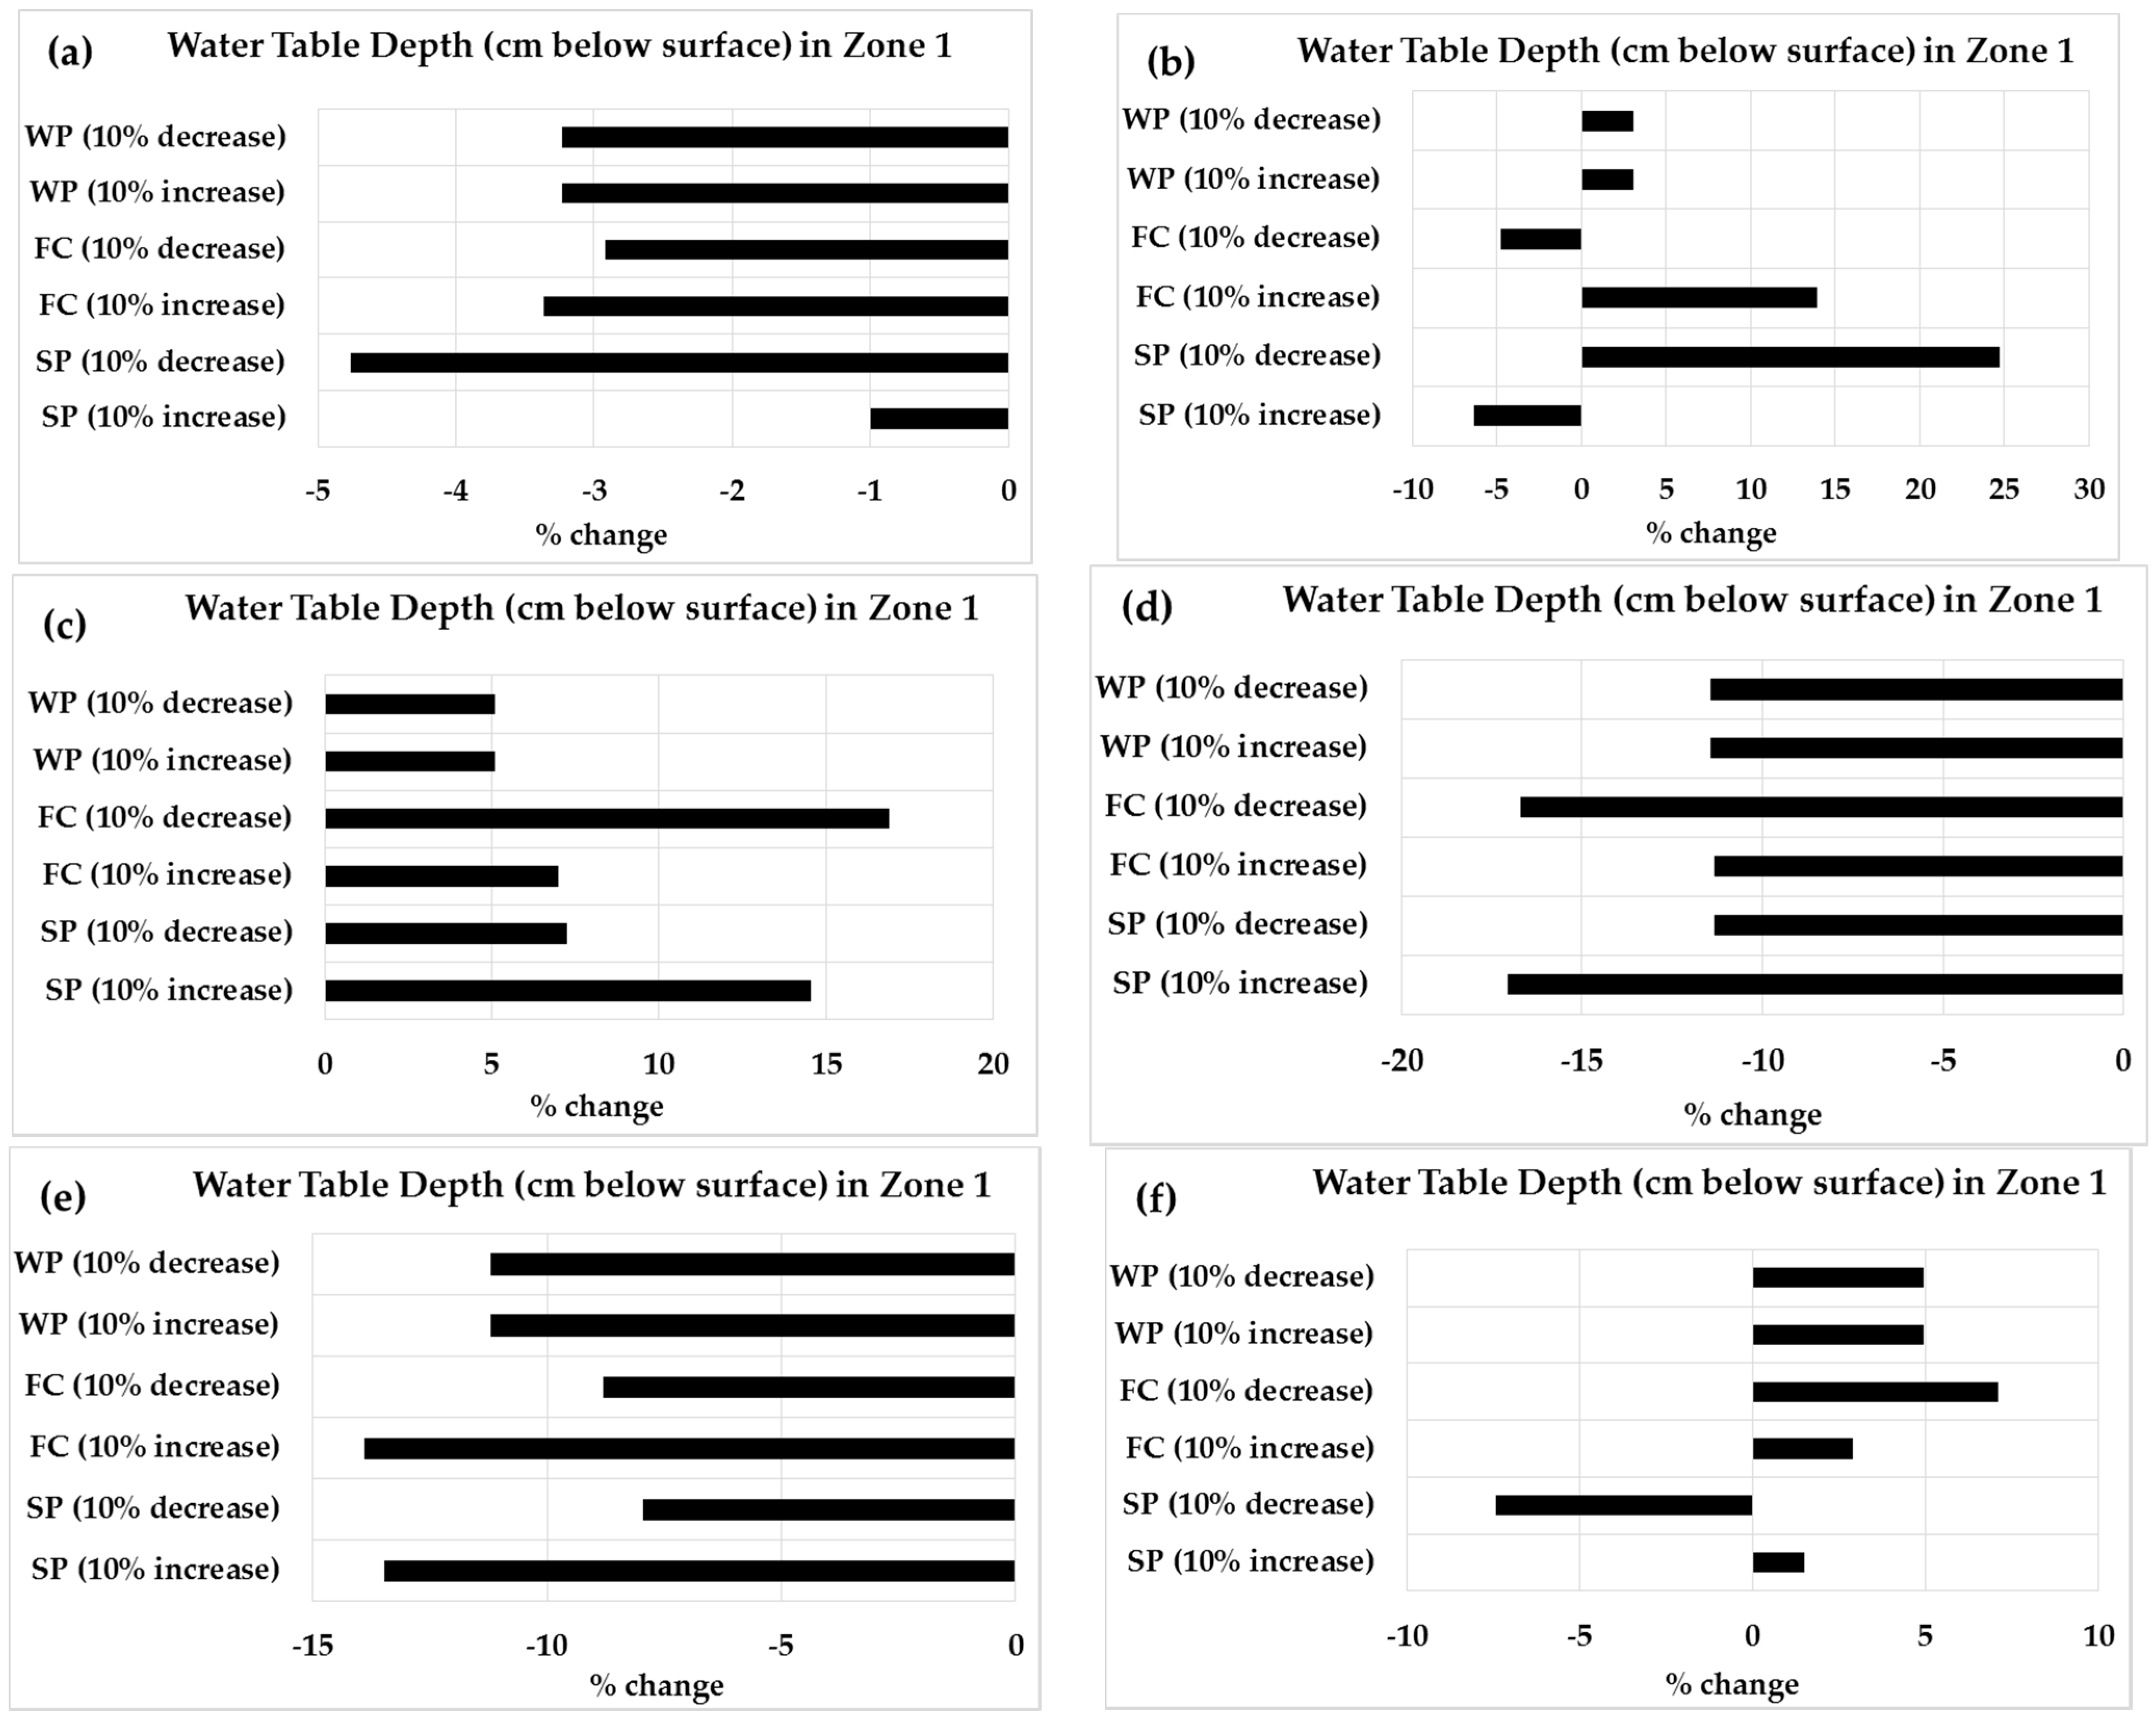
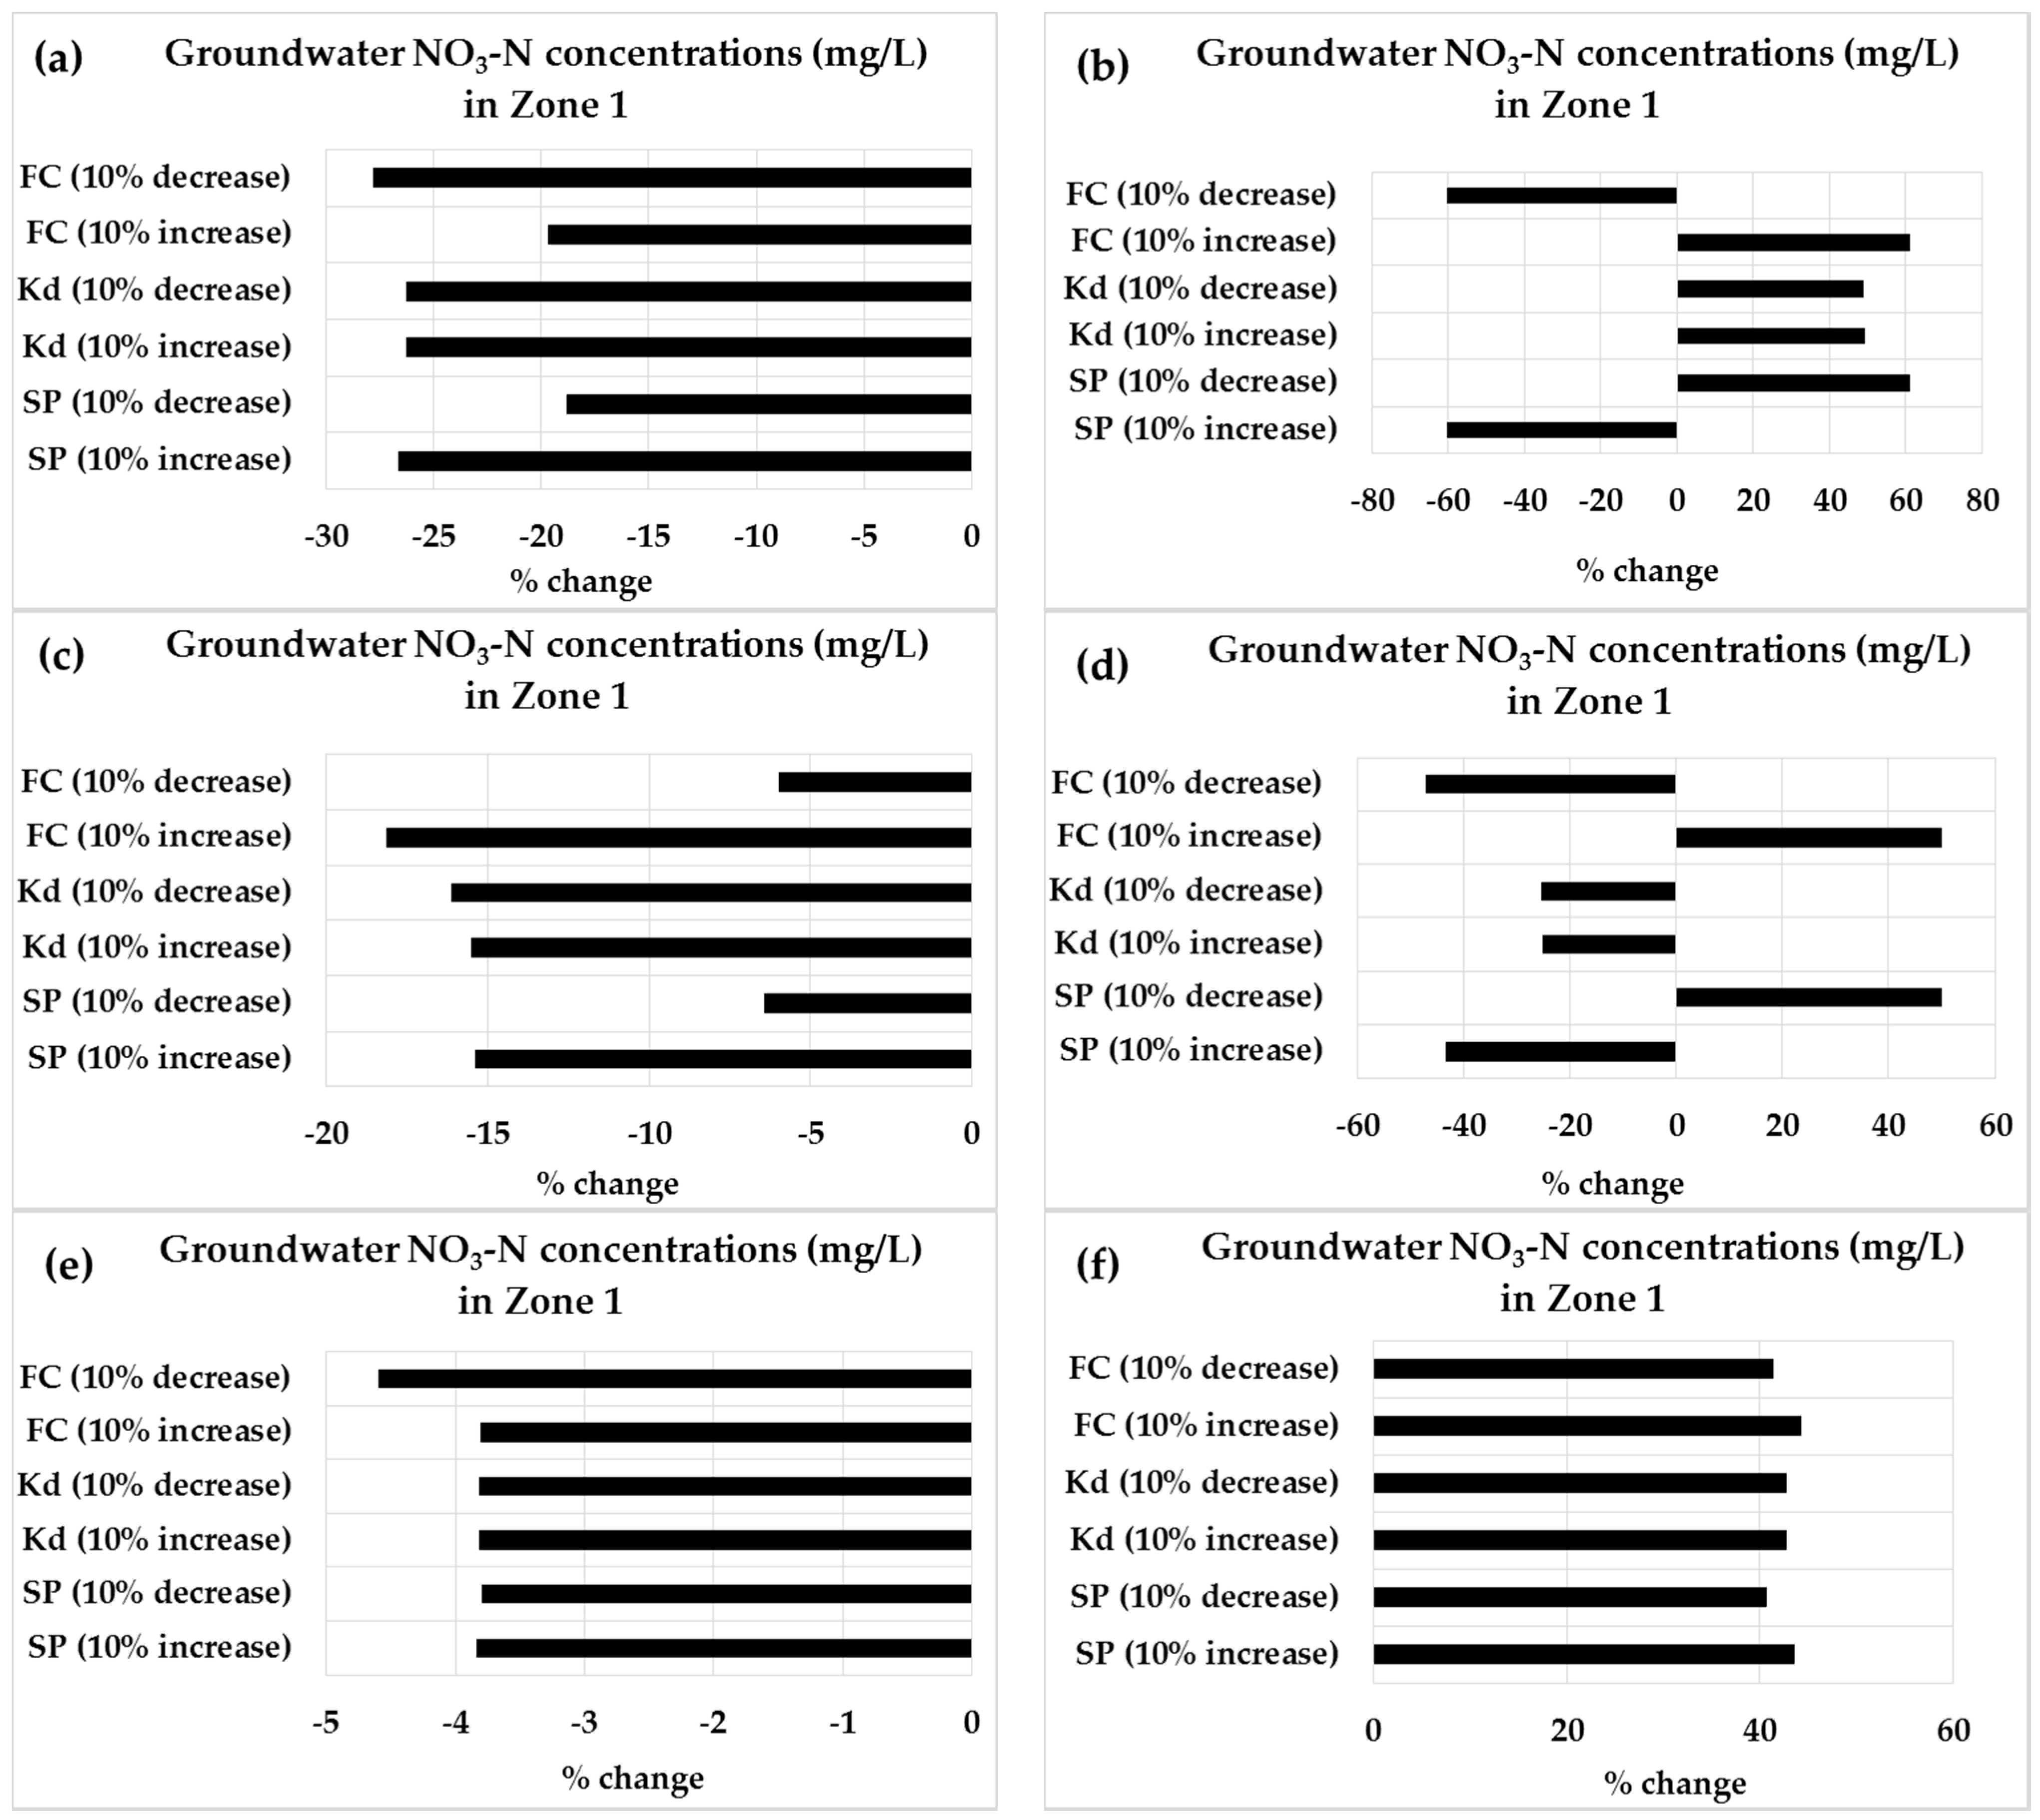
The sensitivity analysis indicated that simulated predictions of Water Table Depths and groundwater NO3-N concentrations could be very sensitive to selected soil physical properties and the denitrification rate constant, respectively. Change in soil porosity caused the greatest change in WTD in all the sites except Site 3 and Site 5 (where change in field capacity caused slightly higher percentage change in WTD than that caused by change in soil porosity; Figure 7). Several of the sites did not exhibit >±10% in response to a 10% change in the input parameters.
In Figure 8, the percentage change in daily average groundwater NO3-N concentrations from initial for calibration period is shown to be due to corresponding parameter change. Not only change in soil porosity and field capacity but also change in the denitrification rate constant, Kd greatly affected modeled denitrification and simulated and measured NO3-N concentrations.

4. Discussion

The MAE between measured and simulated daily WTDs is comparable to the average absolute error of 14 to 36 cm achieved in two previous REMM modeling studies using three to five years of field data from a riparian site in Georgia [12] and two sites in North Carolina [33,34]. The Willmott’s index of agreement (d) can be compared to the same statistic found in [33], as 0.72 to 0.92 (yearly scale). In more than 50% of the calibrations and validations, the value of d was greater than 0.5, indicating good agreement with measured data.
The simulated WTDs generally followed seasonal patterns (deeper during drier months, June to November and rising to the surface during wet months, December to May) of measured WTDs for all the sites. As for sites 1–4, REMM simulated WTDs were not under-predicted or over-predicted in a constant manner throughout the entire study period. Conversely and relatively, sites 5–8 showed a particular pattern. At site 5 and site 8, REMM over-predicted the WTDs than the measured from the late spring to summer while under-predicted from late summer to fall season. On the other hand, REMM over-predicted the summer WTDs than the measured but under-predicted the fall WTDs at site 6 and site 7. However, there were some discrepancies between simulated and measured WTDs during some time periods as a result of the spatial variability in rainfall between sites and the considered PRISM climate station, overestimation of ET by model etc. Summer field conditions were modified by irrigation of the uplands at sites 7 and 8. During field sampling, sites 5 and 6 were in unirrigated hay production (with deeper roots systems than turf). As a result, the daily water table depths were significantly deeper at sites 5 and 6 compared to other six sites.
The RMSE between measured and simulated daily groundwater NO3-N concentrations is comparable relatively to the 1.05 to 1.50 mg/L obtained in the field testing study using 5 years of data from a riparian site in North Carolina Coastal Plain [33]. The range of d is also close (0.34 to 0.68) to what was found by [33] from their study on the North Carolina Coastal Plain. The mean absolute error (MAE) for NO3-N concentrations in Zone 1 for calibration and validation periods was reasonably similar to the less than 1 mg/L of absolute error found by [15]. The difference between measured and simulated NO3-N concentrations during some time periods was most likely due to the low frequency of field data collection. This was caused by dry groundwater wells, especially during the summer months, and submergence of one of the groundwater wells in the river during heavy rainfall in November 2018. These constraints resulted in a lower Willmott’s index of agreement in case of Site 3, Site 4, and Site 8. In addition, in the case of Site 1, the NO3-N concentration was very low (beyond the detection limit of 0.02 mg/L) for several times, which restricted the frequency of data collection.
The sensitivity analyses showed that changes in the volumetric water content between field capacity (FC) and saturation (i.e., soil porosity) was driving the water table and denitrification dynamics. This observation is consistent with the relationships of [68] which show that percentage saturation (the percentage of water-filled pore space, as determined by water content and total porosity) is closely related to denitrification. The lower the difference between FC and soil porosity, the more the changes in water table response to precipitation events [69] and, the larger this difference, the less responsive water tables will be to infiltration—and these two parameters also influence percentage of water-filled pore space. With a high FC and low porosity, the percentage of water-filled pore space at FC might be high enough to regularly generate denitrification.
In general, the results from the sensitivity analyses demonstrated that the percentage change in WTDs (−36% to 25%) was comparatively less than that of groundwater nitrate concentration (−60% to 60%) when responding to the input parameter change (Figure 7 and Figure 8). The percentage change in WTDs was least in site 1 and site 6 (−7% to 7%) while site 2, site 7, and site 8 had the greatest percentage change in WTDs (−36% to 25%). In terms of NO3-N concentration, percentage change was the least in site 5 and site 7 (−4.5% to 3.5%) whereas site 2 and site 4 had the most percentage change (−60% to 60%).

5. Conclusions

In this study, we successfully calibrated and validated the REMM model by coupling upland inputs from a distributed model (AnnAGNPS) with field-measured hydrologic and N data from multiple buffer sites located in a formerly glaciated watershed of Rhode Island. Both the hydrologic and nutrient estimation of REMM showed that it captured well the daily measured WTDs and groundwater NO3-N concentrations in Zone 1 and in Zone 3 for the study periods. The sensitivity analyses demonstrated that changes in the volumetric water content between field capacity and saturation (soil porosity) was directing water table and denitrification dynamics.
This modeling study indicated the suitability of REMM to simulate the basic hydrologic and nutrient cycling processes happening in real-world buffers, particularly in glacial geomorphic settings (where REMM applicability has not yet been tested). The use of distributed model AnnAGNPS provided better estimates of upland inputs. The calibrated parameters and model outputs of this study establishes the base for site-specific parameters required to evaluate management and design of riparian buffers effectively in other sites of a similar setting. The site specific and design parameters are soil porosity, field capacity, wilting point, denitrification rate constant, riparian width, vegetation type, etc. The riparian zone hydrologic and nutrient quantification through REMM also contributes to keeping a check on the rates of change occurring in the essential ecological processes (water cycle, biogeochemical or nutrient cycling, the flow of energy, etc.) in ecosystems.

Supplementary Materials

The following are available online at https://www.mdpi.com/article/10.3390/agriculture11080743/s1, Table S1: Calibrated and Validated Parameters (soil physical properties) used in the REMM simulations, Table S2: Calibrated and Validated Parameter (Denitrification rate constant, Kd) for the Riparian Buffer.

Author Contributions

M.T. was responsible for the conceptualization, methodology, data processing, software, calibration, validation, formal analysis, writing—original draft preparation, and editing; S.M.P. was responsible for the conceptualization, funding acquisition, methodology, model/software supervision, and writing—review and editing; A.J.G., K.A. and P.G.V. were responsible for the conceptualization, funding acquisition, and writing—review and editing. All authors have read and agreed to the published version of the manuscript.

Funding

This study was supported by an Agriculture and Food Research Initiative (AFRI) competitive grant under the United States Department of Agriculture (USDA)—National Institute of Food and Agriculture (NIFA) (grant number 2015-67019-23586) and USDA S-1063 and S-1089 Multistate Hatch Grants.

Institutional Review Board Statement

Not applicable.

Informed Consent Statement

Authors ensure that data shared are in accordance with consent provided by participants on the use of confidential data.

Data Availability Statement

The data presented in this study are available on request from the corresponding author. The data are currently not publicly available due to the logistic reasons.

Acknowledgments

The authors would like to sincerely thank Richard R. Lowrance, USDA-Retired Ecologist, Randy G. Williams, USDA-Retired Agricultural Engineer, for supporting the execution of REMM model setup, and Ronald Bingner. USDA-ARS, National Sedimentation Laboratory, MS, USA, for the AnnAGNPS model assistance.

Conflicts of Interest

The authors declare no conflict of interest.

References

  1. Groffman, P.M.; Gold, A.J.; Addy, K. Nitrous Oxide Production in Riparian Zones and its Importance to National Emission Inventories. Chemosphere Glob. Chang. Sci. 2000, 2, 291–299. [Google Scholar] [CrossRef]
  2. Jacinthe, P.; Groffman, P.M.; Gold, A.J. Dissolved Organic Carbon Dynamics in a Riparian Aquifer: Effects of Hydrology and Nitrate Enrichment. J. Environ. Qual. 2003, 32, 1365–1374. [Google Scholar] [CrossRef]
  3. Vidon, P.; Allan, C.; Burns, D.; Duval, T.P.; Gurwick, N.; Inamdar, S.; Lowrance, R.; Okay, J.; Scott, D.; Sebestyen, S. Hot Spots and Hot Moments in Riparian Zones: Potential for Improved Water Quality Management 1. JAWRA J. Am. Water Resour. Assoc. 2010, 46, 278–298. [Google Scholar] [CrossRef]
  4. Welsch, D.J. Riparian Forest Buffers: Function and Design for Protection and Enhancement of Water Resources; US Department of Agriculture, Forest Service, Northeastern Area, State & Private Forestry: Broomall, PA, USA, 1991.
  5. Dosskey, M.G. Toward Quantifying Water Pollution Abatement in Response to Installing Buffers on Crop Land. Environ. Manag. 2001, 28, 577–598. [Google Scholar] [CrossRef] [PubMed]
  6. Kellogg, D.Q.; Gold, A.J.; Cox, S.; Addy, K.; August, P.V. A Geospatial Approach for Assessing Denitrification Sinks within Lower-Order Catchments. Ecol. Eng. 2010, 36, 1596–1606. [Google Scholar] [CrossRef]
  7. Gold, A.J.; Groffman, P.M.; Addy, K.; Kellogg, D.Q.; Stolt, M.; Rosenblatt, A.E. Landscape Attributes as Controls on Groithd Water Nitrate Removal Capacity of Riparian Zones 1. JAWRA J. Am. Water Resour. Assoc. 2001, 37, 1457–1464. [Google Scholar] [CrossRef]
  8. Hill, A.R. Stream Chemistry and Riparian Zones. In Streams Ground Waters; Jones, J.B., Mulholland, P.J., Eds.; Academic Press: San Diego, CA, USA, 2000; pp. 83–110. [Google Scholar]
  9. Lowrance, R.; Altier, L.S.; Newbold, J.D.; Schnabel, R.R.; Groffman, P.M.; Denver, J.M.; Correll, D.L.; Gilliam, J.W.; Robinson, J.L.; Brinsfield, R.B. Water Quality Functions of Riparian Forest Buffers in Chesapeake Bay Watersheds. Environ. Manag. 1997, 21, 687–712. [Google Scholar] [CrossRef]
  10. Vidon, P.G.; Hill, A.R. Landscape Controls on Nitrate Removal in Stream Riparian Zones. Water Resour. Res. 2004, 40, 1–14. [Google Scholar] [CrossRef] [Green Version]
  11. Kellogg, D.Q.; Gold, A.J.; Groffman, P.M.; Addy, K.; Stolt, M.H.; Blazejewski, G. In Situ Ground Water Denitrification in Stratified, Permeable Soils Underlying Riparian Wetlands. J. Environ. Qual. 2005, 34, 524–533. [Google Scholar] [CrossRef] [PubMed]
  12. Inamdar, S.P.; Sheridan, J.M.; Williams, R.G.; Bosch, D.D.; Lowrance, R.R.; Altier, L.S.; Thomas, D.L. Riparian Ecosystem Management Model (REMM): I. Testing of the Hydrologic Component for a Coastal Plain Riparian System. Trans. ASAE 1999, 42, 1679–1690. [Google Scholar] [CrossRef]
  13. Rosenblatt, A.E.; Gold, A.J.; Stolt, M.H.; Groffman, P.M.; Kellogg, D.Q. Identifying Riparian Sinks for Watershed Nitrate using Soil Surveys. J. Environ. Qual. 2001, 30, 1596–1604. [Google Scholar] [CrossRef] [PubMed]
  14. Vidon, P.G.; Hill, A.R. A Landscape-based Approach to Estimate Riparian Hydrological and Nitrate Removal Functions 1. JAWRA J. Am. Water Resour. Assoc. 2006, 42, 1099–1112. [Google Scholar] [CrossRef]
  15. Lowrance, R.; Altier, L.S.; Williams, R.G.; Inamdar, S.P.; Sheridan, J.M.; Bosch, D.D.; Hubbard, R.K.; Thomas, D.L. REMM: The Riparian Ecosystem Management Model. J. Soil Water Conserv. 2000, 55, 27–34. [Google Scholar]
  16. Altier, L.S.; Lowrance, R.; Williams, R.G.; Inamdar, S.P.; Bosch, D.D.; Sheridan, J.M.; Hubbard, R.K.; Thomas, D.L. Riparian Ecosystem Management Model: Simulator for Ecological Processes in Riparian Zones. Conserv. Res. Rep. 2002, 46, 1691. [Google Scholar]
  17. Mayer, P.M.; Reynolds, S.K., Jr.; McCutchen, M.D.; Canfield, T.J. Meta-analysis of Nitrogen Removal in Riparian Buffers. J. Environ. Qual. 2007, 36, 1172–1180. [Google Scholar] [CrossRef] [PubMed]
  18. Hassanzadeh, Y.T.; Vidon, P.G.; Gold, A.J.; Pradhanang, S.M.; Addy Lowder, K. RZ-TRADEOFF: A New Model to Estimate Riparian Water and Air Quality Functions. Water 2019, 11, 769. [Google Scholar] [CrossRef] [Green Version]
  19. Hassanzadeh, Y.T.; Vidon, P.G.; Gold, A.J.; Pradhanang, S.M.; Addy, K. A New Approach to Generalizing Riparian Water and Air Quality Function Across Regions. Environ. Monit. Assess. 2019, 191, 1–12. [Google Scholar] [CrossRef]
  20. Alberta Environment. Stepping Back from the Water: A Beneficial Management Practices Guide for New Development Near Water Bodies in Alberta’s Settled Region. 2012. Available online: http://environment.gov.ab.ca/info/library/8554.pdf (accessed on 16 January 2017).
  21. Santangelo, T. Development of a Spatially Distributed Model for Estimating Nitrogen Removal in Forested Riparian Buffers. Master’s Thesis, University of Delaware, Newark, DE, USA, 2016. [Google Scholar]
  22. Dwivedi, D.; Arora, B.; Steefel, C.I.; Dafflon, B.; Versteeg, R. Hot Spots and Hot Moments of Nitrogen in a Riparian Corridor. Water Resour. Res. 2018, 54, 205–222. [Google Scholar] [CrossRef]
  23. Dosskey, M.G.; Qiu, Z. Comparison of Indexes for Prioritizing Placement of Water Quality Buffers in Agricultural Watersheds 1. JAWRA J. Am. Water Resour. Assoc. 2011, 47, 662–671. [Google Scholar] [CrossRef]
  24. Hill, A.R.; Devito, K.J.; Vidon, P.G. Long-Term Nitrate Removal in a Stream Riparian Zone. Biogeochemistry 2014, 121, 425–439. [Google Scholar] [CrossRef]
  25. Baker, M.E.; Wiley, M.J.; Seelbach, P.W. Gis-based Hyirologic Modeling of Riparian Areas: Implications for Stream Water Quality 1. JAWRA J. Am. Water Resour. Assoc. 2001, 37, 1615–1628. [Google Scholar] [CrossRef]
  26. Groh, T.A.; Isenhart, T.M.; Schultz, R.C. Long-Term Nitrate Removal in Three Riparian Buffers: 21 Years of Data from the Bear Creek Watershed in Central Iowa, USA. Sci. Total. Environ. 2020, 740, 140114. [Google Scholar] [CrossRef]
  27. Hill, A.R. Nitrate Removal in Stream Riparian Zones. J. Environ. Qual. 1996, 25, 743–755. [Google Scholar] [CrossRef]
  28. Groffman, P.M.; Gold, A.J.; Simmons, R.C. Nitrate Dynamics in Riparian Forests: Microbial Studies. J. Environ. Qual. 1992, 21, 666–671. [Google Scholar] [CrossRef] [Green Version]
  29. Graff, C.D.; Sadeghi, A.M.; Lowrance, R.R.; Williams, R.G. Quantifying the Sensitivity of the Riparian Ecosystem Management Model (REMM) to Changes in Climate and Buffer Characteristics Common to Conservation Practices. Trans. ASAE 2005, 48, 1377–1387. [Google Scholar] [CrossRef]
  30. Allison, B.E.; Fatula, S.M.; Wolanski, D.P. Evaluating Riparian Buffers for Nonpoint Source Pollution Control in an Urban Setting using the Riparian Ecosystem Management Model, REMM. In Hydrology and Management of Forested Wetlands, Proceedings of the International Conference, New Bern, NC, USA, 8–12 April 2006; American Society of Agricultural & Biological Engineers: St. Joseph, MI, USA, 2006; p. 18. [Google Scholar]
  31. Langendoen, E.J.; Richard Lowrance, R.; Simon, A. Assessing the Impact of Riparian Processes on Streambank Stability. Ecohydrol. Ecosyst. Land Water Process. Interact. Ecohydrogeomorphol. 2009, 2, 360–369. [Google Scholar] [CrossRef]
  32. Tilak, A.S.; Youssef, M.A.; Burchell, M.R., II; Lowrance, R.R.; Williams, R.G. Testing the Riparian Ecosystem Management Model (REMM) on a Riparian Buffer with Dilution from Deep Groundwater. Trans. ASABE 2017, 60, 377–392. [Google Scholar]
  33. Tilak, A.S.; Burchell, M.R.; Youssef, M.A.; Lowrance, R.R.; Williams, R.G. Field Testing the Riparian Ecosystem Management Model on a Riparian Buffer in the North Carolina Upper Coastal Plain. JAWRA J. Am. Water Resour. Assoc. 2014, 50, 665–682. [Google Scholar] [CrossRef]
  34. Dukes, M.D.; Evans, R.O. Riparian ecosystem management model: Hydrology performance and sensitivity in the North Carolina middle coastal plain. Trans. ASAE 2003, 46, 1567. [Google Scholar] [CrossRef]
  35. Inamdar, S.P.; Lowrance, R.R.; Altier, L.S.; Williams, R.G.; Hubbard, R.K. Riparian Ecosystem Management Model (REMM): II. Testing of the Water Quality and Nutrient Cycling Component for a Coastal Plain Riparian System. Trans. ASAE 1999, 42, 1691–1707. [Google Scholar] [CrossRef]
  36. Bhat, S.; Hatfield, K.; Jacobs, J.M.; Lowrance, R.; Williams, R. Surface Runoff Contribution of Nitrogen during Storm Events in a Forested Watershed. Biogeochemistry 2007, 85, 253–262. [Google Scholar] [CrossRef]
  37. Todd, A.H. Riparian Ecosystems and Buffers: Working at the Water’s Edge. Water Resour. IMPACT 2008, 10, 3–5. [Google Scholar]
  38. Williams, C.O.; Lowrance, R.; Potter, T.; Bosch, D.D.; Strickland, T. Atrazine Transport within a Coastal Zone in Southeastern Puerto Rico: A Sensitivity Analysis of an Agricultural Field Model and Riparian Zone Management Model. Environ. Model. Assess. 2016, 21, 751–761. [Google Scholar] [CrossRef] [Green Version]
  39. Zhang, C.; Li, S.; Qi, J.; Xing, Z.; Meng, F. Assessing Impacts of Riparian Buffer Zones on Sediment and Nutrient Loadings into Streams at Watershed Scale using an Integrated REMM-SWAT Model. Hydrol. Process. 2017, 31, 916–924. [Google Scholar] [CrossRef]
  40. Liu, C.; Wu, J.; Clausen, J.; Yang, X. Assessment of the Effects of Riparian Buffer Zones on the Water Quality in the Jinghe Catchment using the AnnAGNPS and REMM Models. In Proceedings of the ASABE Annual International Meeting, Washington, DC, USA, 16–19 July 2017; American Society of Agricultural & Biological Engineers: St. Joseph, MI, USA; p. 1. [Google Scholar]
  41. Cartographic Boundary Files. Available online: https://www.census.gov/geographies/mapping-files/time-series/geo/carto-boundary-file.html (accessed on 6 October 2015).
  42. Rivers and Streams: RI Integrated Water Quality Monitoring Assessment 2012. Available online: https://www.rigis.org/datasets/rivers-and-streams-ri-integrated-water-quality-monitoring-assessment-2012/explore?location=41.593807%2C-71.483873%2C9.85 (accessed on 3 January 2017).
  43. Johnson, T.E.; McNair, J.N.; Srivastava, P.; Hart, D.D. Stream Ecosystem Responses to Spatially Variable Land Cover: An Empirically Based Model for Developing Riparian Restoration Strategies. Freshwat. Biol. 2007, 52, 680–695. [Google Scholar] [CrossRef]
  44. Yongping, Y.; Bingner, R.; Williams, R.; Lowrance, R.; Bosch, D.; Sheridan, J. Integration of the models of AnnAGNPS and REMM to assess riparian buffer system for sediment reduction. Int. J. Sediment Res. 2007, 22, 60–69. [Google Scholar]
  45. Tamanna, M.; Pradhanang, S.M.; Gold, A.J.; Addy, K.; Vidon, P.G.; Bingner, R.L. Evaluation of AnnAGNPS Model for Runoff Simulation on Watersheds from Glaciated Landscape of USA Midwest and Northeast. Water 2020, 12, 3525. [Google Scholar] [CrossRef]
  46. Bingner, R.L.; Theurer, F.D. AnnAGNPS: Estimating Sediment Yield by Particle Size for Sheet and Rill Erosion. In Proceedings of the 7th Interagency Sedimentation Conference, Reno, NV, USA, 25–29 March 2001. [Google Scholar]
  47. Geter, W.F.; Theurer, F.D. AnnAGNPS-RUSLE Sheet and Rill Erosion. In Proceedings of the First Federal Interagency Hydrologic Modeling Conference, Las Vegas, NV, USA, 19–23 April 1998; pp. 19–23. [Google Scholar]
  48. Parajuli, P.B.; Nelson, N.O.; Frees, L.D.; Mankin, K.R. Comparison of AnnAGNPS and SWAT Model Simulation Results in USDA-CEAP Agricultural Watersheds in South-central Kansas. Hydrol. Process. Int. J. 2009, 23, 748–763. [Google Scholar] [CrossRef]
  49. Pradhanang, S.M. Monitoring and Modeling of Water Quality in Streams of Skaneateles Lake Watershed, NY. Ph.D. Thesis, State University of New York College of Environmental Science and Forestry, New York, NY, USA, 2010. [Google Scholar]
  50. Pradhanang, S.M.; Briggs, R.D. Effects of Critical Source Area on Sediment Yield and Streamflow. Water Environ. J. 2014, 28, 222–232. [Google Scholar] [CrossRef]
  51. TNM Download (vs.2.0). Available online: https://apps.nationalmap.gov/downloader/#/ (accessed on 24 January 2017).
  52. USDA Natutal Resources Conservation Service Soils. Available online: https://www.nrcs.usda.gov/wps/portal/nrcs/detail/soils/survey/tools/?cid=nrcseprd1407024 (accessed on 7 February 2017).
  53. National Land Cover Database. Available online: https://www.usgs.gov/centers/eros/science/national-land-cover-database?qt-science_center_objects=0#qt-science_center_objects (accessed on 7 February 2017).
  54. Dile, Y.T.; Srinivasan, R. Evaluation of CFSR Climate Data for Hydrologic Prediction in Data-scarce Watersheds: An Application in the Blue Nile River Basin. JAWRA J. Am. Water Resour. Assoc. 2014, 50, 1226–1241. [Google Scholar] [CrossRef]
  55. Fuka, D.R.; Walter, M.T.; MacAlister, C.; Degaetano, A.T.; Steenhuis, T.S.; Easton, Z.M. Using the Climate Forecast System Reanalysis as Weather Input Data for Watershed Models. Hydrol. Process. 2014, 28, 5613–5623. [Google Scholar] [CrossRef]
  56. Kim, I.; Hutchinson, S.L.; Hutchinson, J.S.; Young, C.B. Riparian Ecosystem Management Model: Sensitivity to Soil, Vegetation, and Weather Input Parameters 1. JAWRA J. Am. Water Resour. Assoc. 2007, 43, 1171–1182. [Google Scholar] [CrossRef]
  57. Southeast Watershed Research: Tifton, GA. Available online: https://www.ars.usda.gov/southeast-area/tifton-ga/southeast-watershed-research/research/models/remm-model/user-manual/ (accessed on 18 July 2016).
  58. Watson, T.K.; Kellogg, D.Q.; Addy, K.; Gold, A.J.; Stolt, M.H.; Donohue, S.W.; Groffman, P.M. Groundwater Denitrification Capacity of Riparian Zones in Suburban and Agricultural Watersheds 1. JAWRA J. Am. Water Resour. Assoc. 2010, 46, 237–245. [Google Scholar] [CrossRef]
  59. Addy, K.; Kellogg, D.Q.; Gold, A.J.; Groffman, P.M.; Ferendo, G.; Sawyer, C. In Situ Push–pull Method to Determine Ground Water Denitrification in Riparian Zones. J. Environ. Qual. 2002, 31, 1017–1024. [Google Scholar] [CrossRef] [Green Version]
  60. Tiedje, J.M. Denitrification. In Methods of Soil Analysis. Part 2: Chemical and Microbiological Properties; Page, A.L., Ed.; Agronomy Monographs Series; American Society of Agronomy: Madison, WI, USA, 1982; pp. 1011–1026. [Google Scholar]
  61. Nelson, W.M.; Gold, A.J.; Groffman, P.M. Spatial and Temporal Variation in Groundwater Nitrate Removal in a Riparian Forest. J. Environ. Qual. 1995, 24, 691–699. [Google Scholar] [CrossRef] [Green Version]
  62. Vidon, P.; Dosskey, M.G. Testing a Simple Field Method for Assessing Nitrate Removal in Riparian Zones 1. JAWRA J. Am. Water Resour. Assoc. 2008, 44, 523–534. [Google Scholar] [CrossRef] [Green Version]
  63. Willmott, C.J. Some Comments on the Evaluation of Model Performance. Bull. Am. Meteorol. Soc. 1982, 63, 1309–1313. [Google Scholar] [CrossRef] [Green Version]
  64. Tilak, A.S. Modeling Groundwater Hydrology and Nitrate-Nitrogen (NO3-N) Dynamics of Two Riparian Buffers Located in the Upper Eastern Coastal Plain of North Carolina Using Riparian Ecosystem Management Model (REMM). Ph.D. Thesis, North Carolina State University, Raleigh, NC, USA, 2012. [Google Scholar]
  65. Morris, M.D. Factorial sampling plans for preliminary computational experiments. Technometrics 1991, 33, 161–174. [Google Scholar] [CrossRef]
  66. Tucker, M.A.; Thomas, D.L.; Bosch, D.D.; Vellidis, G. GIS-based coupling of GLEAMS and REMM hydrology: I. Development and sensitivity. Trans. ASAE 2000, 43, 1525. [Google Scholar] [CrossRef]
  67. Tucker, M.A.; Thomas, D.L.; Bosch, D.D.; Vellidis, G. GIS-based coupling of GLEAMS and REMM hydrology: II. Field test results. Trans. ASAE 2000, 43, 1535. [Google Scholar] [CrossRef]
  68. Linn, D.M.; Doran, J.W. Effect of water-filled pore space on carbon dioxide and nitrous oxide production in tilled and nontilled soils. Soil Sci. Soc. Am. J. 1984, 48, 1267–1272. [Google Scholar] [CrossRef] [Green Version]
  69. Heliotis, F.D.; DeWitt, C.B. Rapid water table responses to rainfall in a northern peatland ecosystem. JAWRA J. Am. Water Resour. Assoc. 1987, 23, 1011–1016. [Google Scholar] [CrossRef]
Figure 1. Location of Riparian Sites in upper Pawcatuck River Watershed, Rhode Island (Dataset Sources: USA States Shapefile was obtained from United States Census Bureau via their cartographic boundary files—shapefiles [41]; stream lines—shapefile was downloaded from open source Rhode Island Geographic Information System [42]; Pawcatuck River Watershed boundary was generated by a subset of TOPAZ, TOPAGNPS (the set of TOPAZ modules used for AGNPS)).
Agriculture 11 00743 g001
Figure 2. Cross-section of riparian buffer system at all the sites as simulated in REMM.
Agriculture 11 00743 g002
Figure 3. Measured and simulated daily mean WTD (cm below surface) coming from field edge (Zone 3) to stream edge (Zone 1) for site 5, site 6, site 7, and site 8 (mean is calculated for the simulation period specific to each site).
Agriculture 11 00743 g003
Figure 4. (ap) Measured and Simulated WTDs in Zone 1 of the Buffer during the Calibration and Validation Period for eight riparian sites (Site 1, Site 2, Site 3, Site 4, Site 5, Site 6, Site 7, Site 8).
Agriculture 11 00743 g004aAgriculture 11 00743 g004bAgriculture 11 00743 g004c
Figure 5. Measured and simulated daily mean nitrate concentration (mg/L) coming from field edge (Zone 3) to stream edge (Zone 1) for site 5, site 6, site 7, and site 8 (mean is calculated for the simulation period specific to each site).
Agriculture 11 00743 g005
Figure 6. (ap) Measured and Simulated Groundwater NO3-N concentrations in Zone 1 of the Buffer during the Calibration and Validation Period for eight riparian sites (Site 1, Site 2, Site 3, Site 4, Site 5, Site 6, Site 7, Site 8).
Agriculture 11 00743 g006aAgriculture 11 00743 g006bAgriculture 11 00743 g006c
Figure 7. Parameter Sensitivity Analysis for Water Table Depths Simulation in Zone 1 of the Buffer for (a) Site 1, (b) Site 2, (c) Site 3, (d) Site 4, (e) Site 5, (f) Site 6, (g) Site 7 and (h) Site 8. WP = Wilting Point in Z1L1; FC = Field Capacity in Z1L1; SP = Soil Porosity in Z1L1; Z1L1 = Zone 1 Soil Layer 1.
Agriculture 11 00743 g007aAgriculture 11 00743 g007b
Figure 8. Parameter Sensitivity Analysis for Groundwater NO3-N concentrations Simulation in Zone 1 of the Buffer for (a) Site 1, (b) Site 2, (c) Site 3, (d) Site 4, (e) Site 5, (f) Site 6, (g) Site 7 and (h) Site 8. FC = Field Capacity in Z1L1; SP = Soil Porosity in Z1L1; Kd = Denitrification rate constant; Z1L1 = Zone 1 Soil Layer 1.
Agriculture 11 00743 g008aAgriculture 11 00743 g008b
Table 1. Upland Characteristics for Riparian Sites.
Riparian SiteGeologySoilLand Cover
Site 1OutwashSandy loamAgricultural
Site 2OutwashSandy loamForested
Site 3OutwashSandy loamAgricultural
Site 4OutwashSandy loamAgricultural
Site 5OutwashSandy loamAgricultural
Site 6OutwashSandy loamAgricultural
Site 7OutwashSandy loamAgricultural
Site 8OutwashSandy loamAgricultural
Table 2. Site Characteristics of the modeled Buffer.
Riparian SiteBuffer Area (m2)Buffer Length (m)Riparian Zone Width (3,2, and 1) (m)Zone Slope (%)Manning’s n for Zone (3,2, and 1)Soil (Zone 1)Soil Drainage Class
(Zone 1)
Geomorphology
Site 110,000100100 (33, 35, 32)<3(0.046, 0.046, 0.046)Sandy, mesic Aeric Endoaqueptsomewhat poorly drainedOutwash
Site 2120010012 (4, 5, 3)<3(0.074, 0.074, 0.012)Sandy, mesic Terric Haplosapristsomewhat poorly drained to very poorly drainedOutwash
Site 3600010060 (20, 20, 20)<3(0.074, 0.074, 0.074)Coarse-loamy Fluvaquentic Humaqueptvery poorly drainedAlluvium
Site 4650010065 (21.67, 21.67, 21.67)<3(0.074, 0.074, 0.012)Sandy Typic Humaqueptvery poorly drainedAlluvium
Site 5330010033 (11, 11, 11)<3(0.046, 0.046, 0.046)Coarse-loamy Fluvaquentic Humaqueptvery poorly drainedOutwash
Site 6375010037.5 (12.5, 12.5, 12.5)<3(0.046, 0.046, 0.046)Sandy, mesic Terric Haplosapristsomewhat poorly drained to very poorly drainedOutwash
Site 7580010058 (19.33, 19.33, 19.33)<3(0.046, 0.046, 0.046)Sandy, mesic Terric Haplosapristsomewhat poorly drained to very poorly drainedOutwash
Site 815,600100156 (52, 52, 52)<3(0.046, 0.046, 0.046)Sandy, mesic Terric Haplosapristsomewhat poorly drained tovery poorly drainedOutwash
Table 3. Calibration and Validation Period for WTDs and Groundwater NO3-N concentrations in Zone 1 for all Riparian Sites.
WTD Simulation Period (mm/dd/yy)NO3-N Simulation Period (mm/dd/yy)
CalibrationValidationCalibrationValidation
Site 15 October 1999 to 14 December 20016 February 2002 to 5 September 200329 November 1999 to 30 November 199921 March 2002 to 4 April 2002
Site 21 May 2000 to 2 May 200115 May 2001 to 15 October 20025 April 2001 to 18 April 200123 September 2001 to 7 October 2001
Site 312 March 2004 to 3 September 20041 October 2004 to 15 August 20052 September 2004 to 15 September 200415 October 2004 to 28 October 2004
Site 47 January 2004 to 15 December 200419 January 2005 to 18 August 20052 September 2004 to 15 September 200415 October 2004 to 28 October 2004
Site 526 May 2018 to 17 July 201815 August 2018 to 15 November 20182 May 2018 to 20 June 201817 July 2018 to 18 October 2018
Site 629 May 2018 to 29 July 201814 September 2018 to 8 November 201820 April 2018 to 29 July 201814 September 2018 to 8 November 2018
Site 719 June 2018 to 27 September 201825 October 2018 to 17 August 20193 May 2018 to 19 June 201818 July 2018 to 17 August 2019
Site 819 June 2018 to 18 July 201817 August 2018 to 1 November 20184 May 2018 to 18 July 201817 August 2018 to 1 November 2018
Table 4. Statistical Comparison between Measured and Simulated WTDs in Zone 1 for all sites.
MAE (cm)Willmott’s Index of Agreement (d)
CalibrationValidationCalibrationValidation
Minimum550.010.00
Interquartile Range9–5.58.5–50.62–0.120.75–0.33
Maximum26380.690.81
Table 5. Statistical Comparison between Measured and Simulated Groundwater NO3-N concentrations in Zone 1 for all the sites.
Willmott’s Index of Agreement (d)RMSE (mg/L)MAE (mg/L)
CalibrationValidationCalibrationValidationCalibrationValidation
Minimum0.220.110.130.270.100.25
Interquartile Range0.60–0.400.65–0.170.75–0.501.07–0.380.68–0.450.99–0.36
Maximum0.830.760.911.450.811.21
Publisher’s Note: MDPI stays neutral with regard to jurisdictional claims in published maps and institutional affiliations.