Article

Identification and Validation of QTLs for Yield and Yield Components under Long-Term Salt Stress Using IR64 CSSLs in the Genetic Background of Koshihikari and Their Backcross Progenies

1
Graduate School of Environmental and Life Science, Okayama University, 1-1-1 Tsushima-naka, Kita-ku, Okayama 700-8530, Japan
2
Faculty of Agriculture, Okayama University, 1-1-1 Tsushima-naka, Kita-ku, Okayama 700-8530, Japan
3
Faculty of Life and Environmental Science, Shimane University, 1060 Nishikawatsu-cho, Matsue, Shimane 690-8504, Japan
*
Author to whom correspondence should be addressed.
Agriculture 2021, 11(8), 777; https://doi.org/10.3390/agriculture11080777
Submission received: 12 July 2021 / Revised: 13 August 2021 / Accepted: 13 August 2021 / Published: 15 August 2021

Abstract

:
Unraveling the complex genetic bases and mechanisms underlying salt tolerance is of great importance for developing salt-tolerant varieties. In this study, we evaluated 42 chromosome segment substitution lines (CSSLs) carrying chromosome segments from IR64 on the genetic background of Koshihikari under salt stress. Two CSSLs, SL2007 and SL2038, produced higher plant dry weight and grain yield than did Koshihikari under the stress condition. These CSSLs also showed lower Na+ and Cl accumulation in the leaf and whole plant at the full heading stage, which might be related to the higher grain yield and yield components. To understand the genetic control of its grain yield and yield components, a SL2007/Koshihikari F2 population was generated for quantitative trait locus (QTL) analysis. Six QTLs for grain yield and yield-related traits were detected on chromosome 2. Using near-isogenic lines (NILs) from a SL2007/Koshihikari F5 population, qSTGY2.2 was delimited to a 2.5 Mb region and novel qSTPN2 was delimited to a 0.6 Mb region. We also detected a novel QTL, qSTGF2, for grain filling, which was considered an important contributor to grain yield under salt stress in this CSSL. Our results provide insights into mechanisms conferring grain yield under salinity stress and new genetic resources for cloning and breeding.

1. Introduction

Rice is a staple crop feeding the largest number of people on Earth, and it provides approximately one-quarter of global energy consumption per capita [1]. The human population is projected to increase to 9.6 billion in 2050; therefore, rice production, together with other agricultural production, must double to meet the population’s demand [2,3]. However, salt stress, one of the major hindrances to rice production, already affects nearly 10% of the total land surface of the Earth [4], eliminating 3 ha of arable land in each passing minute [5]. The situation is becoming more urgent as millions of hectares of suitable land areas used especially for rice production in South and Southeast Asia, responsible for 90% of rice production worldwide, have been left uncultivated [6,7,8]. This calls for breeding salt-tolerant varieties with high yields to ensure food security and reutilize the land made unproductive by salt accumulation.
The rice response to salt stress differs greatly according to its growth stage: it is tolerant at the germination, tillering, and maturity stages but sensitive at the seedling and reproductive stages [9,10,11]. Salt tolerance at the seedling stage does not always correlate with salt tolerance at the reproductive stage [12] and it was reported that different genes might regulate salt tolerance at these stages [13]. Salt stress imposed on panicle initiation significantly inhibits panicle development by delaying panicle emergence and reducing the number of fertile tillers, and it adversely affects fertilization, reducing pollen viability and stigmatic receptivity [14]. Similarly, salinity exposure throughout the reproductive stage also delays flowering time, decreases the number of fertile tillers and spikelets per panicle, alters flower structures, and strongly decreases yield [15]. Recently, it was reported that salt stress produces deleterious effects on grain yield and yield parameters such as grain number, length, width, thickness, and grain filling percentage [16]. As grain yield and yield contributors are severely depressed, tolerance at the reproductive stage deserves special attention.
Overcoming ionic stress caused by Na+ and Cl is a fundamental challenge of rice plants under salt stress because it results in severe ion imbalance and causes physiological disorders [17,18,19,20]. Possible mechanisms by which rice plants cope with ionic stress involve: minimizing toxic ion entry through their roots, restricting excessive ion transportation to shoots [8], allocating higher ion concentrations in their older leaves [12], maintaining low ion concentrations within the cytoplasm, and sequestering Na+ and Cl in vacuoles [11]. Flowers and Yeo [21] reported that there is a negative correlation between Na+ and Cl concentrations in shoots and survival under salt stress conditions of varieties. Many studies have witnessed a strong association between excluding sodium from shoots and salt tolerance in rice varieties [22,23,24,25]. A closer correlation was found between grain yield and Na+ and Cl contents at full heading than at the panicle initiation and mature stages [26]. However, our understanding of the relationship between the ion contents at growth stages and grain yield under salt stress conditions is still limited.
Since salt tolerance is governed by quantitative trait loci (QTLs), to gain knowledge on salt tolerance mechanisms and for breeding purposes, intense efforts have been made regarding QTL mapping. Numerous QTLs were detected for salt tolerance at the seedling stage in rice [27,28,29,30,31,32,33,34,35,36]. Among them, a famous QTL, Saltol, with large effects was identified, and it has been used for developing salt-tolerant cultivars across many countries [37,38,39]. Another major QTL, qSKC-1 [27], was fine-mapped and cloned [40,41]. By contrast, fewer studies have focused on salt tolerance at the reproductive stage [42,43,44,45,46,47]. Moreover, none of the detected QTLs for salt tolerance at the reproductive stage have been fine-mapped or cloned.
Drilling for genetic factors controlling these salt-tolerant traits in different varieties [48] is useful for breeding programs via the pyramiding approach. IR64, ‘a high-quality and high-yielding mega variety’, was reported to be moderately tolerant to salinity stress at the seedling stage with a visual salt injury score (following IRRI’s assessment) of 5.8, while those of salt-tolerant landraces Pokkali and Nona Bokra are 4.2 and 4.1, respectively [49,50]. As salt tolerance traits are expressed unequally in rice genotypes, moderately tolerant varieties might possess characteristics independent from those of tolerant varieties. Furthermore, very little is known about salinity tolerance at the reproductive stage of these varieties. This study aimed: (1) to screen the salt tolerance of 42 IR64 chromosome segment substitution lines (CSSLs) under salt stress conditions; (2) to examine physiological characteristics associated with the salt tolerance of selected CSSLs showing superior tolerance to Koshihikari; (3) to map QTLs for grain yield and yield components under salt stress conditions by using an SL2007/Koshihikari F2 population; and (4) to validate and fine-map the detected QTLs on the long arm of chromosome 2 by comparing NILs. Furthermore, we compared these results with our group’s previous results on the screened salt tolerance of 44 CSSLs derived from Nona Bokra and Koshihikari in a relatively parallel manner [26] to see the differences in salt tolerance between IR64 and the salt-tolerant benchmark Nona Bokra.

2. Materials and Methods

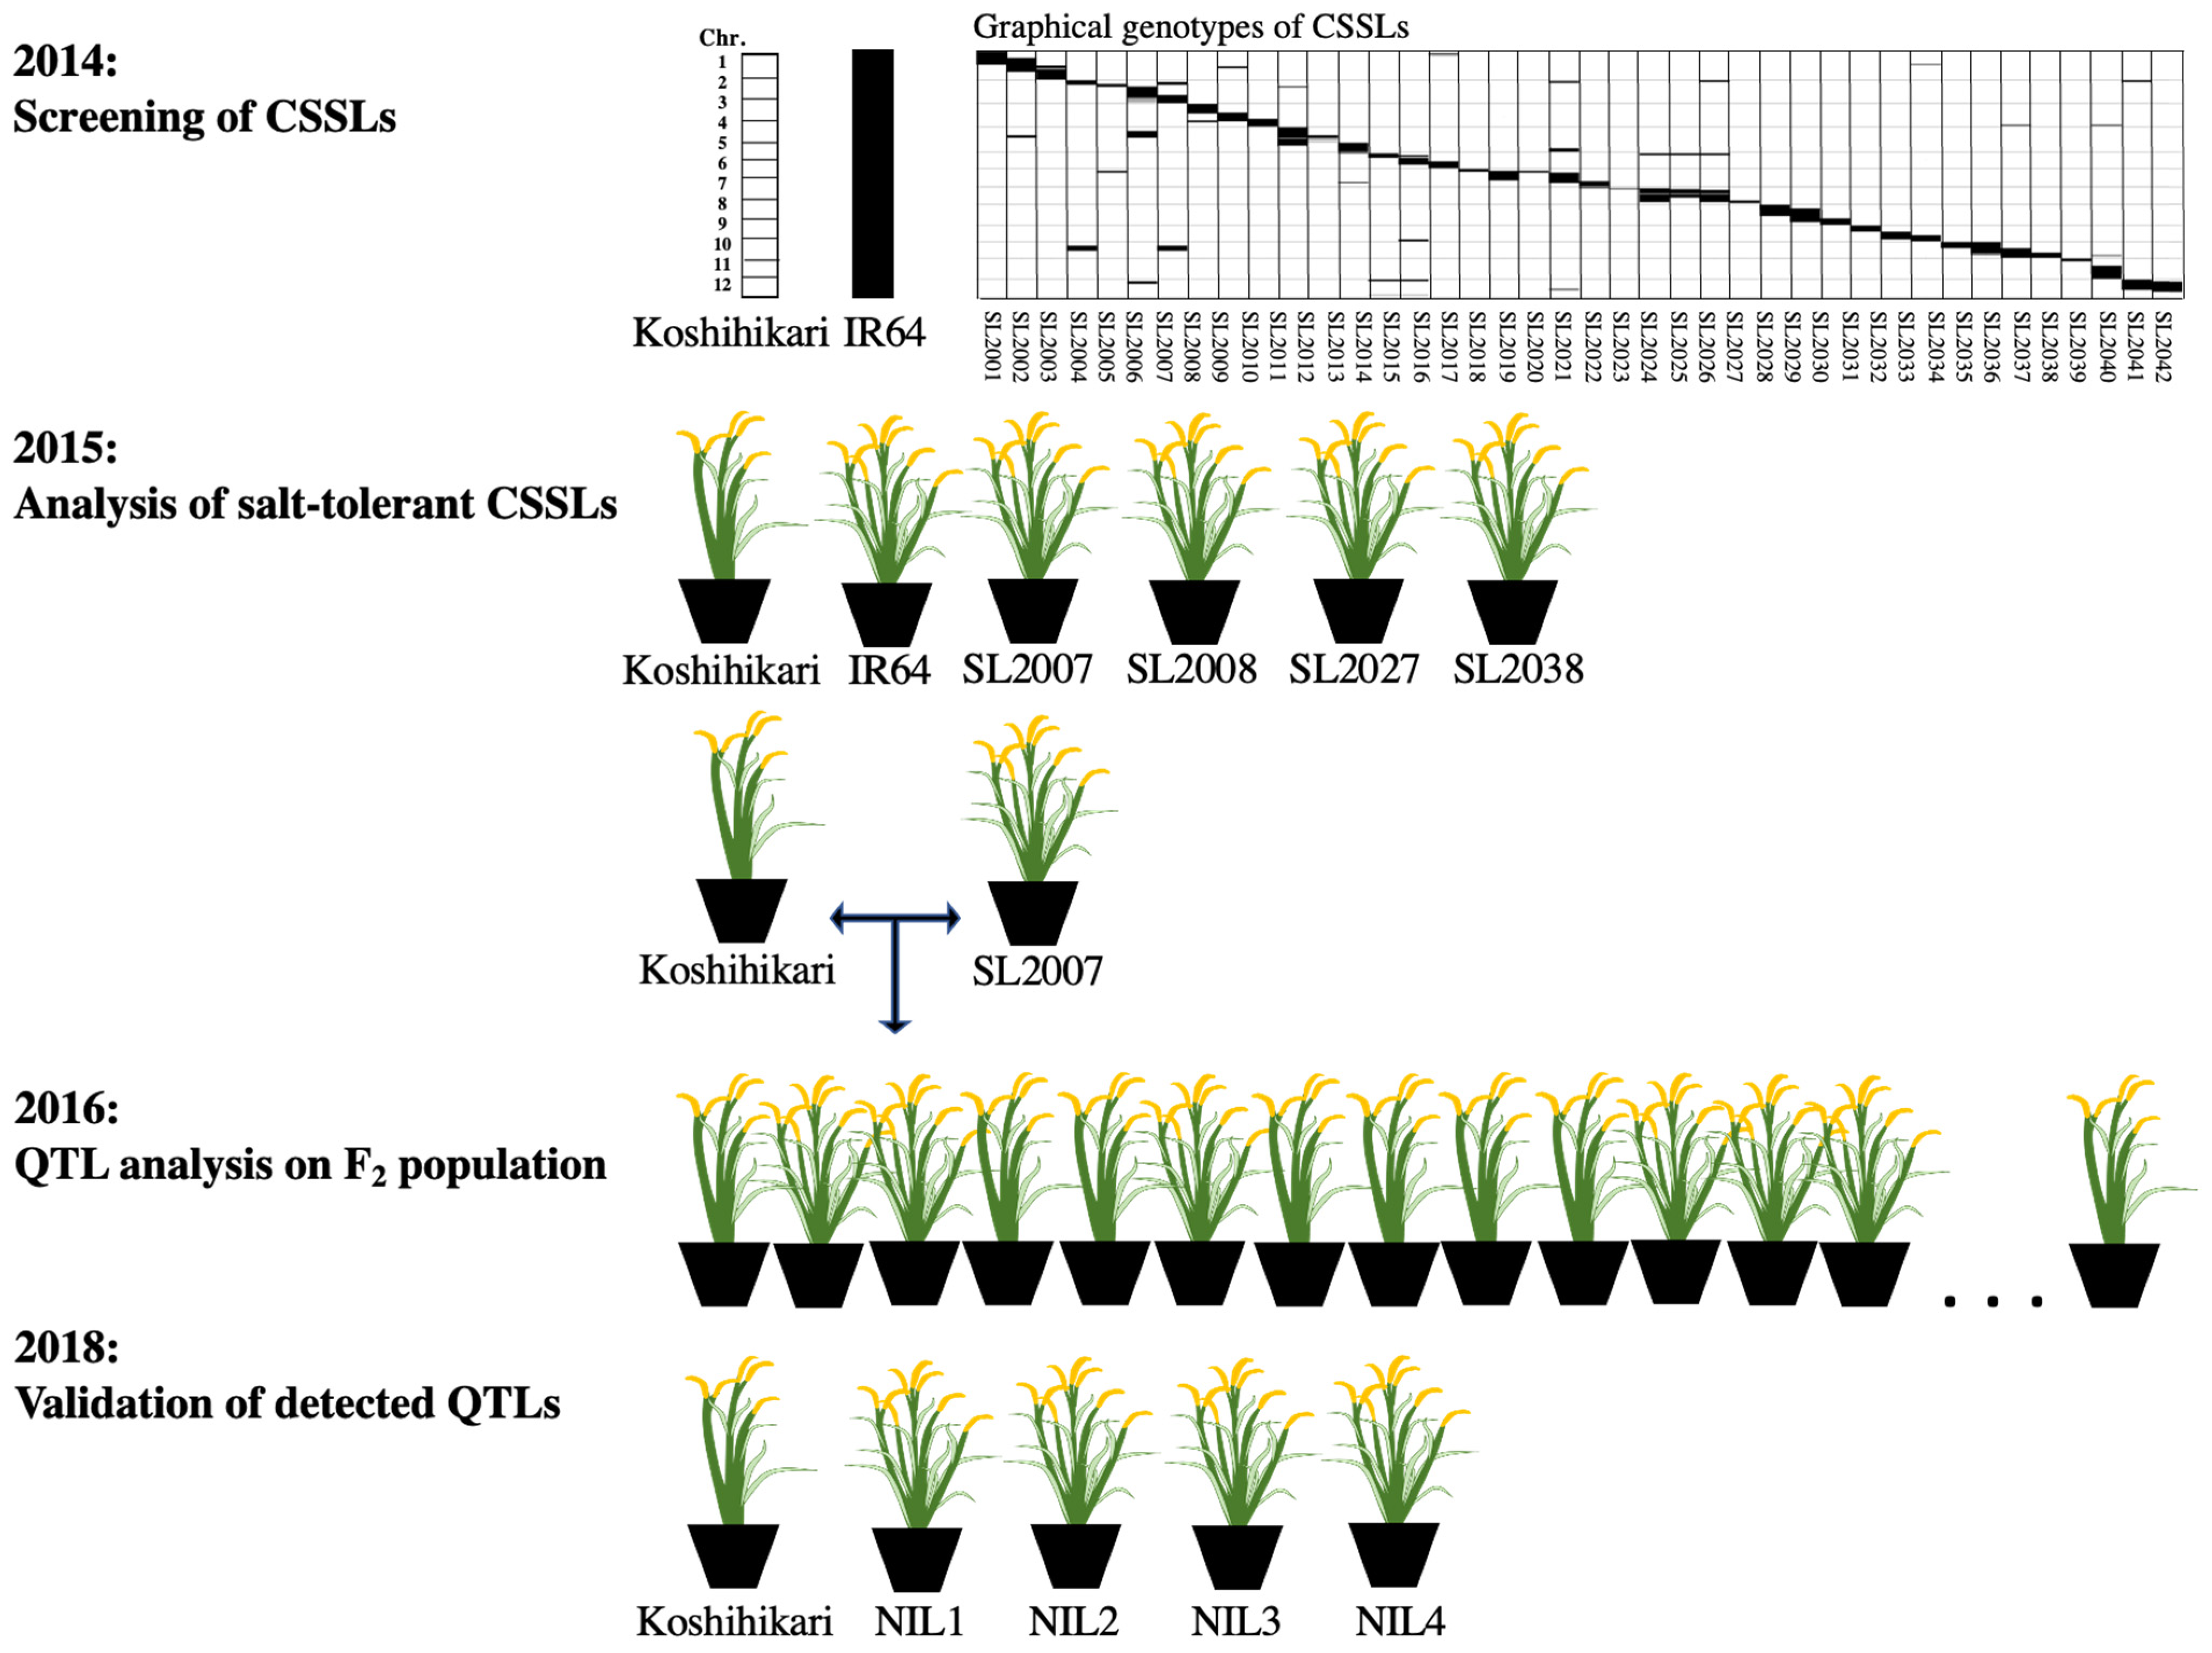
2.1. Plant Materials

A set of 42 IR64-CSSLs on the Koshihikari genetic background (SL2001–SL2042) and their recipient parent, Koshihikari, were received from the Rice Genome Resource Center in Japan. Seeds of IR64 were received from IRRI. The graphical genotypes of IR64-CSSLs were published previously [51]. Our experimental plan was illustrated in Figure 1. The CSSLs and their parents were firstly evaluated under non-stress and salt stress conditions in 2014. Since four CSSLs (SL2007, SL2008, SL2027, and SL2038) produced higher panicle weight under the salt stress condition, they were used for detailed physiological analysis in 2015. The CSSL SL2007 carries IR64 segments on chromosomes 2 and 10 on the genetic background of Koshihikari. As it has shown consistently higher performance than Koshihikari under salt stress conditions in the 2014 and 2015 experiments, we considered this CSSL to possess potential genetic factors for salt tolerance. Consequently, to carry out QTL analysis, the CSSL was crossed with the recipient parent, Koshihikari, to produce an F2 population for QTL analysis in 2016. Finally, to validate and narrow down the detected QTL intervals on the long arm of chromosome 2, four NILs containing different QTLs were selected from the SL2007/Koshihikari F5 population using 12 SSR and Indel markers, and they were evaluated in 2018.

2.2. Growing Conditions and Salt Treatment

The experiments were conducted at the experimental field of the Faculty of Agriculture, Okayama University, Japan (34041′N, 133055′N) in 2014–2018. Seeds were surface-sterilized with 0.1% Benlate fungicide and then soaked in tap water for two days before seeding. Uniform germinated seeds were sowed in nursery boxes (Minoru pot 448, Minoru Industrial Co. Ltd., Okayama, Japan) with 448 holes (16 mm diameter, 25 mm depth) filled with nursery soil (Kumiai Ube Ryu-Joh Baido, Ube Industries Ltd., Tokyo, Japan). The seeding days of each experiment were 23 May 2014, 15 May 2015, 23 May 2016, and 8 June 2018. Twenty-day-old seedlings were transferred into 2L pots (No. 5.5, Kaneya co. LTD, Aichi, Japan) containing paddy soil, well mixed with 8 g LPS 140E-80 slow-release fertilizer (NPK 14-14-14). Those pots were arranged with a spacing of 25 cm between them and kept flooded with tap water in a pool (20 m × 1.1 m × 0.18 m) under a two-sided opened vinyl house. For salt stress treatment, NaCl was applied at 7 days and 10 days after transplanting to induce saline conditions with an electrical conductivity (EC) of approximately 7 dSm−1. For control, NaCl was not added. Water was supplied through an irrigation tube (Evaflow Type-A, Mitsui Chemicals, Tokyo, Japan), and the electrical conductivity in the pond water was measured using an EC meter (2265FS, Spectrum Technologies, Inc., Aurora, IL, US). The EC of the ponded water was kept stable until the maturity stage.

2.3. Phenotypic Evaluation

To screen for salt tolerance, plants were harvested 45 days from the recorded heading date under control and stress conditions. The leaf and stem were oven-dried at 80 °C for three days, following which the dry weight was measured. The panicle weight was measured after drying at 35 °C for 72 h, and grains were then separated into unfilled and filled grains using a 1.06 specific gravity NaCl solution. In 2014, we firstly screened IR64 CSSLs by using two morphological traits: plant dry weight (DW) and panicle weight (PW). In 2015 and 2018, we measured a total of seven morphological traits: DW, PW, panicle number (PN), grain yield (GY), spikelet number per panicle (SN), 1000-grain weight (TGW), and grain filling (GF). Four phenotypic traits—DW, PW, PN, and GY—were recorded in 70 F2 plants for QTL analysis in 2016.

2.4. Ion Measurement of Selected Chromosome Segment Substitution Lines (CSSLs)

Ion contents in selected lines and their parents in 2015 were measured at the full heading stage (3 days after heading). Four replicates of each line were harvested, and then the leaf blade (LB) and leaf sheath (LS) were separated. Samples were dried at 80 °C for 72 h before ion measurement. The Na+ content was measured using a flame photometer (BWB-XP, BWB Technologies, Berkshire, UK), and the Cl content was measured using a pH/ion meter (D-53, Horiba Ltd., Tokyo, Japan) [26]. Briefly, 0.5 g samples were chopped and extracted with 25 mL of 1% nitric acid at 80 °C for 24 h. The ion content of the whole plant (WP) was calculated based on all parts’ ion contents and plant dry weight.

2.5. DNA Extraction and Polymerase Chain Reaction (PCR) Analysis

DNA extraction and amplification through polymerase chain reaction (PCR) followed a method described by [52] with slight modification. DNA was extracted from leaf samples of the F2 population and two parents using SDS/NaCl extraction buffer and then genotyped using 19 polymorphic SSR and indel markers. PCR amplification was carried out in 10 μL reactions containing 1.5 μL DNA template, 3 μL Milli-Q water, 5 μL Taq DNA polymerase, and 0.25 μL each of 10 μM forward and reverse primers. PCR was performed using thermal cycler (TP600, Takara Bio Inc., Shiga, Japan) by initial denaturation at 95 °C for 2 min; then 35 cycles of denaturation at 95 °C for 20 s, annealing at 50 °C for 20 s, and extension at 72 °C for 30 s; and a final extension at 72 °C for 2 min and storage at 15 °C The PCR products were stained with Midori green direct stain (Nippon Genetics Co. Ltd., Tokyo, Japan), and DNA fragments were separated on 3% agarose gel for manual allele scoring.

2.6. Quantitative Trait Locus (QTL) Mapping

Based on the genotypic data of the F2 plants, a linkage map was constructed using MAPMAKER/EXP 3.0b software. The chromosomal positions and effects of putative QTLs were determined by composite interval mapping in QTL Cartographer 2.5 software. The threshold of QTL detection was based on 1000 permutation tests at a 5% level of significance. The additive and dominant effects and phenotypic variance explained by each QTL (R2) were estimated from the peak LOD score.

2.7. Statistical Analysis

Dunnett’s multiple comparison test at probability levels of 5%, 1%, and 0.1% was used to detect any significant differences between CSSLs or NILs and Koshihikari. Correlations between the studied traits were determined using Pearson’s correlation in JMP software version 9.0.

3. Results

3.1. Salt Tolerance Evaluation of CSSLs

In 2014, IR64-CSSLs were grown under non-stress and salt stress conditions to identify CSSLs showing higher tolerance to salt stress as compared with the sensitive recipient, Koshihikari. Under non-stressed conditions, only SL2038 showed significantly higher DW than the recipient (Figure 2A). The four lines SL2002, SL2006, SL2010, and SL2011 showed PW values lower than that of Koshihikari (Figure 3A).
Exposure to NaCl stress with an EC of around 7 dSm−1 for an extended period from the vegetative stage to the maturity stage caused a reduction in both DW and PW in all lines; however, the reduction varied considerably among the parents and CSSLs (Figure 2B and Figure 3B). DW significantly decreased by 72% in Koshihikari but only 16% in IR64. The reduction in DW of the CSSLs varied in the range of 33–84%. Among the CSSLs, SL2012 and 2038 produced significantly higher DW as compared with Koshihikari. In terms of PW, salt stress also caused a more considerable reduction in Koshihikari than in IR64, with decreases of 84% and 70%, respectively. The decline in the PW of CSSLs varied in the range of 43–91%. Together with IR64, three lines (SL2007, SL2008, and SL2038) showed significantly higher PW than Koshihikari.

3.2. Physio-Morphological Analysis of Salt-Tolerant CSSLs

3.2.1. Yield and Yield Components

Four CSSLs (SL2007, SL2008, SL2027, and SL2038) exhibiting higher salt tolerance than the recipient parent, Koshihikari, were selected to study their physiological mechanisms in tolerating salt stress in detail. A similar trend was observed as salt stress markedly decreased DW, GY, and yield components in all genotypes. Under salt stress conditions, IR64 showed significant differences from Koshihikari in DW, PN, PW, GY, GF, and TGW (Figure 4). Among the selected CSSLs, SL2007, carrying IR64 chromosomal segments on chromosomes 2 and 10, produced significantly higher DW, PW, PN, and GY as compared with Koshihikari. Another CSSL, SL2038, which possesses IR64 segments on chromosomes 3 and 11, showed higher DW, PW, PN, GF, and TGW than Koshihikari.

3.2.2. Ion Contents

We measured the Na+ and Cl contents in the leaf sheath, leaf blade, and whole plant at full heading to examine how ion accumulations relate to yield and yield components. Relevant to both ion contents, IR64 showed lower accumulation in the leaf blade, leaf sheath, and whole plant than did Koshihikari (Table 1). Akin to IR64, SL2007 showed significantly lower Na+ and Cl contents in all the measured organs than did Koshihikari. The CSSL SL2038 showed significantly lower values in both ion contents in the leaf sheath and the whole plant in comparison with the recipient. SL2008 showed significantly lower Na+ content in all measured organs and Cl content in the leaf blade than Koshihikari. SL2027 only showed a significant difference to Koshihikari in the Cl content in the leaf blade.

3.2.3. Correlation between Traits

The DW, GY, and yield parameters were used in this study to estimate the combined effects of salt stress after a long period. It is interesting to examine whether yield and yield-related traits correlate with ion contents. Strong correlations between ion contents at the full heading stage and GY and ancillary traits were observed (Table 2). The Na+ content in the leaf blade, leaf sheath, and whole plant exhibited significant and negative correlations with DW, PW, PN, GY, TGW, and GF. In agreement with the Na+ content, the Cl content in all organs also significantly and negatively correlated with these traits. Interestingly, both Na+ and Cl contents showed virtually no correlation with SN.

3.3. Detection of QTLs for Salt Tolerance

In 2016, 70 SL2007/Koshihikari F2 plants were evaluated under salt stress conditions and genotyped using 19 SSR markers, among which 17 markers cover target regions on chromosome 2 and 2 markers flank a target region on chromosome 10. All the studied phenotypic traits, including DW, PN, PW, and GY of the F2 population, showed continuous distributions (data not shown). A linkage map was constructed using 70 F2 plants and 19 SSR markers. Composite interval mapping detected six QTLs on chromosome 2 for all measured phenotypic traits (Table 3). The QTLs detected in this study explain 9.91–31.84% of the phenotypic variance with LOD values ranging from 2.71 to 4.70. A QTL was detected for DW, qSTDW2, in the interval between RM13648 and RM13755 on the long arm of chromosome 2, the additive effects of which are derived from IR64 alleles. Two QTLs were detected for GY, qSTGY2.1 and qSTGY2.2, at LOD values of 3.72 and 3.85. The qSTGY2.1, explaining 23.64% of the phenotypic variation, was mapped on the short arm of chromosome 2 between markers RM12674 and RM12857, and Koshihikari alleles increased GY in this position. Another QTL, qSTGY2.2, explaining 31.84% of the phenotypic variation, was detected in the interval between RM13796 and RM5607 on the long arm of chromosome 2. Alleles from IR64 contributed to the additive effect on this QTL region. One QTL for PN, qSTPN2, explaining the highest phenotypic variance of 33.09%, was mapped to the region between RM13648 and RM13893. IR64 alleles also provided an increased effect on PN in this region. Two QTLs were mapped for PW, qSTPW2.1 and qSTPW2.2, with 10.39% and 24.51% of the phenotypic variation. Whereas qSTPW2.1 was co-localized with qSTGY2.1, qSTPW2.2 was mapped to the same QTL region as qSTGY2.2. Alleles from both parents provided increased effects on PW. The region of two co-localized QTLs, qSTGY2.1 and qSTPW2.1, is similar to that of previously detected QTLs for GY [42,44,46,53].

3.4. Validation and Fine Mapping of Detected QTLs

Since QTLs for DW, PN, PW, and GY detected on the long arm of chromosome 2 explained high phenotypic variations, narrowing down further and validating their regions was noteworthy. Using 12 polymorphic SSR and Indel markers, we screened recombinants from the SL2007/Koshihikari F5 population. As IR64 alleles provided positive effects on these QTLs, we selected four NILs carrying IR64 alleles in these QTL regions (Figure 5). NILs were evaluated for GY and ancillary traits under long-term salt stress conditions along with Koshihikari. Since only NIL1 showed significantly higher DW than Koshihikari, the qSTDW2 was narrowed down to a 2.9 Mb region between RM13593 and Indel 26.93. NIL1 and NIL2 produced around 1.6 times higher PN than Koshihikari and were confirmed to harbor the QTL for PN. This indicated that qSTPN2 was delimited to a physical region of 0.6 Mb, flanked by RM13717 and Indel 27.25. NIL3 produced 2.2 and 3 times higher GY and PW than Koshihikari, respectively, which indicated that NIL3 contains QTLs for these traits. Thus, qSTGY2.2 and qSTPW2.2 were confirmed to a 2.5 Mb region, flanked by RM13781 and RM13928. Furthermore, NIL3 and NIL4 yielded significantly higher GF than Koshihikari, which suggested the presence of a QTL for GF. This QTL, designated qSTGF2, was confined to a 2.3 Mb region between RM13928 and Indel 31.98. The region of qSTGY2.2 coincides with a QTL region for GY, which was detected recently under salt stress conditions [54]. However, when it comes to qSTPN2 and qSTGF2, QTLs detected previously are in regions distinct from those of our QTLs [55]. Thus, qSTPN2 and qSTGF2 are novel QTLs for PN and GF under salt stress conditions.

4. Discussion

In the present study, we evaluated the tolerance of 42 IR64-CSSLs in the genetic background of Koshihikari grown under salt stress conditions in 2014, covering vegetative and reproductive stages. During the salt treatment period, plants continued growing vegetatively and produced yield, so we observed adverse effects of salt stress on the DW and PW of all examined genotypes. Under saline conditions, there were two IR64-CSSLs with higher DW and three IR64-CSSLs with higher PW than Koshihikari (Figure 2B and Figure 3B). Thuy et al. [26] evaluated the salt tolerance of 44 CSSLs carrying different Nona Bokra segments in the genetic background of Koshihikari under the same experimental conditions in 2014. Since 10 Nona Bokra-CSSLs were recorded with significantly higher DW than Koshihikari, introgressed Nona Bokra segments of these CSSLs distributing in almost every chromosome were considered putative contributors to this landrace’s salt tolerance. Thus, compared with the salt-tolerant benchmark Nona Bokra, relatively tolerant IR64 possesses fewer chromosome segments that maintain high DW under salt stress. In other words, this suggests that the quantity of chromosomal regions involved in salt tolerance is closely related to the different extents of salt tolerance among cultivars. Notwithstanding this, comparing the positions of these salt-tolerant Nona Bokra and IR64 chromosome segments indicated some incompatible segments [51,56]. Substantial progress made in studies on rice revealed several key salt tolerance mechanisms that are not equally expressed in varieties [57]. Thus, we assumed that such particular segments might build up specific salt tolerance mechanisms in IR64. SL2038 consistently produced higher DW than Koshihikari under salt stress conditions in 2014 and 2015 (Figure 2B and Figure 4A). Therefore, IR64 segments of chromosomes 3, 10, and 11 in SL2038 might be responsible for maintaining DW under salinity. Regarding PW, two CSSLs, SL2007 and SL2038, consistently showed higher performance than Koshihikari (Figure 3B and Figure 4B). Consequently, IR64 chromosome segments of chromosomes 2, 3, 10, and 11 harbored in these CSSLs might be responsible for stably maintaining PW under salt stress conditions. Investigating physiological traits and yield components in SL2007 and SL2038 will give more insight into the mechanisms relating to salt tolerance at the reproductive stage in IR64.
Maintaining a low ion concentration in the shoot was reported to be an effective strategy of tolerant glycophytes [58]. Here, we observed a close relation between Na+ and Cl accumulations at the full heading stage and grain yield and ancillary traits (Table 2). Two salt-tolerant CSSLs, SL2007 and SL2038, produced higher DW, PW, PN, GY, GF, and TGW than Koshihikari and also accumulated significantly lower Na+ and Cl contents in the leaf blade, leaf sheath, and whole plant at the full heading stage than Koshihikari. A negative correlation was observed between Na+ and Cl accumulations in shoots at the maturity stage and grain yield [16]. Under salt stress conditions, Na+ and Cl contents at the full heading stage were found to correlate more strongly with grain yield than those at the panicle initiation and mature stages [26]. In agreement with the above findings, our result suggests that the maintained grain yield and yield components in the salt-tolerant CSSLs could be attributed to low Na+ and Cl accumulations in the leaf and whole plant at the full heading stage. By minimizing the entry of Na+ through roots, Na+ is sequestered in roots, and reabsorption occurs from the plant xylem stream that could maintain a low Na+ concentration in shoots [8,44]. Large yield biomass was proposed to form an advantage in diluting the accumulated Na+ and providing storage capacity for its sequestration [23,48]. As the IR64 chromosome segments on these tolerant CSSLs are still large, QTL analysis using an F2 population and the development of NILs provide a productive approach for validating and narrowing down the QTL regions.
Finding QTLs controlling yield and yield components under salt stress conditions with stable effects would be valuable for developing salt-tolerant varieties through marker assistance. Salt stress reduces grain yield and yield components such as panicle number, grain number per panicle, the percentage of ripened grains, and 1000-grain weight, and the contribution of each component to grain yield varies among different varieties and growing environments [9,10,14,59]. Using NILs, we detected qSTGF2, closely associated with the significant increase in GF of NIL3 and NIL4 (Figure 5). Besides this, several studies have suggested that QTLs controlling grain yield and yield components are often mapped as a cluster in the genome, which points toward the effects of either tightly linked genes or one gene controlling these traits [42,44,60]. Here, qSTGF2 and qSTGY2.2 were mapped closely. We also found a highly positive correlation between GY and GF (R2 = 0.859, Table 4), which suggests that GF is an important contributor to maintaining GY in this variety. Further research on genes relating to grain filling maintenance under salinity, which is not yet understood, is needed to reveal the major controlling genes and their regulatory mechanisms.
The QTL for another major yield component, qSTPN2, was fine-mapped to a 0.6 Mb region flanked by RM13717 and Indel 27.25 (Figure 5). It is well known that shoot branching determining the panicle number is under the control of complex interactions between phytohormones and is affected by environmental factors, developmental status, and genetic factors [61]. To withstand salt stress, plants must address the major problems of ionic, osmotic, and oxidative stresses. According to the rice genome annotation database, there are 103 genes in the qSTPN2 region. Among them, we found some candidate genes engaging in alleviating osmotic and oxidative damage, which could help maintain better growth and result in shoot branching. For example, a gene involved in osmoprotection, OsTPP1, was reported to be induced by salt stress, and its overexpression resulted in enhanced salt tolerance [62]. A gene encoding for aquaporin regulating water balance, OsPIP1;1, whose moderate expression increased salt tolerance, also exists in the QTL region [63]. Kumars et al. [64] suggested that OsDhn1 is an important gene for salt tolerance in rice as it might relate to ROS scavenging and alleviate oxidative damage. The OsTPP1 and OsDhn1 were reported to be upregulated in shoot and root in response to salt stress [65]. All these suggested that OsTPP1 and OsDhn1 might be the most likely candidate genes of qSTPN2. Examining the key genetic effects and cloning of qSTPN2 will facilitate molecular breeding for higher panicle numbers under salt stress in rice.

5. Conclusions

Taken together, the results indicate that IR64 possesses potential genetic factors conferring salt tolerance at the vegetative and reproductive stages. Two promising IR64 CSSLs, SL2007 and SL2038, maintained better DW, GY, and yield components than Koshihikari under salinity conditions, which could be mainly attributed to low Na+ and Cl contents in the leaf and whole plant at the full heading stage. From the SL2007/Koshihikari F2 population, QTL analysis detected six QTLs for GY and ancillary traits crowding around two genome regions of chromosome 2. The major QTL for GY, qSTGY2.2, was delimited to a 2.5 Mb region, and two novel QTLs for yield components, qSTPN2 and qSTGF2, were delimited to a 0.6 Mb region and a 2.3 Mb region, respectively. Besides this, in SL2007, among its yield components, maintained GF might be primarily responsible for the better GY under salt stress conditions. Our results not only help us to interpret the genetics and mechanisms underlying salt tolerance in rice but also provide valuable materials for breeding programs.

Author Contributions

Conceptualization, Y.H.; Methodology, Y.H., N.T.T.T. and N.S.M.; Software, N.S.M.; Formal Analysis, M.N., K.K. and N.S.M.; Investigation, D.D.H., M.N., K.K. and N.S.M.; Data Curation, Y.H. and N.S.M.; Writing—Original Draft Preparation, N.S.M.; Writing—Review and Editing, Y.H., T.K., K.S. and N.S.M.; Supervision, Y.H.; Funding Acquisition, Y.H. All authors have read and agreed to the published version of the manuscript.

Funding

This work was funded by JSPS KAKENHI Grant Number JP16K07573, JP20H02969.

Institutional Review Board Statement

Not applicable.

Conflicts of Interest

The authors declare no conflict of interest.

References

  1. GRiSP. Rice Almanac, 4th ed.; International Rice Research Institute: Los Baños, Philippines, 2013. [Google Scholar]
  2. United Nations, Department of Economic and Social Affairs, Population Division. World Population Prospects: The 2012 Revision Highlights and Advance Tables; Working Paper No. ESA/P/WP.228; Department of Economic & Social Affairs: New York, NY, USA, 2013. [Google Scholar]
  3. Ray, D.K.; Mueller, N.D.; West, P.C.; Foley, J.A. Yield trends are insufficient to double global crop production by 2050. PLoS ONE 2013, 8, 6. [Google Scholar] [CrossRef] [PubMed] [Green Version]
  4. Pessarakli, M. Handbook of Plant and Crop Stress, 2nd ed.; Marcel Dekker Inc.: New York, NY, USA, 1999. [Google Scholar]
  5. Rehman, S.; Harris, P.J.C.; Ashraf, A. Stress environments and their impact on crop production. In Abiotic Stress: Plant Resistance Through Breeding and Molecular Approaches; Food Products Press: New York, NY, USA, 2005. [Google Scholar]
  6. Muthayya, S.; Sugimoto, J.D.; Montgomery, S.; Maberly, G.F. An overview of global rice production, supply, trade, and consumption. Ann. N. Y. Acad. Sci. 2014, 1324, 7–14. [Google Scholar] [CrossRef] [PubMed]
  7. Kumar, V.; Singh, A.; Mithra, S.V.A.; Krishnamurthy, S.L.; Parida, S.K.; Jain, S.; Tiwari, K.K.; Kumar, P.; Rao, A.R.; Sharma, S.K.; et al. Genome-wide association mapping of salinity tolerance in rice (Oryza sativa). DNA Res. 2015, 22, 133–145. [Google Scholar] [CrossRef] [PubMed] [Green Version]
  8. Reddy, I.N.B.L.; Kim, B.K.; Yoon, I.S.; Kim, K.H.; Kwon, T.R. Salt tolerance in rice: Focus on mechanisms and approaches. Rice Sci. 2017, 24, 123–144. [Google Scholar] [CrossRef]
  9. Heenan, D.P.; Lewin, L.G.; McCaffery, D.W. Salinity tolerance in rice varieties at different growth stages. Aust. J. Exp. Agric. 1988, 28, 343–349. [Google Scholar] [CrossRef]
  10. Makihara, D.; Tsuda, M.; Morita, M.; Hirai, Y.; Kuroda, T. Effect of salinity on the growth and development on rice (Oryza sativa L.) varieties. Jpn. J. Trop. Agric. 1999, 43, 285–294. [Google Scholar]
  11. Singh, R.K.; Flowers, T.J. Physiology and Molecular Biology of the Effects of Salinity on Rice, 3rd ed.; Taylor & Francis: Boca Raton, FL, USA, 2010. [Google Scholar]
  12. Zeng, L.; Shannon, M.C.; Grieve, C.M. Evaluation of salt tolerance in rice genotypes by multiple agronomic characters. Euphytica 2002, 127, 235–245. [Google Scholar] [CrossRef]
  13. Mohammadi, R.; Mendioro, M.S.; Diaz, G.Q.; Gregorio, Q.B.; Singh, R.K. Genetic analysis of salt tolerance at seedling and reproductive stages in rice (Oryza sativa). Plant Breed. 2014, 133, 548–559. [Google Scholar] [CrossRef]
  14. Khatun, S.; Rizzo, C.A.; Flowers, T.J. Genotypic variation in the effect of salinity on fertility in rice. Plant Soil. 1995, 173, 239–250. [Google Scholar] [CrossRef]
  15. Lutts, S.; Kinet, J.M.; Bouharmont, J. Changes in plant response to NaCI during development of rice (Oryza sativa L.) varieties differing in salinity resistance. J. Exp. Bot. 1995, 46, 1843–1852. [Google Scholar] [CrossRef]
  16. Kumar, V.; Khare, T. Differential growth and yield responses of salt-tolerant and susceptible rice cultivars to individual (Na+ and Cl− ) and additive stress effects of NaCl. Acta Physiol. Plant. 2016, 38, 7. [Google Scholar] [CrossRef]
  17. Hussain, S.; Jun-hua, Z.; Chu, Z.; Lian-Feng, Z.; Xiao-Chuang, C.; Sheng-Miao, Y.; James, A.B.; Ji-Jie, H.; Qian-Yu, J. Effects of salt stress on rice growth, development characteristics, and the regulating ways: A review. J. Integr. Agric. 2017, 16, 2357–2374. [Google Scholar] [CrossRef] [Green Version]
  18. Amirjani, M.R. Effect of Salinity stress on growth, sugar content, pigments and enzyme activity of rice. Int. J. Bot. 2011, 7, 73–81. [Google Scholar] [CrossRef] [Green Version]
  19. Gupta, B.; Huang, B. Mechanism of salinity tolerance in plants: Physiological, biochemical, and molecular characterization. Int. J. Genomics. 2014, 2014, 1–18. [Google Scholar] [CrossRef] [PubMed]
  20. Munns, R.; Tester, M. Mechanisms of Salinity Tolerance. Annu. Rev. Plant Biol. 2008, 59, 651–681. [Google Scholar] [CrossRef] [PubMed] [Green Version]
  21. Flowers, T.J.; Yeo, A.R. Variability in the resistance of sodium chloride salinity within rice (Oryza sativa L.) varieties. New Phytol. 1981, 88, 363–373. [Google Scholar] [CrossRef]
  22. Ueda, A.; Yahagi, H.; Fujikawa, Y.; Nagaoka, T.; Esaka, M.; Calcaño, M.; González, M.M.; Martich, J.D.H.; Saneoka, H. Comparative physiological analysis of salinity tolerance in rice. Soil Sci. Plant Nutr. 2013, 59, 896–903. [Google Scholar] [CrossRef]
  23. Platten, J.D.; Egdane, J.A.; Ismail, A.M. Salinity tolerance, Na+ exclusion and allele mining of HKT1;5 in Oryza sativa and O. glaberrima: Many sources, many genes, one mechanism? BMC Plant Biol. 2013, 13, 32. [Google Scholar] [CrossRef] [Green Version]
  24. Mekawy, A.M.M.; Assaha, D.V.M.; Yahagi, H.; Tada, Y.; Ueda, A.; Saneoka, H. Growth, physiological adaptation, and gene expression analysis of two Egyptian rice cultivars under salt stress. Plant Physiol. Biochem. 2015, 87, 17–25. [Google Scholar] [CrossRef] [PubMed]
  25. Gerona, M.E.B.; Deocampo, M.P.; Egdane, J.A.; Ismail, A.M.; Dionisio-Sese, M.L. Physiological Responses of Contrasting Rice Genotypes to Salt Stress at Reproductive Stage. Rice Sci. 2019, 26, 207–219. [Google Scholar] [CrossRef]
  26. Thuy, N.T.T.; Tokuyasu, M.; Mai, N.S.; Hirai, Y. Identification and characterization of chromosome regions associated with salinity tolerance in rice. J. Agric. Sci. 2018, 10, 57–68. [Google Scholar] [CrossRef] [Green Version]
  27. Lin, H.X.; Zhu, M.Z.; Yano, M.; Gao, J.P.; Liang, Z.W.; Su, W.A.; Hu, X.H.; Ren, Z.H.; Chao, D.Y. QTLs for Na+ and K+ uptake of the shoots and roots controlling rice salt tolerance. Theor. Appl. Genet. 2004, 108, 253–260. [Google Scholar] [CrossRef]
  28. Lee, S.Y.; Ahn, J.H.; Cha, Y.S.; Yun, D.W.; Lee, M.C.; Ko, J.C.; Lee, K.S.; Eun, M.Y. Mapping of quantitative trait loci for salt tolerance at the seedling stage in rice. Mol. Cells. 2006, 21, 192–196. [Google Scholar] [PubMed]
  29. Kim, D.M.; Ju, H.G.; Kwon, T.R.; Oh, C.S.; Ahn, S.N. Mapping QTLs for salt tolerance in an introgression line population between Japonica cultivars in rice. J. Crop Sci. Biotechnol. 2009, 12, 121–128. [Google Scholar] [CrossRef]
  30. Cheng, L.; Wang, Y.; Meng, L.; Hu, X.; Cui, Y.; Sun, Y.; Zhu, L.; Ali, J.; Xu, J.; Li, Z. Identification of salt-tolerant QTLs with strong genetic background effect using two sets of reciprocal introgression lines in rice. Genome 2012, 55, 45–55. [Google Scholar] [CrossRef]
  31. Leon, T.B.D.; Linscombe, S.; Subudhi, P.K. Identification and validation of QTLs for seedling salinity tolerance in introgression lines of a salt tolerant rice landrace ‘Pokkali’. PLoS ONE 2017, 12, 1–30. [Google Scholar]
  32. Puram, V.R.R.; Ontoy, J.; Subudhi, P.K. Identification of QTLs for salt tolerance traits and prebreeding lines with enhanced salt tolerance in an introgression line population of rice. Plant Mol. Biol. Report. 2018, 36, 695–709. [Google Scholar] [CrossRef]
  33. Rahman, M.A.; Thomson, M.J.; Ocampo, M.D.; Egdane, J.A.; Salam, M.A.; Shah-E-Alam, M.; Ismail, A.M. Assessing trait contribution and mapping novel QTL for salinity tolerance using the Bangladeshi rice landrace Capsule. Rice 2019, 12, 12–63. [Google Scholar] [CrossRef] [PubMed] [Green Version]
  34. Wu, F.; Yang, J.; Yu, D.; Xu, P. Identification and validation a major QTL from ‘Sea Rice 86’ seedlings conferred salt tolerance. Agronomy 2020, 10, 410. [Google Scholar] [CrossRef] [Green Version]
  35. Yuan, J.; Wang, X.; Zhao, Y.; Khan, N.U.; Zhao, Z.; Zhang, Y.; Wen, X.; Tang, F.; Wang, F.; Li, Z. Genetic basis and identification of candidate genes for salt tolerance in rice by GWAS. Sci. Rep. 2020, 10, 1–9. [Google Scholar] [CrossRef] [PubMed]
  36. Nakhla, W.R.; Sun, W.; Fan, K.; Yang, K.; Zhang, C.; Yu, S. Identification of QTLs for salt tolerance at the germination and seedling stages in rice. Plants 2021, 10, 428. [Google Scholar] [CrossRef]
  37. Bonilla, P.; Dvorak, J.; Mackill, D.; Deal, K.; Gregorio, G. RFLP and SSLP mapping of salinity tolerance genes in chromosome 1 of rice (Oryza sativa L.) using recombinant inbred lines. Philipp. Agric. Sci. 2002, 65, 68–76. [Google Scholar]
  38. Sevanthi, A.M.; Prakash, C.; Shanmugavadivel, C. Recent progress in rice varietal development for abiotic stress tolerance. In Advances in Rice Research for Abiotic Stress Tolerance; Woodhead Publishing: Duxford, UK, 2019; pp. 47–68. [Google Scholar]
  39. Krishnamurthy, S.L.; Pundir, P.; Warraich, A.S.; Rathor, S.; Lokeshkumar, B.M.; Singh, N.K.; Sharma, P.C. Introgressed Saltol QTL lines improves the salinity tolerance in rice at seedling stage. Front. Plant Sci. 2020, 11, 1–13. [Google Scholar] [CrossRef]
  40. Ren, Z.H.; Gao, J.P.; Li, L.G.; Cai, X.L.; Huang, W.; Chao, D.Y.; Zhu, M.Z.; Wang, Z.Y.; Luan, S.; Lin, H.X. A rice quantitative trait locus for salt tolerance encodes a sodium transporter. Nat. Genet. 2005, 37, 1141–1146. [Google Scholar] [CrossRef] [PubMed]
  41. Jing, W.; Deng, P.; Cao, C.; Zhang, W. Fine mapping of qSKC-1, a major quantitative trait locus for shoot K+ concentration, in rice seedlings grown under salt stress. Breed. Sci. 2017, 67, 286–295. [Google Scholar] [CrossRef] [Green Version]
  42. Mohammadi, R.; Mendioro, M.S.; Diaz, G.Q.; Gregorio, G.B.; Singh, R.K. Mapping quantitative trait loci associated with yield and yield components under reproductive stage salinity stress in rice (Oryza sativa L.). J. Genet. 2013, 92, 433–443. [Google Scholar] [CrossRef]
  43. Bimpong, I.K.; Manneh, B.; Diop, B.; Ghislain, K.; Sow, A.; Amoah, N.K.A.; Gregorio, G.; Singh, R.K.; Ortiz, R.; Wopereis, M. New quantitative trait loci for enhancing adaptation to salinity in rice from Hasawi, a Saudi landrace into three African cultivars at the reproductive stage. Euphytica 2014, 200, 45–60. [Google Scholar] [CrossRef]
  44. Hossain, H.; Rahman, M.A.; Alam, M.S.; Singh, R.K. Mapping of quantitative trait loci associated with reproductive-stage salt tolerance in rice. J. Agron. Crop Sci. 2015, 201, 17–31. [Google Scholar] [CrossRef]
  45. Chattopadhyay, K.; Mohanty, S.K.; Vijayan, J.; Marndi, B.C.; Sarkar, A.; Molla, K.A.; Chakraborty, K.; Ray, S.; Sarkar, R.K. Genetic dissection of component traits for salinity tolerance at reproductive stage in rice. Plant Mol. Biol. Report. 2021, 39, 386–402. [Google Scholar] [CrossRef]
  46. Mondal, S.; Borromeo, T.H.; Diaz, M.G.Q.; Amas, J.; Rahman, M.A.; Thomson, M.J.; Gregorio, G.B. Dissecting qtls for reproductive stage salinity tolerance in rice from BRRI dhan 47. Plant Breed. Biotechnol. 2019, 7, 302–312. [Google Scholar] [CrossRef]
  47. Noor, A.U.Z.; Jewel, G.M.N.A.; Haque, T.; Elias, S.M.; Biswas, S.; Rahman, M.S.; Seraj, Z.I. Validation of QTLs in Bangladeshi rice landrace Horkuch responsible for salt tolerance in seedling stage and maturation. Acta Physiol. Plant. 2019, 41, 1–15. [Google Scholar] [CrossRef]
  48. Yeo, A.R.; Yeo, M.E.; Flowers, S.A.; Flowers, T.J. Screening of rice (Oryza sativa L.) genotypes for physiological characters contributing to salinity resistance, and their relationship to overall performance. Theor. Appl. Genet. 1990, 79, 377–384. [Google Scholar] [CrossRef] [PubMed]
  49. Prusty, M.R.; Kim, S.R.; Vinarao, R.; Entila, F.; Egdane, J.; Diaz, M.G.Q.; Jena, K.K. Newly identified wild rice accessions conferring high salt tolerance might use a tissue tolerance mechanism in leaf. Front. Plant Sci. 2018, 9, 1–15. [Google Scholar] [CrossRef] [Green Version]
  50. Mackill, D.J.; Khush, G.S. IR64: A high-quality and high-yielding mega variety. Rice 2018, 2018, 11–18. [Google Scholar] [CrossRef] [PubMed] [Green Version]
  51. Nagata, K.; Ando, T.; Nonoue, Y.; Mizubayashi, T.; Kitazawa, N.; Shomura, A.; Matsubara, K.; Ono, N.; Mizobuchi, R.; Shibaya, T.; et al. Advanced backcross QTL analysis reveals complicated genetic control of rice grain shape in a japonica × indica cross. Breed. Sci. 2015, 65, 308–318. [Google Scholar] [CrossRef] [PubMed] [Green Version]
  52. Shavrukov, Y.; Gupta, N.K.; Miyazaki, J.; Baho, M.N.; Chalmers, K.J.; Tester, M.; Langridge, P.; Collins, N.C. HvNax3—A locus controlling shoot sodium exclusion derived from wild barley (Hordeum vulgare ssp. spontaneum). Funct. Integr. Genomics 2010, 10, 277–291. [Google Scholar] [CrossRef] [PubMed]
  53. Chai, L.; Zhang, J.; Pan, X.; Zhang, F.; Zheng, T.; Zhao, X.; Wang, W.; Jauhar, A.; Xu, J.; Li, Z. Advanced backcross QTL analysis for the whole plant growth duration salt tolerance in rice (Oryza sativa L.). J. Integr. Agric. 2014, 13, 1609–1620. [Google Scholar] [CrossRef]
  54. Pundir, P.; Devi, A.; Krishnamurthy, S.L.; Sharma, P.C.; Vinaykumar, N.M. QTLs in salt rice variety CSR10 reveals salinity tolerance at reproductive stage. Acta Physiol. Plant. 2021, 43, 1–15. [Google Scholar] [CrossRef]
  55. Mai, N.S.; Hirai, Y. QTL mapping for salt tolerance at reproductive stage in rice: A Minireview. J. Environ. Sci. Sustain. Soc. 2021, 10, 31–34. [Google Scholar]
  56. Takai, T.; Nonoue, Y.; Yamamoto, S.; Yamanouchi, U.; Matsubara, K.; Liang, Z.W.; Lin, H.; Ono, N.; Uga, Y.; Yano, M. Development of Chromosome segment substitution lines derived from backcross between indica donor rice cultivar ‘Nona Bokar’ and japonica recipient cultivar ‘Koshihikari’. Jpn. Soc. Breed. 2007, 57, 257–261. [Google Scholar] [CrossRef] [Green Version]
  57. Ismail, A.M.; Horie, T. Genomics, physiology, and molecular breeding approaches for improving salt tolerance. Annu. Rev. Plant Biol. 2017, 68, 405–434. [Google Scholar] [CrossRef] [PubMed] [Green Version]
  58. Horie, T.; Karahara, I.; Katsuhara, M. Salinity tolerance mechanisms in glycophytes: An overview with the central focus on rice plants. Rice 2012, 5, 1–18. [Google Scholar] [CrossRef] [Green Version]
  59. Zeng, L.; Shannon, M.C. Salinity effects on seedling growth and yield components of rice. Crop Sci. 2000, 40, 996–1003. [Google Scholar] [CrossRef] [Green Version]
  60. Fahad, S.; Adnan, M.; Noor, M.; Arif, M.; Alam, M.; Khan, I.A.; Ullah, H.; Wahid, F.; Mian, I.A.; Jamal, Y.; et al. Major constrains for global rice production. In Advances in Rice Research for Abiotic Stress Tolerance; Woodhead Publishing: Duxford, UK, 2019. [Google Scholar]
  61. Xing, Y.; Zhang, Q. Genetic and molecular bases of rice yield. Annu. Rev. Plant Biol. 2010, 61, 421–442. [Google Scholar] [CrossRef] [PubMed]
  62. Ge, L.F.; Chao, D.Y.; Shi, M.; Zhu, M.Z.; Gao, J.P.; Lin, H.X. Overexpression of the trehalose-6-phosphate phosphatase gene OsTPP1 confers stress tolerance in rice and results in the activation of stress responsive genes. Planta 2008, 228, 191–201. [Google Scholar] [CrossRef] [PubMed]
  63. Liu, C.; Fukumoto, T.; Matsumoto, T.; Gena, P.; Frascaria, D.; Kaneko, T.; Katsuhara, M.; Zhong, S.; Sun, X.; Zhu, Y.; et al. Aquaporin OsPIP1;1 promotes rice salt resistance and seed germination. Plant Physiol. Biochem. 2013, 63, 151–158. [Google Scholar] [CrossRef] [PubMed]
  64. Kumar, M.; Lee, S.C.; Kim, J.Y.; Kim, S.J.; Aye, S.S.; Kim, S.R. Over-expression of dehydrin gene, OsDhn1, improves drought and salt stress tolerance through scavenging of reactive oxygen species in rice (Oryza sativa L.). J. Plant Biol. 2014, 57, 383–393. [Google Scholar] [CrossRef]
  65. Mizuno, H.; Kawahara, Y.; Sakai, H.; Kanamori, H.; Wakimoto, H.; Yamagata, H.; Oono, Y.; Wu, J.; Ikawa, H.; Itoh, T.; et al. Massive parallel sequencing of mRNA in identification of unannotated salinity stress-inducible transcripts in rice (Oryza sativa L.). BMC Genomics 2010, 11, 683. [Google Scholar] [CrossRef] [PubMed] [Green Version]
Figure 1. Schematic representation of the experimental design.
Agriculture 11 00777 g001
Figure 2. Plant dry weight values of 42 chromosome segment substitution lines (CSSLs) and parents under (A) non-stress and (B) salt stress conditions in 2014. Values are mean ± standard error (n = 3). * indicates a significant difference between Koshihikari and CSSL at the 5% level by Dunnett’s test.
Agriculture 11 00777 g002
Figure 3. Panicle weight values of 42 CSSLs and parents under (A) non-stress and (B) salt stress conditions in 2014. Values are mean ± standard error (n = 3). * indicates a significant difference between Koshihikari and CSSL at the 5% level by Dunnett’s test.
Agriculture 11 00777 g003
Figure 4. (A) Plant dry weight, (B) panicle weight, (C) panicle number, (D) grain yield, (E) spikelet number per panicle, (F) grain filling, and (G) 1000-grain weight of SL2007, SL2008, SL2027, SL2038, Koshihikari, and IR64 under non-stress and stress conditions in 2015. White bars and black bars denote plant performance under non-stress and stress conditions, respectively. Values are mean ± standard error (n = 4). *, **, and *** indicate significant differences from Koshihikari under the non-stress or salt stress condition at the 5%, 1%, and 0.1% levels by Dunnett’s test, respectively.
Agriculture 11 00777 g004aAgriculture 11 00777 g004b
Figure 5. Graphical genotypes of near-isogenic lines (NILs) and their grain yield and ancillary traits under salt stress conditions in 2018. Black and white bars indicate chromosome segments for homozygous IR64 and Koshihikari, respectively. Values are mean ± standard error (n = 4). * indicates a significant difference between Koshihikari and NILs at a 5% level by Dunnett’s test.
Agriculture 11 00777 g005
Table 1. Na+ and Cl contents in the leaf blade, leaf sheath, and whole plant at the full heading stage of Koshihikari, IR64, and selected CSSLs under salt stress conditions in 2015. Values are mean ± standard error (n = 4). *, **, and *** indicate a significant differences from Koshihikari at the 5%, 1%, and 0.1% levels by Dunnett’s test, respectively.
Na+ Content (mmol/g)Cl Content (mmol/g)
LBLSWPLBLSWP
Koshihikari1.19 ± 0.111.41 ± 0.171.26 ± 0.161.70 ± 0.121.43 ± 0.121.25 ± 0.16
IR640.70 ± 0.14 *0.77 ± 0.15 ***0.70 ± 0.10 ***1.04 ± 0.17 ***1.01 ± 0.09 **0.90 ± 0.06 *
SL20070.72 ± 0.07 *0.92 ± 0.09 **0.77 ± 0.06 **1.20 ± 0.10 **1.04 ± 0.05 **0.81 ± 0.04 **
SL20080.76 ± 0.05 *1.06 ± 0.04 *0.89 ± 0.07 *1.18 ± 0.01 **1.19 ± 0.051.17 ± 0.08
SL20270.81 ± 0.101.39 ± 0.101.15 ± 0.141.26 ± 0.12 *1.43 ± 0.071.44 ± 0.10
SL20380.83 ± 0.100.97 ± 0.14 *0.85 ± 0.15 *1.34 ± 0.11 *1.14 ± 0.10 *0.97 ± 0.11
(LB, leaf blade; LS, leaf sheath; WP, whole plant).
Table 2. Pearson correlation coefficients between ion contents and grain yield and yield-related traits of Koshihikari and selected CSSLs under salinity in 2015. Values are mean ± standard error (n = 4). * and ** indicate significant differences at the 5% and 1% levels, respectively.
DWPWPNGYSNTGWGF
Na+ contentLB−0.510 *−0.352−0.475 *−0.3580.215−0.257−0.634 **
LS−0.615 **−0.540 *−0.640 **−0.535 *0.009−0.596 **−0.589 **
WP−0.643 **−0.536 *−0.671 **−0.535 *0.049−0.557 *−0.602 **
Cl contentLB−0.439−0.275−0.397−0.2630.298−0.196−0.543 *
LS−0.621 **−0.548 *−0.659 **−0.549 *−0.029−0.558 *−0.585 **
WP−0.602 **−0.579 **−0.634 **−0.582 **−0.301−0.669 **−0.536 *
(DW, plant dry weight; PW, panicle weight; PN, panicle number; GY, grain yield; SN, spikelet number; TGW, 1000-grain weight; GF, grain filling).
Table 3. Quantitative trait loci (QTL) for grain yield and yield-related traits identified in the F2 population by composite interval mapping on chromosome 2.
TraitQTLMarker Interval (Mb)LODAdditiveR2Parental Source a
Plant dry weightqSTDW2RM13648-RM13755
(25.47–27.45)
2.89−6.449.91I
Panicle numberqSTPN2RM13648-RM13893
(25.47–29.71)
4.70−3.6733.09I
Panicle weightqSTPW2.1RM12674-RM12857
(5.69–8.63)
2.711.0710.39K
qSTPW2.2RM13755-RM13893
(27.45–29.71)
2.83−1.0624.51I
Grain yieldqSTGY2.1RM12674-RM12857
(5.69–8.63)
3.850.5023.64K
qSTGY2.2RM13796-RM5607
(28.27–33.27)
3.72−0.4731.84I
a Parental sources of additive alleles: K (Koshihikari) and I (IR64).
Table 4. Pearson correlation coefficients between grain yield and ancillary traits of Koshihikari and NILs under salt stress conditions in 2018. Values are mean ± standard error (n = 4). *, **, and *** indicate significant differences at the 5%, 1%, and 0.1% levels, respectively.
DWPNPWGYGFTGWSN
DW1
PN0.675 *1
PW0.4330.3681
GY0.2750.1730.950 ***1
GF−0.061−0.2890.698 ***0.859 ***1
TGW0.0720.163−0.312−0.323−0.4381
SN0.250−0.2040.582 **0.548 *0.542 *−0.4311
Publisher’s Note: MDPI stays neutral with regard to jurisdictional claims in published maps and institutional affiliations.

