Article

Relationship between Precipitation Characteristics at Different Scales and Drought/Flood during the Past 40 Years in Longchuan River, Southwestern China

1
Key Laboratory of Mountain Surface Processes and Ecological Regulation, Institute of Mountain Hazards and Environment, Chinese Academy of Sciences, Chengdu 610041, China
2
University of Chinese Academy of Sciences, Beijing 100049, China
*
Author to whom correspondence should be addressed.
Agriculture 2022, 12(1), 89; https://doi.org/10.3390/agriculture12010089
Submission received: 20 December 2021 / Revised: 1 January 2022 / Accepted: 5 January 2022 / Published: 10 January 2022
(This article belongs to the Section Ecosystem, Environment and Climate Change in Agriculture)

Abstract

:
In this study, the temporal and spatial patterns of rainfall in the Longchuan River basin from 1977 to 2017 were analyzed, to assess the feature of precipitation. Based on the daily precipitation time series, the Lorenz curve, precipitation concentration index (PCI), precipitation concentration degree (PCD), and the precipitation concentration period (PCP) were used to evaluate the precipitation distribution characteristics. The PCI, PCD and PCP in five categories, defined by the fixed thresholds, were proposed to investigate the concentrations, and the average values indicated the higher concentrations in the higher intensities. The indices showed strong irregularity of daily and monthly precipitation distributions in this basin. The decrease in the PCD revealed an increase in the proportion of precipitation in the dry season. The rainy days of slight precipitation in the upper and lower basins with significant downward trends (−13.13 d/10 a, −7.78 d/10 a) led to longer dry spells and an increase in the risk of drought, even severe in the lower area. In the upper basin, the increase in rainfall erosivity was supported by the upward trend in the PCIw of heavy precipitation and the simple daily intensity index (SDII) of extreme precipitation. Moreover, the PCP of light precipitation, moderate precipitation, and heavy precipitation concentrated earlier at the end of July. The results of this study can provide beneficial reference information to water resource planning, reservoir operation, and agricultural production in the basin.

1. Introduction

Agricultural production, flood control, drought resistance, and human activities are directly affected by changes in precipitation. Currently, the annual precipitation has changed due to global climate change [1,2]. In China, a small part of meteorological stations indicated significant trends in the amount of precipitation, although 41.3% of 774 stations showed a downward trend, and 58.1% of them indicated an upward trend [3]. However, the intensity, duration, and frequency of precipitation have changed due to climate change, which has caused more extreme weather in some areas [4,5]. Therefore, it is necessary to pay more attention to the temporal and spatial distribution characteristics of precipitation. The distribution characteristics of precipitation were affected by several factors, such as topography [6], elevation [7], monsoon [8,9], and urbanization [10]. The precipitation distribution at different scales had a direct effect on crop growth [11], drought/flood occurrence [12,13], soil erosion [14,15], and water circulation processes [5].
Several indices of precipitation concentrations have been used to reflect precipitation changes. The Gini of concentration index by the Lorenz curve is widely used to describe the feature of daily precipitation [16,17,18]. Hu et al. [19] used CI and Lorenz asymmetry coefficient S to analyze the daily precipitation distribution characteristics of China from 1961 to 2013. They found that the temporal inequality of daily precipitation increased in most parts of China, but the changes in temporal inequality of precipitation varied among regions. The PCI [20] is developed to evaluate the monthly precipitation in the year. PCI could also be estimated the monthly precipitation concentration during the season [21]. Keivan et al. [22] used PCI to analyze the precipitation data in annual and seasonal time scales over 50 years, revealing that precipitation concentration follows a similar trend within 25-year subscales. Jiang et al. [10] used CI and PCI to analyze the distribution characteristics of daily and monthly precipitation in China, demonstrating that these two indices were high in northeast China and low in southwest China, while the distribution and change patterns in the rest of the region were different. Meanwhile, PCD and PCP [23] are also used to analyze monthly precipitation concentration and period throughout the year. Chatterjee et al. [8] analyzed the temporal and spatial distribution of monthly precipitation and its relationship with the monsoon in India using PCD, PCP, and PCI. Huang et al. [9] analyzed the temporal and spatial characteristics of PCD, PCP, and PCI from 1960 to 2015 in China, finding that there were obvious regional differences, with an overall downward trend with weak volatility. Drought event is not only attributed to the less precipitation, but also attributed to the increase in the duration of a dry spell. The variability of daily precipitation can describe wet/dry spells, which are helpful to understand the impacts of precipitation concentration. The number of spells, average length of spells, and maximum length of spells are the common indices used to analyze the characteristics of dry/wet spells [24,25].
Most of the recent reporters mainly focused on the temporal and spatial changes, while there are a few studies on the relationship between heterogeneity of precipitation and meteorological drought/flood. Liu et al. [26] combined the temporal and spatial characteristics of precipitation and PCD values to analyze the relationship between meteorological drought/flood in China. Zhang et al. [27] used PCD and PCP in the analysis of flood disasters in the Yangtze River basin and analyzed the basic characteristics of drought/flood disasters. The researchers [28] reported that the feature of precipitation is correlated with the long-term drought in southwest China. A lot of attention is usually paid to extreme events, to explain the changes in precipitation concentration. However, the precipitation in each intensity played various roles in the change of the amount, frequency of precipitation.
In recent years, the vulnerability of water resources in Yunnan Province has increased significantly [29], and the drought has increased [30]. The Longchuan River is the main river in the north of Yunnan Province, where droughts and floods frequently occur, known as “two droughts and one flood in three years”. In some years, droughts and floods occurred alternately. According to the yearbook of Chuxiong, 16-year occurred different degrees of drought during 33-year from 1971 to 2003. Drought has resulted in reduced or even wiped-out of grain crops, which has had a noticeably impact on the production of crops, the life of local farmers, and the drinking water of livestock. In addition, production and domestic water consumption increased 1.32 billion m³ from 1999 to 2015, with the population of the basin increasing about 248 thousand [31,32]. Rice, corn, and wheat, as well as cash crops and vegetables, are grown extensively in this basin. Numerous reservoirs and dams have been built on the Longchuan River to supply agricultural irrigation throughout the basin during the less rainy days. The increasing demand for water presents new challenges to water resources management. Understanding precipitation distribution in the Longchuan River is critical given the importance of water as a vital resource for agricultural production and human activities.
This work analyzed temporal and spatial distribution characteristics of daily, monthly, and seasonal precipitations in this basin. The trends of precipitation and rainy days and the indices of the precipitation concentration in each intensity were investigated. The relationship between distributions of precipitation and drought/flood in this basin was revealed.

2. Materials and Methods
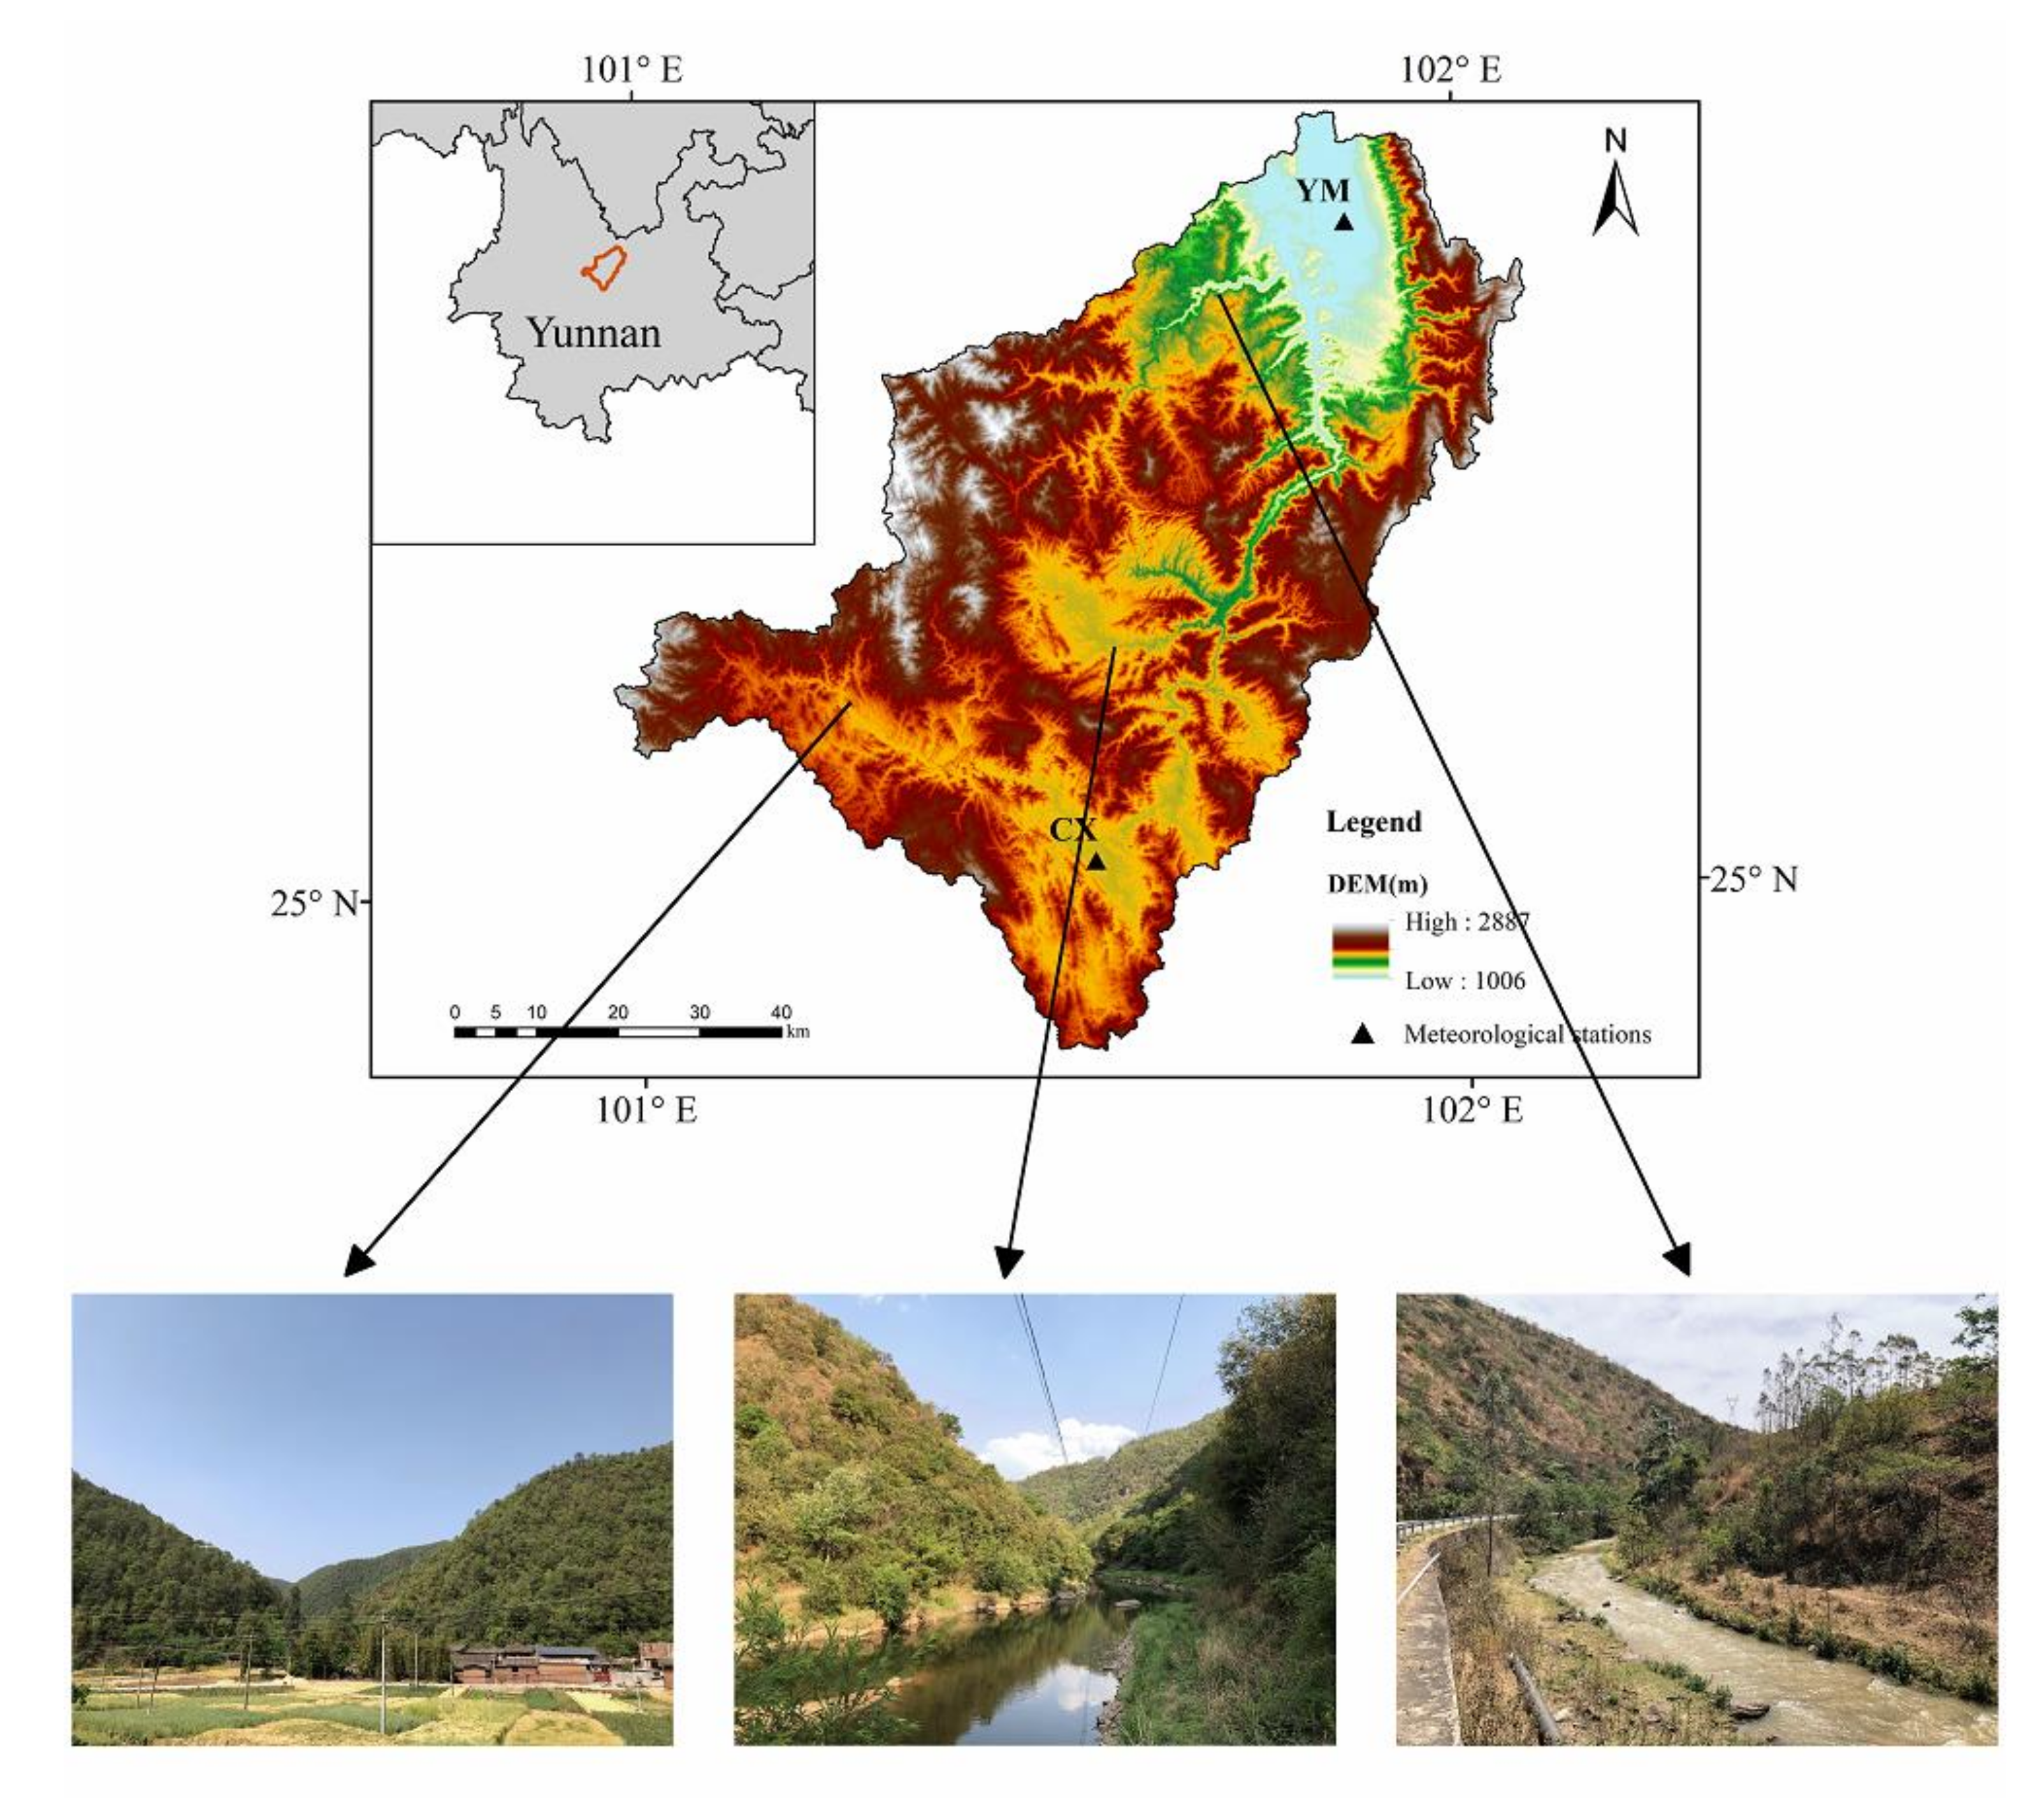
2.1. Study Area

The Longchuan River basin (LRB), the largest tributary in Yunnan Province of the Jinsha River (upstream of the Yangtze River), is located in southwest China. The Longchuan River flows from south to north into the Jinsha River. In this study, the area lies between the latitudes of 24°49′ N and 25°52′ N and longitudes of 100°58′ E and 102°04′ E, covering an area of about 5560 km2 (Figure 1). The topographic characteristics and geographical location of the LRB play a significant role in obvious climate variations of the upper and lower reaches of the basin. The typical dry–hot valley climate in this basin is a special geoecological phenomenon, located downstream at an elevation between 900 and 1350 m [33]. Owing to the influence of the East Asian and South Asian monsoons [34], the climate is characterized by a distinct wet season (May to October) in which the contribution of precipitation is more than 88%. The annual precipitation (1977–2017) in the LRB was 867 mm upstream and 644 mm downstream. The annual average (1977–2017) temperature in the upper reaches was 17.0 and increased to 22.3 °C in the lower reaches.

2.2. Data

Daily precipitation data for the LRB were obtained from the China Meteorological Science Data Sharing Service Network (CMA). Chuxiong (CX) and Yuanmou (YM) Meteorological Station are the only two national meteorological stations in the basin. The CX station (1824.1 m) lies upstream and the YM station (1120.6 m) lies in the dry–hot valley downstream. Therefore, the CX station and YM station represent the climate characteristics of the upstream and downstream in the study area, respectively. There was 41 years (1977–2017) worth of available precipitation data for two stations, with no missing data. The quality of the dataset was controlled before release. The homogeneity tests of observed data were performed using the RclimDex software package (http://etccdi.pacificclimate.org/software.shtml (accessed on 19 December 2021)).

2.3. Methods

According to the National Standard (i.e., grade of precipitation (GB/T 28592–2012)), 0.1 mm/d was used to separate wet and dry days in this study. Moreover, the daily precipitation was categorized into four intensity groups: light precipitation (0.1–9.9 mm/d), moderate precipitation (MP) (10–24.9 mm/d), heavy precipitation (HP) (25–49.9 mm/d), and extreme precipitation (EP) (≥50 mm/d). In this study, considering a lack of rain in the dry season in the LRB, the light precipitation with 0.1–9.9 mm was categorized into slight precipitation (SP) (0.1–0.9 mm/d) and light precipitation (LP) (1–9.9 mm/d).

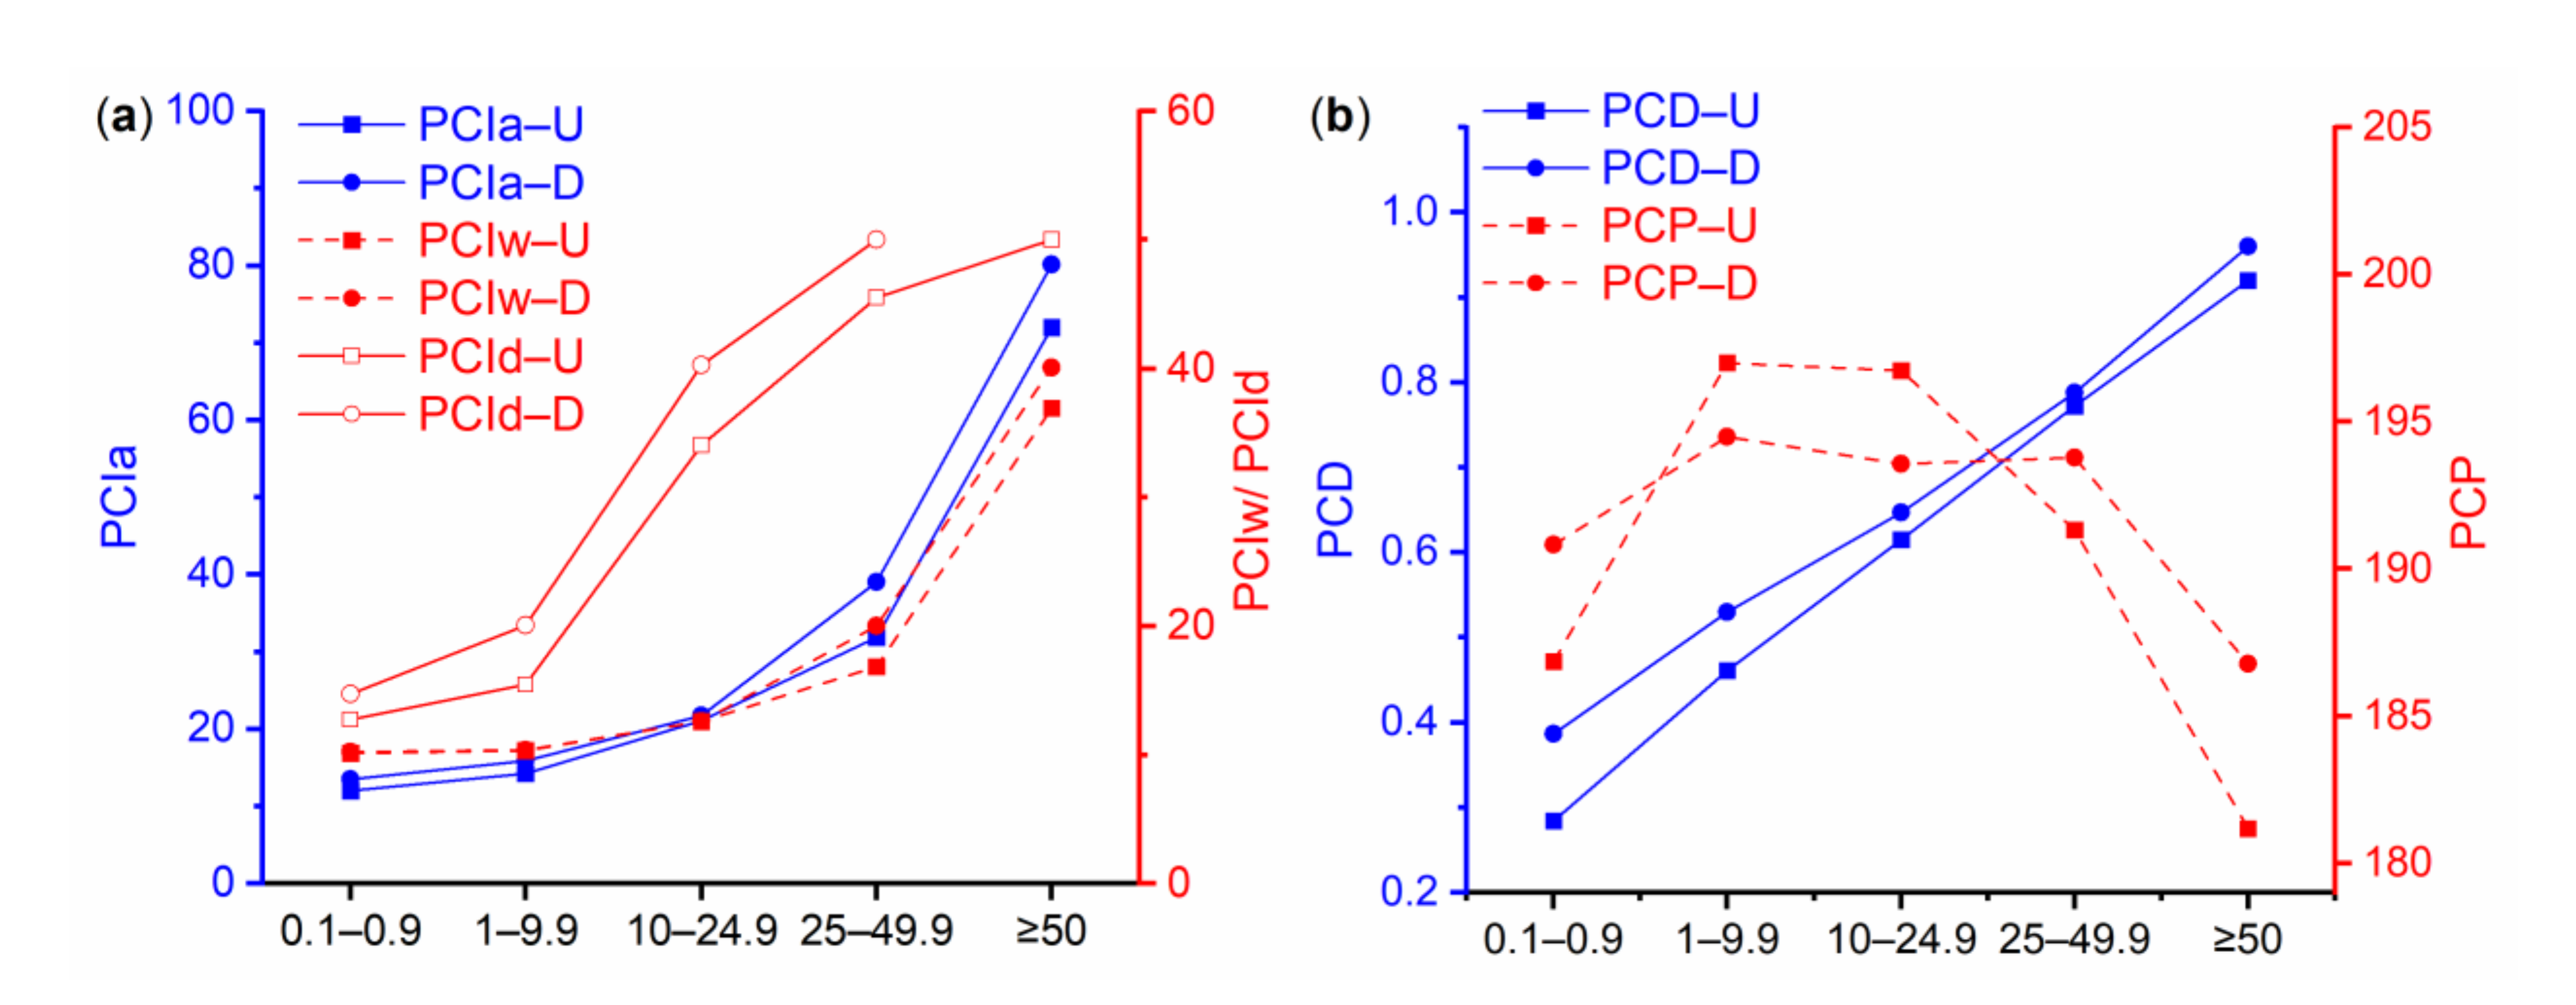
2.3.1. Precipitation Concentration Index (PCI)

PCI is an index proposed by Oliver [20] to indicate the monthly precipitation heterogeneity. It can be expressed as follows:
P C I a = 100 i = 1 12 P i 2 i = 1 12 P i 2
In addition, the PCI was calculated on a seasonal scale for the wet season (PCIw) and dry season (PCId).
P C I w / d = 5 0 i = 1 6 P i 2 i = 1 6 P i 2
where PCIa and PCIw/d are PCI value for the annual and wet/dry season, Pi is the monthly precipitation in month (i). According to the formulae, the minimum value is 8.3 on all scales. In addition, a PCI value of 16.7 indicates that the total precipitation was concentrated in half of the period and a value of 25 denotes that the total precipitation occurred in 1/3 of the period [35]. Oliver [20] suggested that the annual PCI (PCIa) value is less than 10 shows a uniform monthly precipitation distribution, from 11 to 15 represents a moderate precipitation concentration, from 16 to 20 indicates an irregular distribution, and above 20 represents a strong irregularity of precipitation distribution. In this study, we proposed the PCIa and PCIw/d in each intensity. Those indices were calculated and analyzed.

2.3.2. Precipitation Concentration Degree (PCD) and Precipitation Concentration Period (PCP)

PCD and PCP were proposed by Zhang et al. [23] to characterize precipitation distribution and concentration period. Its concept is based on the assumptions that the monthly precipitation is a vector containing both magnitude and direction [17,36]. PCD and PCP are defined as:
R x = i = 1 12 r i sin θ i R y = i = 1 12 r i cos θ i P C D = R x 2 + R y 2 R P C P = tan 1 R x R y
where i is the month of the year, ri is the amount of precipitation during the month, and θi is the azimuth of the month. R is the total precipitation amount. PCD reflects the degree of monthly precipitation concentration in 12 months and PCP represents the period when the maximum precipitation occurred. The PCD value ranges from 0 to 1, with a PCD closer to 1 showing more concentrated precipitation and a PCD closer to 0 showing more uniform distribution of monthly precipitation [26]. The PCP is an azimuth of the composite vector, a year (365 or 366 days) expressed by a cycle of 360° and 1 month expressed by 30°, and January 15 is 0° [23]. In this study, the PCD and PCP in each intensity were been calculated.

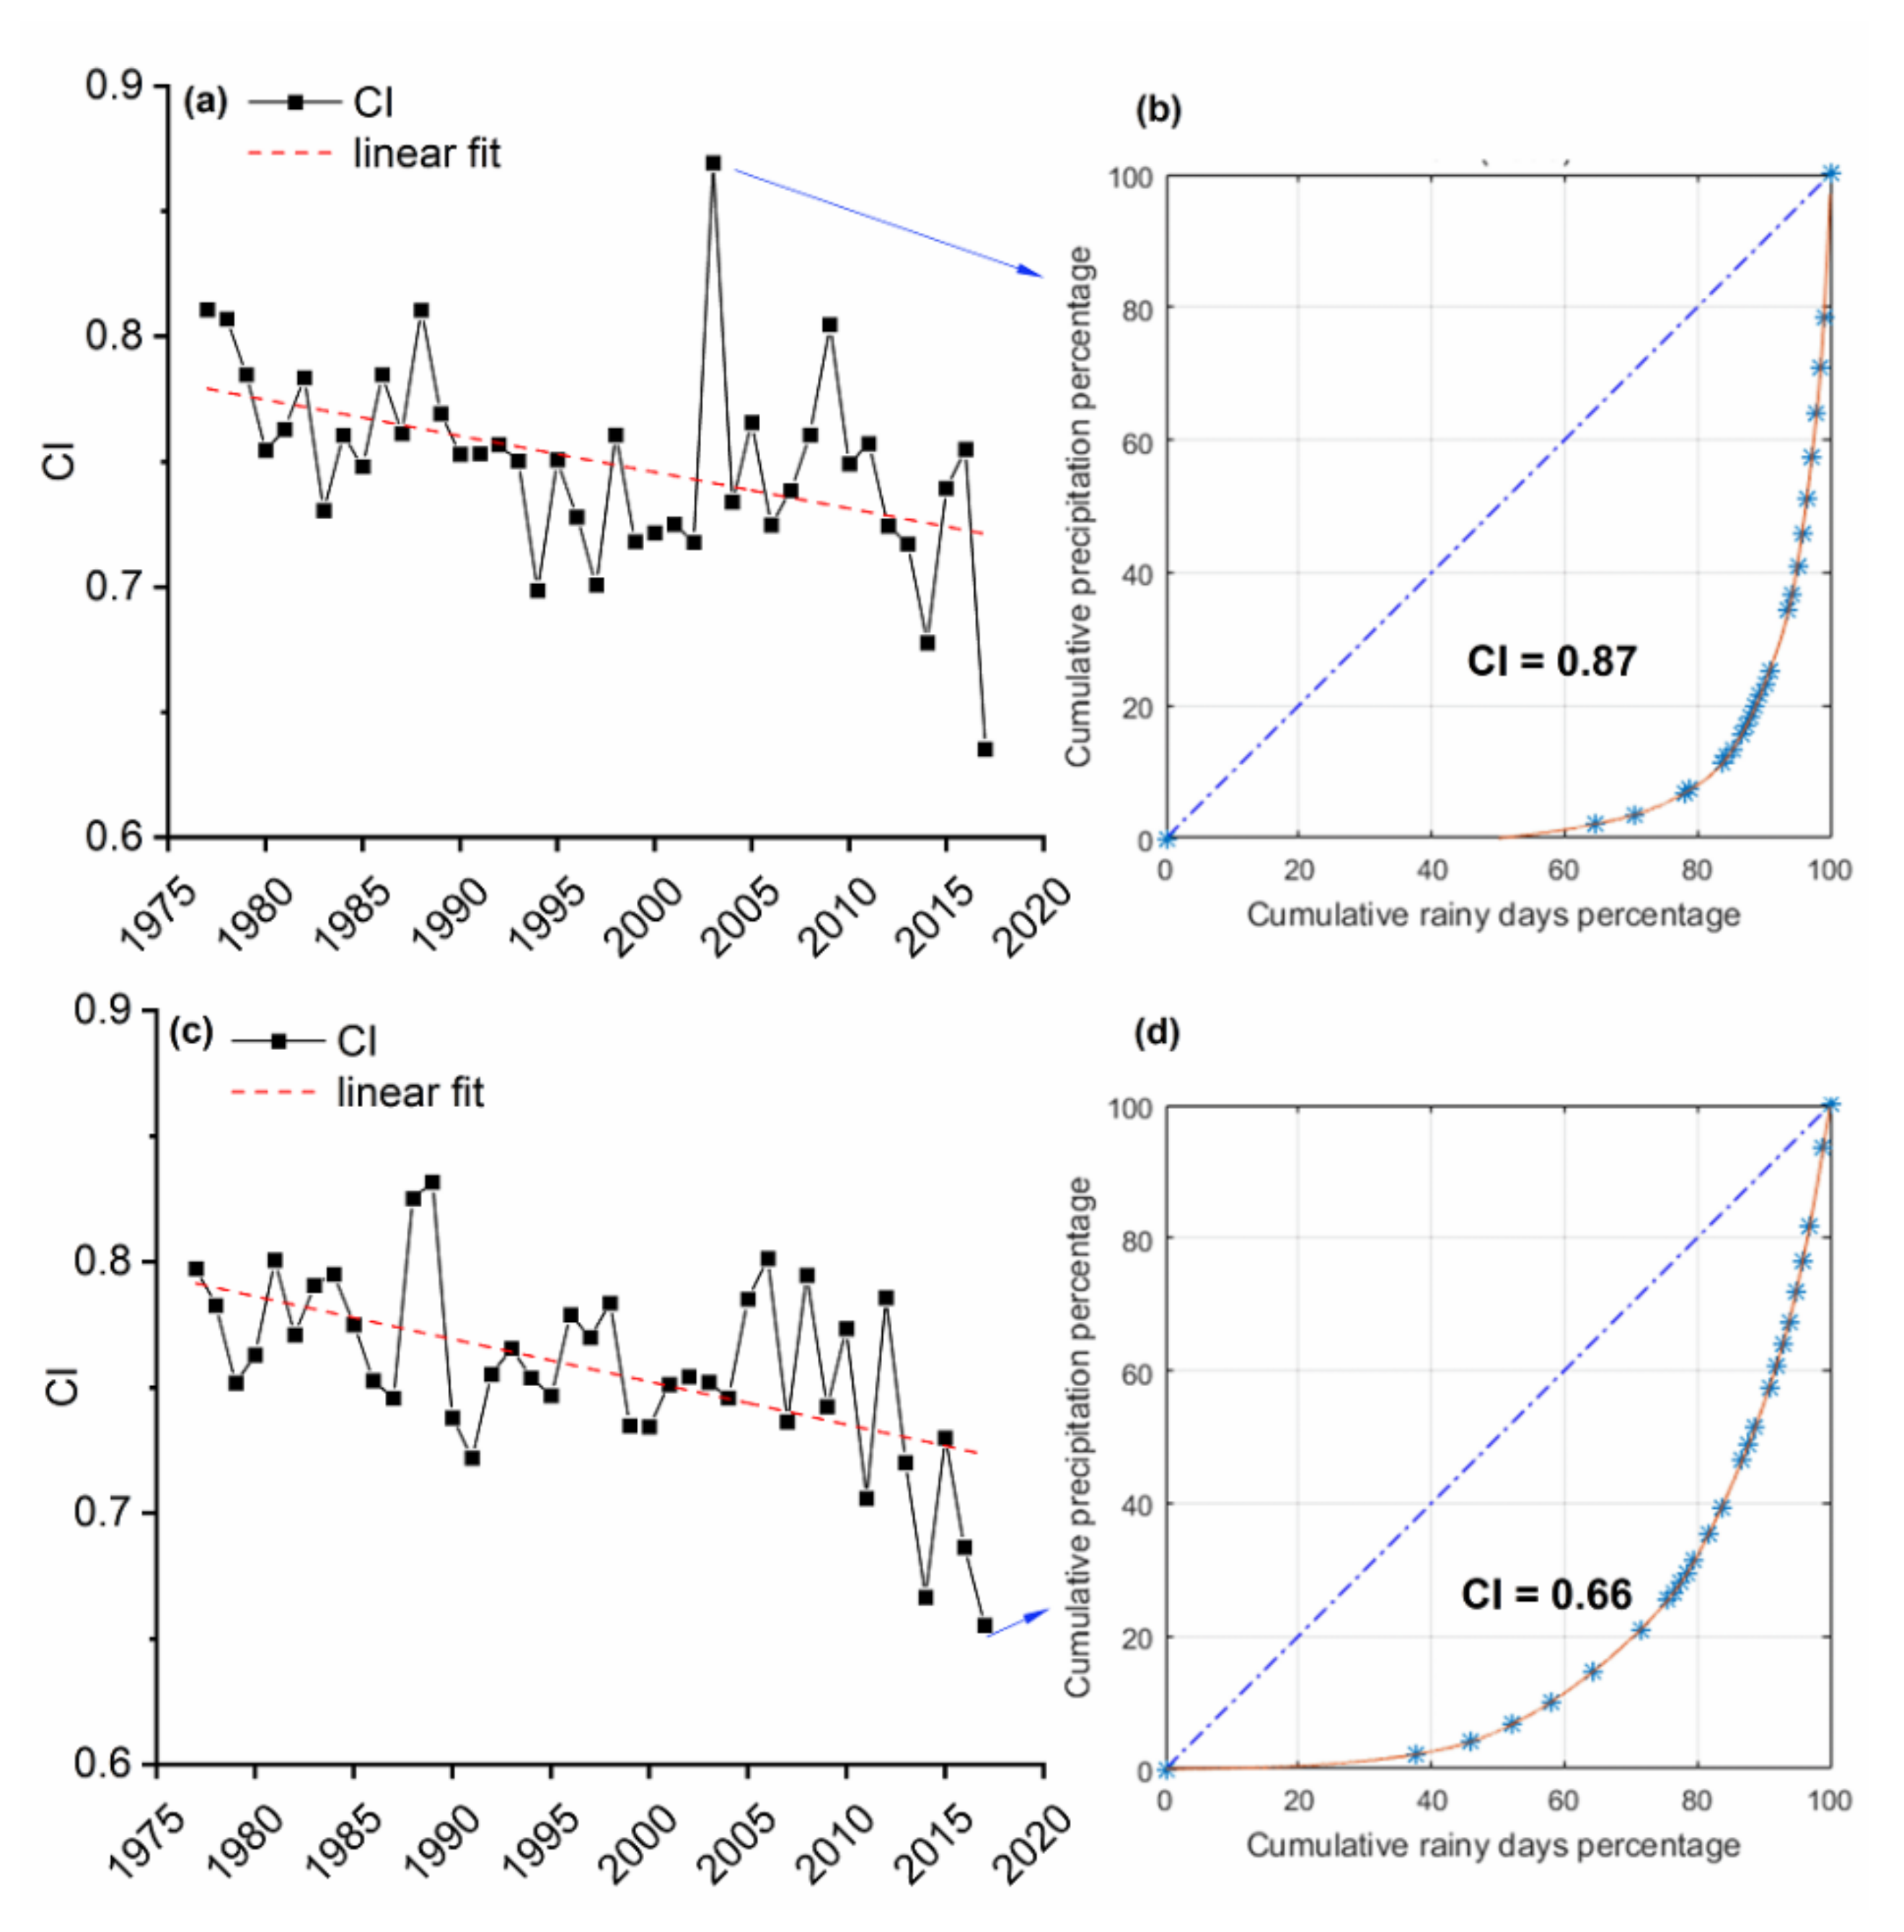
2.3.3. Gini Concentration Index (CI)

The Gini coefficient was originally introduced to describe the inequality of income in economics. It was recently applied in hydrology [37] and meteorology [18] to analyze the inequality distribution of streamflow and precipitation. To evaluate the contribution of different daily rainfall classes to the total precipitation amount, CI was introduced to the study. Moreover, 1 mm of precipitation was applied for the class interval to classify precipitation values in an ascending order. Then the cumulative percentage of precipitation and the cumulative percentage of rainy days were calculated, respectively. Inequality of precipitation distribution was measured by determining the percentage of rainfall contribution by rainy days falling in each class. The Lorenz curve was plotted against the cumulative percentage of rainy days (x) and the associated cumulative percentage of precipitation amount (y). This relationship can be expressed by a positive exponential distribution curve as follows:
y = a x exp ( b x )
where a and b are constants determined by the least-squares method.
Then the CI is defined as:
C I = 2 A / 10000
where the area A enclosed by the bisector of the quadrant and the Lorenz curve can be represented as follows:
A = 0 100 [ x y ( x ) ] d x
A higher precipitation CI value shows that the precipitation amount is more concentrated into a few rainy days in the year, and vice versa [36].
However, the CI does not contain all of the information of the Lorenz curves because different Lorenz curves can have the same CI value [38]. Therefore, the Lorenz asymmetry coefficient S was introduced to quantify the contribution of different groups to the total heterogeneity. S can be calculated as [38]:
S = F μ + L μ μ = x 1 + x 2 + + x n n δ = μ x m x m + 1 x m F μ = m + δ n L μ = L m + δ x m + 1 L n = i = 1 m x i + δ x m + 1 i = 1 n x i
where x i is the ordered time series, x 1 x 2 x m x n , n is the sum of rainy days, μ is the mean daily precipitation over all rainy days, m is the number of precipitation values less than μ . If S > 1, the inequality is attributed to a small number of very large rainfall events while if S < 1, the inequality is attributed to a large number of very small rainfall events [37].

2.3.4. Wet Spells and Dry Spells

A wet/dry spell is defined as a period of consecutive wet/dry days [39]. The indices of wet and dry spell calculated in this study list in Table 1. It should be noted that the statistics in this study are based on the actual dry/wet spells. For example, the dry spell lasted from the previous year to the next year. We defined as the dry spell of the next year, which was often the largest number of consecutive days of the dry spell.

2.3.5. Trend Analysis

The Mann–Kendall (MK) trend test [40,41] is a non-parametric test method to evaluate the temporal trend of hydro-meteorological series [42,43]. The test statistic S is calculated as:
S = i = 1 n 1 j = i + 1 n s g n ( x j x i )
sgn x j x i = 1 0 1 x j > x i x j = x i x j < x i
where n represents the number of data points, xi and xj are the data values in time series i and j (j > i), respectively. The variance of S has been computed as:
var ( S ) = n n 1 2 n + 5 i = 1 m t i t i 1 2 t i + 5 18
where m is the number of tied groups and ti reflects the number of data in the ith group. The standard normal variable Z is calculated as follows [44]:
Z = S 1 var ( S ) 0 S + 1 var ( S ) S > 0 S = 0 S < 0
Z > 0 shows an increasing trend, while Z < 0 indicates a decreasing trend. The null hypothesis of no trend is rejected, if |Z| > 2.58, |Z| > 1.96 and |Z| > 1.65 at the 1%, 5%, 10% significance levels, respectively.
Moreover, Sen’s slope [45] was used to evaluate the slope of a trend. The value can be expressed as follow:
Q m e d = M e d i a n x j x k j k ,   1   <   k <   j   <   n .
where xj and xk are the data points at time j and k, respectively. The Qmed shows the steepness of the trend. The positive value of Qmed denotes an increasing trend and the negative value reflects a decreasing trend. In this study, the Qmed was multiplied by 10 to express the trend per decade (/10a).

3. Results

3.1. Annual Precipitation Trends

Figure 2 displays the annual average amount of precipitation (mm) and the number of rainy days (day) in each intensity. Overall, there are similar patterns in the distributions of precipitation and rainy days in each intensity in the upper and lower areas. In each grade, both the annual amount of precipitation and number of rainy days in the upper basin are more than those of the lower basin of the LRB. MP made the largest contribution to the amount of precipitation. LP and HP also had larger weights over the basin. Moreover, the highest number of wet days in the LRB is the rainy day of SP, accounting for about 50%. A high frequency can also be observed in LP with a contribution of about 33%. The frequency in each intensity with the higher grade of precipitation decreased progressively.
The trends of precipitation, rainy days, and SDII over the LRB during 1977–2017 were analyzed with the MK test and Sen’s slope estimator are shown in Table 2. Annual precipitation showed contrasting trends across the basin. A large increase (20.16 mm/10 a) and a decreasing trend (−5.08 mm/10 a) occurred in the upper and lower areas, respectively. SP showed significant downtrends over the LRB. A large decreasing trend for LP was also detected across this basin, which dominated the total precipitation with the downward trend in the lower region. MP and HP were mainly detected with obvious positive trends, which made the total precipitation decrease in the upper region. A decreasing trend for EP occurred in the lower basin. Compared with annual precipitation without significant trends, rainy days were characterized by obvious downward trends. The rainy days of SP over the basin showed significantly large negative trends at a 0.01 significance level, which had a strong influence on the uptrend of the proportion of rainy days in other grades. The rainy days of LP also decreased significantly, while the rainy days in higher intensities changed weakly. Resulting from the significantly decreasing trends of rainy days, the total SDII had significantly increasing trends in the LRB. Increasing trends were also detected in all the SDIIs except the EP in the lower regions, which are different from the changing behaviors of the precipitation and rainy days. The SDII for EP was detected in the upper reaches with a large upward ((2.36 mm/d)/10 a) trend. Moreover, in the upper reaches for all intensities, the greater precipitation intensity, the lager increasing with SDII.

3.2. Characteristic of Seasonal/Monthly Precipitation

Figure 3 presents the temporal distribution patterns of precipitation and rainy days in each intensity on a monthly scale across the LRB. Clear wet and dry seasons are the main characters in this basin, with higher SDII in the wet season. The most amount of precipitation generally occurred during the wet season. The highest average amount of monthly precipitation was observed in July and the least occurred in February. Precipitation in different intensities exhibited different contributions in each month. SP occurred uniformly in each month, with main rainy days in the dry season (>67%) but a slight contribution to the amount of monthly precipitation (1.2–10.7%). LP and MP occurred almost in each month with distinct seasonal characteristics. In the wet season, MP contributed more than 31.7% precipitation by less than 13.5% rainy days across the basin, which is the highest precipitation followed by LP and HP. During the dry season, LP made the highest contribution (47.0%, 45.7%) to the amount of precipitation with a low frequency over the LRB, and MP had a major contribution (40.2%) to the dry season precipitation in the lower basin. Most HP and EP (>95.8%) were detected in the wet season, and several times of HP occurring in the dry season. In the lower dry–hot valley, the EP events showed a noticeable contribution (>17.5%) to the monthly precipitation in June and July. In the dry season, EP occurred twice during the recent 41 years in the upper reaches, while never occurring in the lower reaches.
The trends of precipitation, rainy days, and SDII over the LRB in the wet season are listed in Table 3. The total amount of precipitation in the wet season exhibited a consistent trend with the annual amount across the basin. In the upstream area, there are similar change patterns with annual amount and proportion of precipitation, rainy days, and SDII in each grade. Those changes in the wet season dominated the annual change. While in the downstream area, the amount of MP also occurred a large decreasing trend with an increasing trend in SDII. Except for the precipitation of HP, precipitation in all intensities with negative trends leads to the total precipitation with an obvious upward trend. Overall, the climate became wetter in the upstream area and drier in the downstream area.
In the dry season, insignificant positive trends of total precipitation were detected across the LRB shown in Table 4. It made a wetter dry season, even though significant decrease exhibited in the rainy days. A larger significantly decreasing trend still occurred in the SP in the upstream region. Although the Sen’s slope of MP and HP in the upper area showed 0, there were still slightly positive trends with the value of Z above 0 in the MK tests. In the downstream region, the amount of LP with an obvious increasing trend dominated the total precipitation with an upward trend in the dry season. Moreover, the downtrends with the SDII in the MP over the basin and a larger negative trend for HP in the upper region were also obvious. For the dry season, a higher significant decrease in rainy days made a decreasing proportion of rainy days, especially a significant downward occurring in the upper region.
To evaluate the monthly precipitation distribution characteristics, PCI, PCD and PCP were analyzed in this study. The PCIa for total precipitation is 17.5 and 18.8 in the upper and lower areas, respectively, with the value ranging from 14.0 to 27.1. There are 6 of 41 years and 12 of 41 years for the PCIa more than 20 in the upper and lower regions, respectively. The annual average of PCI in each intensity is shown in Figure 4a, exhibiting the higher grades, the higher values of PCI in annual and seasonal scales. It is obviously that most values of PCI in the lower basin are higher than those in the upper basin. Similar patterns were exhibited in the PCIa and PCIw, while the different growing trends showed in the PCId. The average PCI values of EP are much more than that of other intensities for the wet season (36.9, 40.1) and annual precipitation (72.0, 80.2), which denotes that the EP event mainly happened during the wet season less than 2-month. The strong irregularity was also observed in the PCId (>34.0) for MP, HP, and EP during the dry season, nearly occurring during 1 month. Overall, the value of PCI suggests a higher seasonality for monthly precipitation distribution in the downstream area, especially during the dry season.
The average total annual amount of precipitation of PCD was 0.61 and 0.65 increasing from the upper to lower basins, which was a high value in the Yangtze River basin [17]. The average PCD and PCP in each intensity are also analyzed (Figure 4b). Similarly, the PCD for each intensity in the lower reaches is greater than that of in the upper reaches, suggesting a stronger irregular precipitation concentration in the lower reaches. Whereas, the PCD in each intensity increased gradually with the higher grade, not absolutely the same as the changes of PCI. It seems different ways of characteristics for PCI and PCD, although both of them identify the monthly precipitation concentration. The annual PCP values vary from 171° to 226°, indicating that the annual total precipitation concentration period varies from 8 July to 1 September. The annual average PCP for a total amount in the upper reaches was 194° (July 31), and for the lower reaches was 193 (July 30), denoting that the concentration period occurred nearly at the same time throughout the basin. Although the total precipitation concentration period happened at the end of July, the PCP for each grade showed variable concentration periods. The PCP for EP was the earliest (181°, 187°), the PCP for SP follow (187°, 191°), then the concentration period of LP, MP, and HP occurred later. The concentrated rainy days for each intensity arrived during a shorter period in the upper area, especially the large proportion precipitation (LP, MP, and HP).
Table 5 presents the trends of PCI, PCD and PCP in each intensity in the upper and lower basins. Different changing behaviors exhibited between the PCI and PCD, also between the upstream and downstream, although the similar distribution of monthly precipitation across the basin. PCIw and PCId for total precipitation showed increasing trends over the basin, while the PCIa with a positive trend in the upper areas and a slight negative trend in the lower areas. The values of PCI for SP were observed increasing trends over the LRB with some significant trends, indicating that the seasonal characteristics of annual SP were enhanced. In the upper basin, the PCIa in each intensity exhibited upward trends except PCIa for EP, denoting that the seasonality of these intensities’ annual precipitation is enforced. PCIw for HP had a significant positive trend, showing an increasing uneven distribution of HP in the wet season in the upstream basin. In the lower basin, PCI for HP also observed uptrends in the annual scale and wet season, while the PCIa for LP and MP had downtrends. However, insignificant negative trends with the PCD for total precipitation over the study area, and for most intensities. To compare changes in the PCI, the PCD for upstream total precipitation, MP, and HP and the downstream HP exhibited an opposite trend in associated intensity precipitation. Although both PCI and PCD are the indices of evaluating the concentration of monthly precipitation, they presented different characteristics for the distribution of monthly precipitation. As for the PCP, there were still no significant decrease trends for PCP of total precipitation, indicating that the rainy season arrived earlier than before. The PCP for SP and EP over the basin had insignificant increasing trends, which also observed in PCP for HP in the downstream area. It implied that these rainfall events have been delayed. The obvious decreases were presented in the PCP for LP and MP. Since 2000, the PCP values in the LRB have advanced from the beginning of August to the end of July. In the upper basin, the concentration period of LP, MP arriving earlier than before 2000 about 10 days occurred at the end of July along with HP.

3.3. Characteristic of Daily Precipitation

Figure 5a,c shows the time series of CI in the upper and lower areas from 1977 to 2017. The value of CI in the LRB ranged from 0.64 to 0.87, with an average of 0.75 and 0.76, respectively. The highest value of CI (Figure 5b) was recorded in the upper region in 2003, which also corresponded to the highest value of S with 0.96. The lowest CI was also recorded in the upper area in 2017, suggesting a more uniform distribution of daily precipitation. In the lower region, the highest CI was 0.83 in 1989 and the lowest CI was 0.66 (Figure 5c) in 2017. The Lorenz asymmetry coefficient S in this basin varied from 0.79 to 0.97, all below 1, which exhibited that the unevenness of daily precipitation was mainly caused by a large number of light rainfall events during the study period. The CI values presented significantly downward trends (p < 0.01) over the basin. They had decreased from 0.8 in the 1970s to 0.65 in recent years with the slope of −0.014/10 a and −0.016/10 a, respectively. Meanwhile, S was detected a slightly insignificantly decrease both with −0.003/10 a slopes. The temporal inequality of daily precipitation in the basin was declining, and the small rainfall still a dominated precipitation intensity in the LRB.

3.4. Wet Spells and Dry Spells

The characteristics of wet/dry spell can give a better understanding of flood and drought. Table 6 displays the trends of indices of dry spell. Significantly increasing trends were observed in ADS, MDS, and DS95 over the basin, larger upward trends with these indices in the upper area. It should be noted that the MDS in 13 of the 41 years beginning from last year in the lower region, and the longest MDS was as longer as 101 days. Table 6 also illustrates that upstream NDS had a significantly decreasing trend while downstream NDS indicated unremarkable trend. These results suggested that the decrease frequency dry spells but increase duration of dry spells happened in the upper region while only increase duration of dry spells occurred in the lower region.
Table 7 shows the trends of indices in wet spells over the basin. Significantly decreasing trends were observed in AWS, MWS, and WS95, converse with associated indices in the dry spell. Both the frequency and the duration of a wet spell with significantly negative trends were observed in the upper area. The downstream was characterized by a decreased duration of the wet spell. Table 7 also exhibits that obvious decreases were detected in the LRB with MPW. The annual average period of MPW was 13.7-days and 9.5-days long with the amount of 160.9 mm and 108.3 mm precipitation in the upper and lower basins, respectively. It should be noted that MPW might not occur during the longest wet spell, although the trend in MPW is consistent with the increasing MWS. The average Rx1day is 63.8 mm and 61.5 mm, which were a considerable amount of precipitation that can cause flood in this basin. A large insignificant trend was observed in the extreme precipitation (R95p) in the upstream area.

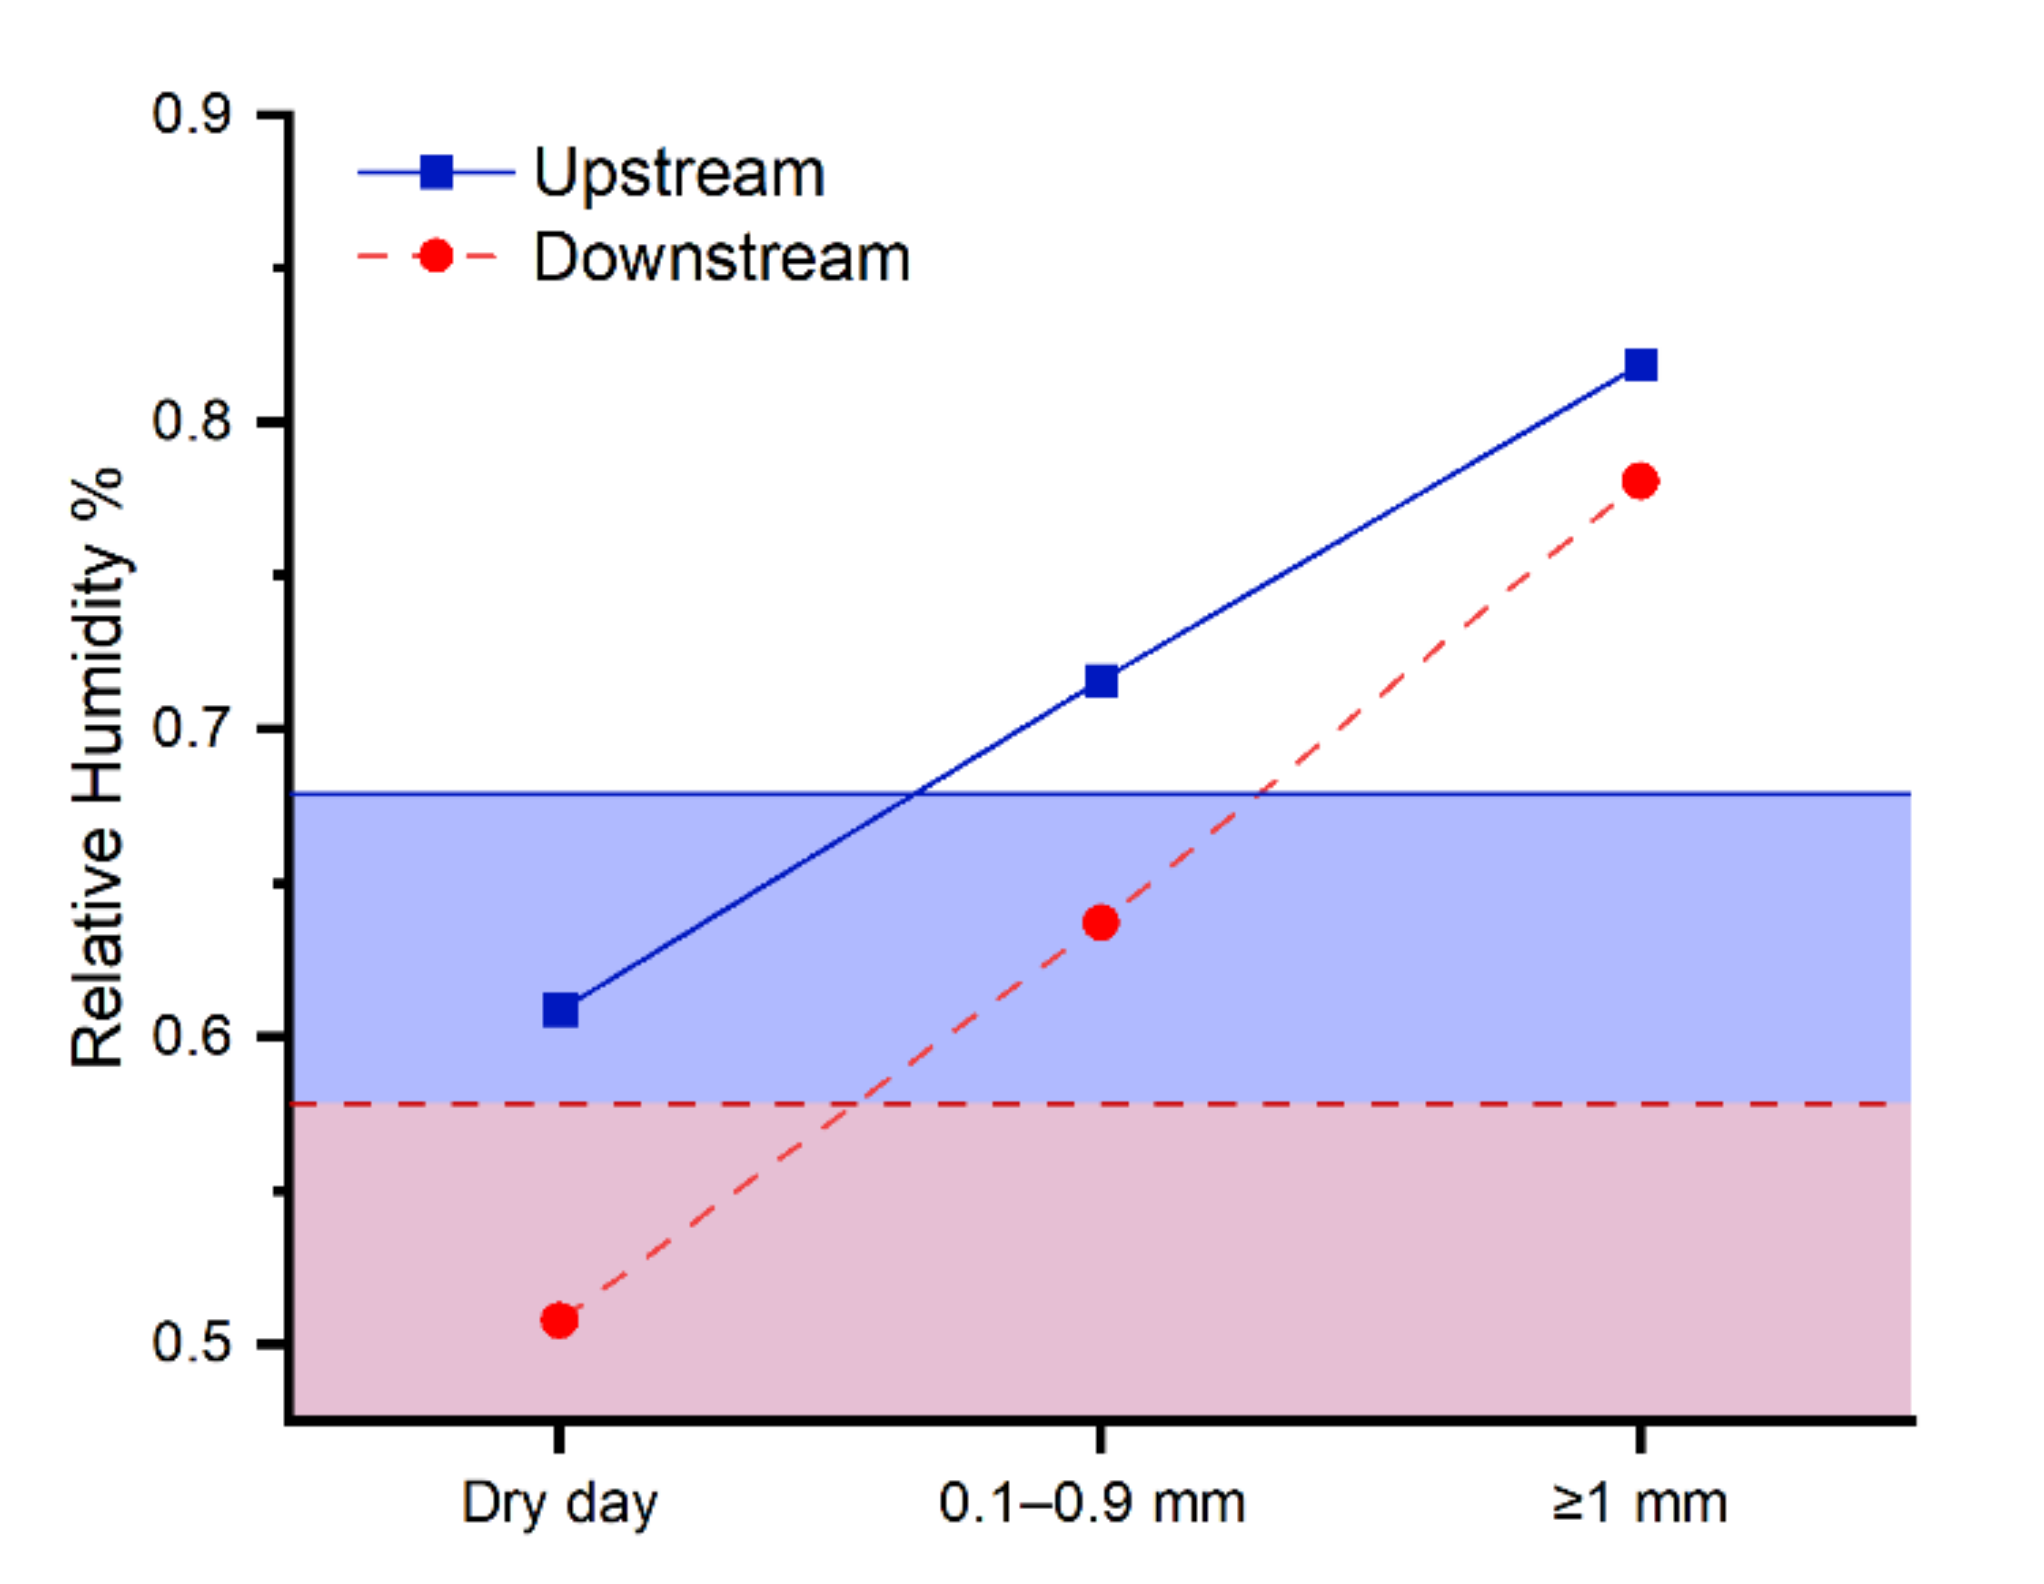
3.5. Correlation Analysis

In this section, the Pearson correlation coefficients were calculated to further understand the changing pattern of precipitation. The relationship between precipitation in each intensity and indices of concentration, and wet/dry spell over the LRB, are shown in Figure 6a,b. Various correlations were observed in the upper and lower basins. There are some plots without meanings, such as the plot in the cross of PCIw and SPd (SP in the dry season). CI is significantly positively correlated to SP and EP, while significantly negatively correlated to LP and MP across the basin, which suggests a higher CI, denoting more SP and EP, and less LP and MP. PCI exhibited weak significantly negative correlations with precipitation in each intensity. However, we found that the contribution of the maximum amount of monthly precipitation had great positive correlations with PCIa (r = 0.80, 0.86, p < 0.01), and a higher correlation with PCIw (r = 0.84, 0.86, p < 0.01). This phenomenon revealed that the PCI value is dominated by the contribution of the maximum amount of monthly precipitation, single monthly precipitation. Meanwhile, PCD experienced significantly negative relationships with the amount of precipitation in the dry season, especially with LP, MP, and HP, which are large contributions to the dry season precipitation. We also found that the contribution of precipitation during six months of the dry season had higher negative correlations with PCD (r = −0.82, −0.67, p < 0.01). This may explain the different trends observed in PCI and PCD, although they are both indices of monthly precipitation concentration. The annual amount of precipitation barely correlated with the concentration indices or the wet season precipitation. It means that the characteristics of precipitation distribution with daily and monthly scales were not affected by the amount of precipitation in the wet season.
The relationship between the rainy days in each intensity and the indices over the basin are presented in Figure 6c,d. Compared with the relationship with the annual amount of precipitation, the annual number of rainy days had higher significant correlations with CI and PCI. Meanwhile, higher significant correlations were observed between the indices of frequency and duration of dry/wet spells and the number of rainy days than the amount of precipitation. In the upper area, the annual SP is significantly positively correlated to NDS and NWS, while in the lower area, only SP in the dry season was observed a significant correlation, so as LP. However, various relationships were detected in indices of the duration of the dry and wet spells. In the upper region, strong significant correlations were presented between rainy days of SP and the indices of the dry spell (ADS, MDS, and DS95), indicating that the trends with these indices were attributed to the significant downward trend in the annual SP, smaller number of rainy days of SP, longer duration of the dry spell. However, in the lower region, because of a large number of MDS lasting cross-year, no obvious correlation was observed between MDS and the rainy days in intensities, except a slightly negative relationship with the rainy days of MP in the dry season. In addition, ADS and DS95 had high significant negative correlations with SP in the dry season, and DS95 had significant negative correlations with MP during the dry season, suggesting that the duration of the dry spell was mainly affected by the occurrence of SP in the dry season, and MP in the dry season also contributed to the change of the extreme dry spell. The average duration of the wet spell (AWS) in the upper basin had significantly positive relationships with LP in the wet season and SP in the dry season, while in the lower basin, the change of AWS was attributed to SP and LP in the wet season. Comparing the relationship between MPW and precipitation, HP in the wet season dominated the change of upstream MPV, but downstream MPV was dominated by MP in the wet season. Meanwhile, the upstream HP in the wet season also played an important role in the changes of WMS and WS95. We also found that the extreme precipitation (R95P) was mainly affected by EP in the upper region and by HP in the lower region. Overall, the changes of the dry spells in the upstream area occurred throughout the year while the downstream mainly happened during the dry season. SP dominated the decreasing of wet spells in the lower dry–hot valley, while LP and HP also significantly affected the changes of the upstream wet spell.

4. Discussion

The analysis of trends in precipitation characteristics is important to understand the behaviors of flood/drought, runoff, and soil erosion. A detailed investigation on the concentration of the Yangtze River basin is important to reduce and cope with the climate-induced flood and drought risks [17]. The LRB is characterized by the East Asian and South Asian monsoon [34] and a decrease in precipitation from upstream to downstream is affected by complex topography [46]. The amount of precipitation in this basin was less than the amount of middle and lower basins in the Yangtze River [17]. Approximately 90.98% of the stations exhibited decreasing trends during the recent 50 years in Yunnan Province [47]. In the upper region, the trends of the amount of precipitation were influenced by many factors, not only climatic, but also anthropogenic, forcing interactions between these factors, such as the urbanization of the city [48]. The significant increases in the SDII for total precipitation resulted from the decrease of rainy days mainly caused by the significant change in SP and LP, especially in SP. The significant decreasing trend in the days of light precipitation (<10 mm) are reported to occur in many regions of the world [49,50]. A recent study revealed that aerosol concentration has a negative correlation with the frequency of light precipitation [51]. There is also evidence to demonstrate that the significantly increased aerosol concentrations caused by air pollution are at least attributed to the decrease in light precipitation observed over the past 50 years in China [52]. Meanwhile, it was shown that light precipitation decreased and heavy precipitation days increased, which is responsible for atmospheric stability weakening, and the changes may be related to global warming [49].
Figure 7 shows the average relative humidity in dry days and rainy days, denoting that the average relative humidity in SP days is higher than the value in dry days, also higher than the annual average relative humidity. The significant decrease in rainy days of SP little affected the amount of total precipitation, while the number of days with lower relative humidity conditions will increase. According to the Penman equation [53], relative humidity is a major factor that influences the evaporation process, which had a significant negative correlation with the potential evaporation [54,55]. Meanwhile, a recent study has demonstrated that the significant rising temperature happened in Yunnan Province [47]. Lower relative humidity conditions and higher temperatures will aggravate the risk of droughts in the LRB, especially in the upper area, rainy days of SP decrease greatly (−8.30 d/10 a) in the dry season. Moreover, SDII in intensities showed positive trends across the basin, although the amount of LP and MP in the lower reaches had downward trends in the wet season. Increasing the intensity of large rainfall events (MP, HP, EP) in the wet season will increase rainfall erosivity [56,57] and the sand carrying capacity of the flood [58]. More sediment leading to massive siltation could reduce the storage capacity of reservoirs and ponds in the upper and middle reaches, which will reduce available water for crop production during the dry season. It cannot be ignored that the increase in the amount and intensity of large rainfall in the upper reaches will make this phenomenon more aggravated. These have also greatly increased the risk of drought in this basin.
The PCI values in the LRB were greater than the PCI in the middle–low regions of the Yangtze River, while lower than the PCI of northwest China [59]. On a national scale, both the values of PCI and PCD indicated that the monthly precipitation is characterized by uneven distribution in this basin. However, PCI showed a significant positive correlation with the contribution of maximum monthly precipitation while PCD showed a significant negative correlation with the contribution of precipitation during the dry season, which denoted different features of precipitation concentration indices in time scales. Because of the above reasons, PCI in intensities had various trends and were different from the trends of PCD in intensities. Through the above analysis, the PCId of SP in the upper reaches exhibited a significantly increasing trend, suggesting that the irregularity of precipitation distribution of SP in the dry season was stronger, an increase of the proportion of maximum monthly of SP. In addition, the rainy days of SP in the dry season decreased significantly. These changes will considerably aggravate droughts in the upper region during the dry season based on the previous analysis. It is worth noting that the PCIw of HP in the upper region also increase significantly, denoting that the contribution of maximum monthly HP during the wet season is likely to be larger. Overall, there are the closer concentration periods of LP, MP, and HP, the greater intensity of MP, HP, and EP, and more precipitation of MP and HP. This proof denoted that the risk of flood in the upstream LRB was aggravated so that more sediment from rainfall erosion had deposited in reservoirs and ponds. Compared with the upstream, the changes caused by the concentration of large rainfall events in the lower basin are weak. Meanwhile, negative trends in PCD were attributed to a decrease in the proportion of precipitation in the wet season while there was an increase in the dry season. The distribution of monthly precipitation has been more uniform on seasonal scales.
Although there is research showing that the PCD and PCP correlated with annual precipitation in East China [60] and the middle–low basin of Yangtze River [17], no similar correlations were observed in the LRB because of influence by the monsoon [23]. The average CI values (0.75, 0.76) in the LRB were greater than the CI values of 0.6 at the same latitude on a global scale [18], as well as being a high level across China (0.51–0.85) calculated by 780 stations [61]. As described by Martin-vide [16], CI can be an estimator of erosivity and aggressivity of precipitation, the decreasing CI indicating a decreasing rainfall erosivity on an annual scale. However, in this basin, the trend of CI was affected by changes of precipitation in different intensities, mainly the decrease of rainy days of SP. In the wet season, the intensity of large rainfall increased in the upstream area, showing increasing intensity of precipitation during the wet season, while the changes of CI showed decreasing uneven distributions of rainfall events on an annual scale.
The decreasing rainy days of annual SP dominated the changes of the dry/wet spells in the LRB. Moreover, the wet spells were also affected by the rainy days of LP, even MP and HP, decreasing LP, leading to less precipitation in the wet spell. In the upstream area, the large increase in R95P was attributed by the EP, with high increasing SDII, and the HP with significantly positive PCI, suggesting that the extreme rainfall erosion ability had enhanced. In the downstream area, the indices of dry spells had higher correlations with the rainy days in the dry season, indicating that the changes of dry spells mainly occurred during the dry season. Although the amount of precipitation in the dry season showed a positive trend, longer dry spells will make the hot–dry valley drier.

5. Conclusions

The LRB is characterized by climate change affected by the monsoon and topography. The analysis of the precipitation concentration and frequency in each intensity throughout the year is extremely important for the flood and drought in the upper Yangtze River. In this study, the spatial and temporal characteristics of changes in daily, monthly, and seasonal precipitation distributions during the period 1977–2017 were investigated. The conclusions can be drawn based on the results in this study as follows:
An analysis of precipitation data revealed that the trend in total precipitation was dominated by the increase in the amount and frequency of annual MP and HP in the upper region, and by a decrease in the amount and frequency of LP and MP during the wet season in the lower region. The annual SDII significant positive trend was attributed to a significant decrease in annual rainy days over the basin. However, most SDII in each intensity exhibited positive trends, although the precipitation and rainy days in each intensity with various trends, especially the SDII of EP in the upper basin, with a large increase, presented a higher rainfall erosivity. The significant downward trend of rainy days of SP (−13.13 d/10 a, −7.78 d/10 a) was the main reason for the decrease in rainy days, which reduced the relative humidity, leading to the increase in the risk of droughts.
The average PCI and PCD indicated strong seasonal behavior in monthly precipitation distribution in the LRB, and more pronounced in the lower basin. Based on the original use, the PCI and PCD/PCP were first proposed to estimate the monthly precipitation concentration in each intensity. The higher concentration with the higher intensity, which exhibited in both PCI and PCD. Meanwhile, the average PCP showed the precipitation concentration periods in LP, MP, and HP were later than SP and EP in this basin.
Although both PCI and PCD are the concentration indices based on the monthly precipitation, different characteristics on the time scales expressed by PCI and PCD were revealed. The analysis of correlations showed that PCI had a significantly positive relationship (r = 0.80, 0.86, p < 0.01) with the contribution of the maximum monthly precipitation, while PCD had a significant negative relationship (r = −0.82, −0.67, p < 0.01) with the contribution of the precipitation during the dry season. The significant upward trend of PCIw of HP showed that the maximum monthly HP had increasing contributions during the wet season in the upper basin, and a positive tendency was observed in the lower basin. The decreases in the PCD revealed an increase in the proportion of precipitation in the dry season across the LRB. In the upper basin, the PCP of LP and MP occurred earlier, about 10 days before 2000, and together with HP, concentrated at the end of July, which increased the risk of flood.
The average CI values were higher than most regions in China, showing a strong heterogeneity of daily precipitation. The significant (p < 0.01) decreasing trends were mainly caused by the decrease in the number of rainy days of SP, which indicated a weakening uneven distribution of daily precipitation on the annual scale. However, the inequality distribution of daily precipitation was always characterized by a large number of light rainfall events, which can be observed from the Lorenz asymmetry coefficient, S, less than 1, during the study period.
The duration of dry spells significantly getting longer were due to the decrease in SP throughout the year in the upper basin, while the lower basin was mainly due to the decrease in SP in the dry season. It caused the lower dry–hot valley to become drier. The duration of wet spells significantly got shorter and they were dominated by the changes of rainy days in intensities. A large increase trend was also observed in the R95p in the upper reaches.
This research can help in the development of water resources management. The agricultural production and reservoir operation may be well organized, based on the characteristics in this basin, in the future.

Author Contributions

Conceptualization, D.Y.; data curation, Y.L.; formal analysis, Y.L.; investigation, T.C. and R.C.; software, Y.L.; writing—original draft, Y.L.; writing—review and editing, A.W. and Z.S. All authors have read and agreed to the published version of the manuscript.

Funding

This research was funded by the National Key Research and Development Program of China (2016YFC0402301-02).

Institutional Review Board Statement

Not applicable.

Informed Consent Statement

Not applicable.

Data Availability Statement

Not applicable.

Conflicts of Interest

The authors declare no conflict of interest.

References

  1. Donat, M.G.; Lowry, A.L.; Alexander, L.V.; O’Gorman, P.A.; Maher, N. More Extreme Precipitation in the World’s Dry and Wet Regions. Nat. Clim. Change 2016, 6, 508–513. [Google Scholar] [CrossRef]
  2. Rummukainen, M. Climate Change: Changing Means and Changing Extremes. Clim. Change 2013, 121, 3–13. [Google Scholar] [CrossRef]
  3. Lu, Y.J.; Jiang, S.H.; Ren, L.L.; Zhang, L.Q.; Wang, M.H.; Liu, R.L.; Wei, L.Y. Spatial and Temporal Variability in Precipitation Concentration over Mainland China, 1961–2017. Water 2019, 11, 881. [Google Scholar] [CrossRef] [Green Version]
  4. Wang, H.J.; Chen, Y.N.; Chen, Z.S. Spatial Distribution and Temporal Trends of Mean Precipitation and Extremes in the Arid Region, Northwest of China, During 1960–2010. Hydrol. Processes 2013, 27, 1807–1818. [Google Scholar] [CrossRef]
  5. Zhai, P.M.; Zhang, X.B.; Wan, H.; Pan, X.H. Trends in Total Precipitation and Frequency of Daily Precipitation Extremes over China. J. Clim. 2005, 18, 1096–1108. [Google Scholar] [CrossRef]
  6. Shrestha, S.; Yao, T.D.; Kattel, D.B.; Devkota, L.P. Precipitation Characteristics of Two Complex Mountain River Basins on the Southern Slopes of the Central Himalayas. Theor. Appl. Climatol. 2019, 138, 1159–1178. [Google Scholar] [CrossRef]
  7. Yang, L.; Villarini, G.; Smith, J.A.; Tian, F.Q.; Hu, H.P. Changes in Seasonal Maximum Daily Precipitation in China over the Period 1961–2006. Int. J. Climatol. 2013, 33, 1646–1657. [Google Scholar] [CrossRef]
  8. Chatterjee, S.; Khan, A.; Akbari, H.; Wang, Y.P. Monotonic Trends in Spatio-Temporal Distribution and Concentration of Monsoon Precipitation (1901–2002), West Bengal, India. Atmos. Res. 2016, 182, 54–75. [Google Scholar] [CrossRef]
  9. Huang, Y.; Wang, H.; Xiao, W.H.; Chen, L.H.; Yang, H. Spatiotemporal Characteristics of Precipitation Concentration and the Possible Links of Precipitation to Monsoons in China from 1960 to 2015. Theor. Appl. Climatol. 2019, 138, 135–152. [Google Scholar] [CrossRef]
  10. Jiang, P.; Wang, D.G.; Cao, Y.Q. Spatiotemporal Characteristics of Precipitation Concentration and Their Possible Links to Urban Extent in China. Theor. Appl. Climatol. 2016, 123, 757–768. [Google Scholar] [CrossRef]
  11. Zhang, L.-N.; Zhang, Y.-B.; Wang, J.-D. Effects of Annual Distribution Difference of Precipitation on Evapotranspiration Characteristics of Dry Orchard in Loess Plateau, China. J. Appl. Ecol. 2020, 31, 2363–2372. [Google Scholar] [CrossRef]
  12. Guo, E.L.; Wang, Y.F.; Jirigala, B.; Jin, E. Spatiotemporal Variations of Precipitation Concentration and Their Potential Links to Drought in Mainland China. J. Clean. Prod. 2020, 267, 14. [Google Scholar] [CrossRef]
  13. Du, J.; Fang, J.; Xu, W.; Shi, P. Analysis of Dry/Wet Conditions Using the Standardized Precipitation Index and Its Potential Usefulness for Drought/Flood Monitoring in Hunan Province, China. Stoch. Environ. Res. Risk Assess. 2013, 27, 377–387. [Google Scholar] [CrossRef]
  14. Kosmas, C.; Tsara, M.; Moustakas, N.; Karavitis, C. Identification of Indicators for Desertification. Ann. Arid. Zone 2003, 42, 393–416. [Google Scholar]
  15. Nunes, A.N.; Lourenco, L.; Vieira, A.; Bento-Goncalves, A. Precipitation and Erosivity in Southern Portugal: Seasonal Variability and Trends (1950–2008). Land Degrad. Dev. 2016, 27, 211–222. [Google Scholar] [CrossRef]
  16. Apollonio, C.; Petroselli, A.; Tauro, F.; Cecconi, M.; Biscarini, C.; Zarotti, C.; Grimaldi, S. Hillslope Erosion Mitigation: An Experimental Proof of a Nature-Based Solution. Sustainability 2021, 13, 6058. [Google Scholar] [CrossRef]
  17. Martin-Vide, J. Spatial Distribution of a Daily Precipitation Concentration Index in Peninsular Spain. Int. J. Climatol. 2004, 24, 959–971. [Google Scholar] [CrossRef]
  18. Wang, W.G.; Xing, W.Q.; Yang, T.; Shao, Q.X.; Peng, S.Z.; Yu, Z.B.; Yong, B. Characterizing the Changing Behaviours of Precipitation Concentration in the Yangtze River Basin, China. Hydrol. Processes 2013, 27, 3375–3393. [Google Scholar] [CrossRef]
  19. Monjo, R.; Martin-Vide, J. Daily Precipitation Concentration around the World According to Several Indices. Int. J. Climatol. 2016, 36, 3828–3838. [Google Scholar] [CrossRef]
  20. Hu, S.S.; Feng, F.; Liu, W.B.; She, D.X. Changes in Temporal Inequality and Persistence of Precipitation over China During the Period 1961–2013. Hydrol. Res. 2018, 49, 1283–1291. [Google Scholar] [CrossRef] [Green Version]
  21. Oliver, J.E. Monthly Precipitation Distribution—A Comparative Index. Prof. Geogr. 1980, 32, 300–309. [Google Scholar] [CrossRef]
  22. Ramezani, Y.; Khashei-Siuki, A.; Tahroudi, M.N. Spatial Distribution of the Daily, Monthly, and Annual Precipitation Concentration Indices in the Lake Urmia Basin, Iran. Idojaras 2020, 124, 73–95. [Google Scholar] [CrossRef]
  23. Khalili, K.; Tahoudi, M.N.; Mirabbasi, R.; Ahmadi, F. Investigation of Spatial and Temporal Variability of Precipitation in Iran over the Last Half Century. Stoch. Environ. Res. Risk Assess. 2016, 30, 1205–1221. [Google Scholar] [CrossRef]
  24. Zhang, L.J.; Qian, Y.F. Annual Distribution Features of Precipitation in China and Their Interannual Variations. Acta Meteorol. Sin. 2003, 17, 146–163. [Google Scholar]
  25. Ratan, R.; Venugopal, V. Wet and Dry Spell Characteristics of Global Tropical Rainfall. Water Resour. Res. 2013, 49, 3830–3841. [Google Scholar] [CrossRef]
  26. Mathugama, S.; Peiris, T. Critical Evaluation of Dry Spell Research. Int. J. Basic Appl. Sci. 2011, 11, 153–160. [Google Scholar]
  27. Liu, Y.L.; Yan, J.P.; Cen, M.Y. The Relationship between Precipitation Heterogeneity and Meteorological Drought/Flood in China. J. Meteorol. Res. 2016, 30, 758–770. [Google Scholar] [CrossRef]
  28. Zhang, L.J.; Qian, Y.F. A Study on the Feature of Precipitation Concentration and Its Relation to Flood-Producing in the Yangtze River Valley of China. Chin. J. Geophys. 2004, 47, 709–718. [Google Scholar] [CrossRef]
  29. Chen, Y.; Zhai, P.M. Changing Structure of Wet Periods across Southwest China During 1961–2012. Clim. Res. 2014, 61, 123–131. [Google Scholar] [CrossRef]
  30. Qin, J.; Ding, Y.J.; Zhao, Q.D.; Wang, S.P.; Chang, Y.P. Assessments on Surface Water Resources and Their Vulnerability and Adaptability in China. Adv. Clim. Change Res. 2020, 11, 381–391. [Google Scholar] [CrossRef]
  31. Xu, K.; Yang, D.W.; Yang, H.B.; Li, Z.; Qin, Y.; Shen, Y. Spatio-Temporal Variation of Drought in China During 1961–2012: A Climatic Perspective. J. Hydrol. 2015, 526, 253–264. [Google Scholar] [CrossRef]
  32. Official Chuxiong Yi Autonomous Prefecture. Chuxiong Prefecture Yearbook; People’s Government of Chuxiong Yi Autonomous Prefecture; Yunnan Publishing Group Co.: Kunming, China, 2016; p. 216. [Google Scholar]
  33. Official Chuxiong Yi Autonomous Prefecture. Chuxiong Prefecture Yearbook; People’s Government of Chuxiong Yi Autonomous Prefecture: Kunming, China, 2000. [Google Scholar]
  34. Zhang, J.P.; Yang, Z.; Wang, D.J.; Zhang, X.B. Climate Change and Causes in the Yuanmou Dry-Hot Valley of Yunnan, China. J. Arid. Environ. 2002, 51, 153–162. [Google Scholar] [CrossRef]
  35. Xiao, Z.N.; Zhou, X.H.; Yang, P.; Liu, H. Variation and Future Trends in Precipitation over Summer and Autumn across the Yunnan Region. Front. Earth Sci. 2016, 10, 498–512. [Google Scholar] [CrossRef]
  36. De Luis, M.; Gonzalez-Hidalgo, J.C.; Brunetti, M.; Longares, L.A. Precipitation Concentration Changes in Spain 1946–2005. Nat. Hazards Earth Syst. Sci. 2011, 11, 1259–1265. [Google Scholar] [CrossRef] [Green Version]
  37. Li, X.M.; Jiang, F.Q.; Li, L.H.; Wang, G.Q. Spatial and Temporal Variability of Precipitation Concentration Index, Concentration Degree and Concentration Period in Xinjiang, China. Int. J. Climatol. 2011, 31, 1679–1693. [Google Scholar] [CrossRef]
  38. Masaki, Y.; Hanasaki, N.; Takahashi, K.; Hijioka, Y. Global-Scale Analysis on Future Changes in Flow Regimes Using Gini and Lorenz Asymmetry Coefficients. Water Resour. Res. 2014, 50, 4054–4078. [Google Scholar] [CrossRef]
  39. Damgaard, C.; Weiner, J. Describing Inequality in Plant Size or Fecundity. Ecology 2000, 81, 1139–1142. [Google Scholar] [CrossRef]
  40. Li, Z.; Li, Y.P.; Shi, X.P.; Li, J.J. The Characteristics of Wet and Dry Spells for the Diverse Climate in China. Glob. Planet. Change 2017, 149, 14–19. [Google Scholar] [CrossRef]
  41. Mann, H.B. Nonparametric Tests against Trend. Econometrica 1945, 13, 245–259. [Google Scholar] [CrossRef]
  42. Kendall, M.G. Rank Correlation Methods. Br. J. Psychol. Gen. 1990, 11–12, 86–91. [Google Scholar] [CrossRef]
  43. Shi, W.L.; Yu, X.Z.; Liao, W.G.; Wang, Y.; Jia, B.Z. Spatial and Temporal Variability of Daily Precipitation Concentration in the Lancang River Basin, China. J. Hydrol. 2013, 495, 197–207. [Google Scholar] [CrossRef]
  44. Rahman, A.-U.; Dawood, M. Spatio-Statistical Analysis of Temperature Fluctuation Using Mann-Kendall and Sen’s Slope Approach. Clim. Dyn. 2017, 48, 783–797. [Google Scholar] [CrossRef]
  45. Douglas, E.M.; Vogel, R.M.; Kroll, C.N. Trends in Floods and Low Flows in the United States: Impact of Spatial Correlation. J. Hydrol. 2000, 240, 90–105. [Google Scholar] [CrossRef]
  46. Sen, P.K. Estimates of the Regression Coefficient Based on Kendall’s Tau. J. Am. Stat. Assoc. 1968, 63, 1379–1389. [Google Scholar] [CrossRef]
  47. Li, Y.G.; He, D.M.; Hu, J.M.; Cao, J. Variability of Extreme Precipitation over Yunnan Province, China 1960–2012. Int. J. Climatol. 2015, 35, 245–258. [Google Scholar] [CrossRef]
  48. Li, Y.G.; Wang, Z.X.; Zhang, Y.Y.; Li, X.; Huang, W. Drought Variability at Various Timescales over Yunnan Province, China: 1961–2015. Theor. Appl. Climatol. 2019, 138, 743–757. [Google Scholar] [CrossRef]
  49. Sang, Y.F.; Wang, Z.G.; Li, Z.L.; Liu, C.M.; Liu, X.J. Investigation into the Daily Precipitation Variability in the Yangtze River Delta, China. Hydrol. Processes 2013, 27, 175–185. [Google Scholar] [CrossRef]
  50. Huang, G.; Wen, G. Spatial and Temporal Variations of Light Rain Events over China and the Mid-High Latitudes of the Northern Hemisphere. Chin. Sci. Bull. 2013, 58, 1402–1411. [Google Scholar] [CrossRef] [Green Version]
  51. Wen, G.H.; Huang, G.; Hu, K.M.; Qu, X.; Tao, W.C.; Gong, H.N. Changes in the Characteristics of Precipitation over Northern Eurasia. Theor. Appl. Climatol. 2015, 119, 653–665. [Google Scholar] [CrossRef]
  52. Choi, Y.S.; Ho, C.H.; Kim, J.; Gong, D.Y.; Park, R.J. The Impact of Aerosols on the Summer Rainfall Frequency in China. J. Appl. Meteorol. Climatol. 2008, 47, 1802–1813. [Google Scholar] [CrossRef] [Green Version]
  53. Qian, Y.; Gong, D.Y.; Fan, J.W.; Leung, L.R.; Bennartz, R.; Chen, D.L.; Wang, W.G. Heavy Pollution Suppresses Light Rain in China: Observations and Modeling. J. Geophys. Res.-Atmos. 2009, 114, 16. [Google Scholar] [CrossRef]
  54. Xiang, K.Y.; Li, Y.; Horton, R.; Feng, H. Similarity and Difference of Potential Evapotranspiration and Reference Crop Evapotranspiration—A Review. Agric. Water Manag. 2020, 232, 16. [Google Scholar] [CrossRef]
  55. Jiang, C.; Mu, X.; Ma, W.; Yu, X.; Liu, X.; Li, J.; Liu, S.; Wang, F. Spatial and Temporal Variation of Absolute Humidity and Its Relationship with Potential Evaporation in the Northern and Southern Regions of Qinling Mountains. Acta Ecol. Sin. 2015, 35, 378–388. [Google Scholar]
  56. Chen, H.; Yang, G.; Lin, M.; Wu, J.; Yuan, F. Spatiotemporal Changes and Affecting Factors of Potential Evapotranspiration in the Second Songhua River Basin. Res. Soil Water Conserv. 2021, 28, 238. [Google Scholar]
  57. Kang, S.Z.; Zhang, L.; Song, X.Y.; Zhang, S.H.; Liu, X.Z.; Liang, Y.L.; Zheng, S.Q. Runoff and Sediment Loss Responses to Rainfall and Land Use in Two Agricultural Catchments on the Loess Plateau of China. Hydrol. Processes 2001, 15, 977–988. [Google Scholar] [CrossRef]
  58. Nearing, M.A.; Jetten, V.; Baffaut, C.; Cerdan, O.; Couturier, A.; Hernandez, M.; Le Bissonnais, Y.; Nichols, M.H.; Nunes, J.P.; Renschler, C.S.; et al. Modeling Response of Soil Erosion and Runoff to Changes in Precipitation and Cover. Catena 2005, 61, 131–154. [Google Scholar] [CrossRef]
  59. Nearing, M.A.; Pruski, F.F.; O’Neal, M.R. Expected Climate Change Impacts on Soil Erosion Rates: A Review. J. Soil Water Conserv. 2004, 59, 43–50. [Google Scholar]
  60. Zhang, K.X.; Yao, Y.L.; Qian, X.Q.; Wang, J.J. Various Characteristics of Precipitation Concentration Index and Its Cause Analysis in China between 1960 and 2016. Int. J. Climatol. 2019, 39, 4648–4658. [Google Scholar] [CrossRef]
  61. Bai, A.; Liu, X. Characteristics of Rainfall Variation over East China During the Last 50 Years and Their Relationships with Droughts and Floods. J. Trop. Meteorol. 2010, 26, 194–200. [Google Scholar]
Figure 1. Location of study area with meteorological stations and vegetation coverage.
Agriculture 12 00089 g001
Figure 2. (a) Precipitation and (b) rainy days in each intensity in the lower and upper basins.
Agriculture 12 00089 g002
Figure 3. Monthly precipitation and rainy days in each intensity in the upper and lower basins: (a) precipitation and (b) rainy days. The pie charts show the proportion of precipitation/rainy days in the wet season (W) and dry season (D). “None” fill bar/pie is the upstream value; the dense fill bar/pie is downstream value.
Agriculture 12 00089 g003
Figure 4. The annual average of (a) PCI and (b) PCD and PCP in each intensity in the upper and lower basins. –U is the value for the upper basin; –D is the value for the lower basin.
Agriculture 12 00089 g004
Figure 5. Temporal variations of Gini CI in (a) the upper region and (c) the lower region from 1977 to 2017. The Lorenz curve of the cumulative of rainy days and precipitation percentage distribution of (b) the maximum CI upstream and (d) minimum CI downstream.
Agriculture 12 00089 g005
Figure 6. Relationship between (a), (b) precipitation/ (c), (d) rainy days with each intensity in different scales and indices with distribution concentration & characteristics of wet/dry spell over the basin during 1977–2017. –U is the value for the upper basin; –D is the value for the lower basin. –d is the value in the dry season, w is the value in the wet season, a is the value for annual. * Correlation is significance at 0.1 level; ** correlation is significance at 0.5 level; *** correlation is significance at 0.01 level.
Agriculture 12 00089 g006
Figure 7. The average of relative humidity in different precipitation conditions in the upstream region and the downstream region from 1977 to 2017. The filled parts are the annual average of relative humidity; the blue fill is the upstream value, and the red fill is the downstream value.
Agriculture 12 00089 g007
Table 1. The indices for the wet spell and dry spell indices in this study.
IndicesDefinitionsUnits
SDIIannual total precipitation divided by the number of total wet days (≥0.1 mm) in the yearmm/d
NDSannual number of the dry spellsevent
NWSannual number of the wet spellsevent
ADSannual average length of dry spellsdays
AWSannual average length of wet spellsdays
MDSlargest number of consecutive days of dry spell (<0.1 mm)days
MWSlargest number of consecutive days of wet spell (≥0.1 mm)days
DS95total days when the length of dry spell > 95th percentile of the dry days in the 1981–2010 perioddays
WS95total days when the length of wet spell > 95th percentile of the wet days in the 1981–2010 perioddays
MPWthe maximum amount of precipitation during a wet spellmm
Rx1daythe maximum precipitation amount on 1 daymm
Rx5daythe maximum precipitation amount on consecutive 5 daysmm
R95ptotal precipitation amount when the daily precipitation > 95th percentile of precipitation on wet days in the 1981–2010 periodmm
Table 2. Trends of precipitation, rainy days, and SDII in each intensity over the LRB during 1977–2017.
PrecipitationRainy daysSDII
IntensityAmountProportionAmountProportionAmount
(mm/10 a)(%/10 a)(d/10 a)(%/10 a)((mm/d)/10 a)
UpstreamTotal20.16N−15.00 ***N0.57 ***
SP 0.1–0.9−2.68 ***−0.39 ***−13.13 ***−4.03 ***+0
LP 1–9.9−5.11−1.35−2.31 **1.76 **0.06
MP 10–24.96.020.120.301.25 ***0.25
HP 25–49.98.940.86+01.88 ***0.33
EP ≥ 50 mm−0+0−00.022.63
DownstreamTotal−5.08N−9.65 ***N0.34 ***
SP 0.1–0.9−0.65 *−0.10−7.78 ***−2.42 ***0.02 ***
LP 1–9.9−4.84−0.40−2.00 **0.660.06
MP 10–24.90.790.31+00.95 ***0.11
HP 25–49.93.190.73+00.33 *0.07
EP ≥ 50 mm−1.87−0.60−0−0−1.20
* Significance at 10% level; ** Significance at 5% level; *** Significance at 1% level. Unit ‘’mm/10 a”, “%/10 a”, “d/10 a” and “(mm/d)/10 a” means mm, %, day, and mm/day per decade; +0 means the slope is 0, but the MK standard Z value is positive; −0 means the slope is 0, but the MK standard Z value is negative.
Table 3. Trends of precipitation, rainy days, and SDII in the wet season in each intensity over the LRB during 1977–2017.
IntensityPrecipitationRainy DaysSDII
AmountProportionAmountProportionAmount
(mm/10 a)(%/10 a)(d/10 a)(%/10 a)((mm/d)/10 a)
UpstreamTotal14.99−0.45−6.17 ***2.77 ***0.43 ***
SP 0.1–0.9−1.14 ***−0.17 ***−4.44 ***−0.12−0
LP 1–9.9−3.15−0.90−1.461.47 *0.07
MP 10–24.97.150.06+00.99 ***0.25
HP 25–49.96.000.07+00.41 *0.50
EP ≥ 50 mm−0+0−0+02.26
DownstreamTotal−8.61−0.67−6.23 ***0.430.36 ***
SP 0.1–0.9−0.30−0.04−4.41 ***−0.860.02 ***
LP 1–9.9−5.30−0.58−2.03 **0.390.09
MP 10–24.9−2.65−0.12−00.75 **0.21
HP 25–49.92.220.54+00.320.02
EP ≥ 50 mm−1.87−0.60−0−0−1.20
* Significance at 10% level; ** Significance at 5% level; *** Significance at 1% level. Unit ‘’mm/10 a”, “%/10 a”, “d/10 a” and “(mm/d)/10 a” means mm, %, day, and mm/day per decade; +0 means the slope is 0, but the MK standard Z value is positive; −0 means the slope is 0, but the MK standard Z value is negative.
Table 4. Trends of precipitation, rainy days, and SDII in the dry season in each intensity over the LRB during 1977–2017.
SeasonIntensityPrecipitationRainy DaysSDII
AmountProportionAmountProportionAmount
(mm/10 a)(%/10 a)(d/10 a)(%/10 a)((mm/d)/10 a)
UpstreamTotal5.280.45−8.91 ***−2.77 ***0.42 ***
SP 0.1–0.9−1.40 ***−0.18 ***−8.30 ***−3.60 ***0.01
LP 1–9.9−1.38−0.42−0.690.290.04
MP 10–24.9+0+0+00.13−0.37
HP 25–49.9+00.01*+0+0−1.50
EP ≥ 50 mm-----
DownstreamTotal4.400.67−3.03 ***−0.430.31 **
SP 0.1–0.9−0.36 *−0.06−3.33 ***−1.22 ***0.01
LP 1–9.91.490.22−00.460.20
MP 10–24.9+0+0+00.11−0.94
HP 25–49.9-----
EP ≥ 50 mm-----
* Significance at 10% level; ** Significance at 5% level; *** Significance at 1% level. Unit ‘’mm/10 a”, “%/10 a”, and “(mm/d)/10 a” means mm, %, and mm/d per decade. -means the sample less than 10, not be analyzed; +0 means the slope is 0, but the MK standard Z value is positive; −0 means the slope is 0, but the MK standard Z value is negative.
Table 5. Trends in PCI, PCD and PCP in each intensity over the LRB during 1977–2017.
IntensityPCIa
(/10 a)
PCIw
(/10 a)
PCId
(/10 a)
PCD
(/10 a)
PCP
(°/10 a)
UpstreamTotal0.1440.2061.287 **−0.001−1.442
SP 0.1–0.90.613 ***0.2090.757 ***0.0173.550
LP 1–9.90.092−0.0870.3790.008−4.000 *
MP 10–24.90.1150.181+0−0.019−3.703
HP 25–49.91.1760.942 *−0−0.006−0.046
EP ≥ 50 mm−0−0-−00.218
DownstreamTotal−0.0060.1521.475−0.018−1.333
SP 0.1–0.90.443 *0.269 *0.0100.0143.610
LP 1–9.9−0.1570.175−0.137−0.006−4.601 *
MP 10–24.9−0.0960.136−0−0.024−6.287 **
HP 25–49.92.2241.253-−0.0153.162
EP ≥ 50 mm−0−0N−00.250
* Significance at 10% level; ** Significance at 5% level; *** Significance at 1% level. Unit ‘’/10 a” and “°/10 a” means the values and ° per decade; +0 means the slope is 0, but the MK standard Z value is positive; −0 means the slope is 0, but the MK standard Z value is negative.
Table 6. Trends in indices, in the dry spell over the LRB during 1977–2017.
NDS
(Event/10 a)
ADS
(d/10 a)
MDS
(d/10 a)
DS95
(d/10 a)
Upstream−1.82 ***0.49 ***3.14 ***19.00 ***
Downstream+00.25 *2.50 *14.10 ***
* Significance at 10% level; *** Significance at 1% level. Unit ‘’event/10 a”, and “d/10 a” means event and day per decade; 0 means the slope is 0, + means the MK standard Z value is positive.
Table 7. Trends in indices, in the wet spell over the LRB during 1977–2017.
NWSAWSMWSWS95MPWR × 1 DayR × 5 DayR95p
(Event/10 a)(d/10 a)(d/10 a)(d/10 a)(mm/10 a)(mm/10 a)(mm/10 a)(mm/10 a)
Upstream−1.85 **−0.17 ***−1.43 **−13.33 ***−2.720.042.9319.98
Downstream−0−0.22 ***−1.34 ***−9.52 ***−6.84 **−2.72−2.56−3.03
** Significance at 5% level; *** Significance at 1% level. Unit ‘’event/10 a”, “d/10 a”, and “mm/10 a” means event, day and mm per decade; −0 means the slope is 0, but the MK standard Z value is negative.
Publisher’s Note: MDPI stays neutral with regard to jurisdictional claims in published maps and institutional affiliations.

