Abstract
In recent years, Ghanaian agriculture has witnessed a surge in the use of agrochemicals, with the likely consequence that nonoptimal levels of application could cause environmental damage and economic losses. We identify the factors that affect the adoption of agrochemicals and the intensity of use in Ghanaian rice farming. We estimate the average treatment effects of chemical fertilizer and herbicide adoption using a Dose–Response Model (DRM). Our results show that a wide range of socioeconomic factors, including education, asset ownership, extension service, off-farm income, and land ownership affect adoption and use intensity of agrochemicals. On average, chemical fertilizer usage is associated with a 10% increase in the average treatment effect; low levels of chemical fertilizer have a negative impact on rice yield, and the result turns positive with more intensive use. Similarly, herbicide treatment generates a 7% increase in the average treatment effect, but higher herbicide levels will have negative causal effects on rice yield, and the result worsens with more herbicide treatment. Both agricultural technologies were designed to be used together, hence the appropriate mix of levels and intensity is crucial to achieve greater benefits. The DRM accounts for heterogeneity in the sample and is a useful tool to develop guidance on optimal levels of agrochemicals.
1. Introduction
Cereals such as maize and rice are becoming a more essential part of Ghana’s staple diet. In Ghana, 1,300,000 MT of rice was eaten in 2018–2019, compared to 470,000 MT produced, resulting in a 63.9 percent output deficit [1]. The country has great potential to close the gap that exists between domestic demand and supply through domestic production [2]. Various interventions and investments, such as the “Planting for Food and Jobs”, have been made by successive governments, yet domestic production is still not at pace with the growing demand [3]. Ghana has the right agronomic conditions necessary for whole-year rice production [4]. Nonetheless, issues such as the availability and expense of improved rice seeds and fertilizer continue to plague domestic rice cultivation, resulting in low fertilizer use and poor agronomic practices. In addition, given the finite nature of arable land, most agricultural policies designed to improve domestic food production now advocate substitution of yield improvement for expansion in land under cultivation.
In recent years, growth in the use of agrochemicals in crop production has surged as Ghana seeks to increase rice production. Agrochemicals improve crop productivity via protecting crops from insects, weeds, and other pathogens that impact crop yield and, at the same time, replenish soils deficient in plant nutrients [5]. The conclusions on the nexus between agrochemical use and crop productivity among existing studies indicate that agrochemical use has conditional effects on crop yield [6]. Since agrochemicals increase crop productivity, applying agrochemicals is stimulated by economics, though they also come with significant environmental costs that are always internalized [7]. For this reason, knowing the determinants and optimal levels of agrochemical usage is important. Additionally, focusing on the distribution of the impact and the average treatment effects could provide a more precise depiction of how adoption of agrochemicals affects productivity [8,9].
This study seeks to fill the following gap in the existing literature. Through the main objective, we identify the determinants of adoption and intensity of agrochemical use in Ghanaian rice farming. We also assess the influence of pesticide adoption on rice yields, the extent to which yields vary with adoption level, and the amount of agrochemicals that should be used to avoid overuse and environmental damage. This is important because the overuse of agrochemicals may result in low nutrient use efficiency and higher production costs for farmers [10]. Unnecessarily huge losses of nutrients are also likely to lead to severe environmental consequences such as acidification of agricultural lands and contamination of soils, surface and groundwater, and agricultural produce [10,11].
This study contributes to the environmental sustainability discourse on the use of agrochemicals in crop production. Our study attempts to demystify most farmers’ perception that high levels of application of agrochemicals lead to enormous benefits in terms of crop yield. These agrochemicals have emerged as the primary source of non-point pollution in Ghana [12]. Second, this study presents a useful empirical application of a more robust Dose–Response Model (DRM) by Cerulli [13] to understand how different levels or intensities of agrochemicals impact crop yield. According to Cerulli [13], the DRM is useful when treatment is continuous, individuals react heterogeneously to observable confounders, and treatment is endogenous. Farmers are known to exhibit heterogeneous behavior in making agricultural technology adoption decisions. Understanding the many adoption effects can thus help us move beyond the simple average effects that have hitherto dominated the field. Moreover, this study provides insights into development of the optimal mix and levels of usage of agrochemicals in rice production to help minimize costs associated with their overuse. This is important especially for smallholder farmers in developing countries, given that most of them are cash-constrained and therefore only able to purchase and apply a fixed amount of farming inputs [14,15,16] such as agrochemicals, thus impacting crop yield and subsequently their welfare.
The organization of the subsequent parts of the paper is as follows: Section 2 presents the econometric strategy and estimation procedure, data adopted, and the descriptive statistics of the study variables. The empirical findings and discussion are outlined in Section 3, and Section 4 concludes and suggests policy implications based on the results.
2. Materials and Methods
2.1. Econometric Framework and Estimation Strategy
A Dose-Response Model (DRM) is adopted to study the impact of agrochemical use levels on rice yield. This is an econometric procedure for evaluating the effect of a continuous treatment on an outcome variable. Several authors [17,18] implemented various approaches to relax different parametric conventions, and these led to improvements in Dose–response Model estimations. Nonetheless, these alternatives are ill-equipped to incorporate (i) a zero-treatment probability mass and (ii) the possibility of endogeneity among treatments in estimating the dose–response functions.
Unlike prior versions by Hirano and Imbens [19], the DRM proposed by Cerulli [13] does not require full normality assumptions and is applicable to situations where many individuals have 0 treatment levels. Unlike the semiparametric method employed by Adorno et al. [20] and Guardabascio and Ventura [17], the DRM assumes a parametric form of the probable results with additive separability. Another advantage of this method is that the generalized propensity score estimates are not a prerequisite. The recommended instrumental variable procedure under the DRM employs the Heckman bivariate selection model that necessitates additional assumptions. Finally, it takes cognizance of the existence of observable heterogeneity.
2.2. Theoretical Model
Let us assume there are two exclusive sets of farmers: adopters of agrochemicals (treated) and non-adopters (untreated), and let the adoption of agrochemicals = [0, 1], indicating whether a farmer adopted agrochemicals or otherwise . Let us further assume that farmers have varying levels of agrochemical use intensity , and for non-adopters of agrochemicals . Adopters of agrochemicals assume scores of more than zero , and within the rice production calendar under review, farmers have applied at least one agrochemical. Then, is consequently assumed to take scores stringently in a continuous series of . Moreover, assume that the rice yield (outcome) of an agrochemical adopter (treated) is well-defined as and the rice yield of a non-adopter (untreated) is . In addition, suppose a vector of exogenous and observable features (confounders) describe the entire number of farmers. Let denote the total number of farmers, with being the sum of adopters, and being the total number of non-adopters, so that . Following Cerulli [13], the rice yield outcomes can be modeled as
where and are the rice yield outcomes of agrochemical adopters and non-adopters, respectively, and are scalars, and represent farmers’ response to the vector confounding variable in terms of adopting as against not adopting, evaluates the reaction of rice yield to the quantities or degree of agrochemical adoption assuming the score of 0 if and if , and and have zero means.
With the assumption that and take linear parametric patterns as and , the treatment effect is defined as the causal parameter conditioned on and , and is specified as
and
where and , and denote the average treatment effect on the treated (adopters of agrochemicals) and average treatment effect on non-treated (non-adopters of agrochemicals), respectively. is the average treatment effect; rewriting Equation (5) conditional on leads to
By the law of iterated expectations, the unconditional can be obtained as
Thus,
and
where is the average response function taken over . is the probability of adopting agrochemicals, and is the probability of not adopting agrochemicals. Therefore, the dose–response function is an algebraic derivative of over and so that:
The is the primary causal parameter under consideration and is specified as the ATE conditional on the quantity or level of agrochemical use.
2.3. Empirical Model
To develop the empirical model, we first complete the preceding framework by replacing Equations (3) and (4) with the Potential Outcome Model (POM): . Assuming that is a three-polynomial function, that is, , the estimation equation can be derived as
In Equation (11), , the variable is the rice yield outcomes of farmers, specifies the mean causal effect of adopting an agrochemical on rice yield, while the term takes into consideration the heterogeneous mean divergence of exogenous confounders from their average. Equation (11) estimates the mean rice yield response to agrochemical adoption while monitoring for exogenous variables as and the intensity of agrochemicals deviate from their average. By Conditional Mean Independence (CMI), Ordinary Least Squares (OLS) estimation of the equation would provide consistent estimates of the parameters of interest [13]. Thus, the dose–response function can be estimated as
and is a consistent DRM with . and represent the estimated average treatment effect on the treated (agrochemical adopters) and estimated average treatment effect on non-treated (non-adopters of agrochemicals), respectively. Nevertheless, previous studies on the adoption of agrochemicals indicate that the decision to adopt or not, , and the intensity of agrochemical use , are probably endogenous [21]. The CMI assumption, consequently, degenerates, and to estimate Equation (11) with OLS will lead to biased estimates. That is, [13]. Based on Cerulli [13], Equation (11) can be re-specified as
and
where and are taken to be endogenous in aggregation with The parameter is the random error term assumed to follow the Gaussian distribution with zero mean and constant variance, denotes the natural logarithm of rice yield, is the average heterogeneous rice yield among agrochemical adopters due to deviation and serves as an additional exclusive restriction, and p* denotes the unobservable latent factors of adopters and non-adopters of agrochemicals. The quantity of agrochemicals is detected when a farmer adopts ; otherwise, it is undetected [22]. Equations (14) and (15) are identified as Type II Tobit models [22].
Equation (14) demonstrates the choice of model with as a vector of covariates that impacts the determination of whether the farmer adopts agrochemicals or not, while Equation (15) expresses the vector of covariates, , that decides the quantity or level of agrochemical usage. The covariates including and are recommended in contemporary empirical works [23].
From Equation (13), we are not just concerned with the direct effect of agrochemical adoption on rice yield, our focus is also on how these effects are moderated by the level of agrochemicals taken in cognizance with other factors, and . These heterogeneous impacts of agrochemicals on rice yields are witnessed due to the divergence of agrochemical usage quantities from their average. Existing theoretical and empirical literature from agrochemical–rice yield relations indicates that agrochemical usage is supposed to positively influence rice yield [24]. Thus, it is hypothesized that the rice yield impact of agrochemical usage is affirmative; nonetheless, this outcome is constrained by the quantity or level of agrochemical usage.
2.4. Estimation and Identification
To resolve the parameter identification problem, we extend the assumption by Cerulli (2015) to specify the vector of covariates in Equations (14) and (15) as:
where and are vectors of factors that seem to elucidate the likelihood of a farmer to adopt agrochemicals and the level of agrochemical usage, thus fulfilling the exclusion restriction condition [25].
We consider farm size and market distance as credible exclusion restrictions on agrochemical use quantity or level and adoption, respectively. Both farm size and market distance are factors that influence agrochemical usage but are not expected to correlate with rice yield, except through agrochemical usage. This is due to that fact that they are not direct production inputs in rice production [26]. The estimation is performed using ctreatreg, an econometric package in Stata 16, which uses full information maximum likelihood estimation of the systems of models (13)–(15) while employing the Heckman selection model as well as the two-stage instrumental variable estimation procedure [13].
2.5. Data and Descriptive Statistics
This study employed data from a farm household survey, which was undertaken in Northern Ghana from October to December 2018. The sampled farm households were from the Northern, Upper East, and Upper West Regions of Ghana. The sample comprises 900 farm households with 300 from each region. A multistage sampling technique was employed in choosing farm households. The initial step involved selecting districts from the regions based on their rice production levels in the selected regions of Northern Ghana. The second stage is a simple random selection of farm households from the district’s different communities based on the size of the community and rice production levels.
The choice of the variables for our empirical model is based on a review of theoretical and empirical literature relating to adoption and impact studies [23,24,27,28,29,30,31,32]. From existing studies, several elements influence agrochemical use and, consequently, the outcome variable, rice yield. These covariates comprise age, farm size, extension access, marital status, land ownership, market distance, years of rice farming, access to credit, and farmer organization membership. The definition and descriptive statistics of the variables of the pooled sample are given in Table 1. From Table 1, the mean quantity of chemical fertilizer and herbicide used by the farmers is 5.18 kg ha−1 and 4.69 liters ha−1, respectively.

Table 1.
Definition and summary statistics of the pooled sample.
The variation based on agrochemical usage is presented in Table 2. Again, it is worth noting from Table 2 that there is variation in rice yield amongst adopters and non-adopters of chemical fertilizers and herbicides during production. It is also evident that there are significant variations in the covariates of adopters and non-adopters of chemical fertilizer and herbicide. There is significant variation in the age, FBO membership, market distance, extension access, farm size, years of rice farming, and credit access between the adopters and non-adopters of chemical fertilizer and herbicides. On the other hand, there was only a difference between the adopters and non-adopters of chemical fertilizer in off-farm income.
Table 2.
Summary statistics.
3. Results and Discussion
3.1. Levels of Agrochemical Use and Rice Yield
Table 3 shows results of the Heckman two-step selection model illustrating the factors affecting adoption of agrochemicals and their intensity of use. The estimated models for chemical fertilizer (Wald Chi (2) = 100.39; p < 0.000) and herbicides (Wald Chi (2) = 109.56; p < 0.000) were statistically significant and independent, exhibiting strong explanatory power. Our results indicate that years of schooling, years of rice farming, total livestock units owned, and the total asset value of household heads positively affect the adoption of chemical fertilizer. Farmer-based organization membership of household heads, household size, and off-farm income positively and statistically influence herbicides’ adoption. On the other hand, we find that household head’s age, farm size, and land ownership negatively and significantly influence herbicide adoption in Ghana.
Table 3.
Heckman sample selection model results for agrochemical usage.
Household heads’ membership in farmer-based organizations positively influences the likelihood of herbicide adoption and intensity of use. This finding is consistent with the work of Ng’ombe et al. [31], Katung and Akankwasa [33], and Addai et al. [34]. Ng’ombe et al. [31], Katung and Akankwasa [33], and Addai et al. [34] observed that farmers who are members of farmer-based organizations are likely to obtain information and learn from each other, especially information about agricultural technologies, which increases the possibility of adoption and in optimal quantities. However, even though farmer-based organization membership positively influences the adoption of chemical fertilizer, its effect is not statistically significant. On the intensity of use, household heads’ membership of farmer-based organizations positively and significantly affects agrochemical use intensity. Farmer organizations serve as an avenue for accessing and dissemination of information on agricultural technology [34]. This is plausible as it would increase farmers’ awareness and inspire them to improve farmers’ application rate of chemical fertilizers. This result is supported by the findings of Ali et al. [35]. It is worth noting that farmers in developing countries face market imperfection, including transaction and scarce information. With these conditions, social networks such as farmer-based organizations could facilitate information exchange, enabling farmers to access farm inputs and overcome credit constraints [21].
Extension access by farm households positively and significantly influences chemical fertilizer adoption and intensity of use. Plausibly, access to extension services aids in disseminating information on various agricultural technologies, resulting in their usage. The farmer receives information on proper usage and benefits of these technologies through extension officers. This finding conforms with the results of Ali et al. [35]. They asserted that extension contact with farmers contributes to the flow of technical information useful in farmers’ production decisions. Moreover, Danlami et al. [36] indicated that extension access increases farmer’s awareness concerning the relevance of fertilizers and how to use fertilizers profitably. On the contrary, herbicide adoption and its intensity of use, even though positive, are not statistically significant.
Results indicate that the number of years of rice farming has a positive and significant influence on household heads’ decision to use chemical fertilizer. This is plausible because farmers with a wealth of farm experience tend to have adequate information and better knowledge about production. Hence, they are in a better position to assess the benefits of any agricultural technology at stake. This finding is consistent with Beshir et al. [37], who indicated that farming experience improves technology adoption among farmers. Similarly, years of rice farming did positively influence the adoption of herbicides, though it was not statistically significant.
Male-headed households are likely to intensify their use of chemical fertilizer and herbicides compared to their compatriot female heads. This could be because males are more resource-endowed than their female counterparts in implementing most resource-demanding agricultural technologies [38,39,40]. Gender differences in terms of productivity, input use, and access to productive resources have been and continue to be a stumbling block to agricultural productivity [41].
Age of household head negatively and significantly influences the adoption of herbicides. This is consistent with the findings of Rahji et al. [42], who posited that older farmers are more conservative, which affects adoption compared to young farmers who are more innovative and always want to explore more.
The marital status of household heads negatively affects chemical fertilizer adoption and intensity of usage. This could be explained by the financial obligations that go with marriage, and the household head may not have enough resources to invest in fertilizer use. This is bolstered by the findings of Mensah et al. [43], who indicated that married farmers are less financially stable to undertake agricultural investments such as chemical fertilizer adoption for crop production compared to unmarried farmers. This is largely due to the financial responsibilities that come with marriage.
Household size also positively and significantly influences herbicide adoption. This is bound to be due to that the number of dependents within the family is less and therefore there is a need to increase food production to feed larger household size families. This finding leads credence to the results of Idrisa et al. [44], who witnessed similar findings in their study.
Household heads’ total livestock unit has a positive and significant influence on their decision to use chemical fertilizers. This indicator can be proxied as the household’s wealth and financial liquidity status. It removes the financial constraint aspect of agricultural technology adoption. This finding is in line with the findings of Danso-Abbeam and Baiyegunhi [45].
We find that off-farm income has a positive and significant influence on herbicide adoption. Farmers who engage in off-farm income activities have the financial capacity to buy herbicides, as the financial constraint to this technology adoption may be overcome through this option and returns. This is consistent with the findings of Danso-Abbeam and Baiyegunhi [45]. Notwithstanding this revelation, Ahmed [46] indicated that part-time farmers will have a lower likelihood of adopting agricultural technologies due to the labor intensity of the usage of most agricultural technologies, and that there will be a trade-off as one engages in off-farm work.
Land ownership also has a negative and significant influence on chemical fertilizer and herbicide adoption. In addition, the intensity of use of chemical fertilizer is negative and statistically significant. Tenant household heads of rice farmlands are less willing to invest in chemical fertilizers. There is a tendency for the land to be allocated to a different user during the next cropping season, leading to the farmer not reaping the full benefits of his/her investment, as not all the nutrients will be exhausted in the soil in a single production season. Mensah et al. [43] reiterated this finding, as farmers, especially settlers, are less willing to invest in mineral fertilizer, as the returns may not be realized in one crop production calendar application. This may be due to tenure insecurity and the Marshallian inefficiency hypothesis or lower efficiency of input use on rented-in plots than owned plots [47].
The asset value of the household head positively and significantly influences the adoption of chemical fertilizer. The asset value of household heads serves as a proxy for their endowment and wealth [48], which can be employed to procure productive resources and boost agricultural technologies. This result is in line with the findings of Ali et al. [35], who asserted that the possession of assets constitutes an important resource for technology adoption among cocoa farmers in the Western Region of Ghana. Farm size negatively and significantly influences the adoption of chemical fertilizer and herbicides. This is consistent with the finding of Kassie et al. [47], who indicated that land scarcity (size of plots) might affect the extent of agricultural intensification through the adoption of agricultural technologies. Moreover, Danso-Abbeam and Baiyegunhi [45] showed that the inverse relationship between farm size and technology adoption could partly be attributed to farmers’ inability to catch up with the cost of technologies and operational costs such as labor as farm size increases.
Market distance positively and significantly influences chemical fertilizer and herbicide intensification during rice production. This suggests that closer proximity to the market will encourage easy access to market information and transportation of these agrochemicals to promote their usage. This finding is supported by Kumar et al. [49], who indicated that market distance is a disincentive to farmers in adopting agricultural technologies. They indicated that the market gives rise to spatial biases that hinder access to new technologies and their potential.
3.2. Rice Yield Response to Chemical Fertilizer Use
Based on the estimates of a two-stage least squares regression, the average expected conditional rice yield given the levels of chemical fertilizer use and the covariates are derived. The kernel density estimates and the dose–response function distributions are plotted at a 5% significance level for all chemical fertilizer levels derived from the two-stage least square estimation presented in Figure 1.
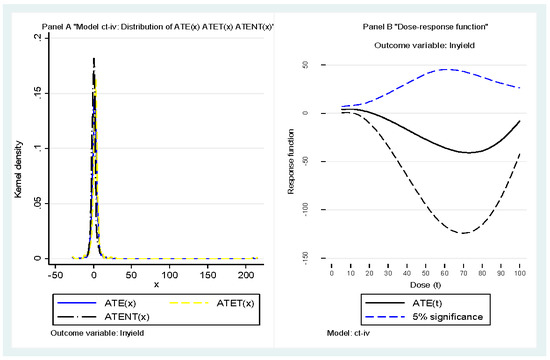
Figure 1.
Distribution of ATE(x), ATET(x), and ATENT(x) and dose–response function for chemical fertilizer on rice yield.
The kernel density estimate is a non-parametric estimation that enables a visualization of the distributions of the ,, and . Panel A of Figure 1 indicates less spread of the levels of chemical fertilizer usage across all rice yields. The spread is pronounced at levels of chemical fertilizer use with and concentrating at higher yields of rice than ; this implies a high mean rice yield for adopters compared to the non-adopters of chemical fertilizer.
Panel B of Figure 1 indicates the effect of various chemical fertilizer usage levels on rice yield plotted at a 5% level of significance. At lower and higher levels of chemical fertilizer use, the panel exhibits tighter confidence bands than in the middle, where the discrepancy between the point estimates and their precision is more obvious. This could imply that most farmers use chemical fertilizers in a low- or high-intensity manner. This demonstrates diverse rice yield responses of farm households appraised over different chemical fertilizer levels used. The association between the two variables exhibits a cubic hyperbola shape with rice yields falling from a positive point, reaching a minimum, and subsequently increasing to a maximum point as levels of chemical fertilizer usage increase. That is to say, the function depicts the non-linearity of the treatment effects. This form of nexus suggests that, on average, chemical fertilizer use levels are related to a 10% improvement in rice yield. This increment in rice yield initially achieved at low treatment levels declines and becomes irrelevant as intensity of chemical fertilizer use reaches 20% through 70%. Thereafter, at higher intensity of chemical fertilizer use we observe an uptick in rice yields. This, in other words, suggests that low levels of chemical fertilizer usage have a negative effect on yield, and the effect turns positive with higher intensity of chemical fertilizer usage. These findings agree with the results of McArthur and McCord [50], who explored the economic development effect of fertilizer growth and usage in boosting crop yields. There is the possibility that excesses of the chemical fertilizer anticipated to achieve higher yield could result in environmental damage.
3.3. Rice Yield Response to the Level of Herbicide Use
Using estimates of the two-stage least squares regression, the average expected conditional rice yield given the levels of herbicides use and the covariates are estimated and plotted in Figure 2. The kernel density in Panel A of Figure 2 indicates more spread of the causal factors of all levels of herbicide usage. This spread is less pronounced in and showing kg ha−1 of rice yield compared to . This demonstrates that an increase in rice yields is due to herbicide adoption as compared to non-adoption. However, this increase in rice yield from the adoption of herbicide is short-lived or diminishes shortly after an increase in its intensification.
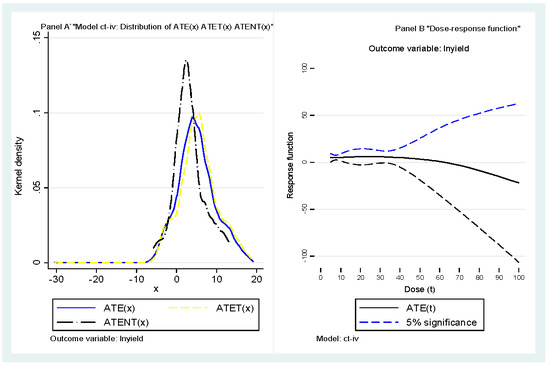
Figure 2.
Distribution of ATE(x), ATET(x), and ATENT(x) and dose–response function for herbicides on rice yield.
Panel B of Figure 2 illustrates the different rice yield responses of farm households evaluated across all herbicide levels. The function depicts a non-linearity of the treatment effect. Unlike the rice yield response to chemical fertilizers, we only see tighter confidence bands at lower levels of herbicide application intensity, and more significant disparities between point estimates and their precision everywhere else. This could indicate that most farmers use herbicides at low intensity. This form of the association indicates that, on average, herbicide use is linked with a 7% kg ha−1 increase in rice yield. However, this increase in rice yield diminishes substantially as intensity of herbicide use reaches 40% through to 100%. This, in other words, implies that high intensity of herbicide use will have a negative average treatment effect, and the result turns worse with more herbicide treatment. This underscores the need for farmers to apply herbicides in their right proportions to improve rice yield. This is supported by Petit et al. [51], who contended that herbicide use reduction could maintain crop yields and biodiversity effects of weeds.
4. Conclusions
In this study, we assessed rice yield response to the levels of agrochemical use in Ghana. We applied a Dose–Response Model (DRM) approach under continuous and heterogeneous responses to treatment. We collected farm household-level data from 900 households. The results show that years of schooling, years of rice farming, total livestock units owned, and total asset value of household heads positively influence the adoption of chemical fertilizers. Extension access by farm households also positively influences chemical fertilizer adoption and intensity of use. In addition, membership of farmer-based organizations by household head, size of household, and off-farm income positively affect the adoption of herbicide. On the contrary, age of household head, farm size, and land ownership negatively influence herbicide adoption.
The DRM of rice yield with chemical fertilizer treatment indicates that, on average, chemical fertilizer is associated with a 10% increase in the average treatment effect. Nonetheless, this increase dissipates as chemical fertilizer use intensity reaches 20% to 70%, followed by a subsequent increase when intensity of use exceeds 70%. The implication is that low levels of chemical fertilizer have a negative impact on rice yield, and the result turns positive with more chemical fertilizer treatment. On the other hand, the DRM of rice yield with herbicide treatment shows that, on average, herbicide use is correlated with a 7% increase in the average treatment effect. Nonetheless, there is a rapid and unambiguous decline in average treatment when herbicide use intensity exceeds 40%. This suggests that high herbicide levels or volumes will have negative causal effects on rice yield, and the result worsens with more herbicide treatment. It can be concluded that rice yield responds to an increase in the intensity of the use of chemical fertilizers but not herbicides.
This study’s findings imply that even though the Green Revolution agricultural technologies were meant to be adopted as a package to benefit from them, their right mix in terms of levels or intensity is also critical. These findings can help us develop better agricultural technology interventions that foster better synergies in terms of dosage or treatment and avoid trade-offs between agricultural technologies and outcome variables such as yield. While herbicides and chemical fertilizers are recommended for smallholder rice farming to help improve yields, we recommend that these inputs be applied based on scientific recommendations. With such inputs, the notion that more is better may not always hold. The Dose–Response Model, accounting for heterogeneity in the farmer population, is a useful tool to develop guidance on optimal levels of agrochemicals in rice farming
While this paper contributes to the discourse of agricultural production and the environment with regard to the use of agrochemicals in developing countries, one limitation is worth mentioning. Due to data limitations, the data used here are neither plot-level nor cross-sectional time series where one would be expected to estimate the plot-level production functions and account for year random effects as in Kaitibie et al. [52], Tembo et al. [53], Ng’ombe and Lambert [54], Boyer et al. [55], Wu et al. [56], and others. Future studies should use such richer datasets and combine the DRM and estimation of production functions to compare optimal agrochemical levels, as well as the impacts such input levels have on rice or any other crop yield response to improve results reported here.
Author Contributions
K.N.A., J.N.N. and S.K. contributed to the study. Conceptualization, K.N.A. and J.N.N.; methodology, K.N.A. and J.N.N.; software, K.N.A.; validation, K.N.A., J.N.N. and S.K.; formal analysis, K.N.A. and J.N.N.; investigation, K.N.A., J.N.N. and S.K.; resources, K.N.A., J.N.N. and S.K.; data curation, K.N.A.; writing—original draft preparation, K.N.A.; writing—review and editing, K.N.A., J.N.N. and S.K.; visualization, K.N.A., J.N.N. and S.K.; supervision, K.N.A., J.N.N. and S.K. All authors have read and agreed to the published version of the manuscript.
Funding
This research received no external funding.
Institutional Review Board Statement
Not applicable.
Data Availability Statement
The data that support the findings of this study are available from the authors upon reasonable request.
Acknowledgments
The authors gratefully thank two anonymous reviewers and the Editor for their constructive comments and suggestions that improved the quality of this paper.
Conflicts of Interest
The authors declare no conflict of interest.
References
- USDA. Rice Summary Statistics; USDA: Washington, DC, USA, 2019. [Google Scholar]
- Asravor, J.; Onumah, E.E.; Wiredu, A.N.; Siddig, K. Rice Productivity and Technical Efficiency: A Meta-Frontier Analysis of Rice Farms in Northern Ghana. In Proceedings of the Conference on International Research on Food Security, Natural Resource Management and Rural Development, Hamburg, Germany, 6–8 October 2009; pp. 1–5. [Google Scholar]
- Ragasa, C.; Chapoto, A. Limits to Green Revolution in rice in Africa: The case of Ghana. Land Use Policy 2017, 66, 304–321. [Google Scholar] [CrossRef]
- Asuming Brempong, S. Profitability, competitiveness, and welfare effects of trade liberalisation on the rice subsector in Ghana. Struct. Adjust. Agric. West Afr. 1998, 217–246. [Google Scholar]
- Mukai, S. Data on farmers’ determinants of manure and inorganic fertiliser use in the semi-arid Ethiopian Rift Valley. Data Brief 2017, 14, 804–812. [Google Scholar] [CrossRef]
- Njoroge, R.; Otinga, A.N.; Okalebo, J.R.; Pepela, M.; Merckx, R. Maize (Zea mays L.) response to secondary and micronutrients for profitable N, P and K fertilizer use in poorly responsive soils. Agronomy 2018, 8, 49. [Google Scholar] [CrossRef]
- Uri, N.D. The use of fertilizer and its environmental consequences. Energy Environ. 1997, 8, 191–205. [Google Scholar] [CrossRef]
- Djebbari, H.; Smith, J. Heterogeneous impacts in PROGRESA. J. Econom. 2008, 145, 64–80. [Google Scholar] [CrossRef]
- Kassie, M.; Jaleta, M.; Mattei, A. Evaluating the impact of improved maize varieties on food security in Rural Tanzania: Evidence from a continuous treatment approach. Food Secur. 2014, 6, 217–230. [Google Scholar] [CrossRef]
- Guo, J.H.; Liu, X.J.; Zhang, Y.; Shen, J.L.; Han, W.X.; Zhang, W.F.; Christie, P.; Goulding, K.W.T.; Vitousek, P.M.; Zhang, F.S. Significant acidification in major Chinese croplands. Science 2010, 327, 1008–1010. [Google Scholar] [CrossRef]
- Sun, B.; Zhang, L.; Yang, L.; Zhang, F.; Norse, D.; Zhu, Z. Agricultural non-point source pollution in China: Causes and mitigation measures. Ambio 2012, 41, 370–379. [Google Scholar] [CrossRef]
- Amoako, P.K.; Kumah, P.; Appiah, F. Pesticides usage in Cabbage (Brassica oleracea) Cultivation in the Ejisu-Juaben Municipality of the Ashanti Region of Ghana. Int. J. Res. Chem. Environ. 2012, 2, 26–31. [Google Scholar]
- Cerulli, G. Ctreatreg: Command for fitting dose–response models under exogenous and endogenous treatment. Stata J. 2015, 15, 1019–1045. [Google Scholar] [CrossRef]
- Ng’ombe, J.; Kalinda, T. A stochastic frontier analysis of technical efficiency of maize production under minimum tillage in Zambia. Sustain. Agric. Res. 2015, 4, 31–46. [Google Scholar] [CrossRef]
- Ng’ombe, J.; Kalinda, T.; Tembo, G.; Kuntashula, E. Econometric analysis of the factors that affect adoption of conservation farming practices by smallholder farmers in Zambia. J. Sustain. Dev. 2014, 7, 124. [Google Scholar] [CrossRef]
- Lu, W.; Addai, N.K.; Ng’ombe, N.J. Does the use of multiple agricultural technologies affect household welfare? Evidence from Northern Ghana. Agrekon 2021, 60, 370–387. [Google Scholar] [CrossRef]
- Guardabascio, B.; Ventura, M. Estimating the Dose–Response Function through a Generalized Linear Model Approach. Stata J. Promot. Commun. Stat. Stata 2014, 14, 141–158. [Google Scholar] [CrossRef]
- Imai, K.; van Dyk, A.D. Causal inference with general treatment regimes: Generalizing the propensity score. J. Am. Stat. Assoc. 2004, 99, 854–866. [Google Scholar] [CrossRef]
- Hirano, K.; Imbens, C.G. The propensity score with continuous treatments. In Applied Bayesian Modeling and Causal Inference from Incomplete-Data Perspectives; Gelman, A., Menged, X.-L., Eds.; John Wiley and Sons: Chichester, UK, 2004; pp. 73–84. [Google Scholar]
- Adorno, V.; Bernini, C.; Pellegrini, G. The impact of capital subsidies: New estimations under continuous treatment. G. Degli Econ. E Ann. Di Econ. 2007, 66, 66–92. [Google Scholar]
- Teklewold, H.; Kassie, M.; Shiferaw, B.; Köhlin, G. Cropping system diversification, conservation tillage and modern seed adoption in Ethiopia: Impacts on household income, agrochemical use and demand for labor. Ecol. Econ. 2013, 93, 85–93. [Google Scholar] [CrossRef]
- Amemiya, T. Advanced Econometrics; Harvard University Press: Cambridge, MA, USA, 1985. [Google Scholar]
- Martey, E.; Wiredu, N.A.; Etwire, M.P.; Fosu, M.; Buah, J.S.S.; Bidzakin, J.; Ahiabor, K.B.D.; Kusi, F. Fertilizer Adoption and Use Intensity Among Smallholder Farmers in Northern Ghana: A Case Study of the AGRA Soil Health Project. Sustain. Agric. Res. 2013, 3, 24. [Google Scholar]
- Moe, K.; Htwe, A.Z.; Thu, T.T.P.; Kajihara, Y.; Yamakawa, T. Effects on NPK status, growth, dry matter and yield of rice (Oryza sativa) by organic fertilizers applied in field condition. Agriculture 2019, 9, 109. [Google Scholar] [CrossRef]
- Wooldridge, J.M. Introductory Econometrics: A Modern Approach, 6th ed; Economica; Cengage Learning: Boston, MA, USA, 2016. [Google Scholar]
- Obianefo, C.A.; Ng’ombe, J.N.; Mzyece, A.; Masasi, B.; Obiekwe, N.J.; Anumudu, O.O. Technical Efficiency and Technological Gaps of Rice Production in Anambra State, Nigeria. Agriculture 2021, 11, 1240. [Google Scholar] [CrossRef]
- Amadu, F.O.; Miller, D.C.; McNamara, P.E. Agroforestry as a pathway to agricultural yield impacts in climate-smart agriculture investments: Evidence from southern Malawi. Ecol. Econ. 2020, 167, 106443. [Google Scholar] [CrossRef]
- Chao, Z.; Shi, G.; Jian, S.; Rui-fa, H.U.; Zhang, C.; Guanming, S.; Shen, J.; Hu, R.F. Productivity effect and overuse of pesticide in crop production in China. J. Integr. Agric. 2015, 14, 1903–1910. [Google Scholar]
- Lu, W.; Addai, K.N.; Ng’ombe, J.N. Impact of improved rice varieties on household food security in Northern Ghana: A doubly robust analysis. J. Int. Dev. 2021, 33, 342–359. [Google Scholar] [CrossRef]
- Singh, V.; Jat, M.L.; Ganie, Z.A.; Chauhan, B.S.; Gupta, R.K. Herbicide options for effective weed management in dry direct-seeded rice under scented rice-wheat rotation of western Indo-Gangetic Plains. Crop Prot. 2016, 81, 168–176. [Google Scholar] [CrossRef]
- Ng’ombe, J.N.; Kalinda, T.H.; Tembo, G. Does adoption of conservation farming practices result in increased crop revenue? Evidence from Zambia. Agrekon 2017, 56, 205–221. [Google Scholar] [CrossRef]
- Ali, E.B.; Awuni, J.A.; Danso-Abbeam, G. Determinants of fertilizer adoption among smallholder cocoa farmers in the Western Region of Ghana. Cogent Food Agric. 2018, 4, 1–10. [Google Scholar] [CrossRef]
- Katung, E.; Akankwasa, K. Community-based organizations and their effect on the adoption of agricultural technologies in Uganda: A study of banana (Musa spp.) pest management technology. Acta Hortic. 2010, 879, 719–726. [Google Scholar] [CrossRef]
- Addai, K.N.; Temoso, O.; Ng’ombe, J.N. Participation in farmer organizations and adoption of farming technologies among rice farmers in Ghana. Int. J. Soc. Econ. 2021, 49, 529–545. [Google Scholar] [CrossRef]
- Ali, J.; Yusof, N.; Fadzli, F.S. Factors influencing farmer’s perceptions and behavior toward pesticide use in Malaysia. Int. J. Soc. Econ. 2018, 45, 775–791. [Google Scholar] [CrossRef]
- Danlami, A.H.; Islam, R.; Applanaidu, S.D.; Tsauni, A.M. An empirical analysis of fertiliser use intensity in rural Sub-Saharan Africa: Evidence from Tofa local government area, Kano State, Nigeria. Int. J. Soc. Econ. 2016, 43, 1400–1419. [Google Scholar] [CrossRef]
- Beshir, H.; Emana, B.; Kassa, B.; Haji, J. Determinants of chemical fertilizer technology adoption in North eastern highlands of Ethiopia: The double hurdle approach. J. Res. Econ. Int. Financ. 2012, 1, 39–49. [Google Scholar]
- Mulungu, K.; Mudege, N.N. Effect of group and leader attributes on men and women farmers’ participation in group activities in Zambia. Fem. Econ. 2020, 26, 178–204. [Google Scholar] [CrossRef]
- Addai, K.N.; Lu, W.; Temoso, O. Are Female Rice Farmers Less productive than Male Farmers? Micro-evidence from Ghana. Eur. J. Dev. Res. 2021, 33, 1997–2039. [Google Scholar] [CrossRef]
- Addai, K.N.; Ng’ombe, J.N.; Temoso, O. Food Poverty, Vulnerability, and Food Consumption Inequality Among Smallholder Households in Ghana: A Gender-Based Perspective. Soc. Indic. Res. 2022, 163, 661–689. [Google Scholar] [CrossRef]
- FAO. Guidelines for Measuring Household and Individual Dietary Diversity; FAO: Rome, Italy, 2011. [Google Scholar]
- Rahji, M.; Akintola, J.; Tiamiyu, S. Technology Adoption and Productivity Difference among Growers of New Rice for Africa in Savanna Zone of Nigeria. Tropicultura 2009, 27, 193–197. [Google Scholar]
- Mensah, M.; Villamor, G.; Vlek, P.L.G. Gender specific determinants of inorganic fertilizer adoption in the semi-arid region of Ghana. West Afr. J. Appl. Ecol. 2018, 26, 179–192. [Google Scholar]
- Idrisa, L.Y.; Ogunbameru, O.B.; Madukwe, C.M. Logit and Tobit analyses of the determinants of likelihood of adoption and extent of adoption of improved soybean seed in Borno State, Nigeria. Greener J. Agric. Sci. 2012, 2, 37–45. [Google Scholar] [CrossRef]
- Danso-Abbeam, G.; Baiyegunhi, L.J.S. Welfare impact of pesticides management practices among smallholder cocoa farmers in Ghana. Technol. Soc. 2018, 54, 10–19. [Google Scholar] [CrossRef]
- Ahmed, M.H. Adoption of multiple agricultural technologies in maize production of the Central Rift Valley of Ethiopia. Stud. Agric. Econ. 2015, 117, 162–168. [Google Scholar] [CrossRef]
- Kassie, M.; Teklewold, H.; Jaleta, M.; Marenya, P.; Erenstein, O. Understanding the adoption of a portfolio of sustainable intensification practices in eastern and southern Africa. Land Use Policy 2015, 42, 400–411. [Google Scholar] [CrossRef]
- Danso-Abbeam, G.; Baiyegunhi, L.J.S. Adoption of agrochemical management practices among smallholder cocoa farmers in Ghana. Afr. J. Sci. Technol. Innov. Dev. 2017, 9, 717–728. [Google Scholar] [CrossRef]
- Kumar, A.; Takeshima, H.; Thapa, G.; Adhikari, N.; Saroj, S.; Karkee, M.; Joshi, K.P. Adoption and diffusion of improved technologies and production practices in agriculture: Insights from a donor-led intervention in Nepal. Land Use Policy 2020, 95, 104621. [Google Scholar] [CrossRef]
- McArthur, J.W.; McCord, G.C. Fertilizing growth: Agricultural inputs and their effects in economic development. J. Dev. Econ. 2017, 127, 133–152. [Google Scholar] [CrossRef] [PubMed]
- Petit, S.; Munier-Jolain, N.; Bretagnolle, V.; Bockstaller, C.; Gaba, S.; Cordeau, S.; Lechenet, M.; Mézière, D.; Colbach, N. Ecological Intensification Through Pesticide Reduction: Weed Control, Weed Biodiversity and Sustainability in Arable Farming. Environ. Manag. 2015, 56, 1078–1090. [Google Scholar] [CrossRef] [PubMed]
- Kaitibie, S.; Nganje, E.W.; Brorsen, W.B.; Epplin, M.F. A Cox Parametric Bootstrap Test of the von Liebig Hypotheses. Can. J. Agric. Econ. 2007, 55, 15–25. [Google Scholar] [CrossRef]
- Tembo, G.; Brorsen, B.W.; Epplin, F.M.; Tostão, E. Crop input response functions with stochastic plateaus. Am. J. Agric. Econ. 2008, 90, 424–434. [Google Scholar] [CrossRef]
- Ng’ombe, J.N.; Lambert, D.M. Using Hamiltonian Monte Carlo via Stan to estimate crop input response functions with stochastic plateaus. J. Agric. Food Res. 2021, 6, 100226. [Google Scholar] [CrossRef]
- Boyer, C.N.; Wade Brorsen, B.; Solie, J.B.; Raun, W.R. Profitability of variable rate nitrogen application in wheat production. Precis. Agric. 2011, 12, 473–487. [Google Scholar] [CrossRef]
- Wu, Y.W.; Bo, Z.H.A.O.; Li, X.L.; Liu, Q.L.; Feng, D.J.; Lan, T.Q.; Yuan, J.C. Nitrogen application affects maize grain filling by regulating grain water relations. J. Integr. Agric. 2022, 21, 977–994. [Google Scholar] [CrossRef]


Publisher’s Note: MDPI stays neutral with regard to jurisdictional claims in published maps and institutional affiliations. |
© 2022 by the authors. Licensee MDPI, Basel, Switzerland. This article is an open access article distributed under the terms and conditions of the Creative Commons Attribution (CC BY) license (https://creativecommons.org/licenses/by/4.0/).