Abstract
Crop wastes could be applied in conjunction with synthetic fertilizers to satisfy crop nutritional needs and enhance soil fertility. A field experiment was carried out during winter 2019–2020 at the AMK Research Farm (Palatoo) Mardan, KPK (Pakistan) to investigate the combined effect of phosphorous (PS) and organic sources (OSs) on wheat productivity under different irrigation regimes. The experimental factors were: two irrigation regimes (limited and full irrigation), three inorganic sources of phosphorus (triple super phosphate (TSP), single super phosphate (SSP) and di-ammonium phosphate (DAP)) applied at 90 kg ha−1, and three organic amendments (farmyard manure (FYM), mung bean residue (MBR), and canola residue (CR)) applied at a rate of 10 t ha−1. A control plot (no phosphorus or organic supply) was included. A randomized complete block design (RCBD) with three replications was adopted. Among the fertilization strategies, SSP + FYM outperformed all other P fertilizers combined with legume or nonlegume residues in terms of grains per spike−1 (52), thousand-grain weight (41.6 g), biological yield (9.7 t ha−1), and grain yield (4 t ha−1). Under full irrigation, improved yield, yield components, and profits were obtained compared to the limited irrigation regime. Three clusters were obtained after applying an Agglomerative Hierarchical Clustering (AHC), and Principal Component Analysis (PCA) conferred the positive effects of inorganic P with FYM on the wheat yield and its related parameters. This study indicated that the productivity of wheat under the SSP + FYM fertilization strategy was found to be more economical with respect to the benefit–cost ratio (BCR). The combined application of SSP + FYM was more profitable in terms of a higher BCR (3.25) than other treatments under the full irrigation regime.
1. Introduction
Worldwide, wheat (Triticum aestivum L.) is the leading agronomic crop in production and acreage and occupies a crucial position in agriculture strategies and farming [1]. Wheat is Pakistan’s most essential cereal grain and accounts for 8.7% of the value addition in agriculture and 1.7% of the GDP [2].
Although soil and climate conditions of Pakistan are favorable, and high-yielding varieties are also available, the yield recovery of wheat in a farmer’s field is quite low compared to technologically more advanced countries. One of the major causes of low production is low soil fertility due to prolonged cropping with little or no external inputs and the removal of crop residues [3]. In Pakistan, wheat yield and nutrient use efficiency are reduced due to inefficient fertilizer use, poor germination, nutrient leaching, imbalanced fertilizers, soil alkalinity, and improper application time [4]. However, the overuse of chemical fertilizers and agrochemicals has severely damaged soil ecosystems [5]. To address the aforementioned issues, cost-effective, environmentally friendly, and more productive farming technologies must be developed [6].
Phosphorus (P) is an essential macronutrient required for increasing wheat production through a variety of physiological mechanisms involved in growth [7]. Indeed, it plays an important role in physiological and biochemical responses, such as photosynthesis transfer [8]. The wheat grain yield is decreased by up to 30% due to P shortage [9]. In Pakistan, about 80% to 90% of soils are deficient in available P [10]. Therefore, P deficiency is the most prevalent nutritional stress on these soils [11]. As a result, P must be applied in ways that enhance P fertilizer efficiency, reduce existing losses, mitigate environmental implications, conserve scarce P resources, and assure P availability for all farmers [12]. One such strategy is “manure management”, which involves reusing locally produced organic resources (e.g., manure) that are both ecologically friendly and cheap to boost crop productivity in low P availability soils. Using both chemical and organic fertilizers results in better farming and more sustainable production. Sustainable phosphorus use, which integrates chemical P application with locally available, environmentally friendly, and inexpensive organic resources, should therefore be promoted.
Many studies have shown that organic manures may partially or entirely substitute chemical fertilizers, reducing dependency on limited rock phosphate reserves [5,7,13]. Cattle farmyard manure (FYM), poultry litter (PL), sewage sludge (SS), and press mud (PM) of sugar mills are native to organic fertilizer courses for the production of crops. To influence soil character and nutrient recycling, various kinds of organic materials, their values, and application methods are important [14,15]. The incorporation of various legume crops and straws of exhaustive crops in the soil is ideal for the maintenance of fertility status [16]. A positive role of organic matter in enhancing water availability to crops could reduce the adverse impact of drought on the younger parts of the plants [17]. Animal dung and legumes could greatly improve the effectiveness of native P and K, and incorporating covered crop residues could conserve them [18]. The accumulation of organic matter increases soil productivity by improving the soil’s physicochemical properties, including the availability of nutrients, pH, cation exchange capacity, water holding capacity, aggregate stability, and microbial activity [19]. However, nutrient bioavailability depends upon crop straw decomposition and nutrient concentration [20]. Manure is a very alterable product that is often hard to utilize precisely and releases nutrients in the soil, something which is truly dependent on ecological conditions. Conversely, some studies have verified that the isolated use of farmyard manure, or in addition with mineral fertilizers, was valuable in preserving soil quality under constant farming and led to an enhancement in electrical conductivity (EC), cation exchange capacity (CEC), biological carbon and moisture content of the soil by utilizing FYM [21]. The addition of organic matter (OM) enormously affected soil pH through diverse biological changes, and pH difference differs with the nature of OM [22]. The application of organic materials is essential because they supply several types of plant nutrients, including micronutrients, expand the soil chemical and physical attributes, and hence sustain the holding of nutrients and improve the activities of microbes [23]. Organic manure enhanced soil fertility, OM, and water holding capacity within the soil and upgraded soil nitrogen content, nutrient availability, emit, and mobilization and preserved the soil against erosion [24].
Irrigation is one of the most important variables influencing agricultural productivity. According to recent data, the agricultural sector uses over 70% of the country’s freshwater resources [25]. Existing surface water supplies appear to be depleted and imbalanced in time and space [26]. About 30% of the losses occur in wheat production due to limited irrigation water, and 40% of the yield losses are due to nutrient deficiency [27]. However, adequate water and nutrient supply can increase yields by up to 70% in our country [28]. The frequency of irrigation considerably affects the growth and wheat yield. By increasing irrigation rates, the grain yield of wheat can be enhanced [29]. In Pakistan, rainfall during the rabi (winter) season is frequently meager and unpredictable. Furthermore, irrigation services are not as widespread as they should be to ensure adequate water across the country. Thus, one of the irrigation scheduling techniques in wheat farming is to use irrigation water sparingly during critical growth stages to maximize crop production.
The current study hypothesized that wheat productivity and profitability could be improved under limited irrigation regimes through the partial substitution of chemical fertilizers with organic supplements. Therefore, the objective of the study was to formulate a more profitable and sustainable wheat production system under moisture stress environments through the integration of various combinations of phosphorous sources and organic supplements.
2. Materials and Methods
2.1. Plant Material
Wheat (Triticum aestivum L.) cv. “Pirsabak-2015” was used as a test crop in this study. Healthy and mature seeds, which had a 95% germination capacity, were obtained from Cereal Crop Research Institute (CCRI) Nowshera Pirsabak, Pakistan. This variety is recommended for both rainfed and irrigated field conditions.
2.2. Study Area
A field experiment was conducted during winter 2019–2020 at the AMK Research Farm (Palatoo) Mardan, KPK(Pakistan), which is located between 34°15′38″ North latitude and 72°06′36″ East longitude and an altitude of 350 m above sea level. This region has intensive agricultural activities with the cultivation of a variety of field crops (wheat, rice, maize, tobacco, and sugarcane), but the wheat–maize rotation scheme is usually adopted in this region. The climate data of the area are shown in Figure 1 [30].
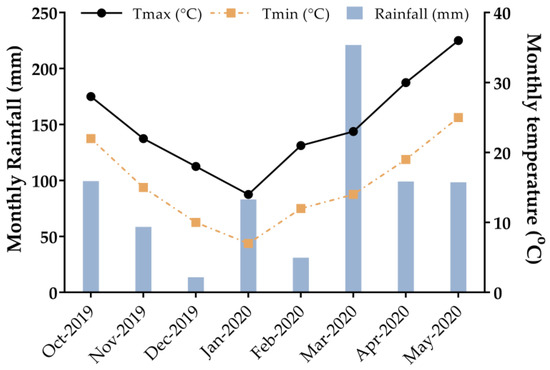
Figure 1.
Maximum (Tmax) and minimum (Tmin) temperatures (°C) and rainfall (mm) at the experimental site during the growing season of wheat.
Soil samples from the upper horizon (0–20 cm) were collected in each plot before starting the experiment using a soil auger. The samples were air-dried, crushed to pass through a 2 mm sieve, mixed to make a composite sample, labeled, and stored in a plastic bag. Standard laboratory methods were used for physical and chemical characterization [31]. Soil of the experimental field was clay loam in texture (sand 18%, silt 49%, and clay 33%), alkaline in reaction (pH 8.2), calcareous in nature (165.32 g kg−1 lime), low in organic matter content (8.7 g kg−1) with electrical conductivity of 0.26 dS m−1. Furthermore, the soil had a low concentration of extractable phosphorous 4.46 mg kg−1, total N 0.06 g kg−1, and exchangeable potassium (AB-DTPA) of 128 (mg kg−1).
2.3. Organic Materials Collection and Analysis
Farmyard manure was received from the Diary Farm located at the University of Agriculture Peshawar, Pakistan. The farmyard manure was analyzed for pH and nitrogen (N) by the Kjeldahl method and for P by calorimetry following [32]. The composition of farmyard manure used in the experiments is given in Table 1. Both canola (Brassica napus L.) and mung bean (Vigna radiata L.) residues were obtained from a commercial field crop at Agronomy Research Farm, The University of Agriculture Peshawar. At the physiological maturation stage, the plants were collected and separated. The plant residue was chopped to a length of 20–25 mm manually using a pair of scissors. A portion of canola and mung bean residues of each size was further ground in a coffee grinder and analyzed for some basic properties (Table 1). The analytical data were later corrected for moisture content after drying residues of different sizes at 60 °C for 96 h.

Table 1.
Some quality parameters of the organic materials used in the experiment.
2.4. Experimental Design and Treatments
The research consisted of three experimental factors: (i) two irrigation regimes (IRs) (limited (LI) and full irrigation (FI)), (ii) three inorganic sources of phosphorus (PS) (triple super phosphate (TSP, 46% of P2O5), single super phosphate (SSP, 18% of P2O5), and di-ammonium phosphate (DAP, 46% of P2O5)) each applied at 90 kg P2O5 ha−1, and (iii) three organic amendments (OS) ((farmyard manure (FYM), mung bean residue (MBR), and canola residue (CR)) each applied at a rate of 10 t ha−1. A control plot (no phosphorus or organic supply) was included in each replication plot. Randomized complete block design (RCBD) with a split-plot layout having three replications was used; irrigation regimes were allocated to the main plot, while various combinations of phosphorous sources (PSs) and organic supplements (OSs) were given to subplots. Each replication comprised ten treatments containing three (PSs), three (OSs), and one control plot (3 × 3 + 1 =10). Before wheat sowing, the field was ploughed twice with a cultivator, followed by a rotavator for seed bed preparation. The plot size was 3 × 3 m with 10 rows, and an R–R distance was kept at 30 cm. The experiment was conducted under two different irrigation regimes (IRs): (1) limited irrigation regime (LI), where the crop was irrigated twice, once at emergence, followed by a second irrigation at booting and (2) full irrigation regime (FI), where the crop was irrigated four times, first at the time of emergence, followed by a second irrigation at tillering stage, a third irrigation at booting stage, and a last irrigation at grain filling stage. The amount of each irrigation was four-acre inches (635 m3 ha−1) for a total of 1270 and 2540 m3 ha−1 of irrigation water required in LI and FI regimes, respectively. Wheat cultivar “Pirsabak-2015” was sown on 27 November 2019 by uniformly drilling in a depth of 3 cm into rows (30 cm apart) at the recommended rate of 120 kg ha−1. The basal dose of N was applied at 60 kg ha−1 as urea, while nitrogen received from DAP (18% N) was adjusted from urea. The recommended dose of 60 kg K ha−1 was applied in the form of potassium chloride (60% K2O). Wheat was harvested manually at physiological maturity at 167 days after sowing (14 May 2020). All other agronomic and cultural activities recommended for field experiments were equally maintained throughout the trail.
2.5. Data Collection
The data collected included phenological and growth parameters, such as emergence per meter, days to anthesis, days to physiological maturity, leaf number per tiller, mean leaf area, leaf area index, plant height, and crop growth rate. Furthermore, wheat yield and related trails were also recorded here. Data of emergence were recorded by counting plant numbers emerged in one-meter row length at randomly selected three rows in all experimental units and then converted with the formula given below [33]:
Data regarding anthesis days were recorded by calculating days since sowing to the date when 75% of the plants reached the stage of anthesis in each experimental unit. Data relating to maturity days were observed from sowing date to date when 80% of plants attained physiological maturity in each experimental unit or complete loss of glumes green color. Leaf number per tiller was determined by totaling the leaf number in 10 tillers selected randomly in each experimental unit, and the average number was calculated. Plant leaf area was measured by multiplying the leaf length and width of samples (3 middle leaves) of five tillers by a correction factor (CF = 0.65) using the following formula [34].
Leaf area index (LAI) was observed in each experimental unit by multiplying tiller number (m−2) with leaf area tiller−1 and then by dividing it by ground area [34].
Data relating to number of productive tillers (m−2) were observed by totaling the productive tiller in three randomly selected spaces in one-meter-long row in each experimental unit and was converted into (m−2) [35].
Unproductive tiller (m−2) data were collected by totaling the number of tillers that have no or small spikes in three center rows in each experimental plot and then were changed to nonproductive tillers (m−2) [35].
Data pertaining to height of the plant were observed by selecting five plants randomly in each experimental unit for the plant height from base of plant to spike tip including awns and then averaged. Crop growth rate (CGR) is an index of agricultural productivity of land in terms of the plant biomass produced per unit area. The CGR was determined by harvesting rows measuring 50 cm in length in each experimental unit during 60–90 (CGR1) and 90–120 (CGR2) days after sowing, respectively, and then dried for 72 h. Then, the following formula was used for CGR calculation in g m−2 day−1 [35]:
where W1 = first dry weight (g); W2 = last dry weight (g); GA = ground area of 0.3 × 0.5 m, and T1 and T2 are the time interval (days).
For counting number of grains per spike, five spikes were randomly selected, and the number of grains was counted separately, and the average was calculated. Thousand- grain weight (g) data were recorded using an electronic balance by counting a thousand grains from each plot at random. The crop was harvested manually from each plot separately, and the harvested plants were tied into bundles and stacked for sun-drying until constant weight to reduce moisture content. Biological yield was recorded by weighing the sun-dried bundles of each plot with spring balance, 50 kg capacity; the yield was equivalent to (t ha−1). Each plot was then threshed manually by a wheat thresher to record grain yield. The grains were cleaned and weighed in kg and then subsequently converted into t ha−1 [36]. Grain yield and harvest index for each treatment were calculated using Equations (8) and (9), respectively [10].
2.6. Statistical and Economic Analysis
The collected data were statistically analyzed with the analysis of variance (ANOVA) as appropriate for split-plot RCBD using statistical package Statistix8.1 (Statistix8.1, Tallahassee, FL, USA). If the F values were significant, the means were compared with the LSD test at α = 0.05 of probability levels [37]. The multi response permutation procedure (MRPP) was used to compare the within-group dissimilarities (WDs) and between-group dissimilarities (BDs) at p ≤ 0.05 as suggested by McCune and Grace [38], and the main effects of irrigation management and fertilization sources on wheat plant characteristics was assessed. The MRPP provides a T-statistic that describes group separation (the more negative T is, the stronger the separation is) and its associated significance. The BLOSSOM software [39] was used to perform the MRPP analysis. Furthermore, principal component analysis (PCA) was performed to classify the treatments according to the measured parameters and to identify the parameters that determine yield increases and crop productivity. Moreover, the agglomerative hierarchical clustering (AHC) was performed using Ward’s method to obtain the most important treatments related to grain yield. Both PCA and AHC analyses were performed using the XLSTAT 2022 statistical package software (Microsoft®, WA, USA). Economic analysis was also carried out using the methods recommended by the [CIMMYT] International Maize and Wheat Improvement Center [40]. The profitability of the used fertilization strategies was assessed by computing the gross, net, and benefit–cost ratios (BCRs). BCR analysis is a valuable method for evaluating the economics of farming systems. It is the net value of crop produce after deducting production costs. It denotes the significance of net returns from the use of a farming input or system. BCR was calculated as shown below:
where the costs include expenditures on field operations, i.e., ploughing, sowing, labor costs, and other expenses (seeds, P fertilizers, organic residues, marketing, and transportation). The details of the costs of production are presented in Table S1.
3. Results
3.1. Phenological and Growth Parameters
The day to the anthesis of wheat was significantly influenced by irrigation regimes (IRs) and fertilization strategy (FS). The interactions between irrigation management and fertilization sources (IR × FSs) did not show a substantial influence on the anthesis of wheat (Table 2). Fertilized plots recorded earlier anthesis (124 days) than the untreated plots (127 days). In the case of the irrigation regimes, delayed anthesis (124 days) was noted in the full irrigation plots, while early anthesis (123 days) was recorded under the limited irrigated plots. Among the used fertilization strategies, late anthesis (125 days) was reported in the TSP (at the rate of 90 kg ha−1) applied in combination with FYM (at the rate of 10 t ha−1), followed by DAP + FYM with (124.7 days), whereas earlier anthesis (123.2 days) was recorded in the plots that received SSP + MBR.
Table 2.
The effect of fertilization sources and irrigation regimes on the days to anthesis and days to physiological maturity of wheat.
Days taken by plants to physiological maturity were substantially influenced by the irrigation regimes (IRs) and fertilization sources (FSs). The interactions between IR × FS did not demonstrate a significant effect on crop physiological maturity (Table 2). Fertilized plots significantly took less days to mature (158 days) than unfertilized plots (160 days). In the irrigation regimes, delayed physiological maturity (159 days) was recorded under full irrigation as compared to limited irrigation (158 days). The effect of fertilization strategies on crop physiological maturity was highly significant; however, their interaction (IR × FS) was nonsignificant (Table 2). The application of TSP at 90 kg ha−1 in combination with FYM (at the rate of 10 t ha−1), increased the number of days needed by the plants to mature (159.7 days), while fewer days to maturity (157.3 days) were observed in the plots fertilized with (DAP + CR).
Wheat plant height was influenced by irrigation regimes (IRs) and different fertilization strategies (FSs) (Table 3). The fertilization strategy exerted a significant effect on the plant height of wheat. The fertilized plots significantly enhanced the height of plants (93.2 cm) compared to the unfertilized plots (87.4 cm). The tallest plants (95.5 cm) were attained under full irrigated plots compared to the limited irrigated plots (92.9 cm). The interactions between IR × FS did not demonstrate a significant effect on wheat plant height (Table 3). The effect of fertilization strategies on plant height was highly significant. The application of DAP + FYM resulted in a maximum plant height (97.3 cm), whereas shorter plant heights were attained with TSP + CR (89.8 cm) and the control (87.4 cm).
Table 3.
The effect of fertilization sources and irrigation regimes on plant height, crop growth rate (CGR), number of leaves, and leave area index (LAI) of wheat.
The data analysis exposed that the crop growth rate (CGR) of wheat was significantly influenced by the irrigation regime (IR) and various fertilization strategies (FSs) (Table 3). The interaction between IR and FS did not significantly influence the CGR. Data obtained from the two measured CGRs of wheat during 60–90 (CGR1) and 90–120 (CGR2) days after sowing showed that the mean value of the CGR (CGRmean: g m−2 day−1) was highest in the treated plots (16.9 g m−2 day−1) compared to the untreated plots (13.4 gm−2 day−1). The plots under the fully irrigated regimes had the highest CGRmean value (17.8 g m−2 day−1) compared to the limited irrigated regime plots (16 g m−2 day−1). Among fertilization strategies (FSs), the application of SSP in conjunction with FYM exhibited the maximum value of CGRmean (19.2 g m−2 day−1), while the lowest CGR values (14.5 and 13.4 g m−2 day−1) were noticed with TSP + CR and the control plots.
Irrigation regime and fertilization strategy exerted a significant effect on the leaf number per tiller−1 (Table 3). Treated plots had more leaves per tiller−1 (5.5) than the control (4.3). In the case of irrigation regimes, the maximum number of leaves per tiller−1 (5.7) was attained from the fully irrigated field than from the limited irrigated plots (5.2). The application of SSP + FYM resulted in the highest number of leaves per tiller−1 (5.9), while the minimum leaf number per tiller−1 was obtained by TSP + CR and the control plots.
A data analysis exhibited that there was no interaction between fertilization sources and irrigation regimes (IRs × FSs) on the leaf area index of wheat (Table 3). The fertilized plots had the highest significant LAI (3.2) as compared to the control (2). The irrigated regime plots had the highest LAI (3.5) as compared to the limited irrigated plots LAI (2.9). Among fertilization strategies (FSs), the application of SSP + FYM resulted in the highest LAI (4.2), while the following treatments: MBR + TSP, SSP + CR, and control plots had the lowest LAI values.
3.2. Wheat Yield and Its Related Trails
Irrigation regimes (IRs) and fertilization strategy (FS) significantly influenced the number of grains per spike−1 of wheat; however, their interaction (IR × FS) was nonsignificant (Table 4). Fertilized plots had pointedly more grains per spike−1 (47) than the control (43). The maximum grains per spike−1 (48) were acquired from the fully irrigated regime (FI) as compared to the limited irrigated regime (LI) plots (46). The application of SSP (at the rate of 90 kg ha−1) in combination with FYM (at the rate of 10 t ha−1) resulted in the highest grains per spike−1 (52), whereas the lowest (44) were attained from the TSP+CR treatment followed by the control plots (43).
Table 4.
The effect of fertilization sources and irrigation regimes on fertile tillers, grains per spike, thousand-grain weight (TGW), biological yield (BY), grain yield(GY) and harvest index(HI) of wheat.
From mean data it was concluded that TGW of wheat was affected meaningfully by irrigation regimes (IRs) and FS. While interaction IR × FS was observed to be not significant (Table 4). Fertilized plots had significantly more thousand-grain weight (38.1 g) as compared to the control (33.5 g). The fully irrigated experimental units were observed with more thousand-grain weight (39 g) as compared to the limited irrigated plots (37.3 g). While comparing fertilization strategy, the incorporation of SSP with FYM produced more thousand-grain weigh (41.6 g), while the least TGW (36.5 g) was recorded from plots treated with TSP + CR (35.8 g), followed by the untreated control plots (33.5 g).
The analysis of variance showed significant differences in the biological yield (BY) of wheat for both sources of variation (irrigation regimes and fertilization strategy); however, there was a significant interaction between IR × PS for BY (Table 4). Fertilized plants had a substantially maximum biological yield (9.01 t ha−1) compared to the nonfertilized plants (7.75 t ha−1). BY was higher (9.3 t ha−1) in the case of plots that received the full irrigation regime (FI) compared to the limited irrigation regime (LI), which had the lowest BY (8.72 t ha−1). The highest BY (9.7 t ha−1) in wheat plants was observed in the plots receiving SSP in conjunction with FYM as the fertilization strategy (Table 4), whereas the lowest (8.2 t ha−1) was attained from the TSP+CR treatment followed by the control plots with only 7.8 t ha−1.
The ANOVA showed a significant difference in grain yield (GY) of wheat (p ≤ 0.001, Table 4) for both sources of variation (IR, FS, and IR × PS). The fertilized plots produced the maximum grain yield (3.45 t ha−1) compared to the control (2.39 t ha−1). A higher grain yield (3.6 t ha−1) was recorded from plots under the fully irrigated regime compared to the limited irrigated plots (3.3 t ha−1). The wheat grain yield increased when SSP and FYM were applied together, and the application of 90 kg ha−1 of SSP reinforced with 10 t ha−1 FYM increased the grain yield by 30 and 40%, respectively, as compared with plots receiving the TSP + CR treatment and unfertilized plots, respectively. The interaction between IR × FS indicated that the application of SSP increased the grain yield of wheat under both irrigation regimes, whereas the increase was more observed in the fully irrigated regime than in the limited irrigated regime.
The data analysis revealed that irrigation regimes (IRs) and fertilization strategy (FS) had a significant influence on the harvest index; however, their interaction (IR × FS) was nonsignificant for the harvest index (Table 4). Fertilized plots had a higher harvest index (38.2) than the control (30.9%). Under the irrigated plots, the maximum harvest index (38.6%) was acquired as compared to the limited irrigated plots (37.7%). The application of SSP (at the rate of 90 kg ha−1) in combination with FYM (at the rate of 10 t ha−1) produced more HI (41.4%), while the lowest HI (34.2%) was attained from plots receiving the TSP+CR treatment followed by the control plots (30.9%).
The results of the MRPP analysis suggest that the FI and LI irrigation regime groups were characterized by different wheat plant characteristics with a high magnitude of differences (T = −6.64, Table 5). The MRPP method was employed here to compare differences in the defined groups, namely irrigation regimes and fertilization strategies; the results reveal that there was significance in all groups (p > 0.001) and that the effects of all the fertilization strategies used were significantly larger as compared to the control plots.
Table 5.
Test statistic from the multiresponse permutation procedure (MRPP) for multiple paired comparisons to evaluate the main effects of irrigation management and fertilization sources on wheat plant characteristics. p is the probability of significant differences among selected groups.
To enhance the discrimination power to group the measured traits based on the relationships among treatments under different irrigation regimes, as well as to classify the contributions of these traits, the mean values of all measured attributes for wheat and other fertilization management practices were subjected to a principal component analysis (PCA) and agglomerative hierarchical clustering (AHC). The principal component analysis (PCA) was computed on the experimental dataset including 13 measured traits, 2 irrigation regimes, and 10 fertilization strategies including the control. The results show that the first two components (PCs) with eigenvalues ≥1 accounted for 83.77% of the total variation (Figure 2). The first PC accounted for 72.19% of the total variation in the data and was significantly correlated with the most measured trails, i.e., D. anthesis, plant height, CGR, leaves per tiller, LAI, prod. tillers, grains per spike, 1000-GW, BY, GY, and HI. PC2 accounted for 11.57% of the total variation and was significantly correlated with only D. phys maturity (Table 6). Since the first two PCs showed the highest percentage of variance, they were used to create a PCA-based biplot. Based on the biplot, all measured traits were grouped into three clusters (CI, CII, and CIII): cluster I included: plant height, CGR, leaves per tiller, LAI, productive tillers, grains per spike, 1000-GW, BY, GY, and HI; cluster II was comprised of days to anthesis and phys maturity; cluster III consisted of emergence m−2 (Figure 3).
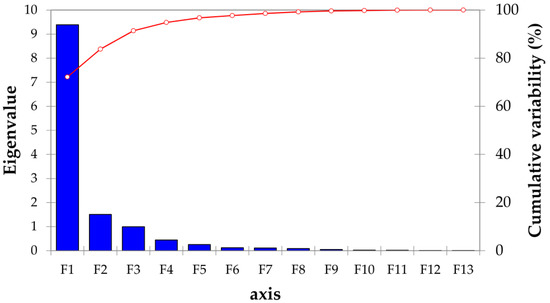
Figure 2.
Principal components, eigenvalues, and explained variances from principal component analysis (PCA). F1, F2, …, Fn denote number of principal components.
Table 6.
Summary of the principal component analysis of the measured trails (Squared cosines of the variables).
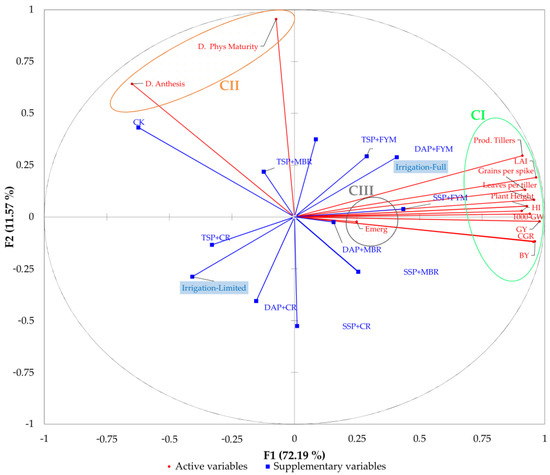
Figure 3.
Principal component analysis (PCA) plot of various growth, physiological, and yield traits in the 10 investigated treatments applied on wheat grown under different irrigation regimes. F1 and F2 are the first two components (PCs) with eigenvalues ≥1. FYM = farmyard manure; MBR = mung bean residue; CR = canola residue; TSP = triple super phosphate; SSP = single super phosphate; and DAP = di-ammonium phosphate. CGR = Crop Growth Rate; LAI = Leaf Area Index; 1000-GW = Thousand-Grain Weight; BY = Biological yield; GY = Grain Yield; HI = Harvest Index; Prod. Tillers = Productive Tillers; Emerg = Emergence −2; D. Anthesis = Days to Anthesis; D. Phys Maturity = Days to Maturity.
The dendrogram obtained from the agglomerative hierarchical clustering (AHC) showed that all investigated treatments and measured traits were grouped into different clusters (Figure 4). The AHC results were consistent with the PCA analysis, indicating that the treatment “SSP + FY” has a positive linkage with several traits, such emergence, plant height, CGR, leaves per tiller, LAI, fertile tillers, grains per spike, 1000-GW, biological yield, grain yield, and harvest index. For instance, the following treatments: SSP + FYM, TSP + FYM, DAP + FYM, and SSP + MBR showed a similar pattern for most of the traits, and hence they formed a distinct cluster (C1) (Figure 4). The remaining treatments fell into a distinct cluster; however, some of them were placed in a separate sub-cluster due to their similar linkages with some traits. The information obtained from the application of PCA and AHC allowed the identification of the most important fertilization strategy related to wheat yield. Plant height, fertile tillers, yield, and its related trails were associated with the SSP + FYM, DAP + FYM, and SSP + MBR treatments.
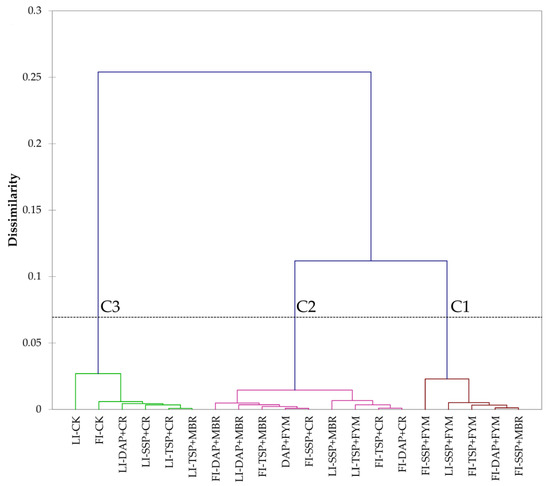
Figure 4.
Cluster analysis of 10 investigated treatments applied on wheat grown under different irrigation regimes. C1, C2, and C3 are clusters 1, 2, and 3, respectively. FI = full irrigation; LI = limited irrigation; FYM = farmyard manure; MBR = mung bean residue; CR = canola residue; TSP = triple super phosphate; SSP = single super phosphate; and DAP = di-ammonium phosphate.
3.3. Economics (Profitability)
Data presented in Table 7 reveal the variations in the cost of cultivation in each treatment, depending upon input costs. Under a trial conducted in Mardan (Pakistan) during winter 2019–2020 after supplementing inorganic phosphorus with organic supplements under restricted and assured irrigation regimes, the maximum gross income (USD 1487 ha−1), net returns (USD 1030 ha−1), and benefit–cost ratio (BCR) of 3.25 were observed in plots supplied with SSP+ FYM under the full irrigation regime. Although various fertilization strategies were used here, the limited irrigation regime resulted in less gross income (USD 1249 ha−1) and fewer net returns (USD 774 ha−1). The average BCR of the fertilized plots under FI was 2.72, which was higher compared with LI having a value of 2.64.
Table 7.
Economic study of wheat grown in Mardan (Pakistan) during winter 2019–2020 after supplementing inorganic phosphorus with organic supplements under restricted and assured irrigation regimes.
4. Discussion
The results show that there were no significant effects of the irrigation regime (IR), organic sources (OSs), and phosphorous sources (PSs) on the emergence (number of plants m−2) of wheat compared to the control (unfertilized wheat). It has been reported by several researchers that seed germination is not dependent on nutrient application [41]. This might be because wheat seeds did not depend on the externally provided nutrients and used their food storage [42].
The minimum days to anthesis were recorded in fertilized wheat as compared to the untreated plots. The earlier phenological development (anthesis) under fertilized wheat might be attributed to better root development, which enabled the plant to gain more P and several nutrients, encouraging healthier crop growth [43]. Another possible reason for early flowering might be the improved translocation of the nutrients to the aerial portions [44]. Fewer days to anthesis were recorded with the P source SSP than with TSP and DAP. P increased crop performance from emergence till anthesis and enhanced early flowering and pod formation [4]. The maximum days to anthesis were recorded with organic source-treated plots in the form of FYM and mung bean residues as compared to canola residues. The possible reason for the late anthesis with the organic manure application may be due to a high content of essential nutrients, particularly nitrogen, as compared to other organic sources, which lead to late flowering and maturity [45]. It was reported that the organic manure application delayed phenology (anthesis) [46]. The FYM used had the lowest C:N ratio (11) resulting in rapid decomposition and N mineralization. Plant residues with a high C:N ratio (say >30:1) are likely to decompose slowly with an initial net immobilization of N, whereas residues with a lower C:N ratio are likely to decompose more quickly with a net mineralization of N occurring right from the beginning. Delayed anthesis was noted in the fully irrigated regime (FI) as compared to the limited irrigated regime (LI) plots. For delayed flowering, a higher number of irrigations is required, which provide maximum time to fill grain, while less irrigation results in early flowering, as a result of which the crop does not cover the full vegetative stage and hence produces immature or unfilled grains and ultimately a reduced yield [47]. Likewise, it was reported earlier that an enhanced number of irrigations delayed days to flowering, while a water shortage resulted in hasty flowering [29].
Early maturity was recorded in the rest plots as compared to the control. The possible reason for early phenology (physiological maturity) under the treated plots might be due to the role of P in healthier root development and help the plant to achieve maximum P and other nutrients from organic manure for instant growth and development [6]. The published literature revealed that the combination of chemical fertilizers and organic manures enhanced yields and hastened the maturity period of the crops [1]. Among the P sources, SSP recorded fewer days to maturity than TSP and DAP. The probable reason for early physiological maturity with the P application might be due to an increase in root development, which helps the crop absorb more P for a quick completion of its life cycle [48]. The other possible reason for early physiological maturity is the use of P fertilizer that might be of help by monitoring some necessary enzyme reaction that involves hastening crop maturity [10]. P sources (SSP and DAP) resulted in early physiological maturity in maize compared with plots not treated with P [33]. In addition, P facilitates early flowering and eventually hastens crop maturity [4]. More days to maturity were noted with the organic source FYM as compared to the mung bean and canola residues. This might be due to the enhanced macro nutrients, mainly N, as well as micronutrients, which increase the vegetative growth of the crop, and hence the crop tends to have more days to mature than the nonfertilized plots [49]. The other reason for the postponement in several growth stages due to the FYM application might be the accessibility of nutrients during the growth stages that caused the postponement of maturity and improved growth time [50]. More days to maturity were recorded with the fully irrigated plots than with the limited irrigated plots. This may be because water availability eases nutrient uptake, mostly nitrogen, which is considered to be postponement in the physiological maturity of the harvest plant [35]. An increase in the number of irrigations resulted in delayed crop maturity [51].
The maximum plant height was recorded in the fertilized plots vs. the control plots. The higher plant height with both organic manure and inorganic P sources may be related to the timely availability of the nutrients, notably N from organic manures [52]. The other possible reason to boost plant height with the organic source (humic acid) application along with chemical fertilizer P might be to enhance the soil’s physical and chemical properties, providing enough nutrients to the plant, which may encourage the utmost vegetative growth [53]. The highest plant stature was recorded with the P sources SSP as compared to TSP and DAP. The increase in plant height might be due to the P application, which promotes root development and growth at the seedling stages [4]. Among organic sources, FYM recorded taller plants as compared to the mung bean and canola residues. Organic matter sources were extremely effective on plant height, which might be due to the fact that the sluggish decomposition of FYM eased the crop with utmost nutrients in successive stages [6]. Among different irrigation regimes, the highest plant height was recorded under the fully irrigated regime (FIR) plots as compared to the limited irrigated regime (LI). The increase in plant height under the irrigated plots might be due to the availability of sufficient crop nutrition resulting in better plant development; plant height is also the main contributor to straw yield and affects the grain yield and assists the vegetative growth [51]. The fertilized plots recorded a maximum crop growth rate as compared to the control plots. The possible reason for the increase in growth parameter (CGR, LAI) with the integrated usage of organic manure (OM) and inorganic P source might be due to increasing the availability of essential nutrients and their uptake resulting in enhanced plant growth, whereas P has a straight impact on leaf emergence, crop growth, and development [4]. The highest CGR was noted with the P source SSP compared to DAP and TSP. The most probable reason for the advanced growth parameters with an increased P rate might be the increased photosynthetic leaf rate and production of greater assimilates [33]. The published literature revealed that among phosphorous-treated plots, SSP and DAP showed better results on the CGR, LAI, and grain yield as compared to the other P fertilizer source (i.e., NP) and plots not treated with P [54]. The application of organic source FYM recorded a maximum CGR compared to DAP and TSP. This might be due to the fact that FYM not only enhanced the N availability but also provided micronutrients and developed the efficiency of P and K as outcomes of positive changes in crop growth and yield attributes [55]. A maximum CGR was recorded under the fully irrigated plots as compared to the limited irrigated plots. Previously, it has been reported that under the irrigated plots, the number of leaves, plant height, DM accumulation, CGR, and LAI at different intervals in sunflowers were increased [56]. The maximum number of leaves per tiller−1 was noted in the treated plots compared to the control plots. The possible reason for the increased number of leaves per plant−1 under the treated plots might be due to the fact that the organic manures helped to improve the soil condition, while chemical fertilizers assure rapid accessibility of essential nutrients and growth regulators, leading to enhanced cell expansion [57]. An increase in leaf count per plant may be due to the timely availability of nutrients from inorganic fertilizers and enhanced soil conditions with organic manures [6]. Numerous research reports indicated that the application of different combinations of farm yard manure and inorganic fertilizer enhanced the number of leaves per plant−1 [33,35]. The higher number of leaves per tiller−1 was observed with the P sources SSP as compared to DAP and TSP. The greater leaf count per tiller−1 with the P application might be due to an increase in several physiological processes and also an increase in respiration, cell division and enlargement [47]. Among the organic sources, FYM resulted in the maximum leaves per tiller−1 as compared to the mung bean and canola residues. The organic manure application improved microbial activities, plant nutrients, polysaccharides, and other organic compounds during decomposition, resulting in an increased crop leaf count [58]. The highest number of leaves per tiller−1 was noted with the fully irrigated regime (FI) plots as compared to the limited irrigation regime (LI) plots. The greater number of leaves per tiller−1 might be due to the suitable availability of water owing to enhanced vegetative growth as compared to the plots not watered [51]. It has been reported by numerous researchers that the number of leaves per plant−1 increases with an increase in irrigation levels [29,51,56].
The maximum mean leaf area was recorded with the fertilized plots as compared to the unfertilized plots. The higher leaf area may be due to the greater number of leaves per plant−1 and easy movement and the ability to obtain nutrients from natural and synthetic fertilizers. These available nutrients from both inorganic and organic manures may help in improving leaf area, which thereby causes more assimilation and dry matter accumulation [33], in addition to an enhanced mean leaf area of maize [35]. The highest mean leaf area was achieved with a phosphorous source in the form of SSP as compared with DAP and TSP. The increase in mean leaf area following P treatment might be attributed to P, which is essential for respiration, photosynthesis, energy storage, transfer, cell division, cell elongation, and a variety of other functions in plants [4]. The maximum mean leaf area was recorded with OS and FYM as compared with the mung bean and canola residues. This increase might be due to adequate water moisture, which helps in cell enlargement [59]. The other possible reason for the highest mean leaf area might be due to the fact that organic matter improved the soil structure, increased water and nutrient holding capacity and nitrogen mineralization bacteria and enhanced microbial activity, mineral supply and plant nutrients, thus resulting in increased growth [53]. Among the applications of OM sources, FYM recorded a maximum increase in leaf area as compared to the other organic sources. The maximum mean leaf area was recorded under the fully irrigated regime plots as compared to the limited irrigated regime. This might be attributed to enough water availability, which promotes cell elongation [51,59].
The maximum leaf area index was noted with the fertilized plots as compared to the unfertilized plots. The larger LAI with treated plots may be due to the enhanced leaf area, enhanced number of cellular constituents, mainly protoplasm, and also promotion of cell division, enlargement, differentiation, and multiplication [35]. Furthermore, the integrated use of chemical and organic fertilizers enhanced the growth and growth attributes of the maize crop [33]. The highest LAI was recorded with the P source SSP as compared to DAP and TSP. An increased leaf area index with the P treatment may be attributable to stimulated plant growth and increased tiller count and root development in the maize crop [33]. Among the OSs, FYM recorded a maximum LI compared to the mung bean and canola residues. The increase through the FYM application might be due to increased plant nutrient availability, improved water holding capacity as well as reduced nitrogen volatilization [13]. The highest mean leaf area was recorded under the fully irrigated plots as compared to the limited irrigated plots. The increase in the leaf area index with an adequate water supply be due to a higher tiller count (m−2) and leaf area per tiller [60]. The possible reason for greater LI might be due to the maximum availability of water that affects cell division and enlargement [51]. The maximum number of productive tillers (m−2) was noted in the fertilized plots as compared to the unfertilized plots. The increase in the number of fertile tillers (m−2) in response to the usage of chemical and organic manures may be due to the enriched nutrient availability for better growth and yield [1]. Among the P sources, SSP recorded the highest number of productive tillers (m−2) compared to TSP and DAP. This might be related to the role of P, which stimulates the formation of roots and growth at the seedling stage, assisting in the quick establishment of the seedling and subsequently increasing the number of tillers in cereal and encouraging the proportion of grains to straw [61]. OS in the form of FYM recorded the maximum productive tillers (m−2) as compared to the mung bean and canola residues. The increased number of fertile tillers with the FYM application might be due to the raised soil structure, organic matter (OM), and improved activities of microorganisms in the soil [13]. The experimental units of the fully irrigated regime recorded the highest number of productive tillers (m−2) compared to the limited irrigated regime plots. These higher numbers of productive tillers in the fully irrigated regime plots might be attributed to improved water accessibility during the tillering stage, resulting in increased availability and absorption of nutrients for growth and, as a result, higher yield components [60]. An adequate supply of water at various growth stages resulted in the highest number of productive tillers [51]. The interaction between OS×PS showed that the highest number of fertile tillers (m−2) was achieved with the application of the organic source, FYM and P sources, and SSP as compared to other P and organic sources.
There were fewer nonproductive (fertile) tillers (m−2) in the fertilized plots than in the control plots. It is possible that the increased number of fertile tillers is linked to the optimal accessibility of macro- and micronutrients during growth and development [33]; furthermore, the infertile tiller count was reduced by using combined organic and inorganic fertilizers [35]. The number of nonproductive tillers was also non significantly influenced by irrigation regimes, phosphorous sources, and organic sources.
The highest number of grains per spike−1 was observed in fertilized plots as compared to the unfertilized plots. Our results are in line with the published literature whereby a combination of organic and inorganic fertilizers enhanced the number of grains per spike [4,53]. The number of spikes was recorded at a maximum when phosphorous was applied from SSP rather than DAP and TSP. The increased number of grains per spike−1 might be attributed to the role of P, which promotes root system growth and increases water and nutrient acquisition, both of which readily translocate toward developing spikes [48]. The other possible reason might be that a suitable application of P enables the crop to produce hasty growth and to intercept more solar radiation and thus create a higher number of grains per spike−1 [4]. Among organic sources, FYM resulted in a maximum number of grains per spike−1 as compared to the mung bean and canola residues. This increase in grains per spike−1 with the incorporation of organic sources before sowing may be due to the enhanced major and minor nutrients and timely availability of nutrients to the crop and improved physical condition and productivity of the soil [53]. The findings are consistent with [53]; they reported that using organic manures increase yield components, such as grains per spike−1 and thousand-grain weight. The highest number of grains per spike−1 was recorded under the fully irrigated regimes as compared to the limited irrigated regimes. The increase might be due to the presence of enough moisture availability, which is critical to the photosynthetic surface area to produce assimilation that is finally required to generate seeds [51]. Irrigation applied at various growth stages enhanced the grains per spike−1 of rice [56].
A heavier thousand-grain weight was recorded with the treated plots than with the control plots. The united usage of inorganic and organic sources of plant nutrients greatly enhanced the yield by increasing the yield components, such as panicle number, thousand-grain weight, plant height, and diminished grain infertility, which have been positively connected with grain yield [13]. A combined application of inorganic fertilizer with FYM significantly enhanced the thousand-grain weight [1]. The maximum thousand-grain weight was recorded with the application of the P sources SSP as compared with DAP and TSP. It might be due to the beneficial impact of P on stimulating active plant growth and improving root growth and health, which in turn increases the absorption of nutrients and water from the soil and increases grain weight [48]. Our outcomes were supported by [10]; they reported that thousand- grain weight was enhanced with the P application. Among organic sources, FYM resulted in the maximum thousand-grain weight as compared with other organic sources. This might be due to the fact that cattle manure supplies direct available nutrients (i.e., N) to the plants and improves the soil’s physical properties [7]. The maximum thousand-grain weight was noted with the fully irrigated regime plots as compared to the limited irrigated regime plots. The possible reason for a heavier thousand-grain weight with FI might be due to the adequate accessibility of water and more transport of nutrients to the grains resulting in weightier seeds [60].
The treated plots produced more biological yield than the untreated ones. The combined usage of chemical and organic fertilizers ensured a maximum biological yield. This might be due to the better nutrient availability and its uptake, which leads to a higher biological yield [53]. These findings were confirmed by [1]; they reported that the application of organic manures, particularly poultry manure along with P fertilizers, significantly increased the biological yield in wheat. Among the P sources, SSP recorded a significant maximum biological yield as compared with the other phosphorous sources, TSP and DAP. The possible reason for the highest biological yield might be due to the positive effects of P on LI, which enhances photosynthesis and photoassimilate production [33]. The single super phosphate (SSP) performed better than other P sources (DAP, TSP, and NP) and produced the highest biological yield [43]. Among the organic sources, FYM resulted in the maximum biological yield as compared to other organic sources. Organic matter may have enhanced the water holding capacity and physical and chemical conditions of the soil by lowering the volatilization of N fertilizers into NH3 gas and long-term accessibility to plant nutrients, which leads to an increased crop development and yield [33]. In the fully irrigated regime (FI) plots, the maximum biological yield was recorded as compared to the limited irrigated regime (LI) plots. Increased irrigation numbers up to the optimal level enhanced the grain and biological yields [60]. The interaction between IR × PS stated that FI at all P sources produced a maximum biological yield as compared to the LI plots
The fertilized plots produced a higher grain yield (GY) than the control. The higher GY in the case of the rest plots was due to the increase in leaf area, CGR, and yield components as compared to the control plots. The higher GY in fertilized plots might also be due to better root development and translocation of assimilates to spike development [35]. Among P sources, SS P produced a higher yield than the TSP- and DAP-treated plots. The increase in GY with SSP might be due to more P availability, which boosted phenological development, CGR, and yield components [50]. The acidic nature of SSP may be responsible for the higher GY in SSP-treated plots. The highest GY was recorded with the incorporation of the organic source, FYM, as compared with other OS. This can be attributed to the lower C:N value (11) compared to MBR (16) and CR (65.5), which resulted in a faster decomposition of organic waste, releasing more nitrogen to the crop. A higher GY was attained under the FI plots than the LI ones. The increase in GY under FI was due to better water availability, which allowed the crop to intercept more photosynthetic radiation than under the LI plot [29]. Furthermore, additional GY from plots supplied with SSP + FYM resulted in higher net returns (USD 1030 ha−1) under full irrigation. This combination was proven to be more cost-effective than other treatments in terms of the benefit–cost ratio (BCR = 3.25). In general, irrigated conditions yielded higher gross and net returns, as well as a greater BCR ratio as compared to rainfed conditions, regardless of treatment, due to improved plant growth and development under an assured water supply [62,63].
The maximum harvest index (HI) was recorded under the rest plots compared to the control. The increased the HI in the treated plots might be due to the increased yield component and grain yield than in the control plots. The possible reason for the higher HI might be due to the balanced supply of nutrients in the form of a combination of organic and inorganic sources of P. The addition of 50% organic and 50% mineral fertilizers to the maize crop resulted in a higher harvest index (%) [64]. The highest HI was recorded with the P source SSP as compared with TSP and DAP. The application of P significantly enhanced economic yield, as the HI is positively associated with GY, and thus an increase in GY also increased the harvest index [10]; in addition, enhanced yield components and GY with phosphorous sources resulted in a boosted the HI in wheat [1]. The maximum HI was noted with the organic source FYM compared to the mung bean and canola residues. The increase in the HI with organic matter-treated plots might be due to the improvement in yield and yield components therefore increasing the harvest index. Various research reports indicate that the incorporation of organic manures greatly enhanced the grain yield, resulting in an increased HI over the control [6,35]. The maximum HI was observed in the FI plots as compared to the LR ones. The maximum HI with FI might be attributed to the maximum yielding components and GY. An appropriate water supply to the crop increased grain yield, which ultimately enhanced the HI [51,60].
5. Conclusions
Wheat under fertilized plots outperformed the controls regarding healthier growths, greater yields, and yield components. This study conferred the positive effects of the fertilizer–P combination with organic sources on wheat yield and its related parameters. When averaged across the organic sources, FYM performed better than legume and nonlegume residues. Better growth and higher productivity and profitability of wheat were obtained under the full irrigation regime than in the restricted irrigation plots. The combined application of SSP + FYM further improved crop growth and gave a maximum grain yield. Growers in the study area are advised to apply SSP at the rate of 90 kg P2O5 ha−1 along with 10 tons FYM ha−1 due to its high profitability (BCR = 3.25) compared to the other treatments. This fertilization strategy can be recommended for ensuring higher wheat productivity and profitability under calcareous soils in the arid and semiarid regions of the world.
Supplementary Materials
The following supporting information can be downloaded at: https://www.mdpi.com/article/10.3390/agriculture12111754/s1, Table S1: Average cost of wheat production per hectare.
Author Contributions
Conceptualization, I.K. and A.; methodology, I.K. and A.; software, I.K., A.J. and M.F.S.; validation, A.J., M.F.S. and A.M.; formal analysis, I.K., A.M. and A.J.; investigation, I.K.; resources, O.F., M.A. and A.Z.; data curation, A.J., E.R., M.R. and M.F.S.; writing-original draft preparation, I.K., M.F.S.,A.M., E.R., M.R. and A.J.; writing-review and editing, A.J., A.M., M.F.S., M.R. and E.R.; visualization, A.M. and A.J.; supervision, A.; project administration, A. All authors have read and agreed to the published version of the manuscript.
Funding
This study received no external funding.
Institutional Review Board Statement
Not applicable.
Data Availability Statement
Not applicable.
Acknowledgments
We are thankful to the Department of Agronomy, Faculty of Crop Production Sciences. The University of Agriculture. Peshawar (Pakistan) for assistance and technical support in this work.
Conflicts of Interest
The authors declare no conflict of interest.
References
- Jamal, A.; Younas, W.; Fawad, M. Performance of Wheat (Tricticum avestium L.) as Influenced by Application of Single Super Phosphate Alone and in Combination with Different Organic Fertilizers in Calcareous Soil of Swabi, Pakistan. Kahramanmaraş Sütçü İmam Üniv. Tarım Ve Doğa Derg. 2019, 22, 14–18. [Google Scholar] [CrossRef]
- Ministry of Finance. Pakistan Economic Survey 2019–2020. 2020. Available online: http://hdl.handle.net/123456789/17015 (accessed on 1 May 2022).
- NFDC. Balanced Fertilization through Phosphate Promotion. Project Terminal Report; National Fertilizer Development Center: Islamabad, Pakistan, 2001.
- Jamal, A.; Fawad, M. Effectiveness of Phosphorous Fertilizers in Wheat Crop Production in Pakistan. J. Hortic. Plant Res. 2019, 5, 25–29. [Google Scholar] [CrossRef]
- Mihoub, A.; Naeem, A.; Amin, A.E.-E.A.Z.; Jamal, A.; Saeed, M.F. Pigeon Manure Tea Improves Phosphorus Availability and Wheat Growth through Decreasing P Adsorption in a Calcareous Sandy Soil. Commun. Soil Sci. Plant Anal. 2022, 53, 2596–2607. [Google Scholar] [CrossRef]
- Jamal, A.; Fawad, M. Application of different organic manures in optimizing optimum yield for wheat in calcareous soil. World News Nat. Sci. 2018, 20, 23–30. [Google Scholar]
- Mihoub, A.; Amin, A.E.-E.A.Z.; Asif, N.; Bouhoun, M.D. Improvement in phosphorus nutrition of wheat plants grown in a calcareous sandy soil by incorporating chemical phosphorus fertilizer with some selected organic substances. Acta Agric. Slov. 2019, 113, 263–272. [Google Scholar] [CrossRef]
- Mehrvarz, S.; Chaichi, M.; Alikhani, H. Effect of phosphate solubilizing microorganisms and phosphorus chemical fertilizer on forage and grain quality of barely (Hordeum vulgare L.). Agric. Environ. Sci. 2008, 3, 822–828. [Google Scholar]
- Vance, C.P.; Uhde-Stone, C.; Allan, D.L. Phosphorus acquisition and use: Critical adaptations by plants for securing a nonrenewable resource. New Phytol. 2003, 157, 423–447. [Google Scholar] [CrossRef]
- Saeed, M.F.; Jamal, A.; Muhammad, D.; Shah, G.M.; Bakhat, H.F.; Ahmad, I.; Ali, S.; Ihsan, F.; Wang, J. Optimizing Phosphorus Levels in Wheat Grown in a Calcareous Soil with the Use of Adsorption Isotherm Models. J. Soil Sci. Plant Nutr. 2021, 21, 81–94. [Google Scholar] [CrossRef]
- Mihoub, A.; Boukhalfa, N. Performance of Different Phosphorus Fertilizer Types on Wheat Grown in Calcareous Sandy Soil of El-Menia, Southern Algeria. Asian J. Crop Sci. 2014, 6, 383–391. [Google Scholar] [CrossRef]
- Mihoub, A.; Amin, A.E.-E.A.Z.; Motaghian, H.R.; Saeed, M.F.; Naeem, A. Citric Acid (CA)–Modified Biochar Improved Available Phosphorus Concentration and Its Half-Life in a P-Fertilized Calcareous Sandy Soil. J. Soil Sci. Plant Nutr. 2021, 22, 465–474. [Google Scholar] [CrossRef]
- Jamal, A.; Muhammad, D.; Jamal, H. Application of adsorption isotherms in evaluating the influence of humic acid and farmyard manure on phosphorous adsorption and desorption capacity of calcareous soil. World Sci. News 2018, 107, 136–149. [Google Scholar]
- Ahmad, R.; Jilani, G.; Arshad, M.; Zahir, Z.A.; Khalid, A. Bio-conversion of organic wastes for their recycling in agriculture: An overview of perspectives and prospects. Ann. Microbiol. 2007, 57, 471–479. [Google Scholar] [CrossRef]
- Chaudhry, A.N.; Naeem, M.A.; Jilani, G.; Razzaq, A.; Zhang, D.M.; Azeem, M.; Ahmed, M. Influence of composting and poultry litter storage methods on mineralization and nutrient dynamics. J. Anim. Plant Sci. 2013, 23, 500–506. [Google Scholar]
- Harrison-Kirk, T.; Beare, M.; Meenken, E.; Condron, L. Soil organic matter and texture affect responses to dry/wet cycles: Effects on carbon dioxide and nitrous oxide emissions. Soil Biol. Biochem. 2013, 57, 43–55. [Google Scholar] [CrossRef]
- Johnston, A.E.; Poulton, P.R.; Coleman, K. Soil organic matter: Its importance in sustainable agriculture and carbon dioxide fluxes. Adv. Agron. 2009, 101, 1–57. [Google Scholar] [CrossRef]
- Sullivan, P. Overview of Cover Crops and Green Manures: Fundamentals of Sustainable Agriculture. 2003. Available online: https://attra.ncat.org/publication.html (accessed on 10 June 2022).
- Agbede, T.; Ojeniyi, S.; Adeyemo, A. Effect of poultry manure on soil physical and chemical properties, growth and grain yield of sorghum in southwest, Nigeria. Am. Eurasian J. Sustain. Agric. 2008, 2, 72–77. [Google Scholar]
- Reddy, D.D.; Rao, S.A.; Singh, M. Changes in P fractions and sorption in an Alfisol following crop residues application. J. Plant Nutr. Soil Sci. 2005, 168, 241–247. [Google Scholar] [CrossRef]
- Oswal, M. Soil water functional relationships of sandy soils and their modification. J. Indian Soc. Soil Sci. 1993, 41, 145–147. [Google Scholar]
- Walker, D.J.; Clemente, R.; Bernal, M. Contrasting effects of manure and compost on soil pH, heavy metal availability and growth of Chenopodium album L. in a soil contaminated by pyritic mine waste. Chemosphere 2004, 57, 215–224. [Google Scholar] [CrossRef]
- Amanullah, N.; Khan, S.-U.; Iqbal, A.; Fahad, S. Growth and Productivity Response of Hybrid Rice to Application of Animal Manures, Plant Residues and Phosphorus. Front. Plant Sci. 2016, 7, 1440. [Google Scholar] [CrossRef]
- Han, S.H.; An, J.Y.; Hwang, J.; Bin Kim, S.; Park, B.B. The effects of organic manure and chemical fertilizer on the growth and nutrient concentrations of yellow poplar (Liriodendron tulipifera Lin.) in a nursery system. For. Sci. Technol. 2016, 12, 137–143. [Google Scholar] [CrossRef]
- Qureshi, A.S.; McCornick, P.G.; Sarwar, A.; Sharma, B.R. Challenges and Prospects of Sustainable Groundwater Management in the Indus Basin, Pakistan. Water Resour. Manag. 2010, 24, 1551–1569. [Google Scholar] [CrossRef]
- Chang, S.; Chung, I.-M. Water Budget Analysis Considering Surface Water–Groundwater Interactions in the Exploitation of Seasonally Varying Agricultural Groundwater. Hydrology 2021, 8, 60. [Google Scholar] [CrossRef]
- BARI (Bangladesh Agricultural Research Institute). Annual Report for 2005; Bangladesh Agricultural Research Institute: Joydebpur/Gazipur, Bangladesh, 2006; pp. 22–23.
- Uddin, N.; Islam, M.; Baten, M. Heavy metal determination of brinjal cultivated in soil with wastes. Progress. Agric. 2017, 27, 453–465. [Google Scholar] [CrossRef]
- Liu, S.; Lin, X.; Wang, W.; Zhang, B.; Wang, D. Supplemental irrigation increases grain yield, water productivity, and nitrogen utilization efficiency by improving nitrogen nutrition status in winter wheat. Agric. Water Manag. 2022, 264, 107505. [Google Scholar] [CrossRef]
- Mardan Weather—North-West Frontier, PK. 2019–2020. pp. 1–13. Available online: https://www.worldweatheronline.com/mardan-weather-averages/north-west-frontier/pk.aspx (accessed on 1 July 2022).
- Jones, J. Laboratory Guide for Conducting Soil Tests and Plant Analysis; CRC Press: Boca Raton, FL, USA, 2001. [Google Scholar]
- da Silva, F.C. Manual de Análises Químicas de Solos, Plantas e Fertilizantes. 2009. Available online: http://www.infoteca.cnptia.embrapa.br/infoteca/handle/doc/330496 (accessed on 7 July 2022).
- Amanullah; Iqbal, A.; Khan, A.; Khalid, S.; Shah, A.; Parmar, B.; Muhammad, A. Integrated Management of Phosphorus, Organic Sources, and Beneficial Microbes Improve Dry Matter Partitioning of Maize. Commun. Soil Sci. Plant Anal. 2019, 50, 2544–2569. [Google Scholar] [CrossRef]
- Musa, U.T.; Usman, T. Leaf area determination for maize (Zea mays L.), okra (Abelmoschus esculentus L.) and cowpea (Vigna unguiculata L.) crops using linear measurements. J. Biol. Agric. Healthc. 2016, 6, 104–111. [Google Scholar]
- Amanullah, K.S. Phenology, growth and biomass yield response of maize (Zea mays L.) to integrated use of animal manures and phosphorus application with and without phosphate solubilizing bacteria. J. Microb. Biochem. Technol. 2015, 7, 439–444. [Google Scholar]
- Rehman, A.; Chandio, A.A.; Hussain, I.; Jingdong, L. Fertilizer consumption, water availability and credit distribution: Major factors affecting agricultural productivity in Pakistan. J. Saudi Soc. Agric. Sci. 2019, 18, 269–274. [Google Scholar] [CrossRef]
- Steel, R.G.; Torrie, J.H. Principles and Procedures of Statistics: A Biometrical Approach; McGraw-Hill: New York, NY, USA, 1980; Volume 2. [Google Scholar]
- McCune, B.; Grace, J. MRPP (Multi-response Permutation Procedures) and related techniques. In Analysis of Ecological Communities; MjM Software Design: Gleneden Beach, OR, USA, 2002; pp. 188–197. [Google Scholar]
- Cade, B.S.; Richard, J. User Manual for Blossom Statistical Software; U.S. Geological Survey: Reston, VA, USA, 2001. [CrossRef]
- Program, C.E.; Maize, I.; Center, W.I. From Agronomic Data to Farmer Recommendations: An Economics Training Manual; CIMMYT: Veracruz, Mexico, 1988. [Google Scholar]
- Manzoor; Shafi, M.; Sohail, A.; Ali, S.; Anwar, S.; Fahad, S. Fertilizer Management for Improving Water Use Efficiency in Winter Cereals in Semiarid Region of Northwest, Pakistan. Russ. Agric. Sci. 2019, 45, 550–560. [Google Scholar] [CrossRef]
- Saharan, V.; Kumaraswamy, R.V.; Choudhary, R.C.; Kumari, S.; Pal, A.; Raliya, R.; Biswas, P. Cu-Chitosan Nanoparticle Mediated Sustainable Approach to Enhance Seedling Growth in Maize by Mobilizing Reserved Food. J. Agric. Food Chem. 2016, 64, 6148–6155. [Google Scholar] [CrossRef] [PubMed]
- Ali, M.; Khan, I.; Ali, M.A.; Anjum, S.A.; Ashraf, U.; Waqas, M.A. Integration of organic sources with inorganic phosphorus increases hybrid maize performance and grain quality. Open Agric. 2019, 4, 354–360. [Google Scholar] [CrossRef]
- de Bang, T.C.; Husted, S.; Laursen, K.H.; Persson, D.P.; Schjoerring, J.K. The molecular–physiological functions of mineral macronutrients and their consequences for deficiency symptoms in plants. New Phytol. 2021, 229, 2446–2469. [Google Scholar] [CrossRef] [PubMed]
- Dinnes, D.L.; Karlen, D.L.; Jaynes, D.B.; Kaspar, T.C.; Hatfield, J.L.; Colvin, T.S.; Cambardella, C.A. Nitrogen Management Strategies to Reduce Nitrate Leaching in Tile-Drained Midwestern Soils. Agron. J. 2002, 94, 153–171. [Google Scholar] [CrossRef]
- Abdissa, T.; Chali, A.; Tolessa, K.; Tadese, F.; Awas, G. Yield and yield components of sweet potato as influenced by plant density: In Adami Tulu Jido Kombolcha district, Central Rift Valley of Ethiopia. Am. J. Exp. Agric. 2011, 1, 40. [Google Scholar] [CrossRef]
- Islam, S.; Haque, M.; Hasan, M.; Khan, A.; Shanta, U. Effect of different irrigation levels on the performance of wheat. Progress. Agric. 2018, 29, 99–106. [Google Scholar] [CrossRef][Green Version]
- Jan, M.F.; Ahmadzai, M.D.; Liaqat, W.; Ahmad, H.; Rehan, W. Effect of Poultry Manure and Phosphorous on Phenology, Yield and Yield Components of Wheat. Int. J. Curr. Microbiol. Appl. Sci. 2018, 7, 3751–3760. [Google Scholar] [CrossRef]
- Redda, A.; Abay, F. Agronomic performance of integrated use of organic and inorganic fertilizers on rice (Oryza sativa L.) in Tselemti District of North-Western Tigray, Ethiopia. J. Environ. Earth Sci. 2015, 5, 30–41. [Google Scholar]
- Ali, K.; Arif, M.; Shah, S.; Hussain, Z.; Ali, A.; Munir, S.; Sher, H. Effect of organic and inorganic nutrients sources on phenology and growth of wheat. Pak. J. Bot. 2015, 47, 2215–2222. [Google Scholar]
- Ballester, C.; Hornbuckle, J.; Brinkhoff, J.; Quayle, W.C. Effects of three frequencies of irrigation and nitrogen rates on lint yield, nitrogen use efficiency and fibre quality of cotton under furrow irrigation. Agric. Water Manag. 2021, 248, 106783. [Google Scholar] [CrossRef]
- Liaqat, W.; Jan, M.F.; Ahmadzai, M.D.; Ahmad, H. Response of maize to integrated use of organic and inorganic sources of phosphorous with biochar. J. Pharmacogn. Phytochem. 2018, 7, 917–922. [Google Scholar]
- Jamal, A.; Hussain, I.; Sarir, M.S.; Sharif, M.; Fawad, M. Investigating Combination and Individual Impact of Phosphorus and Humic Acid on Yield of Wheat and Some Soil Properties. Türk Tarım Ve Doğa Bilim. Derg. 2018, 5, 492–500. [Google Scholar] [CrossRef][Green Version]
- Khalil, S.; Hussain, Z.; Tariq, M.; Rahman, H. Impact of planting density and P-fertilizer source on the growth analysis of maize. Pak. J. Bot. 2010, 42, 2349–2357. [Google Scholar]
- Zhao, J.; Ni, T.; Li, J.; Lu, Q.; Fang, Z.; Huang, Q.; Zhang, R.; Li, R.; Shen, B.; Shen, Q. Effects of organic–inorganic compound fertilizer with reduced chemical fertilizer application on crop yields, soil biological activity and bacterial community structure in a rice–wheat cropping system. Appl. Soil Ecol. 2016, 99, 1–12. [Google Scholar] [CrossRef]
- Santiago-Arenas, R.; Soe, H.N.; Ullah, H.; Agarwal, A.; Datta, A. Optimum Sowing Date and Nitrogen Rate Ensure Sustainable Production of Wet Direct-Seeded Rice under Water-saving Irrigation Technique. J. Soil Sci. Plant Nutr. 2022, 22, 2805–2820. [Google Scholar] [CrossRef]
- Armin, W.; Ashraf-Uz-Zaman, K.; Zamil, S.S.; Rabin, M.H.; Bhadra, A.K.; Khatun, F. Combined effect of organic and inorganic fertilizers on the growth and yield of mung bean (Bari Mung 6). Int. J. Sci. Res. Publ. 2016, 6, 557–561. [Google Scholar]
- Adekiya, A.O.; Ejue, W.S.; Olayanju, A.; Dunsin, O.; Aboyeji, C.M.; Aremu, C.; Adegbite, K.; Akinpelu, O. Different organic manure sources and NPK fertilizer on soil chemical properties, growth, yield and quality of okra. Sci. Rep. 2020, 10, 16083. [Google Scholar] [CrossRef]
- Kanwal, T.; Maryam, H.; Ahmad, R.; Ahmad, S.; Ali, A.; Hussain, B.; Tasleem, M.W. Effect of irrigation regimes on growth and yield of wheat (Triticum aestivum L.); economic analysis. Int. Res. J. Adv. Sci. 2020, 1, 53–59. [Google Scholar]
- Jabeen, M.; Ahmed, S.R.; Ahmed, M. Enhancing water use efficiency and grain yield of wheat by optimizing irrigation supply in arid and semi-arid regions of Pakistan. Saudi J. Biol. Sci. 2022, 29, 878–885. [Google Scholar] [CrossRef]
- Brar, B. Build-up and utilization of phosphorus with continues fertilization in maize-wheat cropping sequence. Field Crops Res. 2021, 276, 108389. [Google Scholar] [CrossRef]
- Choudhary, A.; Thakur, R.; Kumar, N. Effect of integrated nutrient management on growth, development and biomass production in wheat (Triticum aestivum)-rice (Oryza sativa) crop sequence in north-western Himalayas. Himachal J. Agric. Res. 2006, 32, 6–14. [Google Scholar]
- Haq, I.U.; Khan, A.; Saeed, M.F.; Mihoub, A.; Jamal, A.; Fawad, M.; Zakir, A.; Manzoor, R.; Ali, A.; Khalid, M.S. Timing and Splitting of Nitrogen Compensated for the Loss in Grain Yield of Dual-Purpose Wheat Under Varied Cutting Heights. Gesunde Pflanz. 2022, 1–16. [Google Scholar] [CrossRef]
- Cheema, M.A.; Farhad, W.; Saleem, M.F.; Khan, H.Z.; Munir, A.; Wahid, M.A.; Farhad, W. Nitrogen management strategies for sustainable maize production. Crop Environ. 2010, 1, 49–52. [Google Scholar]


Publisher’s Note: MDPI stays neutral with regard to jurisdictional claims in published maps and institutional affiliations. |
© 2022 by the authors. Licensee MDPI, Basel, Switzerland. This article is an open access article distributed under the terms and conditions of the Creative Commons Attribution (CC BY) license (https://creativecommons.org/licenses/by/4.0/).