Article

Comparative Transcriptome Analysis Reveals the Key Genes Involved in Lipid Deposition in Pekin Ducks (Anas platyrhynchos domesticus)

1
Key Laboratory of Animal Genetics and Breeding and Molecular Design of Jiangsu Province, College of Animal Science and Technology, Yangzhou University, Yangzhou 225009, China
2
State Key Laboratory of Animal Nutrition/Key Laboratory of Animal (Poultry) Genetics Breeding and Reproduction, Ministry of Agriculture and Rural Affairs, Institute of Animal Sciences, Chinese Academy of Agricultural Sciences, Beijing 100193, China
*
Authors to whom correspondence should be addressed.
Agriculture 2022, 12(11), 1775; https://doi.org/10.3390/agriculture12111775
Submission received: 17 September 2022 / Revised: 16 October 2022 / Accepted: 23 October 2022 / Published: 26 October 2022
(This article belongs to the Special Issue Advances in Molecular Genetics in Domestic Animals)

Abstract

:
There are differences in lipid deposition in fatty-type (FT) and lean-type (LT) ducks. Fatty ducks have a higher rate of sebum and abdominal fat, lower meat yield and hepatic lipid contents than LT ducks. However, the underlying changes in gene expression profiles regarding the lipid deposition between FT and LT ducks have not yet been clarified. To identify the differentially expressed genes in the liver, sebum, and abdominal fat between both ducks, we identified the gene expression profiles in the liver, sebum, and abdominal fat derived from FT and LT ducks by comparing the multistage transcriptomes. Our results showed that there were 622, 1536, and 224 differentially expressed genes (DEGs) in the liver, sebum, and abdominal fat between the FT and LT ducks, respectively. KEGG enrichment showed that the DEGs related to lipid metabolism were enriched in the biosynthesis of unsaturated fatty acid, glycerolipid and fatty acid metabolism in the liver; and were enriched in the fatty acid metabolism, fatty acid biosynthesis, glycerolipid metabolism, linoleic acid metabolism, and the PPAR signaling pathway in the sebum. There was no pathway related to a lipid metabolism enriched in abdominal fat. A gene functional analysis showed that the DEGs involved in adipogenesis were found to be upregulated. In contrast, those involved in lipolysis were downregulated in the liver and serum of FT ducks. The DEGs showed that ATP-binding cassette sub-family G member 8 (ABCG8), fatty acid synthase (FASN), and phospholipid transfer protein (PLTP) were highly expressed in the liver of FT ducks, and acyl-CoA synthetase long-chain family member3 (ACSL3), ACSL5, ACSL6, 1-acyl-sn-glycerol-3-phosphate acyltransferase alpha (AGPAT1), AGPAT9, ELOVL fatty acid elongase 6 (ELVOL6), fatty acid desaturase 1 (FADS1), FADS2, monoacylglycerol O-acyltransferase 1 (MOGAT1), serine/threonine kinase 17a (STK17A), and serine/threonine kinase 39 (STK39) were highly expressed in the sebum of FT ducks. A weighted correlation network analysis (WGCNA) of the DEGs showed ABCG8, FADS2, ACSL5, and ELOVL6 positively correlated with hepatic fatty acid synthesis, and AGPAT1, STK17A, STK32A, FADS1, and ACSL3 positively correlated with lipid deposition in the sebum. In summary, ABCG8 might be the key gene for the reduced hepatic lipid deposition in FT Pekin ducks, and FADS2, ACSL5, ELOVL6, AGPAT1, STK17A, STK32A, FADS1, and ACSL3 were the key genes for lipid deposition in the sebum of FT Pekin ducks. Our results provide new insights into the transcriptome regulation in lipid deposition of Pekin ducks and will be helpful for duck breeding.

1. Introduction

Pekin ducks are a famous duck breed worldwide, which are well-received for their fast growth rate, high meat yield, and excellent reproductive performance. Approximately 70% of duck meat is produced in China in the world and is dominated by Pekin ducks. In addition, in order to meet different market demands, fatty-type (FT) Pekin ducks provide more sebum for roasted Pekin ducks, while lean-type (LT) Pekin ducks provide raw materials for boiled salted ducks [1]. There are significant differences in the meat yields and lipid storage between FT and LT ducks [2,3,4]. In a recent experiment, it was observed that at 35 days of age, FT ducks had higher abdominal fat and sebum rates, and the hepatic triglyceride content was lower in FT ducks than in LT ducks at the age of 35 days of age, while their body weights tended to be consistent [5]. These results clearly indicate that there is a different lipid deposition in both FT and LT ducks.
The lipid deposition in adipose is characterized by the increased adipocyte size that results from triglyceride (TG) storage. Chylomicrons, as the largest lipoprotein particle in plasma, together with very low-density lipoprotein (VLDL), affect TG deposition. Chylomicrons are assembled in the intestine, and VLDL is assembled in the liver, respectively, and then translocated into peripheral adipose tissue. The particles of chylomicrons and VLDL are too large to penetrate the endothelium of adipose tissue and must be hydrolyzed by lipoprotein lipase (LPL). The fatty acid released from TG by the LPL enzyme moves through the endothelial lining to the adipocytes. Fatty acids are esterified to TG by glycerol-3-phosphate acyltransferase (GPAT) after being taken by fat cells [6], 1-acylglycerol-3-phosphate O-acyltransferase (AGPAT) [7], monoacylglycerol O-acyltransferase (MOGAT) [8], and diacylglycerol O-acyltransferase 1 (DGAT) [9]. TG is mainly present as lipid droplets in adipose tissue and ensures function as well as environmental stability. TG is covered with specific proteins around it, such as perilipin [10] and alpha/beta-hydrolase domain-containing protein 5 (ABHD5) [11]. Obviously, lipid deposition is a complex process that involves many gene expressions.
Until now, the underlying regulatory mechanisms of how FT ducks acquire a lower hepatic lipid deposition in the liver and higher sebum and abdominal fat percentages are still unknown. Threonine can have different effects on gene expression in Pekin ducks with different genetic backgrounds [12]. It was hypothesized that the genes involved in the synthesis of fatty acid and triglyceride are upregulated in the liver, sebum, and abdominal fat in FT ducks. Therefore, the aim of this study was to scan the differentially expressed genes (DEGs) in the liver, sebum, and abdominal fat of FT and LT Pekin ducks and to prove the above hypothesis through the data obtained from the current study [12].

2. Materials and Methods

2.1. Animals and Data Source

The transcriptomic data came from a previous study [12]. Overall, FT and LT Pekin ducks (Anas platyrhynchos domesticus), from 1 to 14 days of age, were fed the same commercial diet, and subsequently, diets with different concentrations of threonine content (0.41, 0.56, and 0.71%) were given from 14 to 35 days of age [5], respectively. A previous study sequenced the gene expression profiles in the liver, sebum, and abdominal fat of FT- and LT-fed diets with 0.41 vs. 0.56% threonine by employing RNA-sequencing technology [12]. For the different treatment groups, eight replicate cages were set up, and eight Pekin ducks were housed in each replicate cage. Liver, abdominal fat, and sebum were obtained from FT and LT ducks at the age of 35 days, fed with diets of 0.56% Thr by sample collection, immediately frozen in liquid nitrogen, and then transferred to the laboratory for storage at −80 °C until RNA sequencing.

2.2. Transcriptome Sequencing

RNA-seq analyses were performed on the liver, abdominal fat, and sebum (n = 3), as previously described. RNA isolation, mRNA purification, library preparation, and Illumina sequencing were performed on the collected samples. In brief, RNA was extracted from FT- and LT-duck tissues fed the same diet using the RNAiso plus kit (Code No. 9109, TaKaRa, Dalian, China). The RNA concentrations were quantified using NanoDrop 2000 (Waltham, MA, USA), and the RNA sample integrity was assessed using the RNA Nano 6000 assay kit from Agilent 2100 Bioanalyzer (Agilent Technologies, California, USA). Ensure that all samples have an RNA integrity number (RIN) above 8.0 and send them to BerryGenomics (Beijing, China). Libraries were created using the mRNA-Seq Sample Preparation Kit (Cat.RS-930-1001, Illumina Inc., San Diego, CA, USA) following the manufacturer’s instructions, and subsequently, paired-end sequencing was performed in the Illumina X-Ten (Illumina, CA, USA) sequencing system. Finally, data were obtained from BerryGenomics for later analysis.

2.3. Transcriptome Data Validation by qPCR

A qPCR analysis was used to verify the accuracy and reproducibility of the RNA-seq gene expression data; cDNA synthesis was performed using the PrimerScript ™ RT Master Mix (Code No. RR036A, Takara, Dalian, China) reverse-transcription kit; gene quantification was completed in a qPCR fluorescence detection system (ABI Q3, Life Technologies, Shanghai, China) using the Power Green Master Mix (Code No.4367659, Life Technologies, NY, USA) according to the kit instructions. To conduct corrections for all the genes of interest, glyceraldehyde 3-phosphate dehydrogenase (GAPDH) was used as a reference gene [13]. All primers used to detect genes are listed in Table 1. Each sample was repeated three times, and the relative expression level of each gene was calculated by the 2△△CT method [14].

2.4. Alignment of High-Quality Reads to Reference

During the initial data filtering step, the data were filtered with FASTQC software (http://www.bioinformatics.bbsrc.ac.uk/projects/fastqc/, 8 January 2020); some reads were removed, including those containing sequencing adapters and low complexity. After obtaining the clean reads, their segments were mapped to the Anas platyrhynchos genome (IASCAAS_PekingDuck_PBH1.5) using STAR software [15], and the unmapped reads were remapped by HASIAT2 software [16]. The number of genes expressed was calculated by the HTSeq version 0.6.1 software (https://pypi.org/project/HTSeq/, 28 February 2014) [17], counting the number of mapped sequence reads per million (CPM) values.

2.5. Analysis of Difference Expression Genes

The DEGs from different tissues of FT and LT ducks were analyzed for differential expressions using the DESeq R package (Bioconductor software, 5 September 2012) [18]. Normalization was conducted using the “calcNormFactors()” function before comparing them among samples of different library sizes. The p-value was correlated using the Benjamini–Hochberg’s approach for controlling the false discovery rate (FDR). Genes with a |log2(fold-change)| ≥ 0.585 and FDR < 0.05 were defined as (DEGs). The heatmap was used to construct a heatmap cluster among samples according to the CPM of the DEGs, and the VennDiagram package was used to construct common and unique DEGs for all tissues.

2.6. Pathway Analysis of Kyoto Encyclopedia Genes and Genomes (KEGG)

The DEGs were transferred into its Fasta Protein Sequence, and the gene enrichment was performed with the Fasta Protein Sequence by “Gene-list Enrichment” in Kobas 3.0 (http://kobas.cbi.pku.edu.cn/, 22 December 2020) [19,20]. “Homo sapiens (human)”, “hypergeometric test/Fisher’s exact test”, and “Benjamini and Hochberg (1995)” were selected as the reference species, statistical method, and FDR correlation method, respectively.

2.7. Weight Gene Co-Expression Network Analysis

Weight gene co-expression network analysis (WGCNA) was applied to reveal the correlation patterns among the DEGs between the two lines of ducks. An associated network analysis was performed using the WGCNA software package (http:/www.r.project.org/ 13 February 2016) [21]. A total of 2198 DEGs were used for module constructions, and the power of β = 18 to ensure a scale-free network. A hierarchical clustering dendrogram was used to differentiate the gene modules with colors, and a heatmap and topological overlap matrix plot were used to visualize the module structure. The intramodular connectivity was calculated for each gene based on its correlation with the remaining genes in a given module. Finally, using the KOBAS database (https://dhttp:/kobas.cbi.pku.edu.cn/, 22 December 2020) combined to characterize highly correlated modules, we calculated significantly enriched pathways. A p < 0.05 is defined as significant enrichment.

3. Results

3.1. Clustering Analysis for DEGs among Samples

A total of 2198 DEGs were observed in liver, sebum, and abdominal fat according to |log2(fold-change)| ≥ 0.585 and FDR < 0.05. The clustering analysis of the DEGs clusters showed that the DEGs from the liver of FT and LT ducks were clustered into one category, and the DEGs from the abdominal fat of FT ducks and the sebum of FT and LT ducks were clustered into one category, respectively. However, the DEGs from the abdominal fat of LT ducks could not be clustered into one category (Figure 1a). The Venn diagram was applied to distinguish the common DEGs expressed in liver, sebum, and abdominal fat, and there were 485, 1371, and 162 unique DEGs in the liver, sebum, and abdominal fat, respectively (Figure 1b).

3.2. Transcriptome Data Validation by qPCR

To validate the RNA-Seq results’ accuracy, 20 lipid metabolism genes (n = 6) in three tissues were selected for the qPCR assays, and 16 of these detected genes had expression levels consistent with transcriptomic analysis. The exceptions were glycerol-3-phosphate acyltransferase (GPAM) in the liver, ELOVL fatty acid elongase 6 (ELOVL6) and acyl-CoA synthetase long-chain family member 3 (ACSL3) in the sebum, and APOBEC2 in the abdominal fat (Figure 2).

3.3. Differential Expression Genes KEGG Analysis in Liver between FT and LT Ducks

In the liver, there were 622 DEGs between the FT (n = 3) and LT ducks (n = 3), of which 396 upregulated genes and 226 downregulated genes were in the FT ducks, compared with the LT ducks (Figure 3A). The KEGG pathway enrichment of 461 FASTA protein sequences, derived from DEG translation, was performed using KOBAS. The DEGs were enriched in the pathways related to the biosynthesis of unsaturated fatty acid, fatty acid metabolism, glycerolipid metabolism, regulation of lipolysis in adipocytes, the hippo, PPAR, PI3K-Akt, mTOR, and Wnt signaling pathways, and amino acids metabolism (Figure 3B, p-value < 0.05). A gene functional analysis showed FT ducks upregulated the gene expressions of fatty acid synthase (FASN), stearoyl-CoA desaturase (SCD), phospholipid transfer protein (PLTP), fatty acid-binding protein 7 (FABP7), perilipin 1 (PLIN1), and ATP-binding cassette member 8 (ABCG8) in the liver (Table 2, Figure 3 and Figure 9).

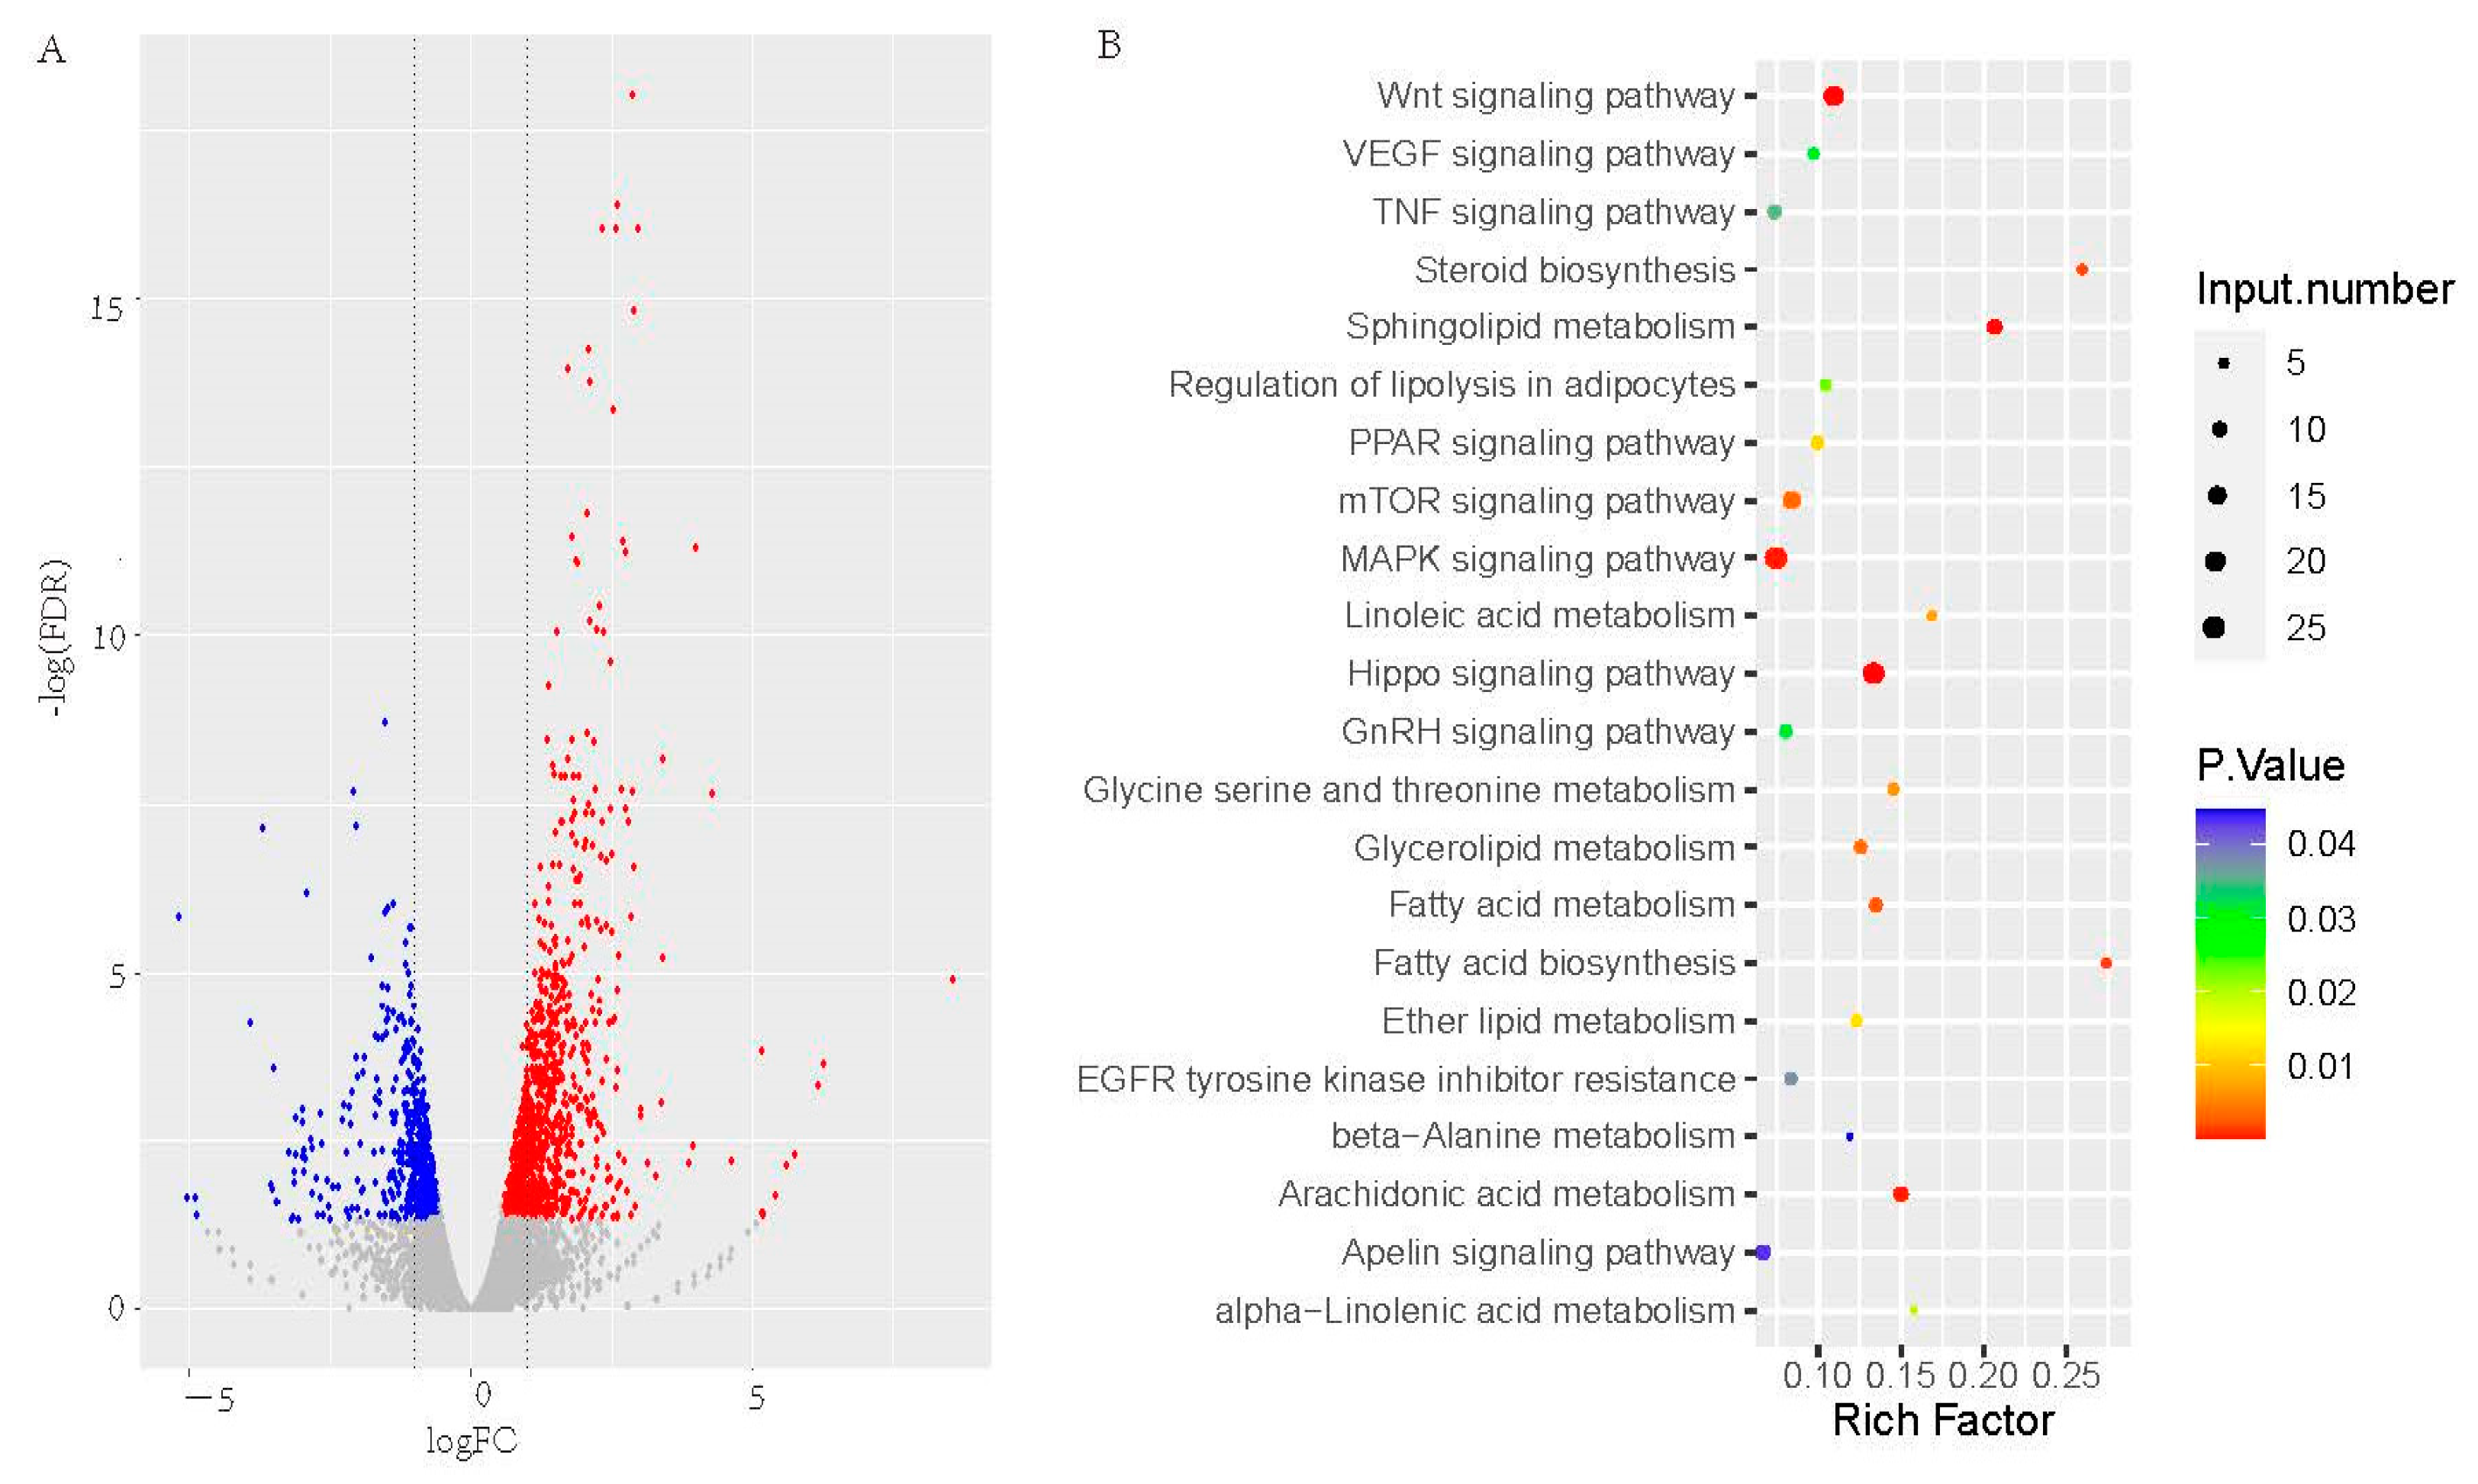
3.4. Differential Expression Genes and KEGG Analysis in Sebum between FT and LT Ducks

In the skin, there were 1536 DEGs between the FT (n = 3) and LT ducks (n = 2), of which 942 upregulated genes and 594 downregulated genes were in the FT ducks, compared with LT ducks (Figure 4A). The KEGG pathway enrichment of 1124 FASTA protein sequences, derived from DEG translation, was performed using KOBAS. The DEGs were enriched in the pathways related to the regulation of lipolysis in adipocytes, fatty acid biosynthesis, steroid biosynthesis, fatty acid metabolism, glycerolipid metabolism, alpha-linolenic acid metabolism, linolenic acid metabolism, arachidonic acid metabolism, amino acid metabolism, and the mTOR, GnRH, MAPK, Hippo, Wnt, and PPAR signaling pathways (Figure 4B, p-value < 0.05). A gene functional analysis indicated that FT ducks upregulated the genes expression of fatty acid desaturase 1 (FADS1), FADS6, ELOVL6, acyl-CoA synthetase long-chain family member 3 (ACSL3), ACSL5, ACSL6, lipase 2C (LIPG), phospholipase A2 group IVB (PLA2G4B), phospholipase A2 group IVF (PLA2G4F), diacylglycerol kinase beta (DGKB), 1-acyl-sn-glycerol-3-phosphate (AGPAT1), AGPAT9, GPAM, MOGAT1, and serine/threonine kinase 17a (STK17A), STK39, and downregulated acyl-CoA dehydrogenase family 2C member 10 (ACAD10), acetyl-CoA acyltransferase 2 (ACAA2), diacylglycerol O-acyltransferase 2 (DGAT2), PLIN1, and abhydrolase domain containing 5 (ABHD5) in the sebum (Table 3, Figure 4 and Figure 9).

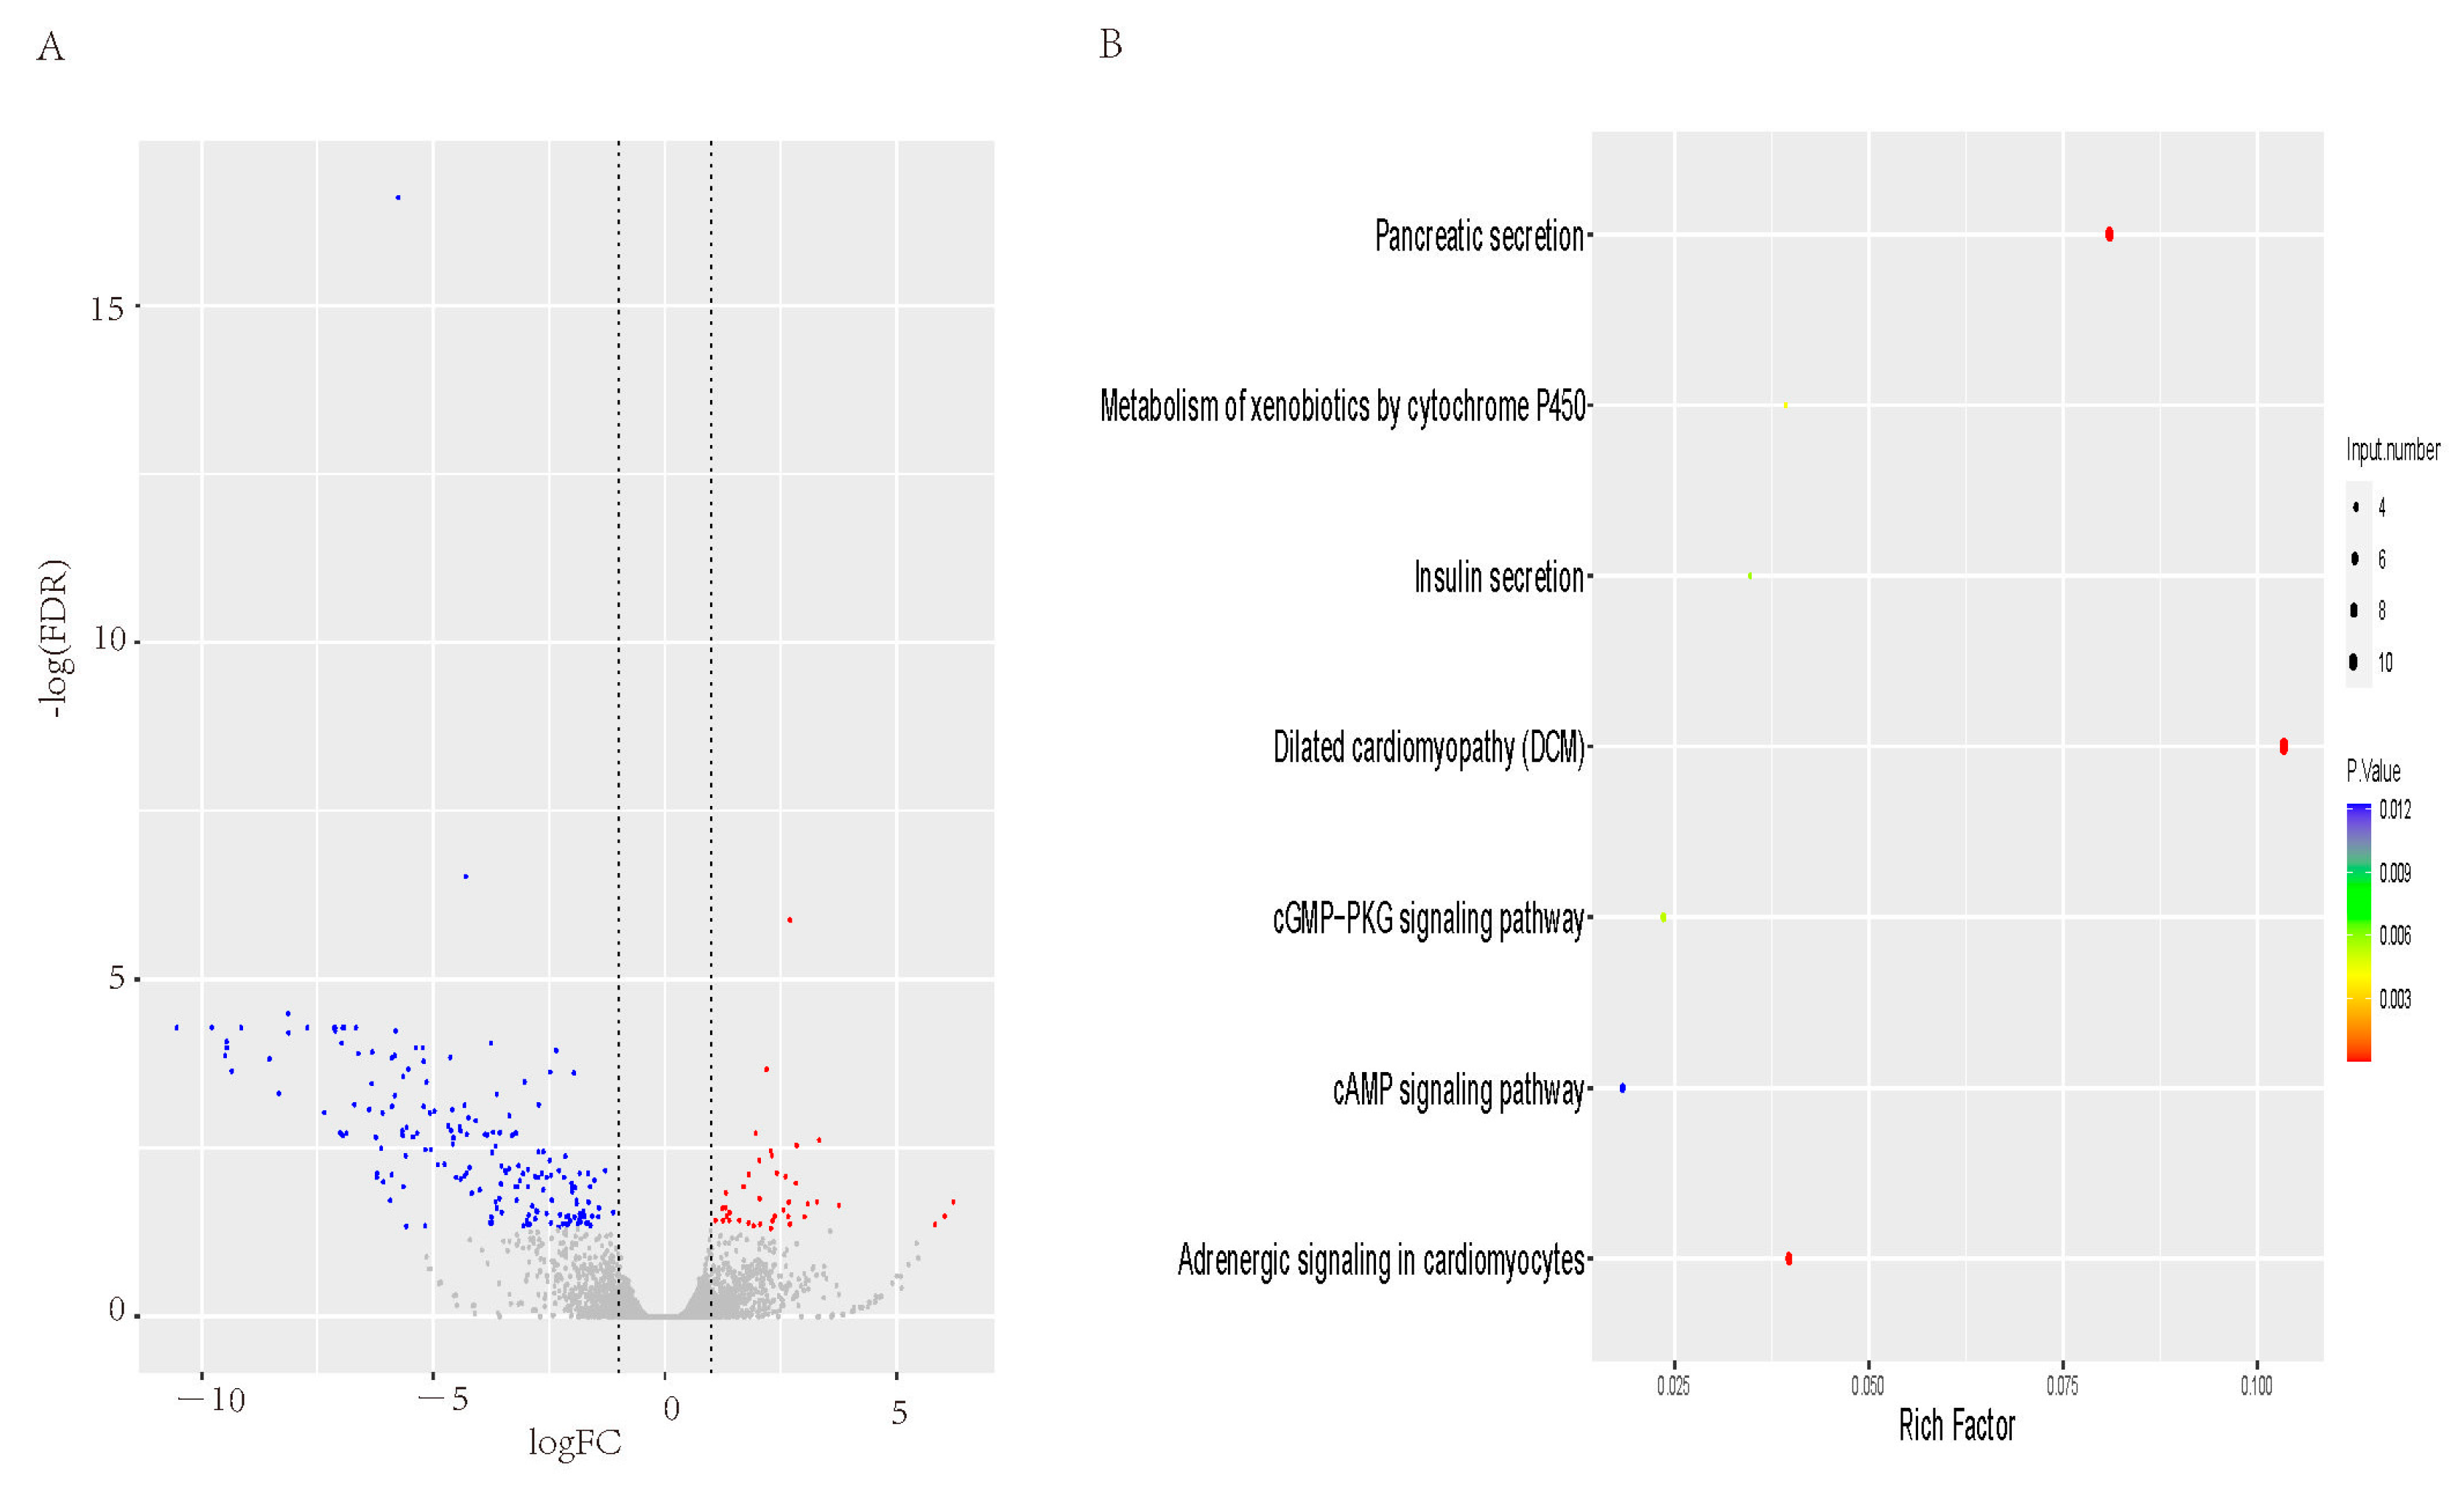
3.5. Differential Expression Genes and KEGG Analysis in Abdominal fat between FT and LT Ducks

In the abdominal fat, there were 224 DEGs between the FT (n = 3) and LT ducks (n = 2), of which 41 were upregulated genes and 183 were downregulated genes in the FT ducks, compared with LT ducks (Figure 5A). The KEGG pathway enrichment of 163 FASTA protein sequences, derived from DEG translation, was performed using KOBAS. The DEGs were enriched in the pathways to cGMP-PKG and the cAMP signaling pathway (Figure 5B, p-value < 0.05). The DEGs were not enriched in the pathway related to lipid metabolism. FT ducks upregulated the gene expression of ELOVL2 and downregulated the expression of phospholipase A2 group IB (PLA2G1B) in abdominal fat (Table 4, Figure 5 and Figure 9).

3.6. Co-Expression Network Analyzed by WGCNA between Fatty and LT Ducks

In this study, WGCNA was used to analyze the gene expression patterns in the liver, sebum, and abdominal fat of FT and LT ducks in multiple samples, to obtain highly correlated genes and co-expression networks. In conclusion, the hierarchical clustering dendrogram based on the 2198 DEGs identified seven co-expression modules (Figure 6a). A topological overlap matrix plot was applied to visualize the gene networks, and corresponding modules were obtained according to the degree of overlap (Figure 6b). Correlations between the gene co-expression modules were obtained according to the eigengene heatmap (Figure 6c), revealing correlations between the co-expression patterns and traits (Figure 6d). We found that the abdominal fat in FT ducks was positively associated with the blue module. The abdominal fat in LT ducks was positively associated with the blue, green, and brown modules. The liver of FT ducks was positively associated with the yellow and grey modules and negatively associated with the blue module. The liver of LT ducks was positively associated with the yellow modules and negatively associated with the blue and grey modules. The sebum of FT ducks was positively associated with the red and turquoise modules.
To clarify the expression patterns of each co-expression module in different groups, we performed the visualization of log10CPM values of genes belonging to the module, as well as the expression values of signature genes (Figure 7). It was observed that the eigengene in the yellow modules was highly expressed in the liver. The genes in the blue modules were highly expressed in abdominal fat and lowly expressed in the liver. The genes in the green and brown modules were highly expressed in the abdominal fat of LT ducks. The genes in the red and turquoise modules were highly expressed in the skin of FT ducks. The gene in the grey modules was highly expressed in FT ducks and lowly expressed in LT ducks.

3.7. Functional Annotation of Highly Correlated Module

Finally, the highly correlated modules with liver, abdominal fat, and skin are in the FT and LT ducks, respectively. The genes in green, yellow, and turquoise were enriched in the fatty acid metabolism pathway (Figure 8a). These data showed that the genes in the yellow, green, and turquoise modules might play an important role in the fat metabolism of the liver, abdominal fat, and skin, respectively, such as ABCG8, MTTP, DGAT2, apolipoprotein B, NADP-dependent malic enzyme 3, FABP7, FADS2, ACSL5, and ELOVL6 in the yellow module (Figure 8b); AGPAT1, phospholipase A2 group IVB (PLA2G4B), PLA2G4F, and Apolipoprotein A-I (APOA1) in the turquoise module (Figure 8C). Of which, ABCG8, FADS2, ACSL5, and ELOVL6 were the hub genes in the liver of FT ducks, and AGPAT1, PLA2G4B, PLA2G4F, STK17A, STK32A, FADS1, and ACSL3 were the hub genes in the sebum of FT ducks (Figure 9).

4. Discussion

Our hypothesis is that genes involved in the synthesis of fatty acid and triglyceride are upregulated in the liver, sebum, and abdominal fat of FT ducks. The results of the trial confirmed this view. The data suggest that the genes involved in lipid metabolism were upregulated in FT ducks, such as FABP7, FASN, SCD, GPD1, PLTP, PLIN1, and ABCG8 in the liver, and FADS1, FADS6, ELOVL6, ACSL3, ACSL5, ACSL6, AGPAT1, AGPAT9, GPAM, and MOGAT1 in sebum, and ELOVL2 in abdominal fat. A previous study showed that FT ducks had higher abdominal fat and sebum percentages and a lower hepatic triglyceride content in the liver than LT ducks [5]. The data from the present study indicated that the upregulated genes involved in lipid metabolism resulted in a higher percentage of abdominal fat and sebum in FT ducks. These findings provide a novel insight into understanding the different lipid depositions between FT and LT Pekin ducks.
Liver tissue is a key organ for de novo fat synthesis in poultry [22]. Due to different liver metabolic capacities, the fatty acid synthesis capacity of fatty chickens is 1.26 times higher than that of lean chickens [23]. As observed in the present study, the genes related to fatty acid synthesis (FABP7, FASN, SCD, GPD1), lipid transport (PLTP), lipid droplet formation (PLIN1), and cholesterol export (ABCG8) were upregulated in the liver of FT ducks. Previous studies have shown that FABPs play an important role in promoting the transport of fatty acids inside and outside the cell membrane [24], and in addition, the overexpression of FABP also improves fatty acid uptake and metabolic efficiency in vivo [25]. This is because the intracellular transport of fatty acids increases the access of fatty acids to the cytoplasmic enzymes responsible for fatty acid metabolism [26]. FABP protein expression was upregulated in FT ducks at the age of 42 days [2] and in fat broilers [27], and FT broilers had higher FABP mRNA levels were in than LT broilers [28]. FABP can also help to assemble and secrete VLDL [29]. Previous research found that FT ducks had higher plasma LDLC and lower hepatic triglyceride contents than LT ducks [5]. GPD1 catalyzes acetone dihydrogen phosphate (DHAP) and nicotinamide adenine dinucleotide to produce glycerol-3-phosphate (G3P) and nicotinamide adenine dinucleotide [30], which supplies substrates for fatty acid esterification in triglyceride synthesis. FASN is one of the two central enzymes of de novo lipogenesis, which catalyze to generate palmitate from acetyl-CoA and malonyl-CoA, derived from glucose or other carbon precursors [31]. Palmitate is further modified by endogenous elongase and desaturase enzymes to generate a variety of lipid species. SCD catalyzes a double bond insertion at the delta-9 position into palmitoyl-CoA and stearoyl-CoA to generate palmitoleic and/or oleic [32,33]. SCD mRNA levels were found to be higher in the FT broilers than that in LT broilers [34,35]. The WGCNA analysis showed that FABP and APOF were correlated with lipid metabolism in the liver of pigs [36]. The higher expression of these genes indicated that the hepatic fatty acids synthesis rate was higher in the FT ducks than LT ducks, which require further experiments to demonstrate.
The liver is one of the major sites for lipoprotein production and degradation. Hepatic generated-PLTP produces about 25% of the plasma PLTP activity [37]. PLTP can increase hepatic VLDL secretion by increasing hepatic apolipoprotein B -containing lipoprotein secretion [38,39], which transports the triacylglycerols and cholesterol esters from the liver into peripheral tissue. PLTP can also function to enlarge the HDL particles in plasma [40], which transports peripheral cholesterol into the liver, which is then secreted into the intestinal lumen. Previous studies have shown that overexpression of the heterodimeric transporter complex ABCG5/ABCG8 promotes biliary neutral sterol secretion and produces some inhibition of intestinal cholesterol absorption [41]. Further, we then screened for a gene-trait correlation; the hub genes of ABCG8, FADS2, and ELOVL6 showed a positive correlation with hepatic lipid metabolism. The previous study showed that the FT ducks had lower hepatic triglyceride and cholesterol contents compared with LT Pekin ducks [5]. Therefore, it was hypothesized that fatty acid and triglyceride synthesized in the liver are possibly transported into extrahepatic tissue for deposition.
In poultry, the major sources of triglyceride are chylomicrons and VLDL. Triglycerides in lipoprotein particles are hydrolyzed by lipoprotein lipase (LPL) to generate free fatty acids and diacylglycerol and are then taken up in the lumen of capillaries in the adipose tissue. Then, these fatty acids are transported into different cellular organelles or other enzymes for fatty acid metabolism [42]. Free fatty acids, taken up by adipocytes, are rapidly produced into acyl-CoA derivatives catalyzed by long-chain acyl-CoA synthetases (ACSL1, ACSL2, ACSL3, ACSL4, ACSL5, and ACSL6) [43] and also desaturated by fatty acid desaturase (FADS1, FADS2, and FADS6). These acyl-CoA derivatives are also elongated by the ELOVLs in the fatty acid elongation cycle [44] to generate long-chain fatty acids. ELOVL6 elongates fatty acids with 12, 14 and 16 carbons toward C16:0 acyl-CoA [45]. Polyunsaturated fatty acids are catalyzed to generate highly unsaturated fatty acids by enzymes encoded by FADSs [46,47,48]. ACSLs have been found to play an important role in the synthesis of triglycerides from fatty acids, and more triglyceride synthesis has been observed by overexpressing ACSLs [49,50]. The FT pigs upregulated FADS2 expression in subcutaneous ham fat [51,52], and FT broilers also upregulated the gene expressions of ACSL1, FADS2, FABP5, and FABP3 in abdominal fat [53,54,55], while they downregulated the gene expressions of ACACA and FABP4 in abdominal fat [54]. In the present study, the ACSL3, ACSL5, ACSL6, FABP4, FADS1, FADS6, LRP8 and LRP2BP were upregulated in the sebum of FT ducks, and the expressions of ACAA2, ACAD10, ACBD5, and LPL were downregulated in the sebum of FT ducks. The correlation analysis showed that ACSL3 and FADS1 showed a strong correlation with the fatty acid synthesis in sebum. A key low-density lipoprotein receptor, LRP8, has been demonstrated to regulate the uptake of lipid-rich extracellular lipoproteins [56] and supply cholesterol for bovine steroid biosynthesis [57]. As a peroxisomal protein, ACBD5 plays an important role in achieving efficient β-oxidation of very-long-chain fatty acids (VLCFA) [58]; ACBD5 deficiency causes VLCFAs-rich cells to accelerate phospholipid accumulation, which in turn allows individual plasma to exhibit high levels of VLCFA and decreases peroxisomal β-oxidation [59,60]. The enzymes encoded by ACAA2 and ACAD10 catalyze the beta-oxidation pathway in mitochondria and were lower expressed in the sebum of FT ducks. These results showed that a high expression of these genes may contribute to lipids deposition in sebum.
Once taken up by adipocytes, free fatty acids are esterified to triglyceride by lipid synthetases, such as GPAM, AGPAT1, AGPAT9, DGAT2, and MOGAT1. GPAM and AGPAT9 convert glycerol-3-phosphate to 1-acyl-sn-glycerol-3-phosphate [6,61], and AGPAT9 and AGPAT1 convert 1-acyl-sn-glycerol-3-phosphate and free fatty acid into 1,2-diacyl-sn-glycerol-3-phosphate [7,62], which could also be degraded by diacylglycerol kinase, such as DGKB and DGKI. MOGAT1 catalyzes the formation of diacylglycerol from 2-monoacylglycerol and fatty acyl-CoA. DGAT2 catalyzes the synthesis of triglyceride from diacylglycerol and fatty acyl-CoA as substrates [63], which is the committed step in triglyceride synthesis. FT broilers upregulated the gene expression of DGAT2 in the abdominal fat [54]. In the present study, triglyceride synthetase, such as GPAM, AGPAT1, AGPAT9, and MOGAT1, were upregulated in the sebum of FT ducks. In addition, AGPAT1 showed to be positively correlated to the sebum percentage, whereas the triglyceride and fatty acid degrading enzymes had no difference between the fatty and LT ducks. It is possible to explain the high sebum and abdominal fat percentage in FT ducks.
The storage of triglycerides in adipocytes is in the form of lipid droplets [64]. As a dynamic organelle, lipid droplets have been widely demonstrated to be involved in the management of cellular lipid storage and breakdown and play an important role in this process. Lipid droplets are centered in the neutral lipids and surrounded by monolayers of various proteins, as well as phospholipids [65]. The surface of the lipid droplets is covered by perilipin protein [10], which regulates the lipid homeostasis in cells [66]. Perilipin is the most highly phosphorylated protein in adipocytes, which plays an important regulatory role in hydrolyzing the triglycerides in lipid droplets [10], while dephosphorylated perilipin protein facilitates triglyceride storage. In a normal state, perilipin binds to ABHD5 and protects the lipid droplets from hydrolysis. Once the phosphorylation of perilipin occurs, ABHD5 dissociates from the ABHD5-perilipin complex and then interacts with adipose triacylglyceride lipase (patatin-like phospholipase domain-containing protein 3, PNPLA3) and activates lipid droplet degradation [67,68]. In addition, a member of the STK kinase superfamily, serine/threonine protein kinase (STK) 25, is also a lipid droplets-associated protein [69], which encapsulates the lipid droplets in hepatocytes to regulate the hepatic lipid synthesis and breakdown [70]. It has been found that the overexpression of STK25 in human and mouse livers promotes lipid deposition and decreases β-oxidation and very low-density lipoprotein (VLDL)-TAG secretion in the liver [71,72,73]. We found that the gene expressions of ABHD5, PNPLA3, PLIN1, and PLIN3 were lower, and the expressions of STK17A and STK39 were higher in the sebum of FT ducks than those in LT ducks. It was also observed that FT broilers had a higher PLIN1 mRNA level and lower PLIN2 mRNA level in abdominal fat than in LT broilers [54]. Other studies showed that PLIN2 expression was higher in FT broilers [51]. We speculated that the phosphorylation of the proteins of ABHD5, PNPLA3, PLIN1, and PLIN3 are lower than those in LT ducks, helping to maintain the homeostasis of the lipid droplets in sebum, and the expression of STK17A and STK32A showed a positive correlation with the sebum percentage. These results also showed how these genes play an important role in lipid storage, and STK17A, and STK32A may play a key role in lipid droplets for FT ducks.

5. Conclusions

The upregulated genes involved in lipid metabolism in FT ducks might result in higher lipid depositions in abdominal fat and sebum in Pekin ducks. Additionally, the highly expressed and hub genes of ABCG8, FADS2, ACSL5, ELOVL6, AGPAT1, STK17A, STK32A, FADS1, and ACSL3 are strong candidate genes, accounting for the different lipid deposition in Pekin ducks.

Author Contributions

Y.J. performed the formal analysis and writing—original draft; Z.Z. (Zhong Zhuang), W.J., M.X., Z.Z. (Zhengkui Zhou), J.T., H.B., G.C. (Guobin Chang), G.C. (Guohong Chen), and S.H. performed the writing—review and editing; Z.Z. (Zhengkui Zhou), J.T., H.B., and G.C. (Guobin Chang) wrote the original draft; H.B., and G.C. (Guobin Chang) performed the writing—review and editing; H.B. performed the visualization; G.C. (Guohong Chen) and S.H. had primary responsibility for the final content. All authors have read and agreed to the published version of the manuscript.

Funding

This work was supported by the National Natural Science Foundation of China (31902174), Natural Science Foundation of Jiangsu Province (BK20190902), and Natural Science Foundation of Jiangsu Higher Education Institutions of China (19KJD230003), Tackled key technologies in agriculture and rural areas of Jiangsu Science and Technology Plan (BE2022310).

Institutional Review Board Statement

The animal study protocol was approved by the Animal Management Committee (in charge of animal welfare issues) from the Institute of Animal Science, Chinese Academy of Agricultural Sciences (IAS-CAAS, Beijing, China) and performed in accordance with the guidelines. Ethical approval for animal survival was given by the Animal Ethics Committee of IAS-CAAS (IAS2020-114).

Conflicts of Interest

The authors declare there was no conflict of interest.

References

  1. Xu, T.; Gu, L.; Schachtschneider, K.; Liu, X.; Huang, W.; Xie, M.; Hou, S. Identification of differentially expressed genes in breast muscle and skin fat of postnatal Pekin duck. PLoS ONE 2014, 9, e107574. [Google Scholar] [CrossRef] [PubMed] [Green Version]
  2. Zheng, A.; Chang, W.; Hou, S.; Zhang, S.; Cai, H.; Chen, G.; Lou, R.; Liu, G. Unraveling molecular mechanistic differences in liver metabolism between lean and fat lines of Pekin duck (Anas platyrhynchos domestica): A proteomic study. J. Proteom. 2014, 98, 271–288. [Google Scholar] [CrossRef] [PubMed]
  3. Ding, S.R.; Li, G.S.; Chen, S.R.; Zhu, F.; Hao, J.P.; Yang, F.X.; Hou, Z.C. Comparison of carcass and meat quality traits between lean and fat Pekin ducks. Anim. Biosci. 2021, 34, 1193–1201. [Google Scholar] [CrossRef] [PubMed] [Green Version]
  4. Farhat, A.; Chavez, E. Metabolic studies on lean and fat Pekin ducks selected for breast muscle thickness measured by ultrasound scanning. Poult. Sci. 2001, 80, 585–591. [Google Scholar] [CrossRef]
  5. Jiang, Y.; Xie, M.; Tang, J.; Zhou, Z.; Zhang, Y.; Chen, G.; Hou, S. Effects of genetic selection and threonine on meat quality in Pekin ducks. Poult. Sci. 2020, 99, 2508–2518. [Google Scholar] [CrossRef]
  6. Chen, Y.Q.; Kuo, M.S.; Li, S.Y.; Bui, H.H.; Peake, D.A.; Sanders, P.E.; Thibodeaux, S.J.; Chu, S.; Qian, Y.-W.; Zhao, Y.; et al. AGPAT6 is a novel microsomal glycerol-3-phosphate acyltransferase. J. Biol. Chem. 2008, 283, 10048–10057. [Google Scholar] [CrossRef] [Green Version]
  7. Agarwal, A.K.; Sukumaran, S.; Cortés, V.A.; Tunison, K.; Mizrachi, D.; Sankella, S.; Gerard, R.D.; Horton, J.D.; Garg, A. Human 1-acylglycerol-3-phosphate O-acyltransferase isoforms 1 and 2: Biochemical characterization and inability to rescue hepatic steatosis in Agpat2(-/-) gene lipodystrophic mice. J. Biol. Chem. 2011, 286, 37676–37691. [Google Scholar] [CrossRef] [Green Version]
  8. Yen, C.L.; Farese, R.V., Jr. MGAT2, a monoacylglycerol acyltransferase expressed in the small intestine. J. Biol. Chem. 2003, 278, 18532–18537. [Google Scholar] [CrossRef] [Green Version]
  9. Wang, L.; Qian, H.; Nian, Y.; Han, Y.; Ren, Z.; Zhang, H.; Hu, L.; Prasad, B.V.V.; Laganowsky, A.; Yan, N.; et al. Structure and mechanism of human diacylglycerol O-acyltransferase 1. Nature 2020, 581, 329–332. [Google Scholar] [CrossRef]
  10. Brasaemle, D.L.; Subramanian, V.; Garcia, A.; Marcinkiewicz, A.; Rothenberg, A. Perilipin A and the control of triacylglycerol metabolism. Mol. Cell Biochem. 2009, 326, 15–21. [Google Scholar] [CrossRef]
  11. Zechner, R.; Kienesberger, P.C.; Haemmerle, G.; Zimmermann, R.; Lass, A. Adipose triglyceride lipase and the lipolytic catabolism of cellular fat stores. J. Lipid Res. 2009, 50, 3–21. [Google Scholar] [CrossRef] [PubMed] [Green Version]
  12. Jiang, Y.; Ming, X.I.E.; Zhou, Z.K.; Jing, T.A.N.G.; Chang, G.B.; Chen, G.H.; Hou, S.S. Dietary threonine deficiency affects expression of genes involved in lipid metabolism in adipose tissues of Pekin ducks in a genotype-dependent manner. J. Integr. Agric. 2022, 21, 2691–2699. [Google Scholar] [CrossRef]
  13. Vandesompele, J.; De Preter, K.; Pattyn, F.; Poppe, B.; Van Roy, N.; De Paepe, A.; Speleman, F. Accurate normalization of real-time quantitative RT-PCR data by geometric averaging of multiple internal control genes. Genome Biol. 2002, 3, 34. [Google Scholar] [CrossRef] [PubMed] [Green Version]
  14. Livak, K.J.; Schmittgen, T.D. Analysis of relative gene expression data using real-time quantitative PCR and the 2(-Delta Delta C(T)) Method. Methods 2001, 25, 402–408. [Google Scholar] [CrossRef]
  15. Dobin, A.; Davis, C.A.; Schlesinger, F.; Drenkow, J.; Zaleski, C.; Jha, S.; Batut, P.; Chaisson, M.; Gingeras, T.R. STAR: Ultrafast universal RNA-seq aligner. Bioinformatics 2013, 29, 15–21. [Google Scholar] [CrossRef]
  16. Kim, D.; Langmead, B.; Salzberg, S.L. HISAT: A fast spliced aligner with low memory requirements. Nat. Methods 2015, 12, 357–360. [Google Scholar] [CrossRef] [Green Version]
  17. Anders, S.; Pyl, P.T.; Huber, W. HTSeq-a Python framework to work with high-throughput sequencing data. Bioinformatics 2015, 31, 166–169. [Google Scholar] [CrossRef] [Green Version]
  18. Robinson, M.D.; McCarthy, D.J.; Smyth, G.K. edgeR: A Bioconductor package for differential expression analysis of digital gene expression data. Bioinformatics 2010, 26, 139–140. [Google Scholar] [CrossRef] [Green Version]
  19. Xie, C.; Mao, X.; Huang, J.; Ding, Y.; Wu, J.; Dong, S.; Kong, L.; Gao, G.; Li, C.Y.; Wei, L. KOBAS 2.0: A web server for annotation and identification of enriched pathways and diseases. Nucleic Acids Res. 2011, 39, 316–322. [Google Scholar] [CrossRef] [Green Version]
  20. Wu, J.; Mao, X.; Tao, C.; Luo, J.; Wei, L. KOBAS server: A web-based platform for automated annotation and pathway identification. Nucleic Acids Res. 2006, 34, W720–W724. [Google Scholar] [CrossRef] [Green Version]
  21. Langfelder, P.; Horvath, S. WGCNA: An R package for weighted correlation network analysis. BMC Bioinform. 2008, 9, 559. [Google Scholar] [CrossRef] [PubMed] [Green Version]
  22. Saadoun, A.; Leclercq, B. In vivo lipogenesis in genetically fat and lean chickens of various ages. Comp. Biochem. Physiol. B 1986, 83, 607–611. [Google Scholar] [CrossRef]
  23. Saadoun, A.; Leclercq, B. Comparison of in vivo fatty acid synthesis of the genetically lean and fat chickens. Comp. Biochem. Physiol. B Comp. Biochem. 1983, 75, 641–644. [Google Scholar] [CrossRef]
  24. Weisiger, R. Cytosolic fatty acid binding proteins catalyze two distinct steps in intracellular transport of their ligands. Mol. Cell. Biochem. 2002, 239, 35–43. [Google Scholar] [CrossRef] [PubMed]
  25. Murphy, E.J.; Prows, D.R.; Jefferson, J.R.; Schroeder, F. Liver fatty acid-binding protein expression in transfected fibroblasts stimulates fatty acid uptake and metabolism. Biochim. Biophys. Acta 1996, 1301, 191–198. [Google Scholar] [CrossRef]
  26. Luxon, B.A. Inhibition of binding to fatty acid binding protein reduces the intracellular transport of fatty acids. Am. J. Physiol. Gastrointest. Liver Physiol. 1996, 271, G113–G120. [Google Scholar] [CrossRef]
  27. Wu, C.; Chen, C.; Liu, Y.; Li, H.; Cheng, B. Proteomic analysis of liver tissue between fat and lean broiler lines. Br. Poult. Sci. 2021, 62, 211–218. [Google Scholar] [CrossRef]
  28. Wang, H.; Wang, Q.; Zhang, X.; Gu, X.; Wang, N.; Wu, S.; Li, H. Microarray analysis of genes differentially expressed in the liver of lean and fat chickens. Anim. Int. J. Anim. Biosci. 2010, 4, 513–522. [Google Scholar] [CrossRef] [Green Version]
  29. Spann, N.; Kang, S.; Li, A.; Chen, A.; Newberry, E.; Davidson, N.; Hui, S.; Davis, R. Coordinate transcriptional repression of liver fatty acid-binding protein and microsomal triglyceride transfer protein blocks hepatic very low density lipoprotein secretion without hepatosteatosis. J. Biol. Chem. 2006, 281, 33066–33077. [Google Scholar] [CrossRef] [Green Version]
  30. Swierczynski, J.; Zabrocka, L.; Goyke, E.; Raczynska, S.; Adamonis, W.; Sledzinski, Z. Enhanced glycerol 3-phosphate dehydrogenase activity in adipose tissue of obese humans. Mol. Cell. Biochem. 2003, 254, 55–59. [Google Scholar] [CrossRef]
  31. Clarke, S.D.; Nakamura, M.T. Fatty Acid Synthesis and its Regulation. Encycl. Biol. Chem. 2004, 52, 99–103. [Google Scholar]
  32. Wang, J.; Yu, L.; Schmidt, R.; Su, C.; Huang, X.; Gould, K.; Cao, G. Characterization of HSCD5, a novel human stearoyl-CoA desaturase unique to primates. Biochem. Biophys. Res. Commun. 2005, 332, 735–742. [Google Scholar] [CrossRef] [PubMed]
  33. Goren, M.; Fox, B. Wheat germ cell-free translation, purification, and assembly of a functional human stearoyl-CoA desaturase complex. Protein Expr. Purif 2008, 62, 171–178. [Google Scholar] [CrossRef] [PubMed] [Green Version]
  34. Daval, S.; Lagarrigue, S.; Douaire, M. Messenger RNA levels and transcription rates of hepatic lipogenesis genes in genetically lean and fat chickens. Genet. Sel. Evol. GSE 2000, 32, 521–531. [Google Scholar] [CrossRef] [PubMed] [Green Version]
  35. Bourneuf, E.; Hérault, F.; Chicault, C.; Carré, W.; Assaf, S.; Monnier, A.; Mottier, S.; Lagarrigue, S.; Douaire, M.; Mosser, J.; et al. Microarray analysis of differential gene expression in the liver of lean and fat chickens. Gene 2006, 372, 162–170. [Google Scholar] [CrossRef]
  36. Xing, K.; Liu, H.; Zhang, F.; Liu, Y.; Wang, C. Identification of Key Genes Affecting Porcine Fat Deposition Based on Co-Expression Network Analysis of Weighted Genes. J. Anim. Sci. Biotechnol. 2021, 12, 1–16. [Google Scholar] [CrossRef]
  37. Yazdanyar, A.; Jiang, X.C. Liver phospholipid transfer protein (PLTP) expression with a PLTP-null background promotes very low-density lipoprotein production in mice. Hepatology 2012, 56, 576–584. [Google Scholar] [CrossRef] [Green Version]
  38. Lie, J.; Crom, R.D.; Gent, T.V.; Haperen, R.V.; Tol, A.V. Elevation of plasma phospholipid transfer protein in transgenic mice increases VLDL secretion. J. Lipid Res. 2002, 43, 1875–1880. [Google Scholar] [CrossRef] [Green Version]
  39. Yazdanyar, A.; Quan, W.; Jin, W.; Jiang, X. Liver-specific phospholipid transfer protein deficiency reduces high-density lipoprotein and non-high-density lipoprotein production in mice. Arterioscler. Thromb. Vasc. Biol. 2013, 33, 2058–2064. [Google Scholar] [CrossRef] [Green Version]
  40. Jauhiainen, M.; Metso, J.; Pahlman, R.; Blomqvist, S.; Ehnholm, C. Human plasma phospholipid transfer protein causes high density lipoprotein conversion. J. Biol. Chem. 1993, 268, 4032–4036. [Google Scholar] [CrossRef]
  41. Yu, L.; Li-Hawkins, J.; Hammer, R.E.; Berge, K.E.; Horton, J.D.; Cohen, J.C.; Hobbs, H.H. Overexpression of ABCG5 and ABCG8 promotes biliary cholesterol secretion and reduces fractional absorption of dietary cholesterol. J. Clin. Investig. 2002, 110, 671–680. [Google Scholar] [CrossRef] [PubMed]
  42. Santis, M.; Hammamieh, R.; Das, R.; Jett, M. Adipocyte-fatty acid binding protein induces apoptosis in DU145 prostate cancer cells. J. Exp. Ther. Oncol. 2004, 4, 91–100. [Google Scholar] [PubMed]
  43. Mashek, D.; Bornfeldt, K.; Coleman, R.; Berger, J.; Bernlohr, D.; Black, P.; DiRusso, C.; Farber, S.; Guo, W.; Hashimoto, N.; et al. Revised nomenclature for the mammalian long-chain acyl-CoA synthetase gene family. J. Lipid Res. 2004, 45, 1958–1961. [Google Scholar] [CrossRef] [PubMed] [Green Version]
  44. Castro, L.; Tocher, D.; Monroig, O. Long-chain polyunsaturated fatty acid biosynthesis in chordates: Insights into the evolution of Fads and Elovl gene repertoire. Prog. Lipid Res. 2016, 62, 25–40. [Google Scholar] [CrossRef]
  45. Naganuma, T.; Kihara, A. Two modes of regulation of the fatty acid elongase ELOVL6 by the 3-ketoacyl-CoA reductase KAR in the fatty acid elongation cycle. PLoS ONE 2014, 9, e101823. [Google Scholar] [CrossRef] [Green Version]
  46. Cui, J.; Chen, H.; Tang, X.; Zhao, J.; Zhang, H.; Chen, Y.; Chen, W. Δ6 fatty acid desaturases in polyunsaturated fatty acid biosynthesis: Insights into the evolution, function with substrate specificities and biotechnological use. Appl. Microbiol. Biotechnol. 2020, 104, 9947–9963. [Google Scholar] [CrossRef]
  47. Ge, L.; Gordon, J.S.; Hsuan, C.; Stenn, K.; Prouty, S.M. Identification of the delta-6 desaturase of human sebaceous glands: Expression and enzyme activity. J. Investig. Dermatol. 2003, 120, 707–714. [Google Scholar] [CrossRef]
  48. Leonard, A.E.; Kelder, B.; Bobik, E.G.; Chuang, L.T.; Parker-Barnes, J.M.; Thurmond, J.M.; Kroeger, P.E.; Kopchick, J.J.; Huang, Y.S.; Mukerji, P. cDNA cloning and characterization of human Delta5-desaturase involved in the biosynthesis of arachidonic acid. Biochem. J. 2000, 347 Pt 3, 719–724. [Google Scholar] [CrossRef]
  49. Ellis, J.M.; Li, L.O.; Wu, P.C.; Koves, T.R.; Ilkayeva, O.; Stevens, R.D.; Watkins, S.M.; Muoio, D.M.; Coleman, R.A. Adipose acyl-CoA synthetase-1 directs fatty acids toward beta-oxidation and is required for cold thermogenesis. Cell Metab. 2010, 12, 53–64. [Google Scholar] [CrossRef] [Green Version]
  50. Li, L.O.; Mashek, D.G.; An, J.; Doughman, S.D.; Newgard, C.B.; Coleman, R.A. Overexpression of Rat Long Chain Acyl-CoA Synthetase 1 Alters Fatty Acid Metabolism in Rat Primary Hepatocytes. J. Biol. Chem. 2006, 281, 37246–37255. [Google Scholar] [CrossRef] [Green Version]
  51. Benítez, R.; Trakooljul, N.; Núñez, Y.; Isabel, B.; Murani, E.; De Mercado, E.; Gómez-Izquierdo, E.; García-Casco, J.; López-Bote, C.; Wimmers, K.; et al. Breed, Diet, and Interaction Effects on Adipose Tissue Transcriptome in Iberian and Duroc Pigs Fed Different Energy Sources. Genes 2019, 10, 589. [Google Scholar] [CrossRef] [PubMed]
  52. Resnyk, C.W.; Carré, W.; Wang, X.; Porter, T.E.; Cogburn, L.A. Transcriptional analysis of abdominal fat in genetically fat and lean chickens reveals adipokines, lipogenic genes and a link between hemostasis and leanness. BMC Genom. 2013, 14, 557. [Google Scholar] [CrossRef] [PubMed] [Green Version]
  53. Cheng, B.; Leng, L.; Li, Z.; Wang, W.; Jing, Y.; Li, Y.; Wang, N.; Li, H.; Wang, S. Profiling of RNA -Methyladenosine Methylation Reveals the Critical Role of mA in Chicken Adipose Deposition. Front. Cell Dev. Biol. 2021, 9, 590468. [Google Scholar] [CrossRef] [PubMed]
  54. Resnyk, C.; Chen, C.; Huang, H.; Wu, C.; Simon, J.; Le Bihan-Duval, E.; Duclos, M.; Cogburn, L. RNA-Seq Analysis of Abdominal Fat in Genetically Fat and Lean Chickens Highlights a Divergence in Expression of Genes Controlling Adiposity, Hemostasis, and Lipid Metabolism. PLoS ONE 2015, 10, e0139549. [Google Scholar]
  55. Ghafouri, F.; Bahrami, A.; Sadeghi, M.; Miraei-Ashtiani, S.; Bakherad, M.; Barkema, H.; Larose, S. Omics Multi-Layers Networks Provide Novel Mechanistic and Functional Insights Into Fat Storage and Lipid Metabolism in Poultry. Front. Genet. 2021, 12, 646297. [Google Scholar] [CrossRef]
  56. Vassiliou, G.; Benoist, F.; Lau, P.; Kavaslar, G.; McPherson, R. The low density lipoprotein receptor-related protein contributes to selective uptake of high density lipoprotein cholesteryl esters by SW872 liposarcoma cells and primary human adipocytes. J. Biol. Chem. 2001, 276, 48823–48830. [Google Scholar] [CrossRef] [Green Version]
  57. Argov, N.; Moallem, U.; Sklan, D. Lipid transport in the developing bovine follicle: Messenger RNA expression increases for selective uptake receptors and decreases for endocytosis receptors. Biol. Reprod. 2004, 71, 479–485. [Google Scholar] [CrossRef] [Green Version]
  58. Wiese, S.; Gronemeyer, T.; Ofman, R.; Kunze, M.; Grou, C.P.; Almeida, J.A.; Eisenacher, M.; Stephan, C.; Hayen, H.; Schollenberger, L.; et al. Proteomics characterization of mouse kidney peroxisomes by tandem mass spectrometry and protein correlation profiling. Mol. Cell Proteom. 2007, 6, 2045–2057. [Google Scholar] [CrossRef] [Green Version]
  59. Yagita, Y.; Shinohara, K.; Abe, Y.; Nakagawa, K.; Al-Owain, M.; Alkuraya, F.S.; Fujiki, Y. Deficiency of a Retinal Dystrophy Protein, Acyl-CoA Binding Domain-containing 5 (ACBD5), Impairs Peroxisomal β-Oxidation of Very-long-chain Fatty Acids. J. Biol. Chem. 2017, 292, 691–705. [Google Scholar] [CrossRef] [Green Version]
  60. Ferdinandusse, S.; Falkenberg, K.D.; Koster, J.; Mooyer, P.A.; Jones, R.; van Roermund, C.W.T.; Pizzino, A.; Schrader, M.; Wanders, R.J.A.; Vanderver, A.; et al. ACBD5 deficiency causes a defect in peroxisomal very long-chain fatty acid metabolism. J. Med. Genet. 2017, 54, 330–337. [Google Scholar] [CrossRef] [Green Version]
  61. Cao, J.S.; Li, J.L.; Li, D.M.; Tobin, J.F.; Gimeno, R.E. Molecular identification of microsomal acyl-CoA:glycerol-3-phosphate acyltransferase, a key enzyme in de novo triacylglycerol synthesis. Proc. Natl. Acad. Sci. USA 2006, 103, 19695–19700. [Google Scholar] [CrossRef] [PubMed] [Green Version]
  62. Sukumaran, S.; Barnes, R.I.; Garg, A.; Agarwal, A.K. Functional characterization of the human 1-acylglycerol-3-phosphate-O-acyltransferase isoform 10/glycerol-3-phosphate acyltransferase isoform 3. J. Mol. Endocrinol. 2009, 42, 469–478. [Google Scholar] [CrossRef] [PubMed]
  63. Ma, Z.; Onorato, J.M.; Chen, L.; Nelson, D.W.; Yen, C.-L.E.; Cheng, D. Synthesis of neutral ether lipid monoalkyl-diacylglycerol by lipid acyltransferases. J. Lipid Res. 2017, 58, 1091–1099. [Google Scholar] [CrossRef] [PubMed] [Green Version]
  64. Lafontan, M.; Langin, D. Lipolysis and lipid mobilization in human adipose tissue. Prog. Lipid Res. 2009, 48, 275–297. [Google Scholar] [CrossRef]
  65. Walther, T.C.; Farese, R.V., Jr. The life of lipid droplets. Biochim. Biophys. Acta 2009, 1791, 459–466. [Google Scholar] [CrossRef]
  66. Ducharme, N.A.; Bickel, P.E. Lipid droplets in lipogenesis and lipolysis. Endocrinology 2008, 149, 942–949. [Google Scholar] [CrossRef] [Green Version]
  67. Subramanian, V.; Rothenberg, A.; Gomez, C.; Cohen, A.W.; Garcia, A.; Bhattacharyya, S.; Shapiro, L.; Dolios, G.; Wang, R.; Lisanti, M.P.; et al. Perilipin A mediates the reversible binding of CGI-58 to lipid droplets in 3T3-L1 adipocytes. J. Biol. Chem. 2004, 279, 42062–42071. [Google Scholar] [CrossRef] [Green Version]
  68. Yamaguchi, T.; Omatsu, N.; Morimoto, E.; Nakashima, H.; Osumi, T. CGI-58 facilitates lipolysis on lipid droplets but is not involved in the vesiculation of lipid droplets caused by hormonal stimulation. J. Lipid Res. 2007, 48, 1078–1089. [Google Scholar]
  69. Thompson, B.; Sahai, E. MST kinases in development and disease. J. Cell Biol. 2015, 210, 871–882. [Google Scholar] [CrossRef] [Green Version]
  70. Nerstedt, A.; Kurhe, Y.; Cansby, E.; Caputo, M.; Gao, L.; Vorontsov, E.; Stahlman, M.; Nunez-Duran, E.; Boren, J.; Marschall, H.-U.; et al. Lipid droplet-associated kinase STK25 regulates peroxisomal activity and metabolic stress response in steatotic liver. J. Lipid Res. 2020, 61, 178–191. [Google Scholar] [CrossRef]
  71. Amrutkar, M.; Cansby, E.; Chursa, U.; Nunez-Duran, E.; Chanclon, B.; Stahlman, M.; Friden, V.; Manneras-Holm, L.; Wickman, A.; Smith, U.; et al. Genetic Disruption of Protein Kinase STK25 Ameliorates Metabolic Defects in a Diet-Induced Type 2 Diabetes Model. Diabetes 2015, 64, 2791–2804. [Google Scholar] [CrossRef] [PubMed] [Green Version]
  72. Amrutkar, M.; Cansby, E.; Nunez-Duran, E.; Pirazzi, C.; Stahlman, M.; Stenfeldt, E.; Smith, U.; Boren, J.; Mahlapuu, M. Protein kinase STK25 regulates hepatic lipid partitioning and progression of liver steatosis and NASH. FASEB J. 2015, 29, 1564–1576. [Google Scholar] [CrossRef] [PubMed]
  73. Amrutkar, M.; Kern, M.; Nunez-Duran, E.; Stahlman, M.; Cansby, E.; Chursa, U.; Stenfeldt, E.; Boren, J.; Blueher, M.; Mahlapuu, M. Protein kinase STK25 controls lipid partitioning in hepatocytes and correlates with liver fat content in humans. Diabetologia 2016, 59, 341–353. [Google Scholar] [CrossRef] [PubMed]
Figure 1. The heatmap clustering for differentially expressed genes (DEGs) (a) and Venn diagram DEGs among tissues (b). FT-L, liver in fatty-type ducks; LT-L, liver in lean-type ducks; FT-A, abdominal fat in fatty-type ducks; LT-A, abdominal fat in lean-type ducks; FT-S, sebum in fatty-type ducks; LT-S, sebum in lean-type ducks.
Agriculture 12 01775 g001
Figure 2. Gene expression from transcriptome data and qPCR among liver (A), sebum (B), and abdominal fat (C). ELOVL6, ELOVL fatty acid elongase 6; GPAM, glycerol-3-phosphate acyltransferase; ACSL3, acyl-CoA synthetase long-chain family member 3; FASN, fatty acid synthase; SCD, stearoyl-CoA desaturase; FABP7, fatty acid-binding protein 7; ABHD5, abhydrolase domain containing 6; PLIN1, perilipin 1; MOGAT1, monoacylglycerol O-acyltransferase 1; APOBEC2, apolipoprotein B mRNA editing enzyme catalytic polypeptide-like 2; ACSL5, acyl-CoA synthetase long-chain family member 5; STK39, serine/threonine kinase 39; AGPAT9, 1-acylglycerol-3-phosphate O-acyltransferase 9; ACSL6, acyl-CoA synthetase long-chain family member 6. Data are means (n = 6).
Agriculture 12 01775 g002
Figure 3. Volcano plot for differentially expressed genes (DEGs) and bubble plot for KEGG-enriched pathway related to lipid metabolism in the liver. (A) The red dot represents upregulated genes in the liver of fatty-type ducks, and the blue dot represents downregulated genes in the liver of fatty-type ducks. (B) The horizontal axis indicates the values of enrichment factors (proportion of annotated DEGs to all genes of the enriched pathway); the vertical axis indicates the differential pathway name; the p-value is represented by the color of the points; the number of DEGs is represented by the size of points.
Agriculture 12 01775 g003
Figure 4. Volcano plot for differentially expressed genes (DEGs) and bubble plot for KEGG-enriched pathway related to lipid metabolism in sebum. (A) The red dot represents upregulated genes in the liver of fatty-type ducks, and the blue dot represents downregulated genes in the sebum of fatty-type ducks. (B) The horizontal axis indicates the values of enrichment factors (proportion of annotated DEGs to all genes of the enriched pathway); the vertical axis indicates the differential pathway name; the p-value is represented by the color of the points; the number of DEGs is represented by the size of points. FC, fold change; FDR, false discovery rate; p-value, probability value.
Agriculture 12 01775 g004
Figure 5. Volcano plot for differentially expressed genes (DEGs) and bubble plot for KEGG-enriched pathway related to lipid metabolism in abdominal fat. (A) The red dot represents upregulated genes in the abdominal fat of fatty-type ducks, and the blue dot represents downregulated genes in the liver of fatty-type ducks. (B) The horizontal axis indicates the values of enrichment factors (proportion of annotated DEGs to all genes of the enriched pathway); the vertical axis indicates the differential pathway name; the p-value is represented by the color of the points; the number of DEGs is represented by the size of points.
Agriculture 12 01775 g005
Figure 6. Sample clustering and module detection. (a) Hierarchical clustering dendrogram of module identifications. Gene clustering trees were constructed based on the dissimilarity coefficient of differentially expressed genes, and genes with similar expression patterns represented a co-expression module, with different modules represented by different colors. (b) Network heatmap of DEGs in liver, sebum, and abdominal fat. Gene dendrograms and module assignments were added to the left and upper sides of the matrix heatmap, and the depth of color in the graph was proportional to the degree of topological overlap. (c) Correlation between gene co-expression modules, with eigengene heat maps color-depth, indicating the degree of correlation, positive correlation indicated by red, and negative correlation indicated by blue. (d) Correlations between co-expression patterns and traits, red and blue indicate positive and negative correlations, respectively. Each cell has two values: the top value represents the correlation coefficient, and the bottom value represents the asymptotic p-value.
Agriculture 12 01775 g006
Figure 7. Expression pattern of the genes and eigengenes of yellow, blue, green, brown, red, turquoise, and grey modules.
Agriculture 12 01775 g007
Figure 8. Gene-annotation enrichment analysis of KEGG pathway in turquoise, green, and yellow modules (a) and the interaction of hub genes (b,c). The horizontal axis indicates the value of the enrichment factor (proportion of annotated genes to all genes of the enriched pathway); the vertical axis indicates the differential pathway name; the p-value is represented by color of points; the number of genes is represented by size of points.
Agriculture 12 01775 g008
Figure 9. Lipid metabolism-related gene regulatory network. Red Upregulated in fatty-type ducks. Green Upregulated in lean-type ducks. Genes in black were not differentially expressed between the two breeds.
Agriculture 12 01775 g009
Table 1. Primer sequences for real-time polymerase chain reaction (PCR) amplification.
GeneGenebank IDProduct (bp)Primer Sequence
GAPDHXM_0050167104F: 5′-AGATGCTGGTGCTGAATACG-3′
R: 5′-CGGAGATGATGACACGCTTA-3′
ELOVL6XM_038178819.1126F: 5′-CTGGCGGTGGCTGGTTTATGAC-3′
R: 5′-TCTGCGACAAGGTGATGAACATGG-3′
GPAMXM_038181452.1101F: 5′-AAACCTGTGCCTGCTCCTCTTTC-3′
R: 5′-AACGAAGCCTCTCTACCCTCATCC-3′
ACSL3XM_027464027.285F: 5′-TGATCCTTGGACACCTGAGACTGG-3′
R: 5′-GTCCTGTTGATAGTACGCCGTAAGC-3′
ACSL6XM_027468211.2131F: 5′-GCAGGAGGTGGAGGATTGT-3′
R: 5′-TCCCGTGAGTCAGCATAGC-3′
MOGAT1XM_005026421.491F: 5′-TTCTGTACCTCGTGTGGCTCTACC-3′
R: 5′-TTCCAGACAGTCCAGCTCCTGAC-3′
STK39XM_038182285.180F: 5′-CAGGTGCGAGGTTATGACTTCAAGG-3′
R: 5′-GGTGCTGCTCCTGTTGCTAACTC-3′
FASNXM_027471234.2102F: 5′-TCTCTGCCATCTCCCGAACTTCC-3′
R: 5′-TCTCAATTAGCCACTGTGCCAACTC-3′
FABP7XM_027454608.2112F: 5′-ACGTACAGAAGTGGGATGGCAAAG-3′
R: 5′-TTCTCATAGTGGCGAACAGCAACC-3′
SCDXM_027460089.2137F: 5′-CTTCCACAACTACCACCACACCTTC-3′
R: 5′-CCTTGGAGACCTTCTTGCGATCAC-3′
AGPAT9XM_040698969.1116F: 5′-TGGTCTCCTGGAATCTCCTCACAAG-3′
R: 5′-GAGTGGCAGAAGGAAGCAGTATCG-3′
ATGLNM_001310387.1122F: 5′-CAATCACAGTGTCTCCGTTCTCAGG-3′
R: 5′-GCGGTAGAGGTTGCGAAGGTTG-3′
APOBEC2XM_005026827.5237F: 5′-TCCAGGTAGCCCCGAGAAGT-3′
R: 5′-CAACGCCCAGAACGGTGAAC-3′
ABHD5XM_038174903.1168F: 5′-CCACTTCGACGCTGATGCTC-3′
R: 5′-ATAAGGTGTTTGACCCTCGAT-3′
PLIN1NM_001310391.1160F: 5′-CCTGGTCAGCACCGTCTCCC-3′
R: 5′-CTGCCCCTCACCGTGGCTT-3′
ELOVL6, ELOVL fatty acid elongase 6; GPAM, glycerol-3-phosphate acyltransferase; ACSL3, acyl-CoA synthetase long-chain family member 3; FASN, fatty acid synthase; SCD, stearoyl-CoA desaturase; FABP7, fatty acid-binding protein 7; ABHD5, abhydrolase domain containing 6; PLIN1, perilipin 1; MOGAT1, monoacylglycerol O-acyltransferase 1; APOBEC2, apolipoprotein B mRNA editing enzyme catalytic polypeptide-like 2; ATGL, adipose triglyceride lipase; ACSL5, acyl-CoA synthetase long-chain family member 5; STK39, serine/threonine kinase 39; AGPAT9, 1-acylglycerol-3-phosphate O-acyltransferase 9; ACSL6, acyl-CoA synthetase long-chain family member 6. Data are means (n = 6).
Table 2. The DEGs related to lipid metabolism in liver between FT and LT ducks.
GeneLog2FClog2CPMp-ValueFDRAnnotation
LIPG1.371.607.40 × 10−54.09 × 10⁻³lipase%2C endothelial
ETNK20.713.891.79 × 10−47.96 × 10⁻³ethanolamine kinase 2
PLTP0.911.291.09 × 10−45.54 × 10⁻³phospholipid transfer protein
PLIN10.652.831.27 × 10−46.08 × 10⁻³perilipin 1
FABP70.892.266.16 × 10−65.96 × 10⁻⁴fatty acid-binding protein 7%2C brain
PTGS10.983.311.97 × 10−62.27 × 10⁻⁴prostaglandin-endoperoxide synthase 1 (prostaglandin G/H synthase and cyclooxygenase)
GPD10.934.231.58 × 10−61.97 × 10⁻⁴glycerol-3-phosphate dehydrogenase [NAD(+)]%2C cytoplasmic-like
FASN0.728.102.87 × 10−52.00 × 10⁻⁴fatty acid synthase
PGM20.804.781.01 × 10−104.13 × 10⁻⁸phosphoglucomutase 2
FTO−0.823.891.14 × 10−45.69 × 10⁻³fat mass and obesity associated%2C transcript variant X1
SLC5A11.060.251.30 × 10−33.23 × 10⁻²Sodium/glucose cotransporter 1
ACSM40.634.022.00 × 10−48.60 × 10⁻³acyl-coenzyme A synthetase ACSM4%2C mitochondrial-like%2C transcript variant X1
SCAP−0.766.786.14 × 10−78.77 × 10⁻⁵SREBF chaperone
BMP71.290.501.93 × 10−48.42 × 10⁻³bone morphogenetic protein 7
ANGPTL4−0.664.854.50 × 10−37.68 × 10⁻²angiopoietin-like 4
SCD0.8010.317.04 × 10−31.05 × 10⁻¹stearoyl-CoA desaturase (delta-9-desaturase)
ABCG80.594.091.50 × 10−21.66 × 10⁻¹ATP-binding cassette%2C sub-family G (WHITE)%2C member 8%2C transcript variant X1
Table 3. The DEGs related to lipid metabolism in sebum between FT and LT ducks.
GeneLog2FClog2CPMp-ValueFDRAnnotation
ABCA122.108.374.99 × 10−51.64 × 10⁻³ATP-binding cassette%2C sub-family A (ABC1)%2C member 12%2C transcript variant X4
ABCB111.230.712.98 × 10−33.55 × 10⁻²ATP-binding cassette%2C sub-family B (MDR/TAP)%2C member 11%2C transcript variant X3
ABHD12B−0.704.131.82 × 10−32.49 × 10⁻²abhydrolase domain containing 12B
ABHD5−0.808.412.10 × 10−44.89 × 10⁻³abhydrolase domain containing 5%2C transcript variant X1
ACAA2−0.738.154.33 × 10−48.46 × 10⁻³acetyl-CoA acyltransferase 2
ACAD10−0.782.492.96 × 10−33.53 × 10⁻²acyl-CoA dehydrogenase family%2C member 10%2C transcript variant X2
ACBD5−0.637.234.22 × 10−34.56 × 10⁻²acyl-CoA binding domain containing 5%2C transcript variant X3
ACSL31.135.843.30 × 10−61.91 × 10⁻⁴acyl-CoA synthetase long-chain family member 3%2C transcript variant X1
ACSL51.222.851.85 × 10−44.44 × 10⁻³acyl-CoA synthetase long-chain family member 5%2C transcript variant X3
ACSL61.234.555.36 × 10−62.85 × 10⁻⁴acyl-CoA synthetase long-chain family member 6
AGPAT11.532.934.49 × 10−62.44 × 10−41-acyl-sn-glycerol-3-phosphate acyltransferase alpha
AGPAT92.011.712.65 × 10−84.10 × 10−61-acylglycerol-3-phosphate O-acyltransferase 9
ANGPTL4−1.015.911.73 × 10−44.18 × 10⁻³angiopoietin-like 4
APOA1−1.5312.453.18 × 10−122.03 × 10⁻⁹Apolipoprotein A-I
AQP51.813.675.71 × 10−41.06 × 10⁻²aquaporin 5
AQP9−0.725.977.09 × 10−41.26 × 10⁻²aquaporin 9%2C transcript variant X1
DGAT2−0.658.141.72 × 10−42.39 × 10⁻²diacylglycerol O-acyltransferase 2
DGKB1.003.515.09 × 10−51.67 × 10⁻³diacylglycerol kinase beta-like
DGKD1.471.039.73 × 10−52.69 × 10⁻³diacylglycerol kinase delta
ELOVL61.505.892.58 × 10−84.04 × 10⁻⁶ELOVL fatty acid elongase 6%2C transcript variant X3
FA2H1.465.778.18 × 10−41.39 × 10⁻²fatty acid 2-hydroxylase
FABP4−1.0112.984.24 × 10−48.30 × 10⁻³Fatty acid-binding protein 4
FADS11.594.482.18 × 10−72.37 × 10⁻³fatty acid desaturase 1-like
FADS61.066.097.02 × 10−52.11 × 10⁻³fatty acid desaturase 6
FAT11.257.411.23 × 10−55.52 × 10⁻⁴FAT atypical cadherin 1%2C transcript variant X3
FAT21.826.236.35 × 10−75.41 × 10⁻⁵FAT atypical cadherin 2
GPAM1.065.732.38 × 10−61.48 × 10⁻⁴glycerol-3-phosphate acyltransferase%2C mitochondrial%2C transcript variant X2
HK10.717.006.48 × 10−41.17 × 10⁻²hexokinase 1
IGF2BP1−0.803.139.01 × 10−41.49 × 10⁻²insulin-like growth factor 2 mRNA binding protein 1
LIPG1.084.732.26 × 10−61.42 × 10⁻⁴lipase%2C endothelial
LIPM1.943.571.31 × 10−55.86 × 10⁻⁴lipase member M
LPL−0.679.503.43 × 10−47.02 × 10⁻³lipoprotein lipase
LRP80.942.142.05 × 10−32.70 × 10⁻²low-density lipoprotein receptor-related protein 8%2C apolipoprotein e receptor%2C transcript variant X2
LRP2BP1.380.683.09 × 10−33.65 × 10⁻²LRP2 binding protein%2C transcript variant X1
MOGAT12.323.097.87 × 10−101.96 × 10⁻⁷monoacylglycerol O-acyltransferase 1
NOX11.173.611.56 × 10−32.23 × 10⁻²NADPH oxidase 1
PLA2G4B1.287.265.78 × 10−75.10 × 10⁻⁵phospholipase A2%2C group IVB (cytosolic)%2C transcript variant X8
PLA2G4F1.793.516.37 × 10−123.63 × 10⁻⁹phospholipase A2%2C group IVF%2C transcript variant X1
PLIN1−1.0911.381.31 × 10−82.22 × 10⁻⁶perilipin 1
PLIN3−1.0910.363.65 × 10−51.30 × 10⁻³perilipin-3-like
SCARF1−0.963.264.36 × 10−48.49 × 10⁻³scavenger receptor class F%2C member 1
STK17A0.746.659.66 × 10−41.57 × 10⁻²serine/threonine kinase 17a
STK390.962.361.52 × 10−32.19 × 10⁻²serine threonine kinase 39%2C transcript variant X7
UGT80.935.651.31 × 10−31.97 × 10⁻²UDP glycosyltransferase 8
PNPLA3−0.637.6421632.18 × 10−32.83 × 10⁻²patatin-like phospholipase domain-containing protein 3
Table 4. The DEGs related to lipid metabolism in abdominal fat between FT and LT ducks.
GeneLog2FClog2CPMp ValueFDRAnnotation
ELOVL22.862.838.83 × 10−51.06 × 10⁻²ELOVL fatty acid elongase 2
APOBEC2−5.182.302.32 × 10−67.71 × 10⁻⁴apolipoprotein B mRNA editing enzyme%2C catalytic polypeptide-like 2
PLA2G1B−5.411.471.07 × 10−52.17 × 10⁻³phospholipase A2%2C group IB (pancreas)
GHRHR−3.62−0.291.61 × 10−52.99 × 10⁻³growth hormone-releasing hormone receptor
Publisher’s Note: MDPI stays neutral with regard to jurisdictional claims in published maps and institutional affiliations.

