Article

Does Farm Size Expansion Improve the Agricultural Environment? Evidence from Apple Farmers in China

1
School of Economics and Management, Northwest A&F University, Yangling District, Xianyang 712100, China
2
College of Gastronomy Management, Ritsumeikan University, 1-1-1 Noji-higashi, Kusatsu 525-8577, Shiga, Japan
3
School of Environmental Science, The University of Shiga Prefecture, 2500 Hassaka-cho, Hikone 522-8533, Shiga, Japan
*
Author to whom correspondence should be addressed.
Agriculture 2022, 12(11), 1800; https://doi.org/10.3390/agriculture12111800
Submission received: 7 September 2022 / Revised: 19 October 2022 / Accepted: 24 October 2022 / Published: 29 October 2022
(This article belongs to the Section Ecosystem, Environment and Climate Change in Agriculture)

Abstract

:
Farmland environmental pollution has put greater pressure on the sustainability of agricultural production systems. Exploring the relationship between farm size and environmental pollution in agriculture can help provide realistic guidance for stakeholders. In this study, the research data from apple farmers in China were used to measure the environmental pollutant emissions caused by apple production using the life-cycle assessment (LCA) approach. The mediating effect model was used to examine the mechanisms and pathways by which farm size affects the environmental effects of apple production and to identify the mediating effects of fertilizer, pesticide, and machinery input intensity. Finally, a heterogeneity analysis was conducted to illustrate the impact of participation in agricultural cooperatives on the environmental performance of apple production for smallholder farmers. The results showed that the apple production system’s negative environmental impacts from the agricultural material production phase were more significant compared to the farming phase, with a contribution potential of 56.50%. Farm size directly impacts the environmental effects of apple production, and there is a U-shaped trend between the two, implying that from the perspective of environmental effects, larger farm size is not better. There were some mediating effects in the paths of farm size on the environmental effects, and the largest effect was fertilizer input intensity with a full mediating effect; the second largest effect was machinery input intensity with a partial mediating effect, and the mediating effect accounted for 15.50–15.89% of the total effect; the mediating effect of pesticide input intensity was not significant. In addition, the study also found that joining agricultural cooperatives was beneficial in promoting the improvement of the negative environmental impact caused by apple production. These findings provide insights into optimizing farm inputs for apple production and identifying the appropriate farm size to alleviate multiple environmental impacts, intending to make a marginal contribution to promoting sustainable development of the apple industry in China also providing the research evidence for the comparative study of the environmental burdens of apple production in China and other countries in the world.

1. Introduction

Over the past half-century, the world has achieved great success in increasing agricultural production and food security. It feeds over 7 billion global population with limited arable land [1]. However, this achievement has come at a considerable environmental cost, mainly because the crude agricultural production methods have brought about a series of environmental problems, such as resources waste, soil and water pollution, air quality declining, and biodiversity diversity frequently decreasing [2], and non-point source pollution has become a key constraint to healthy and sustainable agricultural development [3]. The conflict between agricultural development and environmental protection will likely become more serious with the world population growth, which is expected to exceed 9 billion by 2050 [4], as well as the realistic background of frequent extreme weather [5], water resource depletion [6], energy scarcity [7], etc. Feeding a growing world population while minimizing the associated environmental impacts is a challenging task for policymakers. The challenge appears even more remarkable in China, as it is the world’s largest developing country with 1.4 billion people but less than 0.10 ha of arable land per capita [8]. Moreover, China is a typical region still dominated by smallholder farms, and land fragmentation caused by the Household Contract Responsibility System (HCRS) has led to the consequences of many negative environmental impacts in the current stage, such as air and water pollution and low agricultural labor productivity [9]. Specifically, fertilizer application intensity per crop in China is about three times higher than the world average and accounts for about 30% of global mineral fertilizer use [10]; meanwhile, pesticide application intensity is also much higher than international levels [11], thus creating a situation where environmental pollution is prominent, and food safety risks are increased, which is contrary to the development pattern of agricultural modernization.
The significance of land as an important asset for agricultural production cannot be overstated. For farmers, farm size becomes even more of an essential physical capital endowment [12]. Theoretically, farm size influences a range of farm resource allocation decisions, including labor use patterns [13]. The reasons adduced for such influence include production and pecuniary economies of size, management capacity to respond to risk management strategies, the potential for off-farm employment, and so on [14]. The debate around more land may stem from the common notion that more is better than less and that agricultural development should be accompanied by more resources, including land, per unit of production, which invariably translates to increasing farm size. The practice of some developed countries shows that large-scale farm operation is a historical necessity for market-oriented and specialized production and a prerequisite for the development of modern and high-quality agricultural products [15,16]. However, the practical experience of some developing countries has reached the opposite conclusion because larger farm sizes may cause reduced production efficiency and even negative environmental problems in resource-constrained contexts [17]. Therefore, it has triggered extensive discussions among scholars worldwide on the relationship between farm size and agricultural production.
Most published researches mainly focus on the impact of farm size on the agricultural economy. However, there is still a lack of literature that pays attention on the environmental consequences related to farm size, and especially, the literature remains unclear regarding assessing pollutant emissions from a life-cycle perspective and using them as explained variables to further investigate the mechanisms and magnitude of the effects between farm size and environmental effects. This study assesses the relationship between farm size and environmental pollutant emissions, considering apple growers as a typical case. We believe the findings of this study to be a compelling case study for two reasons. First, apple production is highly representative in China. China is the world’s largest producer and consumer of apples, with 2088.52 thousand ha planted and 41 million tons of apples produced in 2020. The production and consumption of fresh apples account for 54.07% and 67.17% of the world’s total, respectively. However, irrational inputs such as chemical fertilizers and pesticides have led to increasing environmental problems in apple production [18]; moreover, constrained by quality testing standards, Chinese apples face strong resistance to entering the world market [19]. Clearly, the barriers contribute to apple production’s unsustainability in China. Therefore, how to promote sustainable apple production in China has become an important practical issue that needs to be addressed. Furthermore, since apple production is highly dependent on land resource endowment, farm size is likely to affect the sustainability of apple production by influencing operators’ inputs and daily management decisions. An in-depth analysis of this issue became the focus of our attention and interest. Second, the study area is Baishui County in Shaanxi Province and Qingcheng County in Gansu Province, both of which are major apple production bases in China and one of the best eugenics areas in the world for producing apples with a good reputation worldwide. At the same time, most apple farms in the two counties are owned by smallholders with 0.5 ± 0.3 ha, which is typical of the scale of apple production in China.
Farm size does not simply imply the concept of production factors for apple growers. Still, it is also closely related to household risk resilience, social networks, social capital, and resource allocation decisions and thus is likely to have a direct impact on agricultural environmental pollution. In addition, material inputs such as fertilizers, pesticides, and machinery are essential capital inputs for apple production, and farm size is likely to affect the emission of environmental pollutants by influencing the input decisions of these physical capitals. Yet, few scholars have comprehensively analyzed the impact of farm size on the environment through the mediated pathway of fertilizer, pesticide, and machinery input intensity. Given this, the present study first measures the integrated environmental impact using the LCA method to clarify the environmental pollutant emissions caused by apple production. On this basis, some empirical tests between farm size and environmental effects were held using a mediating effect model to clarify the pathways through which farm size affects environmental effects. Finally, a heterogeneity analysis was conducted to explain the impact of smallholder participation in cooperatives on environmental performance.
The rest of the paper is organized as follows. Section 2 presents the literature review around four aspects. Section 3 explains the materials and methods used. Section 4 and Section 5 present results and discussion, respectively. In Section 6, conclusions and implications are presented.

2. Literature Review

A crucial challenge to achieve sustainable agricultural growth in many developing countries faced with the double pressure of population growth and environmental problems is the efficient utilization of limited land resources [20]. The issue of farm size and agricultural productivity is a perennial issue for agricultural and development economics research and has been given a great deal of attention by the rural development literature around the world [21]. In order to fully assess the impact of farm size on agricultural sustainability, we carried out a comprehensive literature review about the impact of farm size on agricultural economy, the impact of farm size on agricultural environmental consequences, and the application of LCA methods in agricultural production.

2.1. The Relationship between Farm Size and Agricultural Economy

Numerous researches have focused on the exploration of the relationship between farm size and agricultural productivity. Since the law of diminishing returns to land size exists, the programmatic fact of the negative correlation between farm size and the output of land (crop yield) is well-established, especially for developing countries [22,23,24], though concerns about measurement error have plagued consensus [25]. However, agricultural operators can adopt some advanced management techniques to replace labor with the expansion of farm size in the reality of continuous innovation in agricultural production technology, which in turn promotes the employment of surplus labor in the non-farm sector where labor remuneration is higher, and finally makes a positive relationship between farm size and household income [26]. There are also some exceptions, such as the study of [27], which showed that smaller farms devoted a greater share of their land to growing high-value and nutrient-dense vegetables, fruits, and root crops compared to larger farms that devoted more land to grains. Further, the study of [8] showed that unit costs are higher on larger farms and that land rent is the main reason in comparison with small farms. These two aspects make a negative relationship between farm size and economic profit.
In order to further measure the impact of farm size on production efficiency, the following multiple concepts of efficiency were used in the academic field, including labor efficiency, technical efficiency, allocated efficiency, economic efficiency, and total factor productivity [1]. As for labor efficiency, some studies have shown that labor intensity and effectiveness decrease as farm size increases [26,28,29], while some studies have gained the opposite conclusion, meaning that the labor efficiency is higher on large farms [30]. For technical efficiency, a large empirical literature source provided some evidence that technical efficiency increases with increasing farm size [13,31]; however, it has also been shown that technical efficiency decreases with increasing farm size [32]. Moreover, some studies identified that technical efficiency presented a U-shaped or inverted U-shaped relationship with farm size [24,33]. For allocated efficiency, economic efficiency, and total factor productivity, a similar conclusion was drawn for technical efficiency [13,16,17,21,34,35]. A summary of the variables affected by farm size in agriculture is shown in Table 1.
The above studies suggest that the relationship between farm size and agricultural economy may include the following types of connections: positive, negative, U-shaped, inverted U-shaped, and no ties [23]. The findings reveal that there is no economically optimal agrarian structure in an absolute sense although some farm sizes may face productivity disadvantages depending on their country’s level of economic development and circumstance [21]. Therefore, the main reason for such differences is the significant heterogeneity of different study regions, crop types, and land systems, and specific problem-specific analysis is needed in practice.

2.2. Environmental Consequences Related to Farm Size

To explore the relationship between environmental consequences and farm size, some scholars have focused on the effect of farm size on adopting environmentally friendly agricultural technologies. Most researchers found a significant positive effect of farm size on the adoption of green production technologies by farmers through empirical studies [36,37,38]. Ref. [12] argued that farm size is the most important determinant of agri-environmental measures in practice. Ref. [47] showed that large farms are more likely to join environmental programs in sensitive areas earlier than small farms. Contrary to the above findings, some researches showed that farmers with small farms are more likely to engage in support of agri-environmental measures than those on medium- and sub-moderate-sized farms [39,40,41]. This negative relationship can be explained by differences between large and small farms in allocating their labor time and assets to implement technology adoption. Small farm farmers are less constrained by their labor and capital relative to large farm owners. Furthermore, one of the arguments for this negative relationship involves economies of scale. The growth of farms provides greater benefits in terms of economies of scale in food production than the use of environmental services, such as environmentally friendly technology adoption. In addition, studies have also shown that farm size does not have a significant effect on the adoption of environmentally friendly technologies [42,43].
Although these previous studies have used farm size as an independent variable to explain its essential effects on agricultural production, few studies have focused directly on the relationship between farm size and agricultural environment effects. The individual studies that have focused on farm size effects on the agricultural environment found that a 1% increase in farm size would cause a 1.8% decrease in the use of pesticides and a 0.3% decrease in fertilizer use [44]. Compared to small-scale farms, land used by large farms has 6–9% higher soil organic carbon stocks [45], 48% lower CO2 emissions [46], and 8–28% carbon footprint reduction [45]. Meanwhile, the global warming potential, acidification potential, eutrophication potential, aquatic eco-toxicity, and human toxicity impacts per unit area in large farms are 1.6–12.7% lower than that of small farms [8]. However, it is worth noting that agriculture environmental performance is a comprehensive concept. If the measurement of environmental pollution indicators is limited to only one aspect, such as carbon emissions, it may lead to biased results. Therefore, some scholars have proposed a comprehensive and integrated assessment of the environmental impacts caused by agricultural production from the life-cycle thinking.

2.3. The Application of LCA Method in Agricultural Production

Life-cycle assessment (LCA) has been widely used to help systematically understand the potential environmental impacts of a product and process by quantifying all resource use and associated emissions [48]. It is one of the most important broadly utilized methods to analyze the environmental consequences of agricultural production systems over the last three decades [49]. The method can simultaneously provide multi-dimensional negative environmental-impact indicators in the characterization step, including the abiotic depletion potential, global warming potential, ozone layer depletion potential, human toxicity potential, freshwater aquatic eco-toxicity potential, marine aquatic eco-toxicity potential, terrestrial eco-toxicity potential, photochemical oxidation potential, acidification potential, eutrophication potential, etc. Thus, a comprehensive and integrated assessment of environmental pollution potential can be achieved. The main point to note is that the names and types of environmental-impact categories vary somewhat depending on the specific approach, such as Ecological Scarcity 2013, EPD (2018), EPS 2015d, IMPACT 2002+, and CML. Most importantly, the method is able to normalize multiple environmental-impact categories through a standardization process to form a comprehensive environmental-impact index. Furthermore, the weighting process of the method is automatically implemented by software, which can effectively avoid inaccurate results caused by artificial weights.
LCA is increasingly used in agriculture production for cereals, including rice, wheat, and maize [50,51,52,53]; livestock products such as chicken, pork, milk, etc. [54,55,56]; and fruits such as blueberries, grapes, bananas, sweet cherries, plums, etc. [7,57,58,59]. In particular, the methodology has also been more abundantly used in apple production systems [18,60,61,62].
However, the common feature of the above-mentioned studies is that they all used the LCA method to assess and demonstrate the potential of different environmental-impact categories in agricultural production systems, focusing more attention on the application process of the LCA method itself and lacking the application of the environmental-impact results obtained by the LCA method as important indicators to further integrate with practical problems and empirical methods related to the field of agricultural economic management. However, some scholars suggest that the combined application of LCA methods with other economic management theories and methods is a general trend for in-depth investigation of issues related to the sustainable development of agricultural systems [18,49]

2.4. Summary of Literature

The above literature review reveals that, in general, there have been numerous studies focusing on the impact of farm size on the agricultural economy, while there are still relatively a few relevant literatures studying the impact of farm size on the agricultural environment. Moreover, the environmental impacts were usually measured with a relatively single indicator in the few studies that have focused on the relationship between farm size and the agricultural environment. Furthermore, there are many studies related to the application of LCA methods to agricultural production, but scant literature further explores empirical studies of farm scale on environmental performance measured and obtained based on LCA methods.

3. Materials and Methods
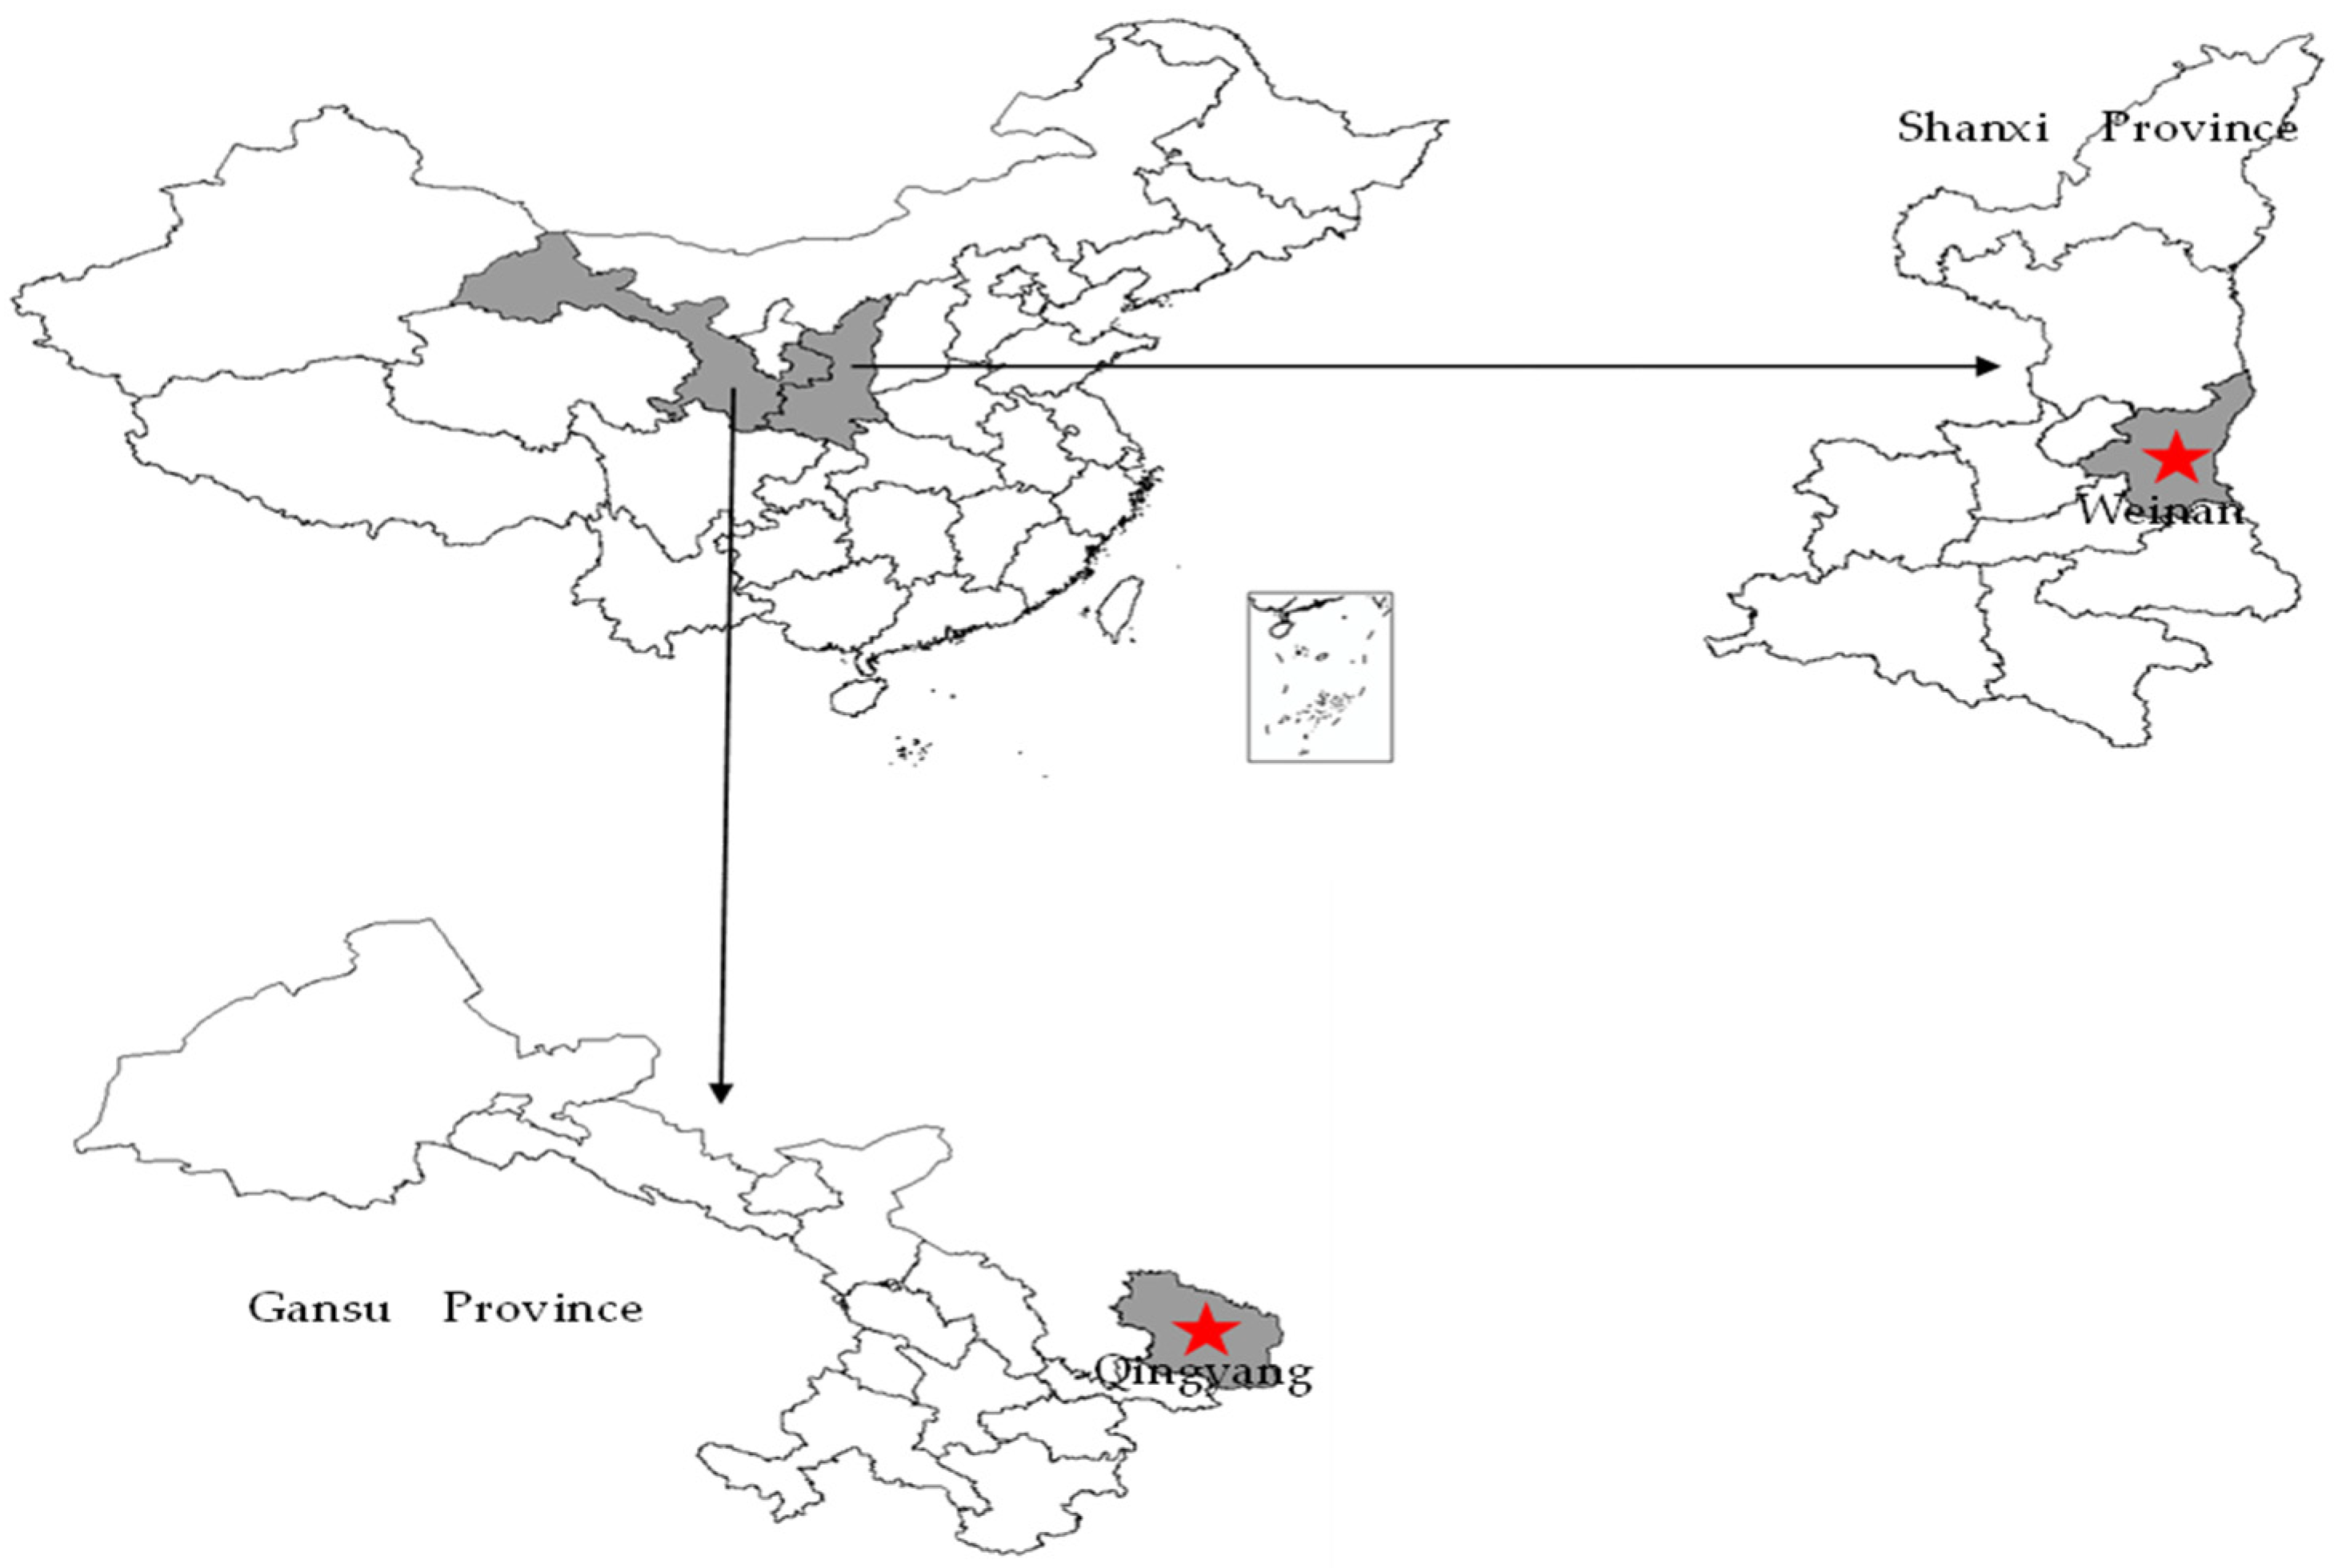
3.1. Study Area

In this study, Baishui County in Weinan City, which is located in Shaanxi Province, and Qingcheng County in Qingyang City, which is located in Gansu Province, were selected as the study areas. The reasons for choosing these two regions are the following: first, both are superior apple production regions in China, and the climatic and natural geographic conditions such as average annual temperature, light, precipitation, daily temperature difference, and soil thickness in both regions are very suitable for apple production so that apple has become a pillar industry of the local agricultural and rural economy; second, the two areas are located in the central and western parts of the Loess Plateau apple production area, respectively, which can better portray the production and operation of different apple farmers in the main production area. Third, both regions are important bases for exporting apples in China. Therefore, the selected areas are typical and representative. The locations of the study area are shown in Figure 1. The following will introduce the regional profiles and apple production in the two counties, and the summary of some characteristics in 2020 is shown in Table 2.
Baishui County is located in northeastern Shaanxi Province, in the transition zone between the Guanzhong Plain and the northern Shaanxi Plateau, and ranges from approximately 109°16′–109°45′ E and 35°4′–35°27′ N. The area belongs to the warm temperate continental monsoon climate, influenced by the complex topography; the weather varies significantly within the territory. The annual average total solar radiation is 128.13 kcal/cm. year, the yearly average temperature is 11.4 °C, and the average annual precipitation is 577.8 mm. The natural conditions in Baishui County are very suitable for apple cultivation. It is the most extensive organic apple production base in China and one of the best eugenics areas in the world, producing apples with a worldwide reputation. In 2020, there were 36,700 hectares of land used for apple cultivation in Baishui County, with yields of about 530,000 tons, accounting for 5.97% and 4.66% of the total area and output of apples produced in Shaanxi Province, respectively.
Qingcheng County is located in the eastern part of Gansu Province, in the middle and upper reaches of the Malian River, and ranges from approximately 107°16′–108°05′ E and 35°42′–36°17′ N. The area belongs to the temperate continental monsoon climate, with an average annual temperature of 9.4 °C, an average annual rainfall of 537.5 mm, and a frost-free period of 150 days, making it a typical dry farming area. The climate of the region is more complex, with fast warming in spring, sandy winds, changeable weather, more pronounced spring droughts, thawing in late March, final snow in early April, and hail starting in mid-May. The summer is hot and rainy, the temperature drops quickly in autumn, and the winter freeze lasts for three months. Apple planting has become one of the characteristic industries in the country, relying on natural geography and location advantages. In 2020, there were 28,600 hectares of land used for apple cultivation in Qingcheng County, with an output of about 200,000 tons, accounting for 6.50% and 3.08% of the total area and output of apple planting in Gansu Province, respectively.

3.2. Data Sources

The data in this study come from field research in November 2020 and October 2021 on apple growers in Baishui County and Qingcheng County. The survey was conducted by a combination of stratified and random sampling methods. Firstly, China’s four central apple production regions were ranked in terms of apple cultivation area and production, from which the northwest Loess Plateau production area with the largest cultivation area was selected. Moreover, two provinces with apple cultivation were randomly selected in this central production region considering the level of regional economic development. Then, one county in each province was randomly selected as the first level sampling frame considering the geographical environment. Secondly, 4–5 townships were randomly selected in each county according to the purpose of the study and the introduction of the person in charge of the apple production department. Thirdly, 2–3 administrative villages were randomly selected in each township according to the apple growing area. Fourthly, 10–15 apple growers were randomly selected in each administrative village as the study subjects according to the list of all apple growers in the village provided by the cadres of the local village committee, following the principle of taking one sample of every five. Finally, face-to-face interviews were conducted for apple production and marketing. A total of 340 questionnaires were collected, and 313 valid samples were obtained by excluding invalid questionnaires with incomplete or contradictory critical information, with a sampling efficiency of 92.06%. This research uses relevant data from 2020 to study the impact of farm size on the emission of environmental pollutants, including 15 categories (see Section 3.4.1 for a detailed description) in apple production.

3.3. Variable Descriptions

The definitions and descriptive statistics of the variables used in this study are shown in Table 3.
Dependent variable: Environmental effects were used as the dependent variable in this study. The emission of environmental pollutants in apple production was obtained through the LCA method calculation with a mean value of 429.92 for the environmental-impact index. The detailed steps for obtaining the indicators of environmental effects and the corresponding analysis of the results are shown in Section 3.4.1 and Section 4.1, respectively. It should be noted that a larger environmental-impact index means more environmental pollutants caused by apple production and a more significant environmental impact.
Core independent variable: Farm size was chosen as the core independent variable in this study. It is characterized using the actual area of apple orchards operated by the farmers in 2020. Table 3 shows that the mean value of farm size is 0.50 ha, and the maximum and minimum values are 2.00 ha and 0.03 ha, respectively. The field research revealed that only 41.53% of the farmers had farm sizes above the mean value, reflecting the overall low level of apple cultivation in the study area.
Intermediary variables: Since fertilizer, pesticide, and machinery are the main capital inputs in apple production, the input intensity of these three variables was used as mediating variables in this study. There are two main reasons for this treatment. First, since this paper uses the LCA method to measure environmental effects, the first steps in which the method should operate is the determination of the objective and scope. The functional unit of this study is set to operate an apple orchard of 1 ha, which is clearly defined in Section 3.4.1 of the life-cycle assessment method. In order to meet the data requirements for the method to be applied, all the inputs are converted into unit hectares in this study. Second, the existing researches usually used the input intensity of fertilizer, pesticide, and machinery as mediating variables to test the corresponding mechanisms and pathways in the related studies that used mediating effect model to test the effects of farm size on the agricultural environment [63,64], so we refer to and learn from their approach in this study.
For fertilizer input intensity, the average amount of fertilizer applied per hectare was calculated based on the representative types of fertilizer used by apple farmers (e.g., farmyard manure, organic fertilizer, compound fertilizer, and water-soluble fertilizer). Since N, P2O5, and K2O are the most critical components of fertilizer, the calculation of fertilizer input intensity comprehensively considers the content, drawing on [65]. For the pesticide input intensity, we learned that the types of pesticides used in apple orchards include insecticides, fungicides, herbicides, regulators, etc. In this study, we refer to the study of [66] to calculate the total amount of pesticides used according to the active ingredients. We calculated the average amount of pesticides used per hectare to characterize the input intensity. For machinery input intensity, agricultural machinery such as weeders, fertilizer applicators, drug applicators, tractors, and agricultural tricycles are commonly used in the orchard, and the main fuel is diesel. The diesel consumption was calculated based on the total fuel consumption per unit time and actual working time of the machinery used; on this basis, the average diesel use per hectare to characterize its input intensity. Table 3 shows that the average input intensity of fertilizer, pesticide, and machinery were 1599.67, 20.03, and 398.97 kg/ha, respectively.
Control variables: In order to avoid other variables from interfering with the emission of environmental pollutants of apple production and affecting the empirical results, based on the core variables mentioned above, this study further controlled for the effects of other variables, including the age and education level of the household head, population size, specialization level, number of training sessions, tree age, soil quality, degree of fineness, low carbon awareness, and distance from home to the county. Table 3 shows that the average age of household heads in the study area is 56.65 years old, with 7.89 years of education and total household size of four members, indicating that apple farmers are relatively old and have a low level of education, which is a common situation in rural China. The average age of apple trees is 17.50 years, which is at the peak of production; the self-assessment of orchard soil quality by major operators is 3.02, which is at a medium level; the actual number of apple orchard plots is nearly two, which indicates that farmers basically have to consider the daily management of more than one orchard; the low carbon perception score of major operators is 3.54, which shows that apple producers have a high level of low carbon perception; the average distance between the residence and the nearest county town is 23.74 km, which indicates that the accessibility is good.
Subgroup variable: Apple production in the study area is mainly carried out by smallholder farmers, and agricultural cooperatives play an important role in promoting sustainable production in its whole life-cycle system. Therefore, this study chose whether or not to join an agricultural cooperative as a grouping variable to further analyze the heterogeneity of farm size on the environmental effects of apple production under different capital endowments. Table 3 shows that 31% of apple farmers joined cooperatives, indicating that the majority of farmers have not yet joined cooperatives.

3.4. Research Method and Model Construction

3.4.1. Life-Cycle Assessment Method

The LCA method is widely used in environmental-impact assessment because of its “cradle-to-grave” concept of tracking the negative environmental impacts of a unique activity throughout the entire process. It can measure the emissions of different environmental-impact categories for each input at different stages and standardize the results as needed, thus becoming an effective tool to support global sustainable development plans [67]. The methodology consists of four specific steps: target and scope determination, life-cycle inventory analysis, impact evaluation, and interpretation of results. In this study, the IMPACT 2002+ method was selected to analyze the negative impacts of apple production on the environment. In practice, the following 15 midpoint indicators of environmental-impact categories (namely carcinogens, non-carcinogens, respiratory inorganics, ionizing radiation, ozone layer depletion, respiratory organics, aquatic eco-toxicity, terrestrial eco-toxicity, terrestrial acid, land occupation, aquatic acidification, aquatic eutrophication, global warming, non-renewable energy, and mineral extraction) and 4 endpoint indicators (human health, ecosystem quality, climate change, and natural resource depletion) were considered. The relevant results can be presented by characterization, standardization, and weighting. In this study, the comprehensive environmental-impact index was calculated by standardization as a measure of environmental effects. To achieve the above objectives, the functional unit of this study was set to operate an apple orchard of 1 ha. The system boundary includes the agricultural material production phase (mainly refers to the production process of nitrogen, phosphorus, and potassium fertilizers, pesticides, and diesel fuel) and the farming phase (mainly refers to the operation process of fertilization, pesticide spraying, irrigation, weeding, flower, fruit thinning, harvesting, etc.).

3.4.2. Mediating Effect Model Construction

In this study, we apply the stepwise regression method of mediating effect test proposed by [68] and draw on the mediating effect model to empirically test the mechanism and path of the effect of farm size on environmental pollutant emissions. The basic model was constructed as follows:
Y i   = λ 1 + α 1 X i + η 1 Z i + ε i
M i   = λ 2 + b X i + η 2 Z i + ε i
Y i   = λ 3 + α 2 X i + c M i + η 3 Z i + ε i
where Y i   is the dependent variable (environmental effects); X i is the core independent variable (farm size); M i   is the mediating variable (fertilizer/pesticide/machinery input intensity); Z i is the control variable; λ 1 , λ 2 , and λ 3 are the intercept; ε i is the random disturbance term; α 1 , α 2 , b , c , η 1 , η 2 , and η 3 are regression coefficients. To test the paths of farm size and input intensity on the emission of environmental pollutants of apple production, this study follows the following test steps according to the stepwise regression method.
In the first step, the coefficients of X i Y i   in Equation (1) was verified, and if α 1 is significant, the theory of mediating effect is applied; otherwise, the theory of mediating effect is not applied. In the second step, we verify whether the coefficient b of X i M i   in Equation (2) and the coefficient c of M i Y i   in Equation (3) are significant; if both are significant, there is a mediating effect, and we thus skip to the fourth step; if at least one of them is not significant, we proceed to the third step. In the third step, the bootstrap method is used to test the original hypothesis H 0   : b c = 0 . If it holds, we continue to the fourth step; otherwise, the test is terminated. In the fourth step, we verify the direct effect α 2 of X i Y i   in equation (3); if it is not significant, it means that the direct effect is not significant, and there is a full mediation effect; if it is significant, the direct effect is valid, and we continue to step 5. In the fifth step, we compare the sign of b c and α 2 , and if the sign is the same, the mediating variable has a partial mediating effect, and the proportion of the mediating effect to the total effect is b c / α 1 ; if the sign is different, the mediating variable has a masking effect, and the proportion of the indirect effect to the direct effect is the absolute value of |   b c / α 2 |.

4. Results

4.1. Analysis of the Environmental Impact and the Contribution at Different Phases

Figure 2 shows the contribution of the non-desired outputs at different phases when 1 ha of apple orchard is used as a functional unit. Overall, the negative environmental impact of the agricultural material production phase on the apple production system was more significant, with a contribution potential of 56.50%. In contrast, the negative environmental impact of the farming phase was relatively small, with a contribution potential of 43.50%. More specifically, the agricultural material production phase had a more significant effect on carcinogens, respiratory inorganics, ionizing radiation, ozone layer depletion, respiratory organics, land occupation, aquatic eutrophication, global warming, non-renewable energy, and mineral extraction among all environmental-impact categories. In comparison, the farming phase mainly impacted non-carcinogens, aquatic eco-toxicity, terrestrial eco-toxicity, terrestrial acid, and aquatic acidification.
After converting all midpoint indicators in Figure 2 to endpoint indicators and standardizing them, we found that the mean value of the environmental-impact index is 429.92. The mean contribution values generated by the categories of environmental impact on human health, ecosystem quality, climate change, and natural resource depletion are 6.15, 419.87, 3.00, and 0.90, and the corresponding shares of contribution potential are 1.43%, 97.66%, 0.70%, and 0.21%, respectively. Clearly, the apple production system in the study area has the most significant negative impact on ecosystem quality.

4.2. Direct Impact of Farm Size on the Environmental Effects of Apple Production

As shown in model (1) of Table 4, farm size directly impacts the environmental effects of apple production. The estimated coefficient is −0.581, with the significance at the 1% statistical level, indicating that farm size has a significant negative impact on the environmental effects of apple production, implying that the emissions of environmental pollutants caused by apple production decrease as the farm size increases. Considering the possible non-linear relationship between farm size and environmental effects, model (2) included both farm size and its squared term in the regression model. The results showed that the estimated coefficient of farm size on the environmental effect of apple production is −1.185, with the significance at the 5% statistical level. Meanwhile, the estimated coefficient of farm size squared term on the environmental effects of apple production is 0.025, which does not pass the significance level test.
The signs of the two estimated coefficients in model (2) indicate a U-shaped trend between farm size and environmental effects. The trend reflects that from the perspective of environmental effects, larger farm size is not better. Because more than a certain level, the emissions of environmental pollutants caused by apple production will not continue to decrease but will tend to increase, it is calculated that the turning point of farm size is 1.55 ha. However, a statistical analysis of the sample shows that only 0.64% of the apple farmers have a farm size above 1.55 ha, meaning that the majority of the decision units are located to the left of the turning point. This result confirms that it is reasonable that the regression estimation using the farm size variable alone presents a significant negative effect.
Table 4 also shows that the education level of the household head, population size, the degree of specialization, the number of training sessions, the soil quality, and low carbon awareness all have significant negative impacts on the environmental effects, which indicates that the higher the education level, the larger the population size, the higher the degree of specialization, the more training sessions, the better the soil quality, and the higher the low carbon awareness are, the more beneficial it is to reduce the emission of environmental pollutants in apple production; on the contrary, the age of the tree and the degree of farm fragmentation both have significant positive effects on the environmental effects, which indicates that a higher age of fruit trees and a higher degree of farm fragmentation lead to more emission of environmental pollutants in apple production.

4.3. The Mediating Effect Test of Farm Size on the Environmental Effects

4.3.1. The Mediating Effect Test of Fertilizer Input Intensity

Table 5 shows the test results of the mechanism of the effect of fertilizer input intensity on the environmental effects of apple production. The results of model (3) show that the estimated coefficient of farm size on fertilizer input intensity is significantly negative (−2.239) and significant at the 1% statistical level, indicating that the larger the farm size, the more farmers tend to reduce fertilizer inputs in apple production. Model (4) included farm size and its squared term in the regression model, and the results showed that the estimated coefficient of farm size on fertilizer input intensity is −4.716 and significant at the 5% statistical level; meanwhile, the estimated coefficient of farm size squared term on fertilizer input intensity is 0.104, which did not pass the significance level test. The finding indicates that after the farm size is expanded to a certain extent, the fertilizer input intensity will show a U-shaped trend of change instead of decreasing.
To further test the existence and type of mediating effects, model (5) included both farm size and fertilizer input intensity in the regression model. The estimated coefficient of fertilizer input intensity on the environmental effects of apple production is 0.181 and significant at the 1% statistical level, indicating that the greater fertilizer input intensity, the greater release of environmental pollutants caused by apple production. Model (6) further incorporates the squared term of farm size based on model (5) and finds that the estimated coefficient of the environmental effect of fertilizer input intensity on apple production is still significantly positive. However, the results of both model (5) and model (6) showed that the estimated coefficients of farm size on the environmental effects of apple production are insignificant in the presence of fertilizer input intensity. According to the rule of mediating effect test, we know that there is a fully mediated effect of fertilizer input intensity on the environmental effect of apple production.

4.3.2. The Mediating Effect Test of Pesticide Input Intensity

Table 6 shows the test results of the effect mechanism of pesticide input intensity on the environmental effects of apple production. The results of model (7) show that the coefficient of the impact of farm size on pesticide input intensity is negative, indicating that the larger the farm size, the more farmers tend to reduce pesticide inputs in apple production, but the regression result does not pass the significance level test. Model (8) further included both farm size and its squared term in the regression model, and the results showed that the estimated coefficient of farm size on pesticide input intensity is –0.032, which does not pass the significance level test; meanwhile, the estimated coefficient of farm size squared term on fertilizer input intensity is 0.001, which also does not pass the significance level test.
Model (9) incorporates both farm size and pesticide input intensity into the regression model, and the estimated coefficient of pesticide input intensity on the environmental effects of apple production is 4.655 and significant at the 1% statistical level, indicating that the greater intensity of pesticide input, the greater emission of environmental pollutants caused in apple production. Model (10) further incorporates the squared term of farm size based on model (9) and finds that the estimated coefficient of pesticide input intensity on the environmental effects of apple production is still significantly positive (4.626) and passes the statistical level test of 1%. It is also noteworthy that the results of both model (9) and model (10) showed that the estimated coefficients of farm size on the environmental effects of apple production are significantly negative under the effect of pesticide input intensity. According to the method of determining the mediating effect, it is necessary to test further whether pesticide input intensity has a mediating effect with the help of the bootstrap method. The results of the bootstrap test are shown in Section 4.3.4, and it can be learned that the mediating effect of pesticide input intensity does not exist.

4.3.3. The Mediating Effect Test of Machinery Input Intensity

Table 7 shows the test results of the effect mechanism of machinery input intensity on the environmental effect of apple production. The results of model (11) show that the regression coefficient of farm size on machinery input intensity is negative (−0.866) and significant at the 1% statistical level, indicating that the larger the farm size, the lesser the farmers’ machinery input intensity in apple production. Model (12) included farm size and its squared term in the regression model, and the results showed that the estimated coefficient of farm size on machinery input intensity is −1.846 and significant at the 5% statistical level; meanwhile, the estimated coefficient of farm size squared term on machinery input intensity is 0.041, which does not pass the significance level test. The result is consistent with the fertilizer input intensity, indicating that the U-shaped trend of machinery input intensity also occurs after the farm size is expanded to a certain extent.
Model (13) incorporates both farm size and machinery input intensity into the regression model. The results show that the estimated coefficient of machinery input intensity on the environmental effects of apple production is 0.104, which is significant at the 1% statistical level, indicating that the greater machinery input intensity, the more considerable release of environmental pollutants caused in apple production. Model (14) further incorporates the squared term of farm size based on model (13) and finds that the estimated coefficient of machinery input intensity on the environmental effect of apple production is 0.102, which is still significant at the 1% statistical level. Notably, the results of both model (13) and model (14) showed that the estimated coefficients of farm size on the environmental effects of apple production are negative and significant at the 5% and 10% statistical levels, respectively, under the effect of machinery input intensity. Thus, the mediating effect of machinery input intensity exists in terms of the estimated values and significance of the parameters of each variable, but it is a partially mediating effect.
According to the rule of determining the mediating effect, it is calculated that the mediating effect accounted for 15.50% of the total effect when the independent variable considered only farm size and 15.89% of the total effect when the independent variable considered both farm size and its squared term. The finding indicates that the mediating effect of machinery input intensity in the farm size on environmental effects of apple production is relatively stable. Moreover, about 15.50–15.89% of the effect of farm size on the environmental effects of apple production is achieved through the mediating effect of the machinery input intensity variable. The conclusion that can be drawn is farm size affects the emission of environmental pollutants in apple production by changing farmers’ machinery input intensity.

4.3.4. Robustness Test

To test the robustness of the mediating effect results, this study used the bootstrap method to test the mediating effect of input intensity in the farm size on the environmental effects of apple production. For the test results, if the _bs_1 indicator does not contain 0 at a 95% confidence interval, the mediating effect is significant; otherwise, the mediating effect is not significant [69].
Table 8 shows the results of the test for mediating effects based on the bootstrap method. For the fertilizer input intensity mediating variable, the normal-based values of _bs_1 at the 95% confidence interval are −0.886 and −0.190, respectively, which belong to the case of not containing 0. Thus, it indicates that the mediating effect is significant. Combined with the previous analysis, it can be concluded that there is a fully mediated effect of fertilizer input intensity on the environmental effects of apple production. For the pesticide input intensity mediator variable, the normal-based values of _bs_1 at the 95% confidence interval are −0.328 and 0.028, respectively, which belong to the case of inclusion of 0. Thus, it indicated that the mediating effect does not exist. For the machinery input intensity mediating variable, the normal-based values of _bs_1 at the 95% confidence interval are −0.336 and −0.012, respectively, which belong to the case of not including 0. Thus, it indicates that the mediating effect is significant. Combined with the previous analysis, it can be concluded that there is a partially mediating effect of machinery input intensity on the environmental effect of apple production.
In summary, the mechanisms of fertilizer input intensity, pesticide input intensity, and machinery input intensity on farm size affecting the environmental effects of apple production were all verified. Among them, fertilizer input intensity had the most significant impact, followed by machinery input intensity, and pesticide input intensity did not have an effect.

4.4. Heterogeneity Test Based on Agricultural Cooperative Participation

In recent years, smallholder farmers in many developing countries have faced increasing challenges in their sustainable agricultural production regarding access to modern agricultural inputs, technologies, and markets [70]. To address these challenges, governments in many developing countries have promoted the formation of collective action groups by smallholder farmers to improve their production and marketing performance [71,72]. The emergence of agricultural cooperatives is widely recognized as an important institutional arrangement that can help overcome the constraints that prevent smallholder farmers in developing countries from taking advantage of agricultural production and marketing opportunities [18]. In the context of broad government policies, agricultural cooperatives have proliferated in China. Agricultural cooperatives have become the cornerstone of smallholder-market linkages [73] and have become the main force driving the modernization and intensification of Chinese agriculture [74]. Among the relevant studies on agricultural environmental pollution, it has been confirmed that participation in cooperatives is conducive to improving the specialization of farmers’ agricultural production and operation, regulating the use of agricultural materials such as fertilizers and pesticides and thus reducing the environmental burden [18,75]. However, under the research framework of the impact of farm size on environmental effects, whether the environmental effects will be heterogeneous due to the participation of cooperatives needs to be answered empirically. This study will test heterogeneity by using the direct effect as an example.
For the specific operation, the study’s sample was divided into two groups according to whether they participated in agricultural cooperatives or not, and the results of the heterogeneity test are shown in Table 9. It can be found that from the model (15), for the subgroup that joined the agricultural cooperative, farm size had a direct impact on the environmental effects of apple production; the estimated coefficient is −0.909 and with a significance at the 1% statistical level. For the subgroup that did not join the agricultural cooperative in the model (17), the estimated coefficient of farm size on the environmental effects of apple production is –0.511 and significant at the 5% statistical level. It can also be found that the regression coefficient changes from significant in model (16) to insignificant in model (18) after adding the squared term of farm size.
It is clear that the environmental effect of joining the agricultural cooperative subgroup is much higher than that of the subgroup not joining the cooperative both in terms of estimated coefficients and in terms of significance levels. In addition, it is worth noting that when based on the total sample in model (1), the coefficient of the direct effect of farm size on the environmental effects of apple production is −0.581 and is significant at the 1% statistical level. The comparison revealed that the environmental effects increased by 56.45% for the subgroup joining the agricultural cooperative compared to the one based on the total sample, suggesting that the improvement in the environmental effect was more significant for the farmers joining the agricultural cooperative. A reasonable explanation is that the farmers who joined the agricultural cooperative have to strictly follow the regulations of fertilization, pesticide spraying, irrigation in apple production, and daily management and therefore have a high degree of regulatory constraints. In addition, the agricultural cooperative usually provides a series of training activities that allow farmers to learn more about new technologies and methods, further improve their production specialization, and reduce unnecessary environmental pollutant emissions, so they are more sensitive to the improvement of environmental effects. On the contrary, for farmers who do not participate in agricultural cooperatives, their specialization degree in operating orchards is weaker, and the input of agricultural materials such as fertilizers, pesticides, and machinery is more random, so their farm size has less impact on the environmental effect.

5. Discussion

Global warming and climate change profoundly affect human survival and development. The negative environmental and human health effects have become a significant challenge common to the international community today. Although secondary and tertiary industries are the primary sources of environmental pollutant emissions, agricultural production activities cannot be ignored. Because agriculture is related to the issue of food security and the sustainable development of society, the concern about the negative environmental impact of agricultural production has triggered more and more discussions in the world. As China is a large country with a great population and a predominantly agricultural country, it has become a trend and inevitable to pay attention to the environmental sustainability of agricultural production while solving food security problems. Most studies have focused on the environmental concerns of field food crops (e.g., wheat, corn, rice, etc.) in China [49,76,77]. However, it cannot be ignored that economic crops such as vegetables and fruits depend more on chemical fertilizers and pesticides [78,79], and therefore, the environmental pollution caused by economic crop production must be taken into account. Furthermore, China is the world’s largest producer and consumer of apples, so the concern for apples is not only relevant to the sustainable production of apples in China but also has some international significance, as it can be contrasted with other countries in the world.
As for the measurement of environmental effects, most of the existing studies focus on one aspect of negative environmental effects, such as carbon emissions and carbon footprint [77], nitrogen and phosphorus pollution [78], gray water footprint [80], etc. A few scholars have also purposefully combined some of the negative environmental-impact categories as measurement indicators [81,82], while the appropriateness and rationality of the combination method need further consideration. Unlike the researches mentioned above, this study measures environmental emission indices from a life-cycle perspective, considering two phases of agricultural material production and farming and considering 15 midpoint indicators and 4 endpoint indicators simultaneously to improve the accuracy of the results.
Regarding the possible impact of farm size on the environmental effects, this study concludes that there is a U-shaped trend between the two, which is consistent with [63]. It indicates that from the perspective of environmental effects, the larger farm size is not better because beyond a certain level, the emissions of environmental pollutants caused by agricultural production will not continue to decrease but will tend to increase. The possible reason is that a moderate increase in farm size facilitates farmers’ adoption of new technologies such as efficient fertilizer and medicine application, thus enhancing the efficiency of chemical input factors and reducing environmental pollution [63]. However, when the scale of farmers’ land operation is excessively expanded, some adverse effects will be present. On the one hand, it will bring about severe labor shortages and high hiring costs, which can lead to the substitution effect of agricultural chemicals [83]. On the other hand, the pressure of excessive business risks may lead to adverse selection behavior for farmers seeking to maximize yields [84], which may be achieved by the intensive application of chemicals such as fertilizers and pesticides to increase profits. These negative influences offset the initial business expansion’s chemical reduction effect [77].
Among the specific mediating paths, this study finds that the impact of fertilizer input intensity is the largest, followed by the machinery impact, and the mediating effect of pesticides is insignificant. The results may strongly relate to the support and constraint policies for developing specialty agricultural products such as apples in China. In recent years, the Chinese government has enacted several policy measures to promote the apple industry’s high-quality development. The most widespread is the Action Program for Substituting Organic Fertilizers for Chemical Fertilizers. The former Ministry of Agriculture introduced the Action Program for Substituting Organic Fertilizers for Chemical Fertilizers for Fruit, Vegetable, and Tea in 2017 and firstly selected 100 pilot counties for substituting organic fertilizers for chemical fertilizers in China. The pilot counties increased to 200 in 2018. In 2020, the Ministry of Agriculture and Rural Affairs further emphasized the need to consolidate and expand the pilot results in the critical points of work in the planting industry. Under this series of policies, the proportion of apple growers adopting organic fertilizer application technology is increasing. Organic fertilizer application not only improves soil’s physical and chemical properties and organic matter content but also improves the quality of agricultural products. In addition, more importantly, it has a substitute effect on the use of pesticides [85]. Some sweeping changes in apple farmers’ production investment decisions come with Chinese government’s explicit action to ban the use of part of herbicides in apple yards. Hence, the potential for more use of organic fertilizers rather than pesticides in their production processes thereby lead to a fully mediating effect of fertilizer input intensity but not pesticide input intensity in the pathway of farm size on environmental effects. In addition, the conclusion that there is a mediating effect of machinery is consistent with the findings of [63].
Furthermore, the smallholder farmer in China today faces increasingly serious challenges, and revolutionary production and operation models are needed to meet these challenges. Agricultural cooperatives are receiving increasingly widespread attention as a new type of agricultural business entity. The results of this study show that farm size on the environmental performance of apple production is much better for farmers who join agricultural cooperatives than for those who do not. The conclusion coincides with existing studies’ that joining cooperatives is more conducive to promoting sustainable apple production [18,19].

6. Conclusions and Implications

Based on the field research data of 313 apple farmers in China, this study first measured the environmental pollutant emissions caused by apple production using the life-cycle assessment method. On this basis, a mediating effects model was constructed to empirically test the direct impact of farm size on environmental effects and the indirect impact of farm size on environmental effects through the mediation path of fertilizer, pesticide, and machinery input intensity. Finally, a heterogeneity analysis was conducted to clarify the impact of smallholder participation in agricultural cooperatives on environmental performance. The main findings of the study are as follows:
(1)
The system boundary of apple production was considered from the agricultural material production phase to the farming phase. It was found that the farming phase had a more significant negative environmental impact on the apple production system, with a contribution potential of 56.50%. After converting the 15 midpoint indicators considered to the 4 endpoint indicators of human health, ecosystem quality, climate change, and natural resource depletion, it was found that the apple production process caused the most significant negative impact on ecosystem quality.
(2)
Farm size directly impacts the environmental effects of apple production, and there is a U-shaped trend between the two. On the left side of the turning point U shape, the estimated coefficient of farm size on the environmental effects is negative and with a significance at the 5% statistical level. On the right side of the turning point, the estimated coefficient becomes positive but does not pass the statistical significance test, mainly because most decision units in the study sample belong to the left of the turning point.
(3)
There were mediating effects in the path of farm size on the environmental effects of apple production. In particular, the effect of fertilizer input intensity is the largest and identified as a fully mediating effect. The effect of machinery input intensity is the second largest and recognized as a partially mediating effect, with the mediating effect accounting for 15.50–15.89% of the total effect. The mediating effect of pesticide input intensity is not significant.
(4)
Joining agricultural cooperatives is beneficial to promoting the improvement of the negative environmental effects of apple production. The sensitivity of the environmental effects of farmers who joined agricultural cooperatives was much higher than that of farmers who did not join cooperatives both in terms of estimated coefficients and significance levels.
We have to admit the limitation of this study. It should be noted that the turning point of optimal farm size calculated in this study and the mechanism of mediating effects are based on the prerequisites of the study region’s land resource endowment and current production and operation patterns and investment structures of apple farmers. The large regional heterogeneity of apple production in different countries and regions may cause some interference to the regression results. Therefore, further analysis of the environmental problems caused by farm size on apple production in China and other countries and regions using global-scale data may be a future research direction.
According to the research results of this study, the implications are as follows:
Firstly, farmers should continuously improve their environmental awareness as direct operators of apple production. The ability to identify and adopt environmentally friendly agricultural materials should be fully exploited to force the production and supply of agricultural materials to meet their demand preferences in the farming phase. In turn, it promotes the improvement of agricultural environmental pollution emissions caused by apple production from the whole life-cycle perspective. In addition, farmers should recognize the fact that farm size does not necessarily follow the “bigger is better” concept. They should combine their family capital endowments of human and material resources to manage their apple orchards scientifically and reasonably so as to pay special attention to environmental effects while focusing on economic returns, thus contributing to the realization of the goal of sustainable development of the apple industry in China.
Secondly, the agricultural technology sector should increase the research, development, and promotion of new technologies to activate a long-term mechanism for their potential environmental improvement effects, such as the replacement of chemical fertilizers with organic fertilizers, installing insect trap lights to reduce pesticide use, and developing specialized machinery with clean fuels as demand. However, adopting these new technologies means farmers have to bear higher costs; furthermore, they have to take a series of risks brought about by uncertainty. As “rational economic people”, farmers will strengthen the use of new technologies when they can personally feel the benefits of new technologies. Therefore, some cash subsidies and other incentives should provide for farmers who first try the latest technology at the early stage of new technology promotion. Additionally, the publicity of the new technology should be increased to reduce the cost, then promote the adoption for farmers, and finally promote the release of the potential environmental improvement effect of new technology.
Thirdly, as an essential agricultural production organization and new business entity, agricultural cooperatives should further stimulate their demonstration and leading role in enhancing the standardization of apple production. On the one hand, cooperatives should strengthen and improve their own organizational system and business literacy, constantly improve their daily management norms, and play their due role in technical training and production standard setting; on the other hand, agricultural cooperatives should further play the role of bridging between farmers and the external environment by organizing experts and enterprise technicians to communicate with farmers, increasing training and teaching in the field to enhance farmers’ understanding of the latest technological achievements, stimulate their awareness of new technologies and methods, and promote farmers to apply advanced concepts to apple production, ultimately promoting the healthy and sustainable development of the apple industry.
Fourthly, government departments should further improve the regulatory mechanism of agricultural land, dynamically identify the influencing factors affecting the moderate scale of farming, and formulate differentiated policy measures for different business scale subjects. On the one hand, the government should select moderate-scale apple growers who can achieve lower environmental effects and tilt the special subsidies and credit support policies for them to ensure that low environmental pollutant emissions in their apple production is steady. On the other hand, the government should further strengthen the implementation of land transfer policies for non-moderate-scale apple growers with high environmental effects (too large or too small business scale) to promote the transfer of land out and in for apple growers with too large and too small a farm scale and improve the level of specialization in apple production in the main production areas, thus improving the environmental burden caused by apple production.

Author Contributions

Conceptualization, J.C., Q.W. and J.Y.; methodology, H.Z. and N.Y.; software, J.C.; validation, Q.W. and T.M.; formal analysis, J.C. and H.Z.; investigation, J.C. and Q.W.; resources, J.C.; data curation, H.Z. and N.Y.; writing—original draft preparation, J.C.; writing—review and editing, J.C., T.M. and J.Y.; visualization, Q.W.; supervision, J.Y.; project administration, Q.W.; funding acquisition, J.Y. All authors have read and agreed to the published version of the manuscript.

Funding

This research was funded by the National Key R&D Program of China (No. 2017YFE0181100); the Natural Science Foundation of China (No. 72203172, 71874139, 72274157); Shaanxi Philosophy and Social Science Office (No.2022R023); Fundamental Research Funds for the Central Universities (No. 262452021010); and College of Economics and Management in Northwest Agriculture and Forestry University Postgraduate Scientific Research Innovation Project (No. JGYJSCXXM202205).

Institutional Review Board Statement

Not applicable.

Informed Consent Statement

Informed consent was obtained from all subjects involved in the study.

Data Availability Statement

The data presented in this study are available on request from the corresponding author. The data are not publicly available due to data management.

Conflicts of Interest

The authors declare no conflict of interest.

References

  1. Ren, C.; Liu, S.; van Grinsven, H.; Reis, S.; Jin, S.; Liu, H.; Gu, B. The Impact of Farm Size on Agricultural Sustainability. J. Clean. Prod. 2019, 220, 357–367. [Google Scholar] [CrossRef]
  2. Lassaletta, L.; Billen, G.; Grizzetti, B.; Anglade, J.; Garnier, J. 50 Year Trends in Nitrogen Use Efficiency of World Cropping Systems: The Relationship between Yield and Nitrogen Input to Cropland. Environ. Res. Lett. 2014, 9, 105011. [Google Scholar] [CrossRef]
  3. Huang, J.; Yang, G. Understanding Recent Challenges and New Food Policy in China. Glob. Food Secur. 2017, 12, 119–126. [Google Scholar] [CrossRef]
  4. Khanali, M.; Kokei, D.; Aghbashlo, M.; Nasab, F.K.; Hosseinzadeh-Bandbafha, H.; Tabatabaei, M. Energy Flow Modeling and Life Cycle Assessment of Apple Juice Production: Recommendations for Renewable Energies Implementation and Climate Change Mitigation. J. Clean. Prod. 2020, 246, 118997. [Google Scholar] [CrossRef]
  5. Elahi, E.; Khalid, Z.; Tauni, M.Z.; Zhang, H.; Lirong, X. Extreme Weather Events Risk to Crop-Production and the Adaptation of Innovative Management Strategies to Mitigate the Risk: A Retrospective Survey of Rural Punjab, Pakistan. Technovation 2022, 117, 102255. [Google Scholar] [CrossRef]
  6. Razzaq, A.; Xiao, M.; Zhou, Y.; Anwar, M.; Liu, H.; Luo, F. Towards Sustainable Water Use: Factors Influencing Farmers’ Participation in the Informal Groundwater Markets in Pakistan. Front. Environ. Sci. 2022, 10, 944156. [Google Scholar] [CrossRef]
  7. Mohseni, P.; Borghei, A.M.; Khanali, M. Coupled Life Cycle Assessment and Data Envelopment Analysis for Mitigation of Environmental Impacts and Enhancement of Energy Efficiency in Grape Production. J. Clean. Prod. 2018, 197, 937–947. [Google Scholar] [CrossRef]
  8. Wang, X.; Chen, Y.; Sui, P.; Yan, P.; Yang, X.; Gao, W. Preliminary Analysis on Economic and Environmental Consequences of Grain Production on Different Farm Sizes in North China Plain. Agric. Syst. 2017, 153, 181–189. [Google Scholar] [CrossRef]
  9. Chuanmin, S.; Falla, J.S. Agro-Industrialization: A Comparative Study of China and Developed Countries. Outlook Agric. 2006, 35, 177–182. [Google Scholar] [CrossRef]
  10. Jiao, X.; Lyu, Y.; Wu, X.; Li, H.; Cheng, L.; Zhang, C.; Yuan, L.; Jiang, R.; Jiang, B.; Rengel, Z.; et al. Grain Production versus Resource and Environmental Costs: Towards Increasing Sustainability of Nutrient Use in China. J. Exp. Bot. 2016, 67, 4935–4949. [Google Scholar] [CrossRef]
  11. Sun, S.; Hu, R.; Zhang, C.; Shi, G. Do Farmers Misuse Pesticides in Crop Production in China? Evidence from a Farm Household Survey: Pesticide Misuse by Chinese Farmers. Pest Manag. Sci. 2019, 75, 2133–2141. [Google Scholar] [CrossRef]
  12. Unay Gailhard, İ.; Bojnec, Š. Farm Size and Participation in Agri-Environmental Measures: Farm-Level Evidence from Slovenia. Land Use Policy 2015, 46, 273–282. [Google Scholar] [CrossRef]
  13. Bojnec, Š.; Fertő, I. Farm Income Sources, Farm Size and Farm Technical Efficiency in Slovenia. Post-Communist Econ. 2013, 25, 343–356. [Google Scholar] [CrossRef]
  14. Velandia, M.; Rejesus, R.M.; Knight, T.O.; Sherrick, B.J. Factors Affecting Farmers’ Utilization of Agricultural Risk Management Tools: The Case of Crop Insurance, Forward Contracting, and Spreading Sales. J. Agric. Appl. Econ. 2009, 41, 107–123. [Google Scholar] [CrossRef] [Green Version]
  15. Bojnec, Š.; Latruffe, L. Farm Size, Agricultural Subsidies and Farm Performance in Slovenia. Land Use Policy 2013, 32, 207–217. [Google Scholar] [CrossRef]
  16. Key, N. Farm Size and Productivity Growth in the United States Corn Belt. Food Policy 2019, 84, 186–195. [Google Scholar] [CrossRef]
  17. Julien, J.C.; Bravo-Ureta, B.E.; Rada, N.E. Assessing Farm Performance by Size in Malawi, Tanzania, and Uganda. Food Policy 2019, 84, 153–164. [Google Scholar] [CrossRef]
  18. Cheng, J.; Wang, Q.; Li, D.; Yu, J. Comparative Analysis of Environmental and Economic Performance of Agricultural Cooperatives and Smallholder Farmers for Apple Production in China. Agriculture 2022, 12, 1281. [Google Scholar] [CrossRef]
  19. Ma, W.; Abdulai, A. Does Cooperative Membership Improve Household Welfare? Evidence from Apple Farmers in China. Food Policy 2016, 58, 94–102. [Google Scholar] [CrossRef]
  20. Wang, Q.; Li, F.; Yu, J.; Fleskens, L.; Ritsema, C.J. Price Decline, Land Rental Markets and Grain Production in the North China Plain. China Agric. Econ. Rev. 2020, 13, 124–149. [Google Scholar] [CrossRef]
  21. Rada, N.E.; Fuglie, K.O. New Perspectives on Farm Size and Productivity. Food Policy 2019, 84, 147–152. [Google Scholar] [CrossRef]
  22. Barrett, C.B.; Bellemare, M.F.; Hou, J.Y. Reconsidering Conventional Explanations of the Inverse Productivity–Size Relationship. World Dev. 2010, 38, 88–97. [Google Scholar] [CrossRef]
  23. Wang, J.; Chen, K.Z.; Das Gupta, S.; Huang, Z. Is Small Still Beautiful? A Comparative Study of Rice Farm Size and Productivity in China and India. China Agric. Econ. Rev. 2015, 7, 484–509. [Google Scholar] [CrossRef]
  24. Henderson, H. Considering Technical and Allocative Efficiency in the Inverse Farm Size-Productivity Relationship. J. Agric. Econ. 2015, 66, 442–469. [Google Scholar] [CrossRef]
  25. Carletto, C.; Savastano, S.; Zezza, A. Fact or Artifact: The Impact of Measurement Errors on the Farm Size–Productivity Relationship. J. Dev. Econ. 2013, 103, 254–261. [Google Scholar] [CrossRef]
  26. Noack, F.; Larsen, A. The Contrasting Effects of Farm Size on Farm Incomes and Food Production. Environ. Res. Lett. 2019, 14, 084024. [Google Scholar] [CrossRef]
  27. Ali, D.A.; Deininger, K. Is There a Farm Size–Productivity Relationship in African Agriculture? Evidence from Rwanda. Land Econ. 2015, 91, 317–343. [Google Scholar] [CrossRef]
  28. Deininger, K.; Jin, S.; Xia, F.; Huang, J. Moving Off the Farm: Land Institutions to Facilitate Structural Transformation and Agricultural Productivity Growth in China. World Dev. 2014, 59, 505–520. [Google Scholar] [CrossRef] [Green Version]
  29. Li, G.; Feng, Z.; You, L.; Fan, L. Re-Examining the Inverse Relationship between Farm Size and Efficiency: The Empirical Evidence in China. China Agric. Econ. Rev. 2013, 5, 473–488. [Google Scholar] [CrossRef]
  30. Adamopoulos, T.; Restuccia, D. The Size Distribution of Farms and International Productivity Differences. Am. Econ. Rev. 2014, 104, 1667–1697. [Google Scholar] [CrossRef]
  31. Syp, A.; Faber, A.; Borzecka-Walker, M.; Osuch, D. Assessment of Greenhouse Gas Emissions in Winter Wheat Farms Using Data Envelopment Analysis Approach. Pol. J. Environ. Stud. 2015, 24, 2197–2203. [Google Scholar] [CrossRef]
  32. Kagin, J.; Taylor, J.E.; Yúnez-Naude, A. Inverse Productivity or Inverse Efficiency? Evidence from Mexico. J. Dev. Stud. 2016, 52, 396–411. [Google Scholar] [CrossRef]
  33. Helfand, S.; Levine, E. Farm Size and the Determinants of Productive Efficiency in the Brazilian Center-West. Agric. Econ. 2004, 31, 241–249. [Google Scholar] [CrossRef]
  34. Restuccia, D.; Santaeulalia-Llopis, R. Land Misallocation and Productivity. SSRN Electron. J. 2015. [Google Scholar] [CrossRef] [Green Version]
  35. Ferreira, M.D.P.; Féres, J.G. Farm Size and Land Use Efficiency in the Brazilian Amazon. Land Use Policy 2020, 99, 104901. [Google Scholar] [CrossRef]
  36. Mettepenningen, E.; Vandermeulen, V.; Delaet, K.; Van Huylenbroeck, G.; Wailes, E.J. Investigating the Influence of the Institutional Organisation of Agri-Environmental Schemes on Scheme Adoption. Land Use Policy 2013, 33, 20–30. [Google Scholar] [CrossRef]
  37. Kansanga, M.; Andersen, P.; Kpienbaareh, D.; Mason-Renton, S.; Atuoye, K.; Sano, Y.; Antabe, R.; Luginaah, I. Traditional Agriculture in Transition: Examining the Impacts of Agricultural Modernization on Smallholder Farming in Ghana under the New Green Revolution. J. Sustain. Dev. World Ecol. 2019, 26, 11–24. [Google Scholar] [CrossRef]
  38. Wilson, G.A.; Hart, K. Financial Imperative or Conservation Concern? EU Farmers’ Motivations for Participation in Voluntary Agri-Environmental Schemes. Environ. Plan. Econ. Space 2000, 32, 2161–2185. [Google Scholar] [CrossRef]
  39. Wynn, G.; Crabtree, B.; Potts, J. Modelling Farmer Entry into the Environmentally Sensitive Area Schemes in Scotland. J. Agric. Econ. 2008, 52, 65–82. [Google Scholar] [CrossRef]
  40. Vanslembrouck, I.; Huylenbroeck, G.; Verbeke, W. Determinants of the Willingness of Belgian Farmers to Participate in Agri-Environmental Measures. J. Agric. Econ. 2002, 53, 489–511. [Google Scholar] [CrossRef]
  41. Pascucci, S.; de-Magistris, T.; Dries, L.; Adinolfi, F.; Capitanio, F. Participation of Italian Farmers in Rural Development Policy. Eur. Rev. Agric. Econ. 2013, 40, 605–631. [Google Scholar] [CrossRef]
  42. Mann, S. Farm Size Growth and Participation in Agri-Environmental Schemes: A Configural Frequency Analysis of the Swiss Case. J. Agric. Econ. 2005, 56, 373–384. [Google Scholar] [CrossRef]
  43. Defrancesco, E.; Gatto, P.; Runge, F.; Trestini, S. Factors Affecting Farmers? Participation in Agri-Environmental Measures: A Northern Italian Perspective. J. Agric. Econ. 2007, 59, 114–131. [Google Scholar] [CrossRef]
  44. Sattler, C.; Nagel, U.J. Factors Affecting Farmers’ Acceptance of Conservation Measures—A Case Study from North-Eastern Germany. Land Use Policy 2010, 27, 70–77. [Google Scholar] [CrossRef]
  45. Wu, Y.; Xi, X.; Tang, X.; Luo, D.; Gu, B.; Lam, S.K.; Vitousek, P.M.; Chen, D. Policy Distortions, Farm Size, and the Overuse of Agricultural Chemicals in China. Proc. Natl. Acad. Sci. USA 2018, 115, 7010–7015. [Google Scholar] [CrossRef] [Green Version]
  46. Zhu, Y.; Waqas, M.A.; Li, Y.; Zou, X.; Jiang, D.; Wilkes, A.; Qin, X.; Gao, Q.; Wan, Y.; Hasbagan, G. Large-Scale Farming Operations Are Win-Win for Grain Production, Soil Carbon Storage and Mitigation of Greenhouse Gases. J. Clean. Prod. 2018, 172, 2143–2152. [Google Scholar] [CrossRef]
  47. Todde, G.; Murgia, L.; Caria, M.; Pazzona, A. A Comprehensive Energy Analysis and Related Carbon Footprint of Dairy Farms, Part 2: Investigation and Modeling of Indirect Energy Requirements. Energies 2018, 11, 463. [Google Scholar] [CrossRef] [Green Version]
  48. ISO 14044; Environmental Management—Life Cycle Assessment—Requirements and Guidelines. The International Organization for Standardization: Geneve, Switzerland, 2006.
  49. Yang, X.; Sui, P.; Zhang, X.; Dai, H.; Yan, P.; Li, C.; Wang, X.; Chen, Y. Environmental and Economic Consequences Analysis of Cropping Systems from Fragmented to Concentrated Farmland in the North China Plain Based on a Joint Use of Life Cycle Assessment, Emergy and Economic Analysis. J. Environ. Manag. 2019, 251, 109588. [Google Scholar] [CrossRef]
  50. Wang, C.; Li, X.; Gong, T.; Zhang, H. Life Cycle Assessment of Wheat-Maize Rotation System Emphasizing High Crop Yield and High Resource Use Efficiency in Quzhou County. J. Clean. Prod. 2014, 68, 56–63. [Google Scholar] [CrossRef]
  51. Shen, X.; Zhang, L.; Zhang, J. Ratoon Rice Production in Central China: Environmental Sustainability and Food Production. Sci. Total Environ. 2021, 764, 142850. [Google Scholar] [CrossRef]
  52. Li, S.; Thompson, M.; Moussavi, S.; Dvorak, B. Life Cycle and Economic Assessment of Corn Production Practices in the Western US Corn Belt. Sustain. Prod. Consum. 2021, 27, 1762–1774. [Google Scholar] [CrossRef]
  53. González-García, S.; Almeida, F.; Moreira, M.T.; Brandão, M. Evaluating the Environmental Profiles of Winter Wheat Rotation Systems under Different Management Strategies. Sci. Total Environ. 2021, 770, 145270. [Google Scholar] [CrossRef]
  54. Skunca, D.; Tomasevic, I.; Nastasijevic, I.; Tomovic, V.; Djekic, I. Life Cycle Assessment of the Chicken Meat Chain. J. Clean. Prod. 2018, 184, 440–450. [Google Scholar] [CrossRef]
  55. Zira, S.; Rydhmer, L.; Ivarsson, E.; Hoffmann, R.; Röös, E. A Life Cycle Sustainability Assessment of Organic and Conventional Pork Supply Chains in Sweden. Sustain. Prod. Consum. 2021, 28, 21–38. [Google Scholar] [CrossRef]
  56. Gosalvitr, P.; Cuéllar-Franca, R.M.; Smith, R.; Azapagic, A. Integrating Process Modelling and Sustainability Assessment to Improve the Environmental and Economic Sustainability in the Cheese Industry. Sustain. Prod. Consum. 2021, 28, 969–986. [Google Scholar] [CrossRef]
  57. Cordes, H.; Iriarte, A.; Villalobos, P. Evaluating the Carbon Footprint of Chilean Organic Blueberry Production. Int. J. Life Cycle Assess. 2016, 21, 281–292. [Google Scholar] [CrossRef]
  58. Coltro, L.; Karaski, T.U. Environmental Indicators of Banana Production in Brazil: Cavendish and Prata Varieties. J. Clean. Prod. 2019, 207, 363–378. [Google Scholar] [CrossRef]
  59. Svanes, E.; Johnsen, F.M. Environmental Life Cycle Assessment of Production, Processing, Distribution and Consumption of Apples, Sweet Cherries and Plums from Conventional Agriculture in Norway. J. Clean. Prod. 2019, 238, 117773. [Google Scholar] [CrossRef]
  60. Alaphilippe, A.; Boissy, J.; Simon, S.; Godard, C. Environmental Impact of Intensive versus Semi-Extensive Apple Orchards: Use of a Specific Methodological Framework for Life Cycle Assessments (LCA) in Perennial Crops. J. Clean. Prod. 2016, 127, 555–561. [Google Scholar] [CrossRef]
  61. Annaert, B.; Goossens, Y.; Geeraerd, A.; Mathijs, E.; Vranken, L. Calculating Environmental Cost Indicators of Apple Farm Practices Indicates Large Differences between Growers. Int. J. Agric. Sustain. 2017, 15, 527–538. [Google Scholar] [CrossRef]
  62. Zhu, Z.; Jia, Z.; Peng, L.; Chen, Q.; He, L.; Jiang, Y.; Ge, S. Life Cycle Assessment of Conventional and Organic Apple Production Systems in China. J. Clean. Prod. 2018, 201, 156–168. [Google Scholar] [CrossRef]
  63. Ma, X.; Che, X.; Li, N.; Tang, L. Has Cultivated Land Transfer and Scale Operation Improved the Agricultural Environment? An Empirical Test on Impact of Cultivated Land Use on Agricultural Environment Efficiency. Land Sci. China 2019, 33, 62–70. [Google Scholar] [CrossRef]
  64. Liu, Q.; Xiao, H. The Impact of Farmland Management Scale and Fiscal Policy for Supporting Agriculture on Agricultural Carbon Emission. Resour. Sci. 2020, 42, 1063–1073. [Google Scholar] [CrossRef]
  65. Xue, J.-F.; Pu, C.; Liu, S.-L.; Zhao, X.; Zhang, R.; Chen, F.; Xiao, X.-P.; Zhang, H.-L. Carbon and Nitrogen Footprint of Double Rice Production in Southern China. Ecol. Indic. 2016, 64, 249–257. [Google Scholar] [CrossRef]
  66. Yuan, S.; Cassman, K.G.; Huang, J.; Peng, S.; Grassini, P. Can Ratoon Cropping Improve Resource Use Efficiencies and Profitability of Rice in Central China? Field Crops Res. 2019, 234, 66–72. [Google Scholar] [CrossRef]
  67. Saber, Z.; van Zelm, R.; Pirdashti, H.; Schipper, A.M.; Esmaeili, M.; Motevali, A.; Nabavi-Pelesaraei, A.; Huijbregts, M.A.J. Understanding Farm-Level Differences in Environmental Impact and Eco-Efficiency: The Case of Rice Production in Iran. Sustain. Prod. Consum. 2021, 27, 1021–1029. [Google Scholar] [CrossRef]
  68. Baron, R.M.; Kenny, D.A. The Moderator–Mediator Variable Distinction in Social Psychological Research: Conceptual, Strategic, and Statistical Considerations. J. Pers. Soc. Psychol. 1986, 51, 1173–1182. [Google Scholar] [CrossRef]
  69. Preacher, K.J.; Hayes, A.F. Asymptotic and Resampling Strategies for Assessing and Comparing Indirect Effects in Multiple Mediator Models. Behav. Res. Methods 2008, 40, 879–891. [Google Scholar] [CrossRef]
  70. Ma, W.; Zheng, H.; Yuan, P. Impacts of Cooperative Membership on Banana Yield and Risk Exposure: Insights from China. J. Agric. Econ. 2022, 73, 564–579. [Google Scholar] [CrossRef]
  71. Fischer, E.; Qaim, M. Linking Smallholders to Markets: Determinants and Impacts of Farmer Collective Action in Kenya. World Dev. 2012, 40, 1255–1268. [Google Scholar] [CrossRef]
  72. Abebaw, D.; Haile, M.G. The Impact of Cooperatives on Agricultural Technology Adoption: Empirical Evidence from Ethiopia. Food Policy 2013, 38, 82–91. [Google Scholar] [CrossRef]
  73. Zhong, Z.; Zhang, C.; Jia, F.; Bijman, J. Vertical Coordination and Cooperative Member Benefits: Case Studies of Four Dairy Farmers’ Cooperatives in China. J. Clean. Prod. 2018, 172, 2266–2277. [Google Scholar] [CrossRef]
  74. Lu, H.; Xie, H.; Lv, T.; Yao, G. Determinants of Cultivated Land Recuperation in Ecologically Damaged Areas in China. Land Use Policy 2019, 81, 160–166. [Google Scholar] [CrossRef]
  75. Deng, L.; Chen, L.; Zhao, J.; Wang, R. Comparative Analysis on Environmental and Economic Performance of Agricultural Cooperatives and Smallholder Farmers: The Case of Grape Production in Hebei, China. PLoS ONE 2021, 16, e0245981. [Google Scholar] [CrossRef] [PubMed]
  76. Feng, Y.; Zhang, Y.; Li, S.; Wang, C.; Yin, X.; Chu, Q.; Chen, F. Sustainable Options for Reducing Carbon Inputs and Improving the Eco-Efficiency of Smallholder Wheat-Maize Cropping Systems in the Huanghuaihai Farming Region of China. J. Clean. Prod. 2020, 244, 118887. [Google Scholar] [CrossRef]
  77. Zhang, L.; Luo, B. Agricultural Downsizing: The Logic of Scale in Farming and Its Evidence. Chinas Rural Econ. 2020, 2, 81–99. [Google Scholar]
  78. Zhang, F.; Huo, M.; Song, X.; Wang, H. Spatial Clustering Analysis of Production Efficiency Based on SBM and Malmquist Index in Major Apple Producing Areas of China. J. Agric. Econ. 2017, 5, 57–66. [Google Scholar] [CrossRef]
  79. Zhan, J.; Zhang, H.; Chen, C. The Analysis of Efficiency Measurement of Pesticide Application Forfruit Growers and the Driving Force to Reduce Misallocation: Empirical Analysis: Based on 524 Peach Farmers from 85 Production Counties in China. J. Nanjing Agric. Univ. Soc. Sci. Ed. 2020, 20, 148–156. [Google Scholar] [CrossRef]
  80. Wang, S.; Lin, Y. Spatial Evolution and Its Drivers of Regional Agro-Ecological Efficiency in China’s from the Perspective of Water Footprint and Gray Water Footprint. Sci. Geogr. Sin. 2021, 41, 290–301. [Google Scholar] [CrossRef]
  81. Tian, X.; Wang, S. Environmental Efficiency and Its Determinants Regarding China’s Grain Production. Resour. Sci. 2016, 38, 2106–2116. [Google Scholar] [CrossRef]
  82. Yang, Y.; Wang, S.; Wang, H. Evaluation of Environmental Efficiency of Maize Production in Northeast China Based on Dynamic DEA. J. Agric. Econ. 2016, 8, 58–71. [Google Scholar] [CrossRef]
  83. Yang, J.; Xiang, C.; Zhang, X. The Division of Labor in Chinese Agricultural: Based on Production Service Outsourcing Perspective. J. Huazhong Univ. Sci. Technol. Soc. Sci. Ed. 2019, 33, 45–55. [Google Scholar] [CrossRef]
  84. Peng, X. Benefit Mechanism of Agricultural Service Scale Operation. Agric. Econ. Quest. 2019, 9, 74–84. [Google Scholar] [CrossRef]
  85. Zhao, Z.; Yan, S.; Liu, F.; Ji, P.; Wang, X.; Tong, Y. Effects of Chemical Fertilizer Combined with Organic Manure on Fuji Apple Quality, Yield and Soil Fertility in Apple Orchard on the Loess Plateau of China. Int. J. Agric. Biol. Eng. 2014, 7, 45–55. [Google Scholar] [CrossRef]
Figure 1. Locations of the study area.
Agriculture 12 01800 g001
Figure 2. Characterized environmental impacts at different phases.
Agriculture 12 01800 g002
Table 1. Summary of variables affected by farm size in agriculture.
VariablesRelationshipReferences
Crop yield[22,23,24]
Household income+[26]
Unit costs+[8]
Economic profit[27]
Labor efficiency−/+[28,29]/[30]
Technical efficiency+/−/U-shaped/inverted U-shaped[13,31]/[32]/[33]/[24]
Allocated efficiencyAmbiguous[15]
Economic efficiency+[15]
Land use efficiencyU-shaped[35]
Total factor productivity+/−/U-shaped[16]/[17]/[21]
Agri-environmental measures+/−/Ambiguous[36,37,38]/[39,40,41]/[42,43]
Agrochemical inputs[44]
Soil carbon storage+[45]
CO2 emissions[46]
Environmental-impact index[8]
Note: “/” used to divide different groups.
Table 2. Summary of the profile and apple production characteristics of study area in 2020.
ItemsBaishui CountyQingcheng County
ProvinceShaanxi ProvinceGansu Province
Ranges109°16′–109°45′ E
and 35°4′–35°27′ N
107°16′–108°05′ E
and 35°42′–36°17′ N
Average annual temperature11.4 °C9.4 °C
Average annual precipitation577.8 mm537.5 mm
Total planting area36,700 hectares28,600 hectares
Ultimate production530,000 tons200,000 tons
Table 3. Definition of variables and descriptive statistics.
Variable CategoryVariable NameVariable DefinitionMeanStd. DevMin.Max.
Dependent variableEnvironmental effectsEnvironmental-impact index calculated based on LCA method429.92279.5173.501800.00
Independent variablesFarm sizeActual area of apple orchards operated (ha)0.500.290.032.00
Intermediary variableFertilizer input intensityAmount of fertilizer use (kg/ha)1599.671099.01112.506592.50
Pesticide input intensityAmount of pesticide use (kg/ha)20.0315.710.00150.00
Machinery input intensityAmount of diesel use (kg/ha)398.97404.760.002645.63
Control variablesAgeActual age of household head (year)56.658.4022.0080.00
Education levelActual years of education of household head (year)7.892.430.0016.00
Population sizeTotal number of family members (number) 3.951.621.0010.00
Specialization levelApple income as a share of total household income (%)0.560.260.101.00
Number of training sessions Total number of training sessions attended by principal operators (number)2.891.890.009.00
Tree age Actual age of apple trees (year)17.509.843.0040.00
Soil quality Self-assessment of soil quality by major operators (1–5)3.021.021.005.00
Land fragmentationActual number of apple orchard plots operated (plot)1.750.811.005.00
Low carbon awareness Low carbon awareness of major operators (1–5)3.541.231.005.00
Distance Distance of residence from the nearest county town (km)23.7414.454.0060.00
Subgroup variableAgricultural cooperativeWhether to join agricultural cooperatives (yes = 1/no = 0)0.310.460.001.00
Table 4. Regression results of the direct impact of farm size on the environmental effects.
Dependent Variable: Environmental Effects
Model (1)Model (2)
Coef.Std.Coef.Std.
Farm size−0.581 ***0.196−1.185 ** (0.527)0.527
Square of farm size0.025 (0.021)0.021
Age0.0780.0850.0730.085
Education level−0.818 ***0.307−0.827 ***0.307
Population size−2.054 ***0.467−2.011 ***0.468
Specialization level−14.957 ***3.112−14.505 ***3.130
Number of training sessions−0.912 **0.406−0.936 **0.406
Tree age 0.199 ***0.0740.209 ***0.075
Soil quality −3.377 ***0.764−3.321 ***0.764
Land fragmentation4.959 ***1.0405.179 ***1.052
Low carbon awareness−1.385 **0.622−1.441 **0.622
Distance0.0360.0480.0350.048
Constant term61.353 ***7.84363.833 ***8.080
Prob > chi20.0000.000
Pseudo R20.0610.061
Sample capacity313313
Note: *** and ** represent significant at the 1% and 5% statistical levels, respectively; — indicates not applicable.
Table 5. Test results of mediating effects of fertilizer input intensity.
Dependent Variable: Fertilizer Input IntensityDependent Variable: Environmental Effects
Model (3)Model (4)Model (5)Model (6)
Farm size−2.239 *** (0.810)−4.716 ** (2.184)−0.141 (0.119)−0.255 (0.321)
Square of farm size0.104(0.085)0.005 (0.013)
Fertilizer input intensity0.181 *** (0.006)0.181 *** (0.006)
Constants and control variablesControlledControlledControlledControlled
Note: *** and ** represent significant at the 1% and 5% statistical levels, respectively; — indicates not applicable.
Table 6. Test results of mediating effects of pesticide input intensity.
Dependent Variable: Pesticide Input IntensityDependent Variable: Environmental Effects
Model (7)Model (8)Model (9)Model (10)
Farm size−0.010 (0.011)−0.032 (0.031)−0.525 *** (0.185)−0.995 ** (0.501)
Square of farm size0.001 (0.001)0.020 (0.020)
Pesticide input intensity4.655 *** (0.675)4.626 *** (0.675)
Constants and
control variables
ControlledControlledControlledControlled
Note: *** and ** represent significant at the 1% and 5% statistical levels, respectively; — indicates not applicable.
Table 7. Test results of mediating effects of machinery input intensity.
Dependent Variable: Machinery Input IntensityDependent Variable: Environmental Effects
Model (11)Model (12)Model (13)Model (14)
Farm size−0.866 *** (0.271)−1.846 ** (0.728)−0.437 ** (0.196)−0.882 * (0.524)
Square of farm size0.041 (0.028)0.019 (0.020)
Machinery input intensity0.104 *** (0.026)0.102 *** (0.026)
Constants and
control variables
ControlledControlledControlledControlled
Note: ***, ** and * represent significant at the 1%, 5% and 10% statistical levels, respectively; — indicates not applicable.
Table 8. Results of the robustness test for mediating effects based on the bootstrap method.
Intermediary VariableBootstrap Test IndicatorsObserved Coef.Normal-Based (95% Conf. Interval)Intermediary Effect Type
Fertilizer input intensity_bs_1−0.538 *** (0.178)−0.886−0.190Full mediating effect
_bs_2−0.150 * (0.091)−0.3280.028
Pesticide input intensity_bs_1−0.076 (0.067)−0.2080.056No mediating effect
_bs_2−0.613 *** (0.177)−0.960−0.266
Machinery input intensity_bs_1−0.174 ** (0.083)−0.336−0.012Partial mediating effect
_bs_2−0.514 ** (0.200)−0.907−0.122
Note: ***, ** and * represent significant at the 1%, 5% and 10% statistical levels, respectively; — indicates not applicable.
Table 9. Results of the heterogeneity test based on cooperative participation.
Dependent Variable: Environmental Effects
Join An Agricultural CooperativeNot Join An Agricultural Cooperative
Model (15)Model (16)Model (17)Model (18)
Farm size−0.909 *** (0.345)−2.337 *** (0.826)−0.511 ** (0.234)−0.856 (0.690)
Square of farm size0.056 * (0.030)0.015 (0.028)
Constants and
control variables
ControlledControlledControlledControlled
Sample capacity9797216216
Note: ***, ** and * represent significant at the 1%, 5% and 10% statistical levels, respectively; — indicates not applicable.
Publisher’s Note: MDPI stays neutral with regard to jurisdictional claims in published maps and institutional affiliations.

