Article

Grassland Reseeding: Impact on Soil Surface Nutrient Accumulation and Using LiDAR-Based Image Differencing to Infer Implications for Water Quality

1
Geography, School of Natural and Built Environment, Queen’s University Belfast, Belfast BT7 1NN, Northern Ireland, UK
2
Agri-Food and Biosciences Institute, Belfast BT9 59X, Northern Ireland, UK
3
Northern Rivers Institute, School of Geosciences, University of Aberdeen, Aberdeen AB24 3UE, Scotland, UK
*
Author to whom correspondence should be addressed.
Agriculture 2022, 12(11), 1854; https://doi.org/10.3390/agriculture12111854
Submission received: 13 October 2022 / Revised: 31 October 2022 / Accepted: 2 November 2022 / Published: 4 November 2022

Abstract

:
Long-term phosphorus (P) accumulation in agricultural soils presents a challenge for water quality improvement. P is commonly elevated in soils managed for intensive livestock production due to repeated overapplication of slurry and fertilisers. High legacy nutrient accumulations result in poor water quality via transport pathways such as surface runoff, subsurface drainage, and soil erosion. To achieve environmental water quality targets, improved management strategies are required for targeting and reducing excess agricultural P sources. Reseeding of old swards is known to improve grassland productivity and enhance overall soil health. However, soil disturbance associated with reseeding could have positive and negative impacts on other soil functions that affect the nutrient balance (including improved microbial activity, but also increasing the potential for sediment and nutrient losses). This study investigates the impact of reseeding and inversion tillage in addressing soil surface nutrient surpluses and identifies potential trade-offs between production, environment (through soil erosion and associated sediment and nutrient losses), and soil health. At a study site in the Blackwater catchment in Northern Ireland, we collected high-resolution (35 m) gridded soil samples pre- and post-reseeding for nutrient analyses and combined this with GIS-based interpolation. We found that decreases in sub-field scale surface nutrient content (0–7.5 cm depth) occurred following tillage and reseeding, but that this was spatially variable. In addition, the magnitude of changes in nutrient content was variable between P and other sampled nutrients. LiDAR-based image differencing indicated variability in the magnitude of soil erosion and sediment loss also at sub-field scale. Information on the identified deposition and erosion zones (from LiDAR analysis) was combined with mass wasting data to determine accumulation rates and losses of nutrients in-field and confirmed some of the identified patterns in soil surface nutrient content changes post-reseeding. We conclude that while inversion tillage and reseeding are essential agricultural practices, environmental trade-offs exist through potential nutrient and sediment losses. LiDAR-based image differencing was found to be a useful tool in helping to quantify these risks. Quantifying sediment and nutrient losses as a result of inversion tillage and reseeding induced soil erosion aids in understanding potential trends in water quality statuses.

1. Introduction

Agricultural soils in intensively farmed livestock systems commonly contain elevated soil nutrient content above the agronomic optimum [1]. These systems, typical of Northwest Europe, focus on grassland agriculture with animal grazing or silage production as the predominant activities. Permanent grasslands undergo repeated fertiliser and slurry applications (with nutrient-rich slurry derived from livestock-enhanced feedstocks), often supplying nutrients in excess of plant uptake requirements. In these scenarios, nutrients tend to accumulate over time at the soil surface, which is the interaction zone that controls the leaching of runoff fractions [2,3]. Soil phosphorus (P) accumulation is of concern as P poses a higher risk to contribute to eutrophication and poor water quality through P-based losses from soil erosion (such as fractions like particulate P or total soluble P), surface runoff, or subsurface field drainage pathways [4]. Research has demonstrated that wide sub-field scale variability exists in soil nutrient content [5].
In situations where soil P content is high or excessive, current advice tends to revolve around switching to zero-P fertiliser and reducing or eliminating slurry and manure applications [6]. However, the draw-down of legacy P is a long, slow process with studies reporting that it could take between 23 and 44 years for high P soils to decline to a level that corresponds to an overland flow concentration of P of 0.02 mg L−1 (limit beyond which rivers are at risk from eutrophication) [4,6,7]. The draw-down in silage fields is more rapid than in grazing systems, owing to higher nutrient uptake in a silage scenario and nutrient return via grazing animal excretion, which is often highly spatially variable and a major contributing factor to nutrient hotspots within fields [8]. Complexities arise because of the difference in the ability of farms to implement such programs given the need to utilise slurries from the farmyard. Developing techniques to rapidly reduce soil P content in agricultural accumulation zones, whilst minimizing environmental or agricultural productivity issues, is vital.
Sediment losses in permanent grassland systems tend to be lower compared to arable areas, with studies recording sediment losses of 0.17–1.38 t. ha−1 yr−1 [9,10]. Pulley and Collins [11] suggested that whilst grassland inversion tillage and reseeding are required to maintain and improve agricultural productivity, this can lead to considerable sediment and associated nutrient losses. Previous research has highlighted the potential for reseeding to reduce soil surface P through the actions of ploughing and grass re-growth, causing vertical stratification of soil P and increased P uptake [2,12,13]. However, exploring the trade-offs between the actions of tillage and reseeding in terms of reducing surplus soil surface nutrient content, and potential sediment and nutrient losses through soil disturbance is required. LiDAR data present a novel way to quantify soil erosion rates, operating at multiple spatial and temporal scales, and allow the calculation of sediment and nutrient losses associated with tillage-induced soil erosion to determine potential loading rates to nearby waterways [14].
This paper aims to explore the change in soil surface nutrient accumulations (P, K, Mg, S) content, soil pH, total C (%) and total N (%) as a result of inversion tillage and reseeding at a permanent grassland site. In addition, we explore the use of LiDAR image differencing to quantify the occurrence of soil erosion and associated losses of sediment and nutrients to surrounding waterways following reseeding to determine the potential effects of this agricultural activity on contributing to poor water quality through high incidental losses of nutrients and sediment.

2. Methods

2.1. Study Catchment

The cross-border Blackwater catchment (Figure 1)—located between Northern Ireland (NI) and the Republic of Ireland (ROI)—covers an area of 1480 km2 with 90% of land use classed as agricultural (arable) [15]. As the Blackwater represents an intensively farmed area, this provides an opportunity to identify issues surrounding water quality from a nutrient perspective for use in other regions. Within the island of Ireland, soils commonly contain legacy nutrient accumulations that contribute significant quantities of nutrients to waterways due to excessive post-war application rates of slurry and fertilisers due to the intensification of agriculture [16]. Grasslands tend to be reseeded on an infrequent basis due to several reasons, such as costs and concerns surrounding the periods associated with land removal from productivity. The frequency of reseeding is commonly once every ten years or more, unless in a grass-arable rotation.
This study focuses on one specific field, which is typical for the region (0.7 ha, average slope gradient of 8.36°, with stagnosols as the predominant soil type, with average soil porosity of 35.60%, and agricultural activities of grass silage and cattle grazing). This field underwent tillage and reseeding in April 2020, for the first time since December 1985. No fertilizer/slurry applications were made to coincide with the reseeding in April 2020. Tillage was shallow (at a depth of 15 cm) using a chisel plough. Reseeding took place 10 days after tillage with a botanical composition of perennial ryegrasses with medium leaf white clover cultivars with an aim for >25% sward composition as white clover. Whilst no major soil erosion events occurred, noticeable areas of exposed soil were present in June 2020 as shown in Figure 1, suggesting sediment movement had occurred to some degree. Previous research showed the existence of extensive LiDAR-derived surface runoff flow pathways based on the microtopography of the field, suggesting that pre-existing flow pathways existed for sediment and nutrient transfer [5].

2.2. Assessing the Change in Soil Surface Nutrient Accumulations following Grassland Reseeding

Soil Sampling and GIS-Based Analysis

Soil samples were collected on a 35 m grid, giving six individual sampling locations across the field. At each sampling location, 20–30 cores were collected using a 7.5 cm depth auger to produce one bulked sample per point [17]. Changes in sub-field scale nutrient content (P, K, Mg, S) and soil organic matter content (via loss on ignition) were explored before and after reseeding along with changes in soil total C (%) and soil total N (%). This grid interval was determined as the best compromise between maintaining sampling efficiency and interpolation accuracy, whilst also providing information on the degree of nutrient variability at the sub-field scale [18]. Sampling occurred under otherwise comparable conditions, but before reseeding in January 2020 and after reseeding in February 2021.
Samples were air-dried at 30 °C and sieved through a 2 mm aperture sieve before undergoing analysis for the nutrients of plant-available phosphorus (P), potassium (K), magnesium (Mg), and sulphur (S). Soil pH was also determined. P, K, and Mg were determined using methodologies stated in MAFF [19]. S was determined following a methodology in Islam and Bhuijan [20]. Presented results focus on the nutrient index (UK system), which classifies soil nutrient content as either deficient (indices 0–1), optimum (index 2, split as indices 2− and 2+ for P and K), or excessive (indices greater than 3) [21]. To determine soil total C (%) and soil total N (%), soil samples were sieved through a 2 mm mesh, air-dried, and ground to <150 µm followed by analysis using a LECO Trumac CN Analyser. Soil pH was measured using a Metrohm automated pH system, incorporating a combined pH electrode with a sleeve diaphragm.
The spatial variability in soil nutrients at the sub-field scale was described via geostatistical interpolation and kriging. This is a local estimator based on a continuous model of stochastic spatial variation to explore a property’s spatial variation in line with the variogram [22]. Ordinary kriging was used to generate a continuous surface of soil nutrient index values using the Ordinary Kriging spatial analyst tool in ArcMap 10.5. Interpolated figures allow the visualisation of changes in soil nutrient content following tillage and reseeding. Calculations are provided comparing the difference in soil nutrient content before and after reseeding, and whether this represented an increase or decrease in soil nutrient content.

2.3. Determining Soil Erosion Rates Associated with Grassland Inversion Tillage and Reseeding

To quantify sediment and nutrient losses associated with grassland inversion tillage and reseeding, LiDAR image differencing (datasets from 2014 and 2021) was performed in ArcMap 10.5. Based on the management history of the field, it was known that soil erosion was not a regular occurrence, and it was assumed that changes in soil surface elevation values would represent erosion (or deposition occurrence) as a result of tillage inversion and associated sediment movement.
To explore potential controlling factors on soil erosion occurrence, volumetric soil moisture content was obtained from cosmic ray neutron data provided by the COSMOS monitoring network at Fivemiletown. It is located within the Blackwater catchment (c. 14 miles from study site) under similar agricultural and catchment characteristics as the study sites. Daily volumetric soil moisture content values were averaged to obtain monthly mean soil moisture data. Monthly rainfall data were taken from the Met Office Armagh monitoring station (c. 17 miles from study site), also located within the Blackwater catchment. Together, these data allowed us to compare the occurrence of soil erosion with prevailing meteorological and soil hydrological conditions. Research by Pulley and Collins [11] concluded that higher sediment losses occurred for reseeding events taking place during the winter period due to increased rainfall and soil saturation.

2.3.1. Bulk Density Sampling and Sediment Mass Wasting Rates

Bulk density samples were collected before and after reseeding on 11 March 2021 and 28 March 2022, no significant differences were present in bulk density values. Analysis focuses on the four soil samples collected and analysed on the 28 March 2022 using aluminium core rings with a volume of 222 cm3. Bulk density was determined in the laboratory following Cresswell and Hamilton (2002) [23]. Average bulk density values (0.84 g cm−3) were used in conjunction with volume change rates to determine sediment mass wasting rates of erosion and deposition occurrence.

2.3.2. Nutrient Losses Associated with Soil Erosion

To determine nutrient losses, information on the amount of sediment available for potential transport (i.e., primarily eroded fractions that were not deposited) were combined with information on relevant 35 m gridded soil sampling points located on corresponding areas of erosion. This also allowed for calculation of deposition accumulation values. Average soil nutrient content was determined based on the relevant gridded soil sampling points. It should be noted that nutrient loss values specified in table rows (Table 5 in Section 3.2) corresponding to the identified deposition zone indicate the nutrient content deposited in association with sediment accumulation in this zone.
For the site, as grassland establishment occurred from April 2020 to the winter period of 2020–2021, soil nutrient losses were based on soil sampling conducted before reseeding as nutrient uptake by grassland growth may have occurred during the period from reseeding to repeated soil sampling in 2020–2021.

2.3.3. LiDAR-to-LiDAR Comparisons

LiDAR-to-LiDAR comparisons were made between 2014 and 2021 airborne LiDAR DTM datasets, accurate to ±0.15 m (2014 OSNI DTM available via OpenData NI and 2021 BlueSky DTM) and to increase the time covered between scans, reducing system noise [24]. The datasets were available as uniform 1 m DTM files imported into ArcMap 10.5.
The 2014 dataset provided a baseline date from which to calculate sediment movement, with image differencing performed using the raster calculator function of “2021_DTM–2014_DTM”. Positive values indicated deposition occurrence and negative values indicated erosion occurrence. Rasters covering specific areas of soil erosion and deposition were extracted using the function “extract by attribute”.

2.3.4. Calculation of Soil Erosion Rates and Nutrient Accumulation and/or Losses

The zonal statistics tool was used to calculate the overall sum of mass wasting, multiplying this value by average bulk density to determine soil erosion in identified erosion rasters, and to determine sediment accumulation rates in identified deposition rasters. Using the information on the spatial area covered by these specific zones, erosion, deposition rates, and associated nutrient losses/accumulation rates (calculated by the multiplication of mass wasting rates by the average of specific grid points corresponding to each identified zone) were presented on a comparable per hectare scale.
As it was evident that both erosion and deposition were occurring, it is likely that not all sources of sediment and nutrients transported by soil erosion enter waterways. Therefore, quantified values of nutrient losses or accumulation rates in deposition zones should be assumed to be the maximum possible rather than the absolute. To understand the specific loading rates of sediment and nutrients into waterways, differences between the rate of erosion and associated deposition rates were considered in terms of sediment and nutrients potentially deposited in-field again.

3. Results

3.1. Effects of Grassland Reseeding on Sub-Field Scale Nutrient Variability

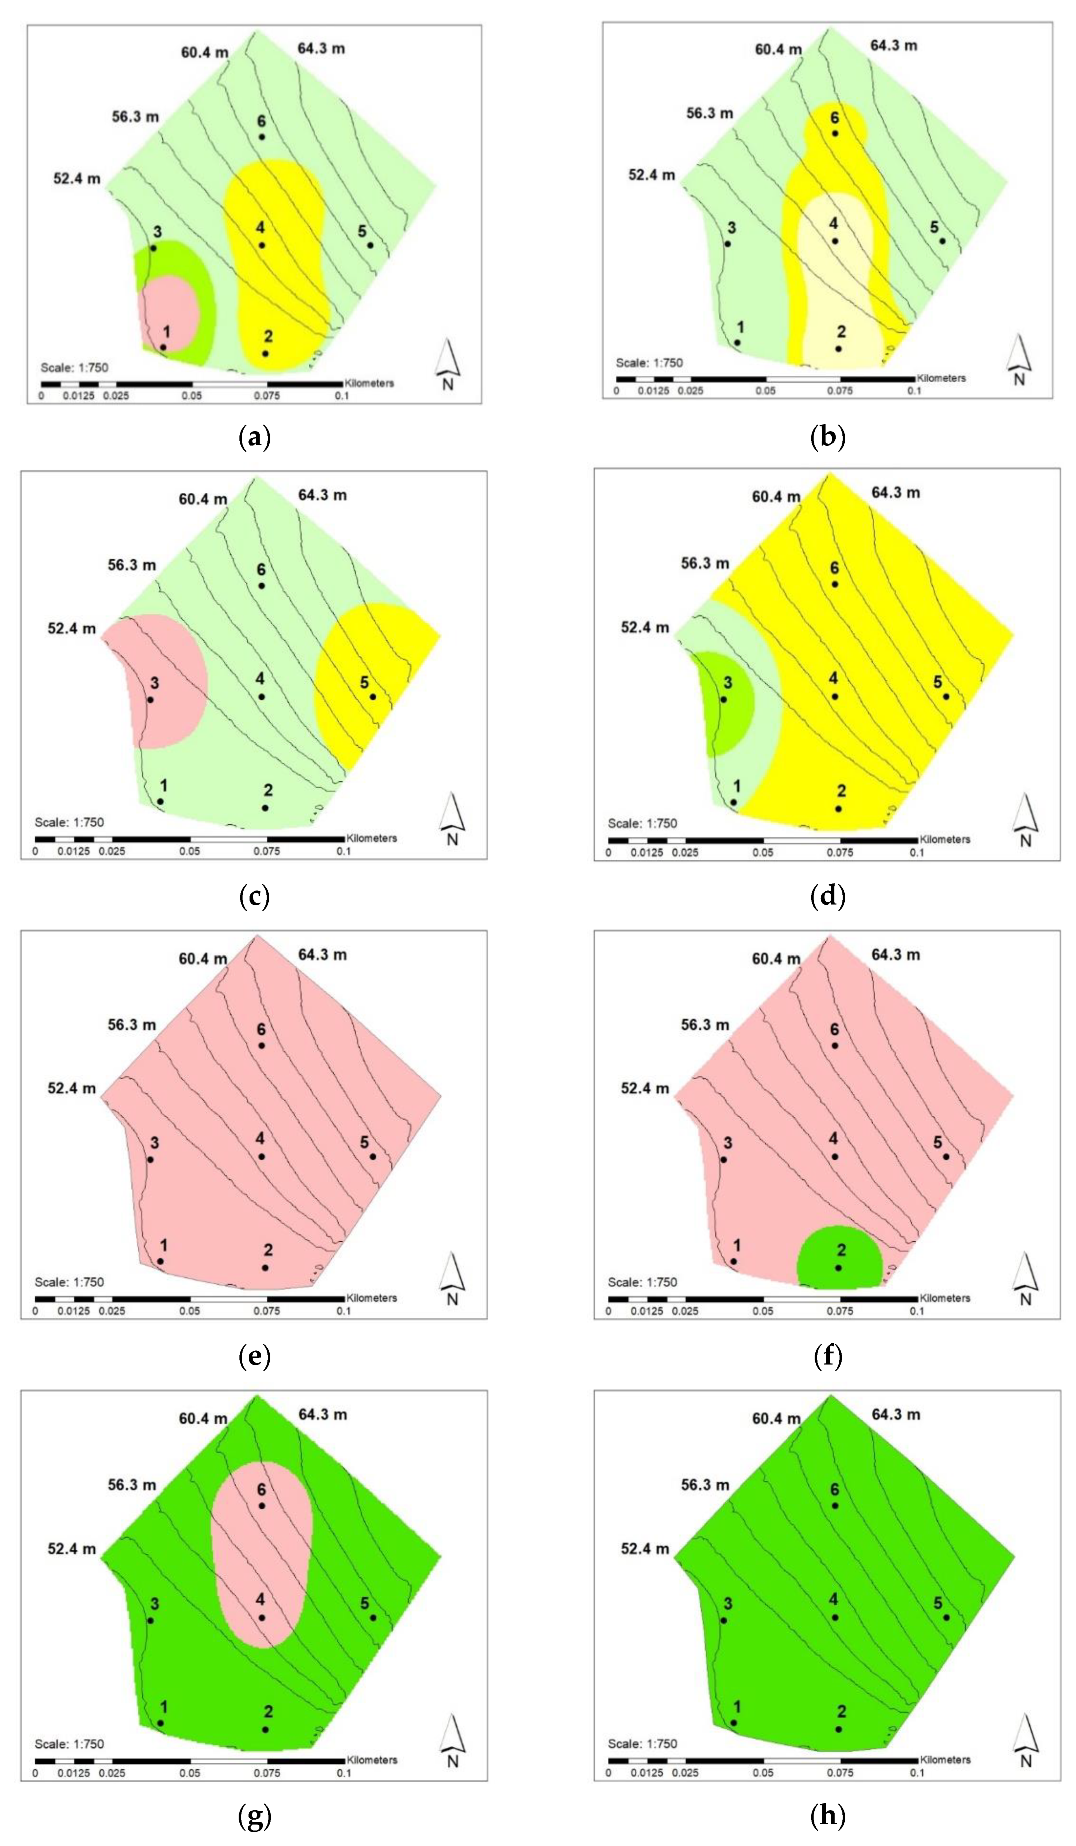
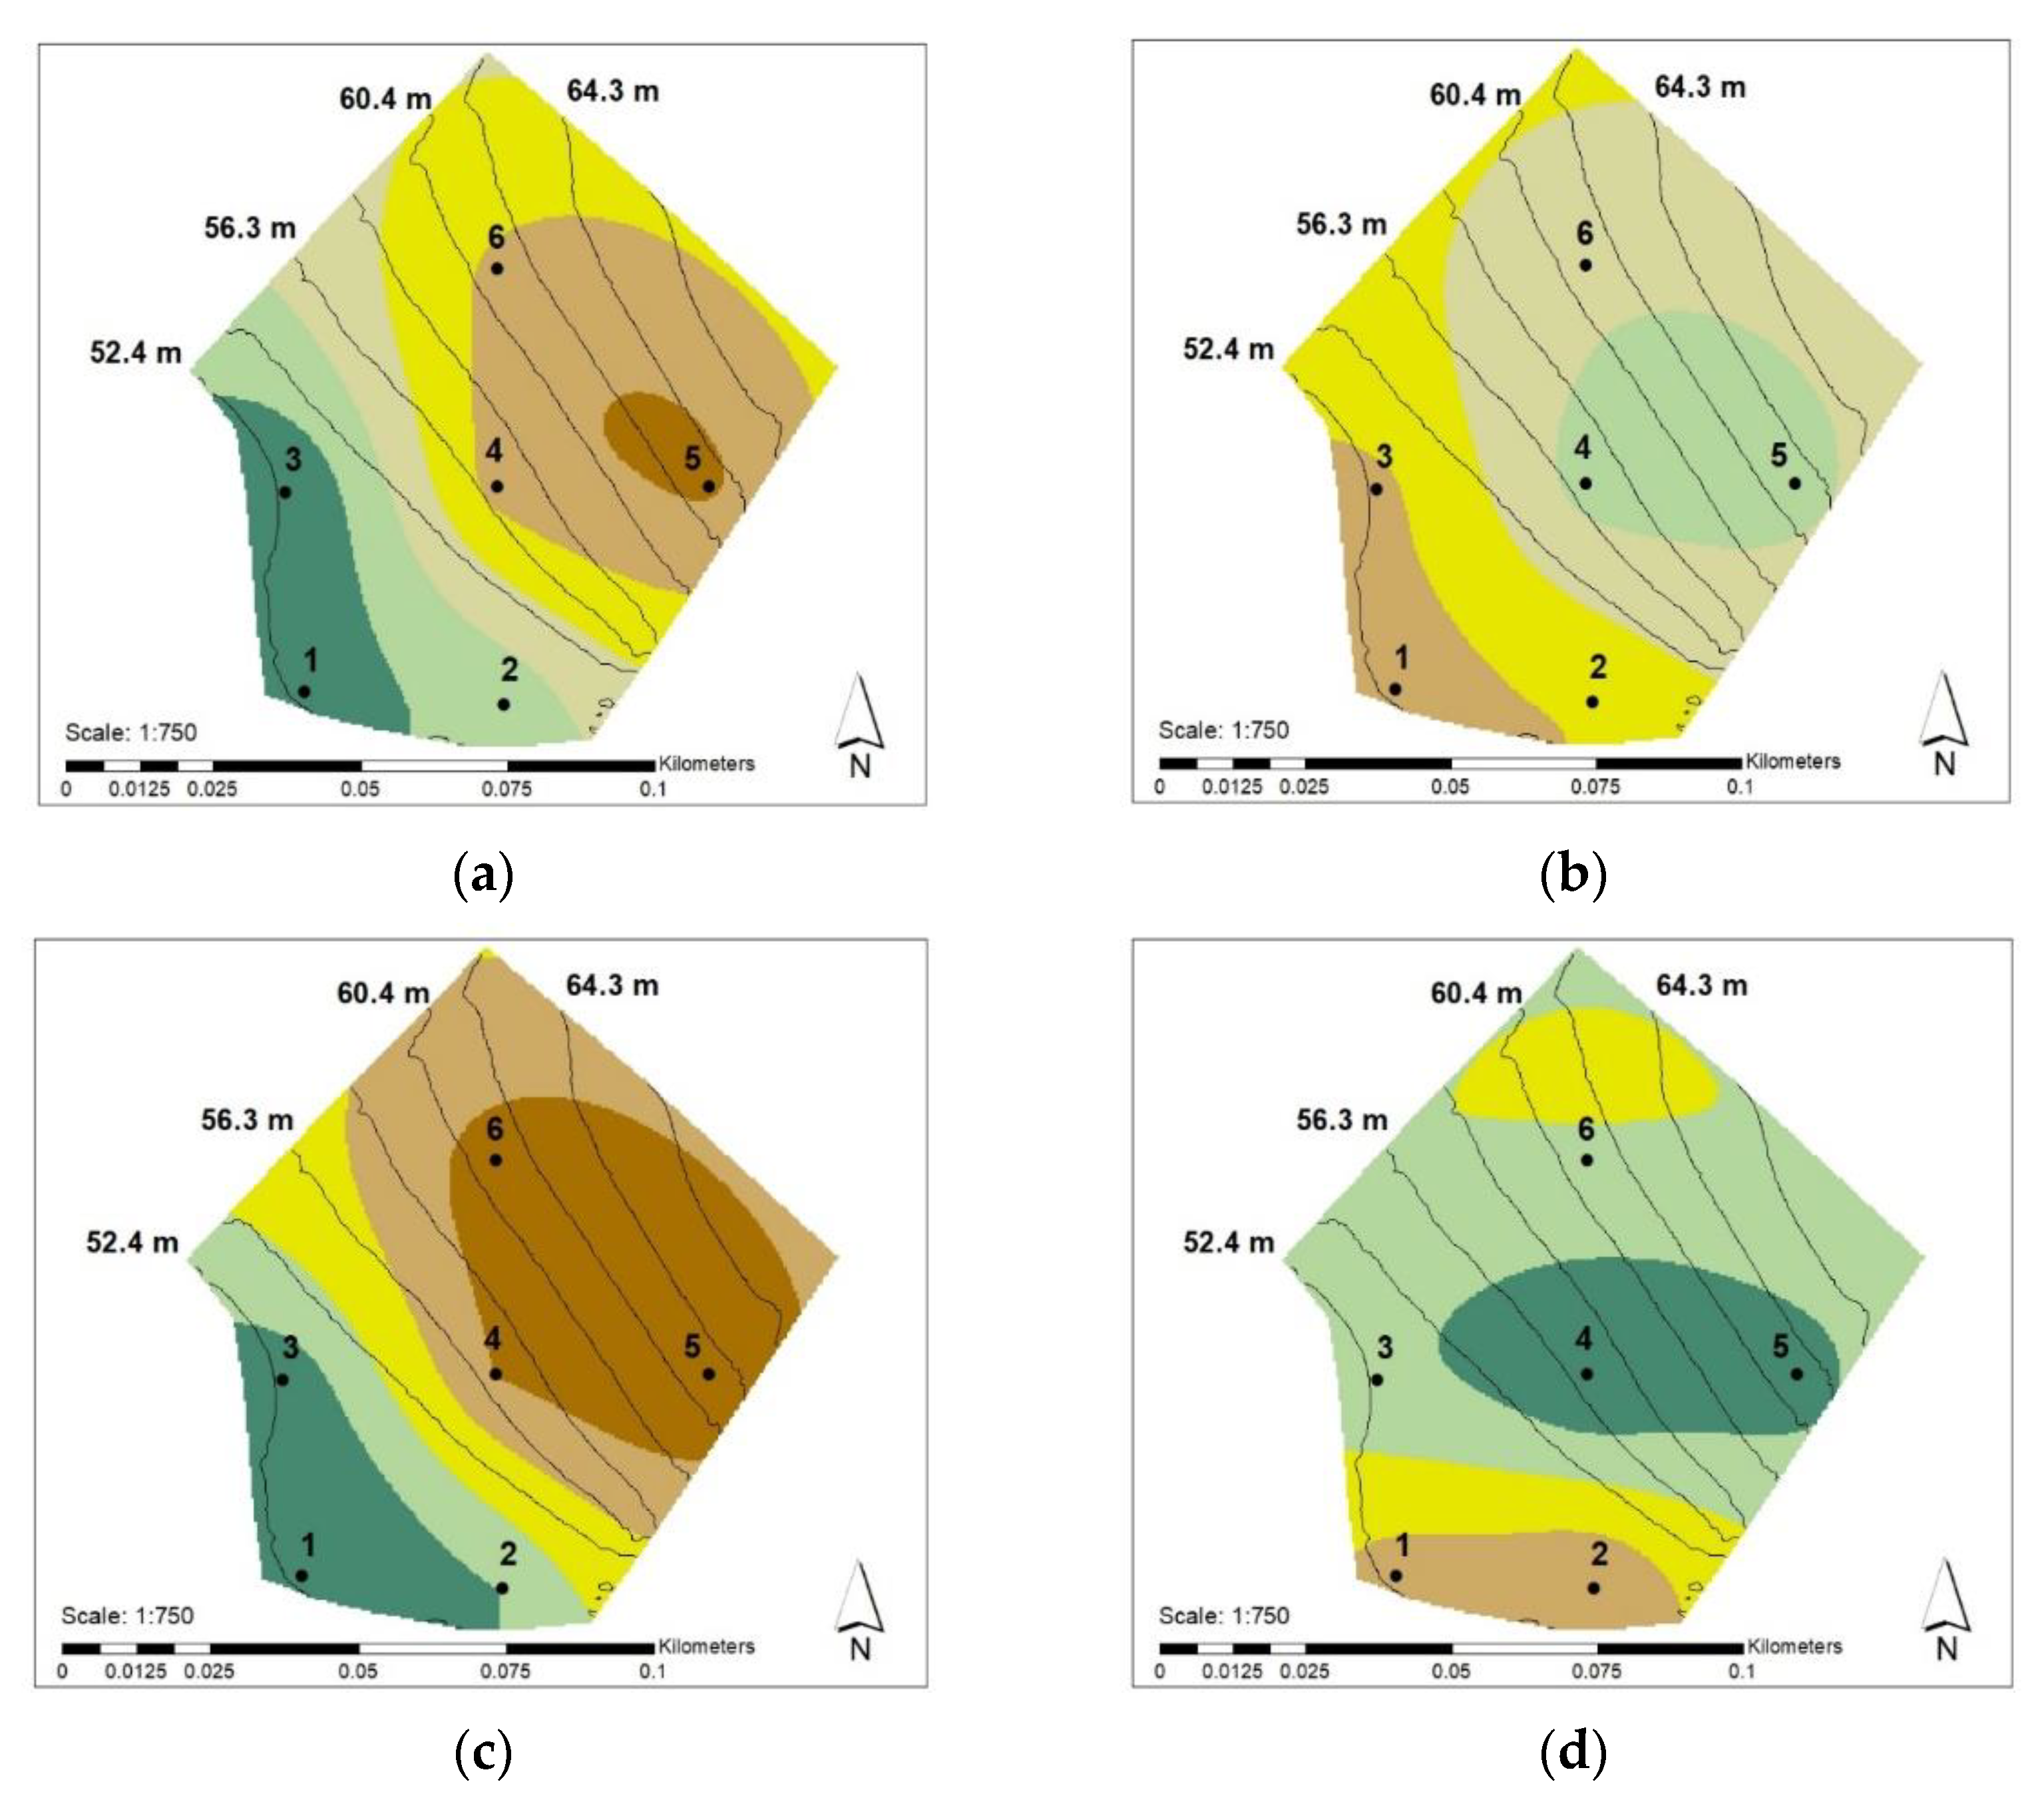
Comparisons were made between the gridded soil sampling results collected before and after reseeding. Table 1 shows the average soil nutrient content for P, Mg, K, S, Total Soil C and Total Soil N obtained from collected 35 m gridded sampling points for the identified deposition and erosion zones (identified following LiDAR analyses). Table 2 shows the calculated percentage change for soil nutrient content at each gridded sampling point (mg L−1) for P, K, Mg, S, and soil pH from 2020 to 2021 following reseeding. Furthermore, Figure 2a–j shows interpolated nutrient content and soil pH for 2020 side-by-side with interpolated nutrient content and soil pH for 2021. Table 3 shows the percentage change in soil total N (%) and soil total C (%) from 2020 to 2021 following reseeding. Figure 3a–d show interpolated total soil C (%) and total soil N (%) for 2020 and 2021.
The majority of soil nutrients (particularly P and K) decreased following reseeding. P decreases range from 11.9 to 52.0% and K decreases range from 2.9 to 37.5% (Table 2). The magnitude of decreases between the nutrients is not uniform. A 47.7% decrease in P was recorded at point 6 (located on the steepest slope) and may suggest runoff-based losses. However, the second largest decrease was recorded at point 1, which is located along the flat slope base and is unlikely to generate runoff. It could be theorised that with significant P losses from point 6, given the location of point 1, an increase in soil P content would have occurred instead. Figure 2a,b shows the disappearance of the Index 3 P hotspot, and an increase in P deficiency to include Index 0 occurred in 2021. Figure 2c,d show that the K Index 3 hotspot decreased to Index 2−/2+. In Figure 2c, the rest of the field was at Index 2− with a smaller Index 1 zone, by 2021 this is deficient at Index 1.
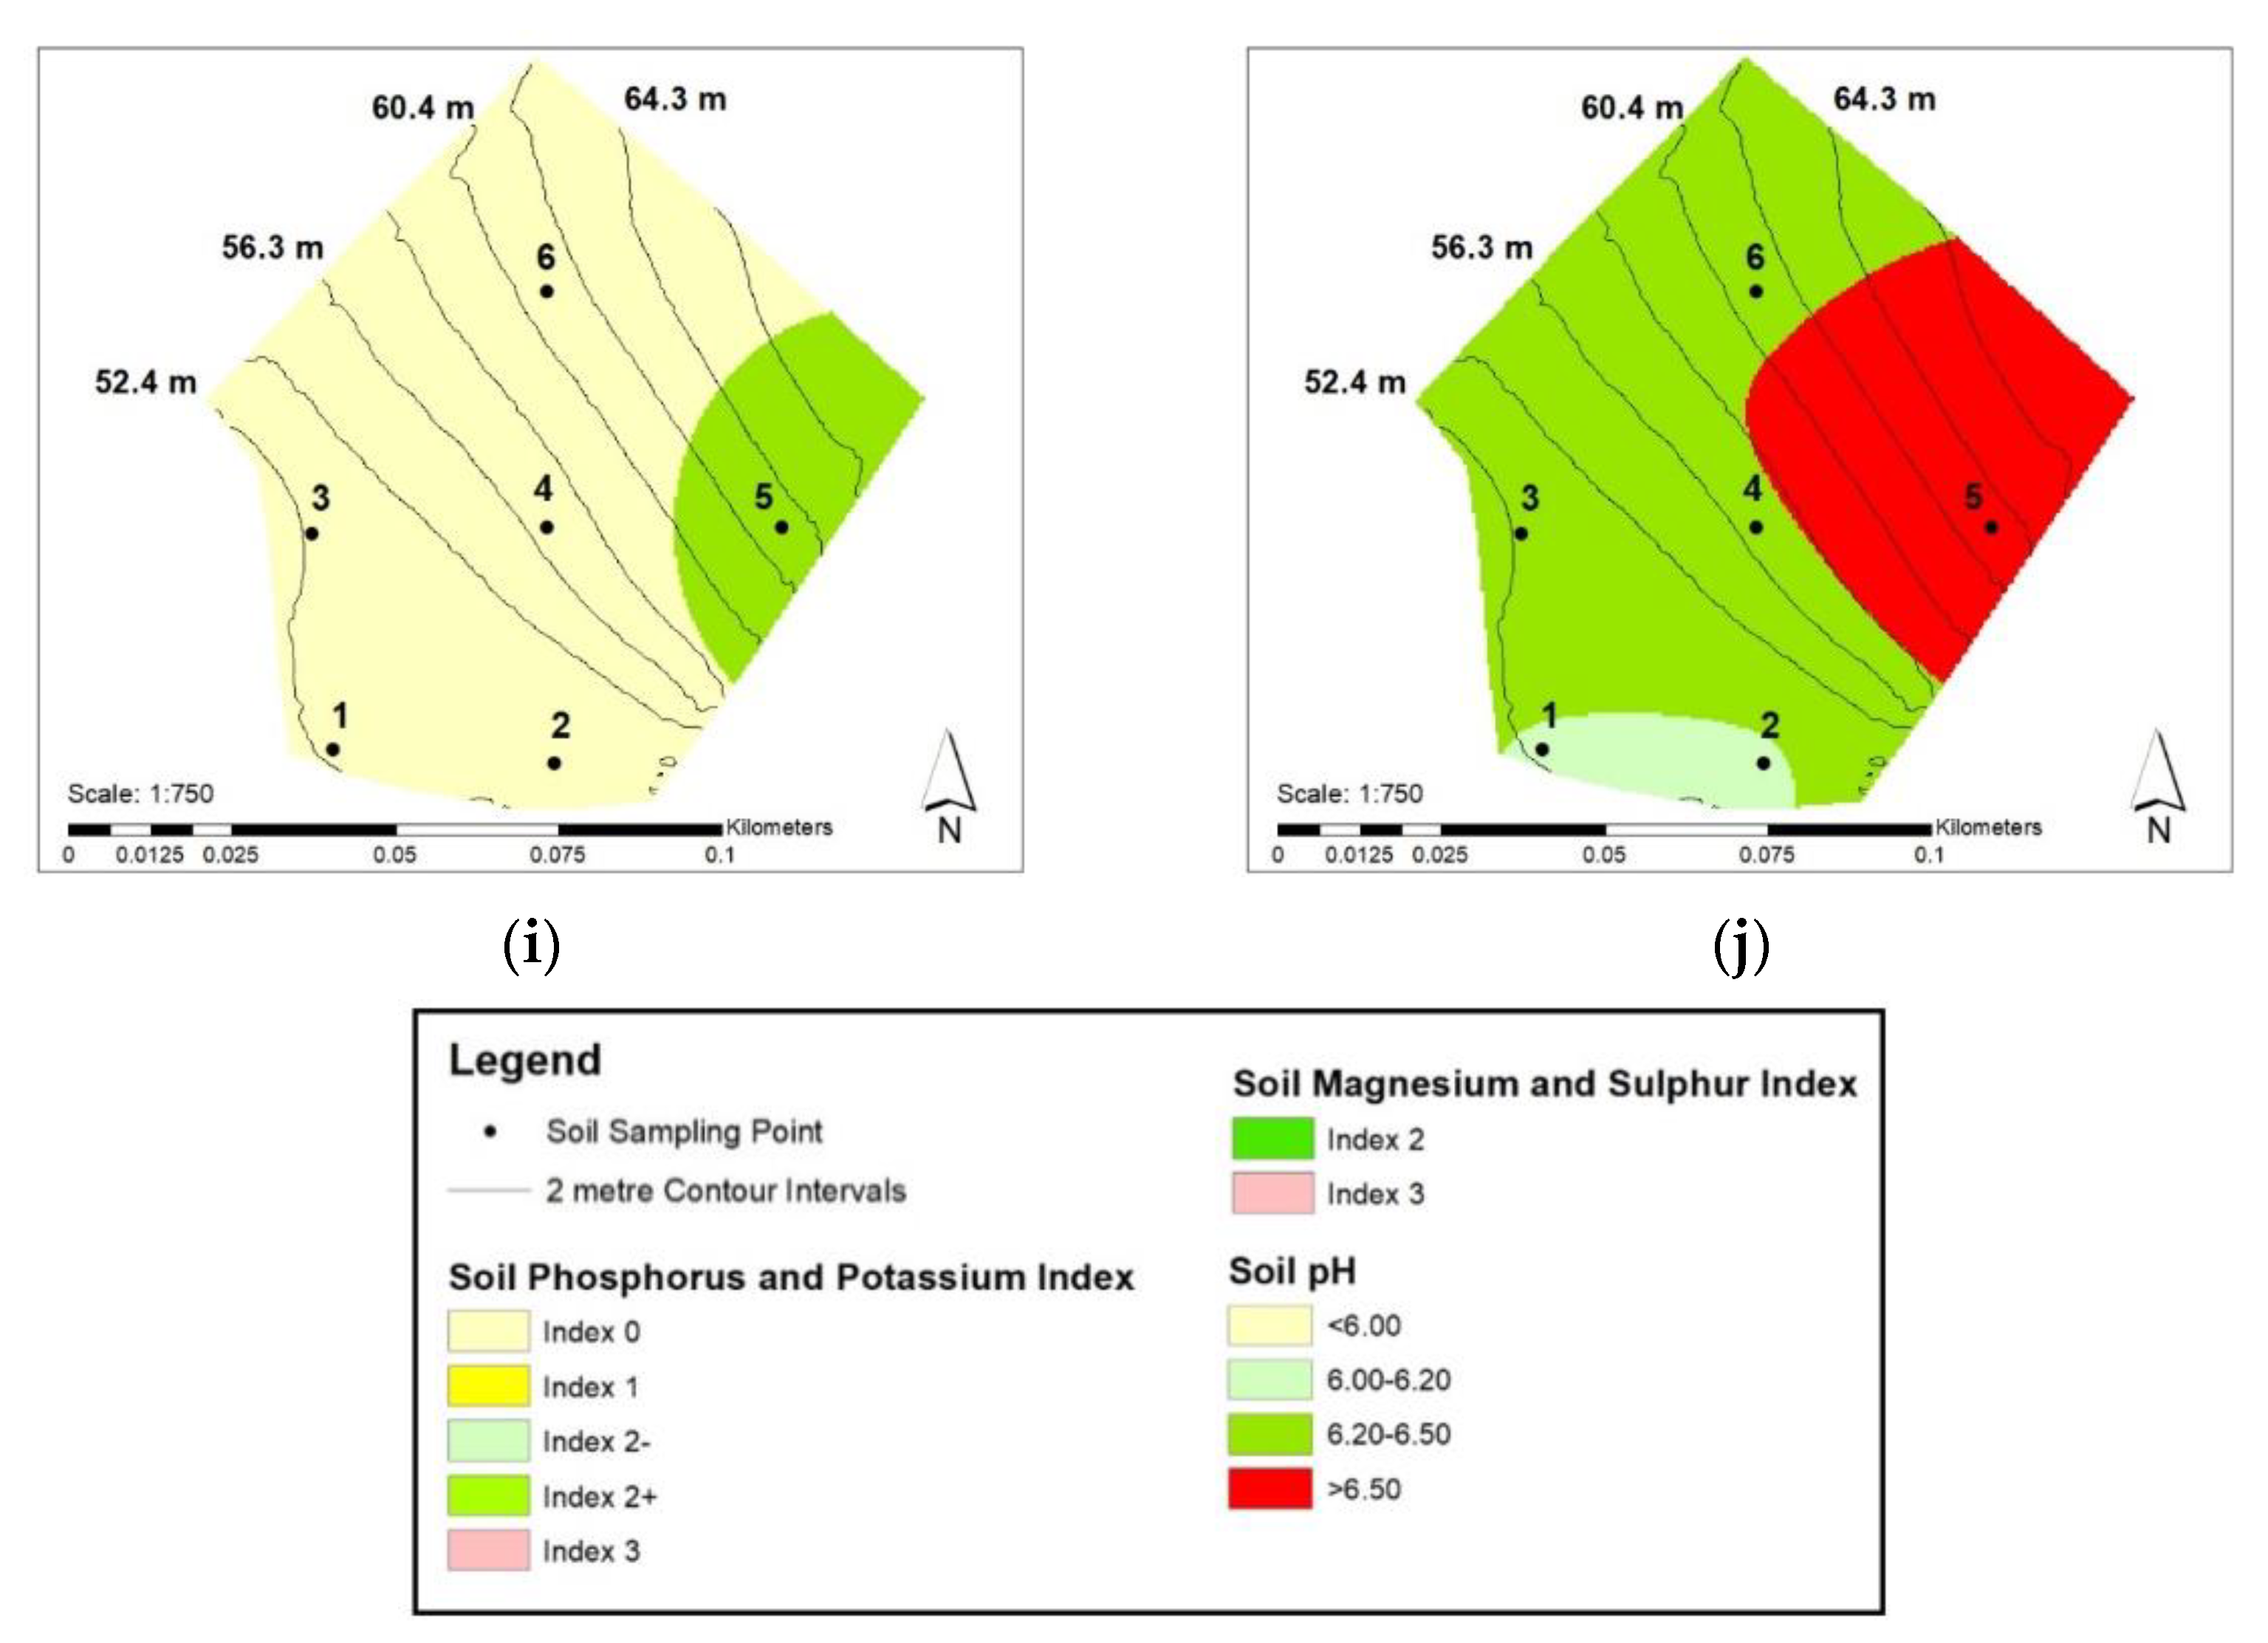
Soil Mg increased at points 1 and 6 indicating accumulation, the remaining points show decreases. Figure 2e shows that Mg was over-supplied, and it remains largely over-supplied in Figure 2f indicating a large Mg soil reservoir. Soil S shows largely decreases (Table 2). An increase occurs at point 1 of 8.9%, and given the lack of S translocation within soils, it is unlikely that this accumulation occurred through runoff, suggesting an over-application of S during reseeding. Figure 2g showed S was mostly at Index 2, with an area of Index 3, in Figure 2h this has become Index 2. Figure 2i for soil pH in 2020 indicates that the field was mostly sub-optimal with an area that was slightly above optimum of pH 6.20–6.50. For Figure 2j there has been an increase in pH content (8.1–15.9%) by liming.
Soil total N (%) and C (%) increased for points 1–3 and decreased for points 4–6 following reseeding (Table 3). The magnitude of these changes is not uniform. Higher values of C content in Figure 3a decrease in Figure 3b, with Table 3 showing decreases of 14.7 to 29.7%. Increases in C content range from 31.1 to 54.9% (Table 3, Figure 3b). Similar to C content, higher values of N content in Figure 3c decrease in Figure 3d. This is confirmed by Table 3, with decreases of 3.0–30.5% after reseeding. Increases in N content range from 8.2–39.1%, as is reflected in Figure 3d showing increases in N content at the base of the field, similar to Figure 3b.

3.2. Calculated Erosion Rates Associated with Grassland Tillage Inversion and Reseeding

Predominantly, the erosion zones are concentrated on the uppermost section of the field, with deposition occurring on the lower slopes (Figure 4). However, there is considerable complexity in the spatial distribution of deposition and erosion within the overall pattern. This suggests that soil erosion has occurred on a variable scale and does not represent large well-defined mass wasting events. This is supported by the lack of rilling formation following reseeding. For this field, there is an elevated risk of sediment and nutrient transfer via surface runoff through steep topography which slopes towards the waterway. Cumulatively, identified erosion zones cover an area of 0.34 ha and the identified deposition zones cover an area of 0.37 ha. Table 4 details the calculated volume change rates and associated deposition and erosion rates with losses and accumulation rates of sediment. Table 5 details information on the losses (and accumulation) of P, Mg, K, S, C, and N associated with soil erosion.
As a result of tillage and reseeding, this site has had overall mass wasting of 324.37 kg (0.32 t)/917.54 kg ha−1 (0.92 t ha−1) of sediment (on an annual basis). If it is assumed that deposition-identified zones result from tillage, the actual sediment losses adjusted for deposition accumulation rates could be as low as 19.51 kg (0.02 t) and 93.82 kg ha−1 (0.09 t. ha−1) instead of 171.94 kg (0.17 t) and 505.68 kg ha−1 (0.51 t. ha−1), when assumed that all eroded soil will be transported from the site. Such a concept is highly unlikely given the potential for sediment mass wasting events to be transferred into nearby waterways. On a per-hectare basis, these results are similar to the average post-tillage losses found by Pulley and Collins [11] for ten grassland sites at 0.58 t. ha−1 yr−1. Table 5 shows variable rates of nutrient losses associated with soil erosion, both on a field-specific basis and a per-hectare basis. As Figure 4 predominantly shows erosion occurring on the uppermost portion of the site, it could be theorised that identified downslope deposition areas will have resulted from the re-deposition of eroded nutrients and sediment from the upper section. Table 5, therefore, considers the deposition-adjusted losses of each sampled nutrient. Interestingly, and in contrast to the other sampled nutrients, deposition-adjusted losses suggest that no P has been lost from the field. Mg and K deposition adjusted losses are high compared to the other nutrients, similar to results in Table 3 with high percentage changes recorded in nutrient statuses. These results suggest erosion predominantly from the top of the slope (correlated by soil Mg with high changes in nutrient content from points 4 and 6). Unlike K, Mg remained oversupplied for the field (despite the highest overall deposition-adjusted losses in Table 5) confirming the large soil Mg reservoir present. Table 5 for soil S correlates somewhat to the findings in Table 3, recording the lowest deposition-adjusted losses compared to soil Mg and K, suggesting a lack of movement of S. Soil total C and N deposition-adjusted losses in Table 5 losses are fairly low, particularly for soil N, confirming findings in Table 3 that tillage and reseeding does not necessarily deplete soil organic content.
In reality, a much more complex pattern likely exists in terms of nutrient transfer, particularly for P losses as it is highly unlikely that no P losses occurred with soil erosion. Some nutrient portions are likely to have been lost from the field via surface runoff, re-deposited in-field, or changes in nutrient content from Table 2 and Table 3 have resulted from the vertical stratification of nutrient content with inversion tillage. Therefore, the values in Table 5 represent the potential maximum nutrient losses assumed via soil erosion. The deposition-adjusted values indicate the maximum potential reduction in soil erosion-based losses of sampled nutrients if it is assumed that all eroded sediment fractions are re-deposited in-field. This is highly unlikely and actual losses of sediment and nutrients are likely to lie between the minimum and maximum possible values specified in Table 5. These losses of sediment and nutrients must be carefully balanced against the agricultural need for tillage and reseeding to occur and the potential gains made by reducing soil surface nutrient accumulations such as P to avoid potentially negative consequences to surrounding environments such as waterways through sedimentation and eutrophication.

3.3. Influences on Soil Erosion Occurrence following Inversion Tillage and Grassland Reseeding

As grassland inversion tillage and reseeding occurred during April 2020, there is potential to explore the impacts of soil moisture and rainfall on soil erosion occurrence.
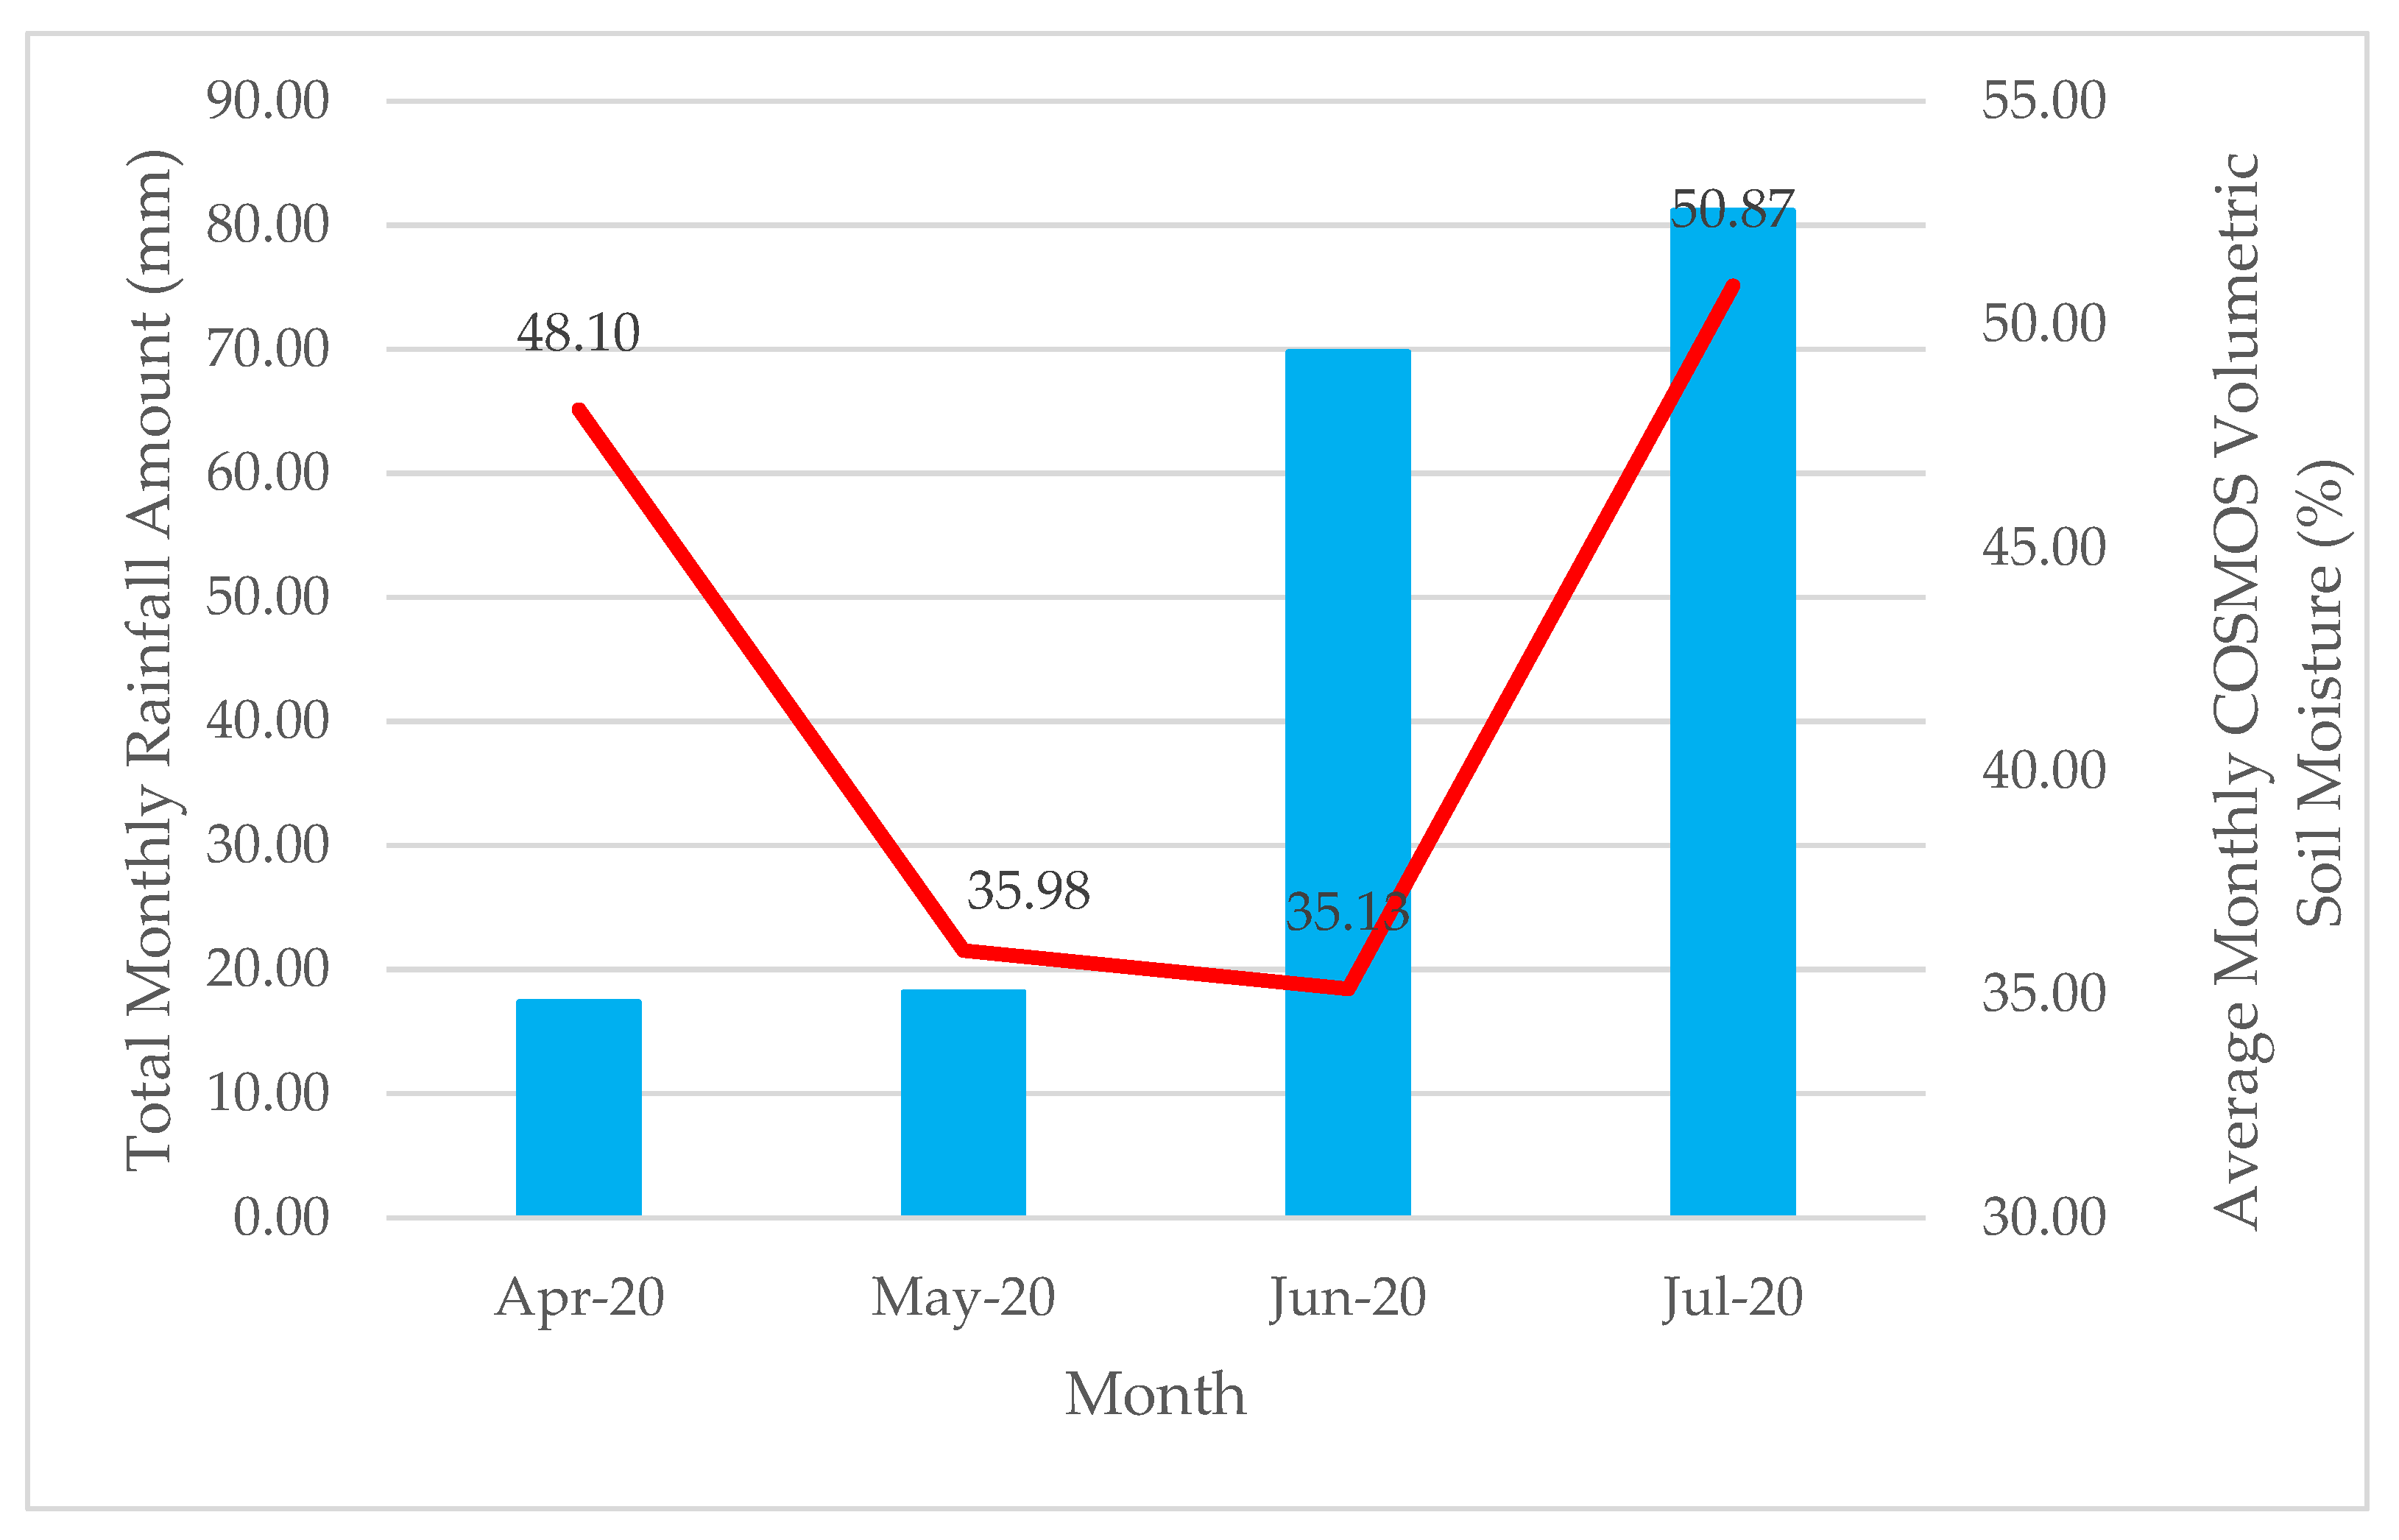
COSMOS average monthly volumetric soil moisture content in the period following tillage and reseeding in April 2020 was crucially low for the catchment ranging from 35.13–35.98% (Figure 5). Furthermore, total monthly rainfall amounts were much lower than average for the region at less than 20 mm during April and May, which was reflected by the lowest soil moisture content being recorded on 5 June at 26.1%, indicating prolonged dry conditions. Average monthly rainfall amounts for this catchment are 66.10 mm per month (based on weather data collected from Met Office Monitoring Station in Armagh), with average soil moisture content at 51.97% (taken from COSMOS June 201–August 2022 based on operational period). These average monthly rainfall amounts are notably lower than the 30-year average for this catchment, indicating that tillage and reseeding occurred during a dry rainfall period.
A higher value was recorded in July at 50.87% (corresponding to increased total monthly rainfall amounts in June and July). Research by Pulley and Collins [11] indicated that a period of 20 days of relatively dry conditions is adequate within spring reseeding to stabilise grassland sites. Furthermore, the lower-than-average soil moisture and rainfall conditions may have significantly benefitted the establishment of the grassland following reseeding and likely contributed to the lack of significant soil erosion in the form of rilling events compared to the potentially higher losses during wetter autumn months. This indicates that the timing of reseeding and controls of volumetric soil moisture content (and by relationship total rainfall for relatively dry conditions) is crucial to ensure that reseeding occurs without potentially negative consequences to surrounding waterways in terms of sediment and P losses [11].

4. Discussion

4.1. Reduction in Soil Surface Nutrient Accumulations following Reseeding

The results in Section 3.1 show the overall reduction in soil surface nutrient content following reseeding. This supports Sharpley [12] and Kleinman et al. [25] who indicated that tillage inversion reduces P content. Sharpley [12] found that the mixing of P-rich surface soils (0–5 cm depth) with lower P subsoils (5–20 cm depth) decreased the weighted mean soil P content by 66–90%. Here, we found that soil P content decreased by up to 52.0%. Furthermore, before tillage, total P runoff losses were 3.4 mg L−1 which declined to 1.79 mg L−1 following ploughing [12]. Particularly for regions where soils contain legacy nutrient accumulations that are not readily removed through conventional silage off-taking cycles, the immediate effects of tillage and reseeding could reduce soil surface P hotspots and reduce the risk of nutrient losses, avoiding the long timescales involved in other forms of soil P decline [7].
The gridded soil sampling showed the importance of understanding nutrient variability given the different effects that reseeding has on nutrient content. For example, following reseeding some P and K deficiencies are evident; however, Mg is over-supplied, and S is at the agronomic optimum. These nutrient deficiencies may limit yields and the usefulness of silage offtakes to increase the rate of legacy P draw-down [6]. Without gridded sampling, these specific deficiencies and accumulations would be unknown. These results have implications for the management of this sub-field for future nutrient applications, e.g., variable application rates of nutrients, e.g., for P/K and limited Mg applications. Improved nutrient stewardship is of great importance for improved water quality, and the use of site-specific precision soil sampling to quantify sub-field scale nutrient content is key to managing nutrient accumulations.
The changes in total soil C (%) and N (%) are variable at this site following reseeding, showing both increases and decreases. This suggests variations in the extent of tillage occurred across this field perhaps concerning site-specific conditions such as topography as increases in soil C and N content were recorded at sample points 1–3, located on the steepest slope. This may suggest that less tillage disturbance occurred due to sub-optimal conditions for ploughing machinery. Conversely, decreases in soil C and N content were recorded at sample points 4–6, located on the upper slope portions, suggesting increased losses via identified soil erosion zones here. This conflicts with previous studies on reseeded grassland which concluded that tillage led to declines in soil C and N content primarily due to ploughing disturbance, a reduction in plant growth, and increased soil respiration [25,26,27,28,29,30]. Necpálová et al. [29] found that topsoil organic N decreased via increased N leaching through groundwater pathways. The variations in N and C losses have been linked by multiple studies to site-specific conditions such as grassland management, soil properties, and the dominant loss pathways existing [26,29,30]. The likely cause for this disparity relates to the soil sampling procedures used in these other studies which focus on bulked composite sampling. Such a sampling method is inadequate to explore the degree of sub-field scale nutrient variability. Increases in soil C have been recorded by studies such as Cui and Holden [31] within Irish grassland sites, with soil sampling focusing on a singular sample per 30 m by 30 m sub-plot, similar to the 35 m gridded sampling approach adopted here. For soil N, the timing of reseeding influenced losses strongly. Velthof et al. [32] concluded that lower N losses occurred with spring reseeding due to lower soil mineral N content. This is supported by our LiDAR-calculated N losses associated with soil erosion. It is feasible that both increases and decreases in total soil C (%) and N (%) content occur in reality with tillage and reseeding, and that only sub-field scale soil sampling procedures can uncover these changes.
Tillage practices will reduce soil surface nutrient concentrations but may increase nutrient content deeper in the soil profile. Of interest is the reduction in soil surface P hotspots. Subsequent fertiliser applications must only resume once there is a demonstrated crop requirement [12,13]. By reseeding, the productivity of permanent grasslands can increase, with a greater P utilisation by young swards. It is necessary to balance the need for reseeding against the potential risks of sediment and nutrient losses as tillage can increase particulate P losses and vulnerability to soil erosion [33]. Whilst reseeding has immediate effects on soil surface nutrient content, reducing nutrient accumulation trends within agriculture requires significant changes to nutrient management practices. As rainfall and associated high soil moisture content could be related to sediment and nutrient losses between the autumn and spring reseeding events, the use of grassland tillage and reseeding as a means to reduce soil surface P accumulations suggests that appropriate timing and forecasting is required to introduce reseeding at an appropriate time [11]. Reducing any potential nutrient and sediment losses suggests that additional strategies may be required to intercept and prevent downslope sediment/nutrient transfer at critical delivery zones to hydrological networks.

4.2. Sediment and Nutrient Losses Associated with Inversion Tillage and Grassland Reseeding

Pulley and Collins [11] found that sediment loads following tillage and reseeding were highly variable but that these did not relate to variations in site-specific conditions such as slope, but instead related to soil moisture conditions during tillage and reseeding. Up to 78% of total sediment losses for a singular field in a year could occur during the post-ploughing phase [11]. The typical suspended sediment yield within UK catchments was estimated at 0.5 t. ha−1 yr−1 [34]. Autumn reseeding events caused between 2.57–3.13 t. ha−1 yr−1 with these losses far exceeding “normal” sediment inputs to waterways [11]. Average post-plough losses during spring periods were 0.58 t. ha−1 yr−1 and are more comparable to the typical UK suspended sediment yields. For this research, this reseeding event generated similar sediment losses at 0.51 t. ha−1, correlating well with Pulley and Collins [11]. This suggests that spring reseeding as a means to reduce soil surface nutrient accumulations and improve grassland productivity could be appropriate to reduce excessive sedimentation impacts on the surrounding waterways.
Pulley and Collins [11] explored sediment losses via grassland reseeding for ten sites from a variety of reseeding timings in terms of differences between soil erosion as a result of reseeding in either autumn or spring. This study found that soil moisture was a key factor in controlling soil erosion occurrence, with higher sediment losses occurring in autumn reseeding due to soil saturation. A critical volumetric soil moisture content of between 35–38% was found by Pulley and Collins [11] to increase the risk of soil erosion occurrence. Similarly, this study site had an average soil porosity value of 35.60% indicating similar risk of erosion occurrence if soil saturation conditions are met. Previous research showed that ploughing increased particulate P losses with increased vulnerability to sheet erosion and requires appropriate timing in line with meteorological conditions [12].
Of importance to consider with LiDAR-based analysis to quantify soil erosion rates, is that not all eroded sediment and associated nutrients will enter waterways due to the spatially variable nature of surface runoff flow pathways and their associated hydrological connectivity. In reality, there will likely be ongoing deposition processes during sediment mass wasting events, creating a complex series of eroding and deposited fractions. Therefore, the values provided in Table 5 are estimates of the maximum possible nutrient exports from the soil erosion events occurring. From the findings of this research, it is crucial that reseeding is timed appropriately to avoid excessive nutrient losses to waterways, particularly for sites containing P accumulations. Saturation-excess runoff at this site was found as one of the main controls of soil erosion occurrence [7]. Butler and Haygarth (2007) [35] concluded that total P and sediment exports in rainfall-runoff events were highest (and fields at their most vulnerable for detachment) for 16 days following tillage. Timing was crucial to minimise C losses and preserve soil organic matter, with spring reseeding increasing C losses [26]. Conversely, for N, research by Velthof and Oenema (2001) [36] concluded that spring reseeding increased the N availability for sward re-establishment, however a crucial factor in determining N leaching losses following reseeding related to the period between reseeding years. With older grasslands, the risk of N losses increased with grassland age following reseeding [36]. It is highly recommended that planned reseeding balances the outcomes gained against the associated secondary impacts on other systems such as soil organic matter and potential nutrient and sediment losses. It is also evident that understanding site-specific conditions at a sub-field scale is important to understand the potential effects on soil organic matter.
Careful consideration must be given to fields with relatively high nutrient accumulations, and whether or not additional measures are required to intercept sediment and nutrient losses. It has been noted that if fields are diffuse P sources, then the use of field edge treatments to reduce overland P losses is necessary to prevent excess P loading to surrounding waterways, e.g., nutrient removal systems such as wetlands at field drain outlets [36].

5. Conclusions

This study demonstrated the potential reduction in surface soil nutrient content following reseeding, which is also the zone most at risk of generating nutrient losses via runoff. The immediate effects of reseeding, including a reduction in nutrient hotspots, could therefore lead to relatively quick reductions in the risk of surface-runoff-based nutrient losses. Developing a farm management tool which can rapidly reduce soil surface nutrient accumulations is a requirement for managing diffuse and point nutrient hotspots at risk of contributing excessive losses to surrounding waterways. LiDAR-based applications to monitor the losses associated with tillage and reseeding to surrounding waterways are a novel means to determine the potential loading rates and losses of nutrients and sediment from agricultural activities for targeted water quality improvement strategies on a field-specific basis.

Author Contributions

Conceptualization, E.H. and S.H.; methodology, E.H.; software, E.H.; validation, E.H.; formal analysis, E.H.; investigation, E.H.; resources, E.H. and S.H.; data curation, E.H.; writing—original draft preparation, E.H.; writing—review and editing, E.H., D.M., S.H. and J.G.; visualization, E.H.; supervision, D.M., S.H. and J.G.; project administration, D.M. and E.H.; funding acquisition, D.M. All authors have read and agreed to the published version of the manuscript.

Funding

This research was funded by the NERC QUADRAT DTP, grant number 2280708.

Institutional Review Board Statement

Not applicable.

Informed Consent Statement

Not applicable.

Data Availability Statement

No data are available due to the anonymity granted to the landowners.

Acknowledgments

Thanks go to AFBI (Agri-Food and Biosciences Institute) for access to BlueSky 2021 LiDAR data, OpenData NI for access to 2014 LiDAR DTM data.

Conflicts of Interest

The authors declare no conflict of interest. The funders had no role in the design of the study; in the collection, analyses, or interpretation of data; in the writing of the manuscript, or in the decision to publish the results.

References

  1. McDonald, N.; Wall, D.; Mellander, P.; Buckley, C.; Shore, M.; Shortle, G.; Leach, S.; Burgess, E.; O’Connell, T.; Jordan, P. Field scale phosphorus balances and legacy soil pressures in mixed-land use catchments. Agric. Ecosyst. Environ. 2019, 274, 14–23. [Google Scholar] [CrossRef]
  2. Baker, D.B.; Johnson, L.T.; Confesor, R.B.; Crumrine, J.P. Vertical Stratification of Soil Phosphorus as a Concern for Dissolved Phosphorus Runoff in the Lake Erie Basin. J. Environ. Qual. 2017, 46, 1287–1295. [Google Scholar] [CrossRef] [PubMed] [Green Version]
  3. Wang, Y.T.; Zhang, T.Q.; Hu, Q.C.; Tan, C.S.; Halloran, I.P.O.; Drury, C.F.; Reid, D.K.; Ma, B.L.; Ball-Coelho, B.; Lauzon, J.D.; et al. Estimating Dissolved Reactive Phosphorus Concentration in Surface Runoff Water from Major Ontario Soils. J. Environ. Qual. 2010, 39, 1771–1781. [Google Scholar] [CrossRef] [PubMed]
  4. Dodd, R.J.; Mcdowell, R.W.; Condron, L.M. Predicting the changes in environmentally and agronomically significant phosphorus forms following the cessation of phosphorus fertilizer applications to grassland. Soil Use Manag. 2012, 28, 135–147. [Google Scholar] [CrossRef]
  5. Hayes, E.; Higgins, S.; Geris, J.; Nicholl, G.; Mullan, D. The importance of soil phosphorus sub-field scale sampling for understanding and managing surface runoff-based phosphorus losses. CATENA 2022. in review. [Google Scholar]
  6. Bailey, J.S. Assessing the effectiveness of manure export plus intensive silage cropping for lowering the Olsen-P status of P-enriched grassland. Soil Use Manag. 2015, 31, 438–439. [Google Scholar] [CrossRef]
  7. Schulte, R.; Melland, A.; Fenton, O.; Herlihy, M.; Richards, K.; Jordan, P. Modelling soil phosphorus decline: Expectations of Water Framework Directive policies. Environ. Sci. Policy 2010, 13, 472–484. [Google Scholar] [CrossRef]
  8. Wall, D.P.; Jordan, P.; Melland, A.R.; Mellander, P.-E.; Mechan, S.; Shortle, G. Forecasting the decline of excess soil phosphorus in agricultural catchments. Soil Use Manag. 2013, 29, 147–154. [Google Scholar] [CrossRef]
  9. Bilotta, G.S.; Krueger, T.; Brazier, R.E.; Butler, P.; Freer, J.; Hawkins, J.M.B.; Haygarth, P.M.; Macleod, C.J.A.; Quinton, J.N. Assessing catchment-scale erosion and yields of suspended solids from improved temperate grassland. J. Environ. Monit. 2010, 12, 731–739. [Google Scholar] [CrossRef]
  10. Evans, R.; Collins, A.L.; Zhang, Y.; Foster, I.D.L.; Boardman, J.; Sint, H.; Lee, M.R.F.; Griffith, B.A. A comparison of conventional and 137Cs-based estimates of soil erosion rates on arable and grassland across lowland England and Wales. J. Earth Sci. Rev. 2017, 173, 49–64. [Google Scholar] [CrossRef]
  11. Pulley, S.; Collins, A.L. Sediment loss in response to scheduled pasture ploughing and reseeding: The importance of soil moisture content in controlling risk. Soil Tillage Res. 2020, 204, 104746. [Google Scholar] [CrossRef] [PubMed]
  12. Sharpley, A.N. Soil Mixing to Decrease Surface Stratification of Phosphorus in Manured Soils. J. Environ. Qual. 2003, 32, 1375–1384. [Google Scholar] [CrossRef] [PubMed]
  13. Watkins, M.; Castlehouse, H.; Hannah, M.; Nash, D. Nitrogen and Phosphorus Changes in Soil and Soil Water after Cultivation. Appl. Environ. Soil Sci. 2012, 2012, 157068. [Google Scholar]
  14. Hayes, E.; Higgins, S.; Geris, J.; Mullan, D. Using LiDAR derived Digital Terrain Models and field data to quantify riverbank erosion and nutrient loading rates. In Sensing—New Insights into Grassland Science and Practice, Proceedings of the 21st Symposium of the European Grassland Federation, Online, 17–19 May 2021; Astor, T., Dzene, I., Eds.; The Organising Committee of the 21st Symposium of the European Grassland Federation, Universität Kassel, Grassland Science and Renewable Plant Resources: Witzenhausen, Germany, 2021; Volume 26, pp. 196–198. [Google Scholar]
  15. Bastola, S.; Murphy, C.; Sweeney, J. The role of hydrological modelling uncertainties in climate change impact assessments of Irish river catchments. Adv. Water Resour. 2011, 34, 562–576. [Google Scholar] [CrossRef]
  16. Cassidy, R.; Thomas, I.A.; Higgins, A.; Bailey, J.S.; Jordan, P. A carrying capacity framework for soil phosphorus and hydrological sensitivity from farm to catchment scales. Sci. Total Environ. 2019, 687, 277–286. [Google Scholar] [CrossRef]
  17. McCormick, S.; Jordan, C.; Bailey, J.S. Within and between-field spatial variation in soil phosphorus in permanent grassland. Precis. Agric. 2008, 10, 262–276. [Google Scholar] [CrossRef]
  18. Shi, Z.; Wang, K.; Bailey, J.; Jordan, C.; Higgins, A. Temporal changes in the spatial distributions of some soil properties on a temperate grassland site. Soil Use Manag. 2006, 18, 353–362. [Google Scholar] [CrossRef]
  19. MAFF (Ministry of Agriculture, Fisheries and Food). The Analysis of Agricultural Materials, 3rd ed.; Reference Book 427; Her Majesty’s Stationary Office: London, UK, 1986.
  20. Islam, M.M.; Bhuijan, N.I. Evaluation of various extractants for available sulphur in wetland rice (Oryza sativa) soils of Bangladesh. Indian J. Agric. Sci. 1988, 58, 603–606. [Google Scholar]
  21. Orr, R.J.; Murray, P.J.; Eyles, C.J.; Blackwell, M.S.A.; Cardenas, L.M.; Collins, A.L.; Dungait, J.A.J.; Goulding, K.W.T.; Griffith, B.A.; Gurr, S.J.; et al. The North Wyke Farm Platform: Effect of temperate grassland farming systems on soil moisture contents, runoff and associated water quality dynamics. Eur. J. Soil Sci. 2016, 67, 374–385. [Google Scholar] [CrossRef] [Green Version]
  22. Webster, R.; Oliver, M.A. Geostatistics for Environmental Scientists, 2nd ed.; Webster, R., Oliver, M.A., Eds.; John Wiley & Sons Ltd.: Chichester, UK, 2007; p. 330. [Google Scholar]
  23. Cresswell, H.P.; Hamilton, H. Particle Size Analysis. In Soil Physical Measurement and Interpretation for Land Evaluation; McKenzie, N.J., Cresswell, H.P., Coughlan, K.J., Eds.; CSIRO Publishing: Collingwood, Australia, 2002; pp. 224–239. [Google Scholar]
  24. Thoma, D.P.; Gupta, S.C.; Bauer, M.E.; Kirchoff, C.E. Airborne laser scanning for riverbank erosion assessment. Remote Sens. Environ. 2005, 95, 493–501. [Google Scholar] [CrossRef]
  25. Kleinman, P.J.A.; Sharpley, A.N.; Withers, P.J.A.; Bergström, L.; Johnson, L.T.; Doody, D.G. Implementing agricultural phosphorus science and management to combat eutrophication. Ambio 2015, 44, 297–310. [Google Scholar] [CrossRef] [PubMed] [Green Version]
  26. Reinsch, T.; Loges, R.; Kluß, C.; Taube, F. Effect of grassland ploughing and reseeding on CO2 emissions and soil carbon stocks. Agric. Ecosyst. Environ. 2018, 265, 374–383. [Google Scholar] [CrossRef]
  27. Necpálová, M.; Casey, I.; Humphreys, J. Effect of ploughing and reseeding of permanent grassland on soil N, N leaching and nitrous oxide emissions from a clay-loam soil. Nutr. Cycl. Agroecosyst. 2013, 95, 305–317. [Google Scholar] [CrossRef]
  28. Linsler, D.; Geisseler, D.; Loges, R.; Taube, F.; Ludwig, B. Temporal dynamics of soil organic matter composition and aggregate distribution in permanent grassland after a single tillage event in a temperate climate. Soil Tillage Res. 2013, 126, 90–99. [Google Scholar] [CrossRef]
  29. Necpálová, M.; Li, D.; Lanigan, G.; Casey, I.A.; Burchill, W.; Humphreys, J. Changes in soil organic carbon in a clay loam soil following ploughing and reseeding of permanent grassland under temperate moist climatic conditions. Grass Forage Sci. 2014, 69, 611–624. [Google Scholar] [CrossRef]
  30. Bhogal, A.; Murphy, D.V.; Fortune, S.; Shepherd, M.A.; Hatch, D.J.; Jarvis, S.C.; Gaunt, J.L.; Goulding, K.W.T. Distribution of nitrogen pools in the soil profile of undisturbed and reseeded grasslands. Biol. Fertil. Soils 2000, 30, 356–362. [Google Scholar] [CrossRef]
  31. Cui, J.; Holden, M. The relationship between soil microbial activity and microbial biomass, soil structure and grassland management. Soil Tillage Res. 2015, 146, 32–38. [Google Scholar] [CrossRef]
  32. Velthof, G.L.; Hoving, I.E.; Dolfing, J.; Smit, A.; Kuikman, P.J.; Oenema, O. Method and timing of grassland renovation affects herbage yield, nitrate leaching, and nitrous oxide emission in intensively managed grasslands. Nutr. Cycl. Agroecosyst. 2010, 86, 401–412. [Google Scholar] [CrossRef] [Green Version]
  33. Regan, J.T.; Fenton, O.; Healy, M.G. A review of phosphorus and sediment release from Irish tillage soils, the methods used to quantify losses and the current state of mitigation practice. Biol. Environ. Proc. R. Ir. Acad. 2012, 112B, 157–183. [Google Scholar] [CrossRef]
  34. Walling, D.E.; Webb, B.W. Suspended load in gravel-bed rivers: UK experience. In Sediment Transport in Gravel-Bed Rivers; Thorne, C.R., Bathurst, J.C., Hey, R.D., Eds.; Wiley: Chichester, UK, 1987; pp. 691–723. [Google Scholar]
  35. Butler, P.J.; Haygarth, P. Effects of tillage and reseeding on phosphorus transfers from grassland. Soil Use Manag. 2007, 23, 71–81. [Google Scholar] [CrossRef]
  36. Smith, D.R.; King, K.W.; Williams, M.R. What is causing the harmful algal blooms in Lake Erie? J. Soil Water Conserv. 2015, 70, 27A–29A. [Google Scholar] [CrossRef]
Figure 1. (a) the location of the Blackwater catchment within the island of Ireland, (b) topographic scene with field boundaries and river channel outlined, and (c) conditions of the study site in June 2020 following inversion tillage and reseeding.
Agriculture 12 01854 g001
Figure 2. Interpolated soil nutrient content (mg L−1) for (a) P in 2020; (b) P in 2021; (c) K in 2020; (d) K in 2021; (e) Mg in 2020; (f) Mg in 2021; (g) S in 2020; (h) S in 2021; (i) pH in 2020 and (j) pH in 2021. Included are gridded soil sampling points and 2-metre contour intervals.
Agriculture 12 01854 g002aAgriculture 12 01854 g002b
Figure 3. Interpolated total soil C (%) and total soil N (%) content for (a) C in 2020; (b) C in 2021; (c) N in 2020 and (d) N in 2021. Included are gridded soil sampling points and 2-metre contour intervals.
Agriculture 12 01854 g003aAgriculture 12 01854 g003b
Figure 4. Identified erosion and deposition zones and areas of no detectable microtopographical elevation changes. Bulk density sampling point locations are marked.
Agriculture 12 01854 g004
Figure 5. Total Monthly Rainfall Amount (mm) and Average Monthly COSMOS Volumetric Soil Moisture content (%) from April 2020–July 2020.
Agriculture 12 01854 g005
Table 1. Average Soil Nutrient Content (mg L−1) for P, Mg, K, and S, Total Soil C (%) and Total Soil N (%) of corresponding 35 m gridded soil sampling points for identified deposition and erosion zones.
Identified ZoneP (mg L−1)Mg (mg L−1)K (mg L−1)S (mg L−1)Total Soil C (%)Total Soil N (%)
Deposition Zone21.5124.0155.09.75.60.5
Erosion Zone17.4175.3183.311.16.10.6
Table 2. Calculated percentage change in soil nutrient content (mg L−1) and soil pH from 2020 to 2021 per gridded sample point. Absolute value change from 2020 to 2021 is given in brackets. Green (yellow) coloured cells indicate a decrease (increase) in nutrient content from 2020 to 2021.
Percentage Change in Soil Nutrient Content and Soil pH from 2020 to 2021
Sample Point IDSoil P ContentSoil K ContentSoil Mg ContentSoil S ContentSoil pH
136.7% decrease (11.7)2.9% decrease (5.0)0.9% increase (1.0)8.9% increase (0.72)8.1% increase (0.46)
230.0% decrease
(3.9)
7.7% decrease (10.0)6.6% decrease (7.0)4.8% decrease (0.46)13.8% increase (0.74)
311.9% decrease (2.4)32.2% decrease
(95.0)
17.3% decrease (23.0)9.1% decrease (0.91)14.1% increase (0.80)
452.0% decrease (6.5)37.5% decrease (60.0)14.2% decrease (21.0)18.9% decrease (2.16)16.0% increase (0.88)
55.1% increase (0.9)4.6% increase (5.0)6.9% decrease (8.0)0.8% decrease (0.08)14.4% increase (0.90)
647.7% decrease (10.2)24.1% decrease (35.0)14.8% increase (17.0)25.7% decrease (3.36)15.9% increase (0.88)
Table 3. Calculated percentage change in soil total N (%) and soil total C (%) from 2020 to 2021 per gridded sample point. Absolute value change from 2020 to 2021 is given in brackets. Green (yellow) coloured cells indicate a decrease (increase) in nutrient content from 2020 to 2021.
Percentage Change in Soil Total N (%) Content and Soil Total C (%) Content from 2020 to 2021
Sample IDSoil Total N (%) ContentSoil Total C (%) Content
139.1% increase (0.2)42.3% increase (2.1)
227.6% increase (0.1)31.1% increase (1.6)
38.2% increase (0.1)54.9% increase (2.5)
430.5% decrease (0.2)29.7% decrease (1.9)
53.0% decrease (0.2)27.2% decrease (1.9)
618.9% decrease (0.1)14.7% decrease (0.9)
Table 4. Volume change rates, deposition and erosion rates, and sediment mass wasting rates related to soil erosion induced by tillage and reseeding.
Identified ZoneDeposition ZoneErosion Zone
Volume Change Rates (m3)39.1% increase (0.2)42.3% increase (2.1)
Volume Change Rates (m3 ha−1)27.6% increase (0.1)31.1% increase (1.6)
Deposition/Erosion Rate (cm)8.2% increase (0.1)54.9% increase (2.5)
Deposition/Erosion Rate (cm ha−1)30.5% decrease (0.2)29.7% decrease (1.9)
Mass Wasting Rates of Sediment (kg)3.0% decrease (0.2)27.2% decrease (1.9)
Mass Wasting Rates of Sediment (kg ha−1)18.9% decrease (0.1)14.7% decrease (0.9)
Table 5. Accumulation and losses of P, Mg, K, S, C, and N associated with grassland tillage and reseeding-induced sediment movement. Included is an adjusted representation of nutrient losses assuming identified deposition values correspond to deposition of eroded fractions.
Identified ZoneDeposition ZoneErosion ZoneDeposition-Adjusted Losses
Soil P Accumulation/Losses (mg)32772984−292
Soil P Accumulation/Losses (mg ha−1)88558778−76
Soil Mg Accumulation/Losses (mg)18,90130,14611,245
Soil Mg Accumulation/Losses (mg ha−1)51,07188,66137,590
Soil K Accumulation/Losses (mg)23,62631,5227895
Soil K Accumulation/Losses (mg ha−1)63,83892,70728,868
Soil S Accumulation/Losses (mg)14811913432
Soil S Accumulation/Losses (mg ha−1)400356281624
Soil C Accumulation/Losses (mg)8491041192
Soil C Accumulation/Losses (mg ha−1)22943064770
Soil N Accumulation/Losses (mg)8210422
Soil N Accumulation/Losses (mg ha−1)22230886
Publisher’s Note: MDPI stays neutral with regard to jurisdictional claims in published maps and institutional affiliations.