Abstract
Rural livelihood diversification has become a central policy in rural development and poverty alleviation. Farmworkers in irrigation schemes are a typical poor sub-group that has received little attention in research regarding their livelihood status and the contribution of diversification. This paper provides evidence derived from a study that was carried out to examine whether farmworkers in the study area diversify their livelihoods and identify their choices of livelihood-diversification strategies and the determinants thereof. Data were collected from 191 randomly selected farmworkers and analyzed using the binary probit model and the multinomial logistic model. Variables considered in the binary probit model—gender, number of dependents, employment type, farming experience, land leasing, and market access—influenced livelihood diversification among irrigation farmworkers in a statistically significant way. The multinomial logistic model analysis considered age, marital status, household dependents, leasing land from employer, farming experience, agricultural training, and access to markets as the statistically significant factors that influence the choice of livelihood-diversification strategies in the study area. The study concluded that rural development policies should consider leasing land to irrigation farmworkers that is adequate to reduce poverty, achieve food security, and sustain the livelihoods of farmworkers in the study area, as it boosts the generation of income.
1. Introduction
Despite the minimum rainfall in many areas in sub-Saharan African countries, their agricultural production is almost entirely dependent on rain-fed farming [1]. Irrigation reduces or removes water deficit as a limiting factor in plant growth and makes it possible to grow crops where the climate is otherwise too dry for this purpose and to increase crop yields where plant-available soil water is a yield-limiting factor during parts or all of the growing season [2]. Approximately 30% of the world’s food production comes from approximately 18% of the total cultivated land that is under irrigation [3]. Fanadzo and Ncube [4] stated that Africa’s poor performance in poverty reduction can, to a large extent, be attributed to its limited reliance on irrigation farming. The fact that developed countries have significantly reduced poverty through the use of irrigation, while poverty has increased in Africa in recent years, is an indication of the key role irrigation can play in enhancing food security and eradicating poverty for people engaged in rural livelihoods [4].
In South Africa, water deficiency has caused the government to focus on smallholder irrigation schemes to sustain rural livelihoods by creating employment for irrigation schemes farmworkers to reduce poverty and boost pro-poor sustainable agricultural and economic growth [5]. South Africa’s water deficiency is caused by low, erratic rainfall and high evaporative demand, which limits rain-fed crop production in most of the country. Irrigated agriculture, therefore, presents an attractive strategy under these conditions. A smallholding farmer in an irrigation scheme in South Africa can acquire about 1.5 hectares of land, while the total size of the schemes can range from 5 hectares to more than 1000 hectares [6]. Approximately 180 public irrigation schemes in the Limpopo Province, on approximately 20,788 ha, are government-supported [5].
In Africa, agriculture has a substantial social and economic footprint. The agricultural sector contributes approximately 23% of sub-Saharan Africa’s GDP [7]. Worldwide, many families in rural areas depend on farming to sustain themselves. Agriculture is an essential source of income, employment, and food [8]. Approximately 80% of jobs in poor African countries are linked to agriculture [7]. Rural households in sub-Saharan Africa are involved in agriculture, yet they are poor, with many reporting food shortages for several months per year. Musumba et al. [9] proposed livelihood diversification as a viable strategy for enhancing livelihoods.
Livelihood diversification occurs when households undertake a variety of activities and social support capabilities for survival and improvement of living standards [10,11]. Diversification can protect vulnerable households from environmental and economic shocks [12]. Shocks disrupt household income and consumption flows and cause welfare losses in developing countries [13]. Catastrophic disasters, such as storms, floods, and droughts, can directly deplete household resources, drive poverty traps, increase inequality, and exacerbate poverty for people who are already poor [14]. In addition, certain particular shocks, such as health shocks, can endanger households and limit the ability of major earners to work, increasing healthcare costs and undermining the constant flow of income [13]. Eneyew and Bekele [12] pointed out that livelihood-diversification strategies are complex.
Rural households in Ethiopia, an example of sub-Saharan African countries where the rural population depends primarily on agriculture to sustain their livelihoods, participate in diverse livelihood strategies beyond agriculture. These strategies include non-farm and off-farm activities [15]. The additional livelihood activities contribute to income and enable people to cope with different livelihood shocks, trends, and seasonal changes associated with agricultural production [15]. South Africa is no exception, as most of the households in its rural areas are involved in agricultural activities, making diversification of rural livelihood systems desirable. As such, rural households across South Africa participate in informal markets. Baiphethi and Jacobs [16] showed that hawkers in informal markets considered income from their trading as a primary source of income.
Several studies in Africa, e.g., Nigeria [17], South Africa [18], and Zimbabwe [19], have assessed the quality of work-life, seasonal food insecurity, and land reforms or land grabs among farmworkers in rural areas. However, the recent empirical literature that is available to guide policymakers concerning poverty, welfare, and livelihood diversification among farmworkers in irrigation schemes in South Africa is scarce. Hence, this study examines whether irrigation scheme farmworkers who either rent or do not rent irrigation plots from their employers should diversify their livelihoods and identifies the determinants and choice of livelihood-diversification strategies in the Limpopo Province of South Africa. The study hypothesized that leasing land from employers influences irrigation farmworkers in diversifying their livelihoods.
2. Literature Review
In the last decade, research has focused on livelihood-diversification strategies and choices [20,21,22]. While research and the growing body of literature on livelihood strategies and choices have been steadily increasing elsewhere in the last decade, there seems to be a lack of recent similar work in South Africa with regard to irrigation scheme farmworkers. One of the contributions of the sustainable livelihoods framework, adopted in this study, is to deepen the understanding of poverty and its causes in rural Africa through empirical studies [20]. Different factors determine the choice of livelihood-diversification strategies at the farm and non-farm levels. These factors are broadly characterized by personal and household attributes, farm or plot characteristics, and socioeconomic factors [20,23]. Wondim, Kassegn, and Endris [24,25] found that a respondent’s advanced age and access to agricultural training negatively affect livelihood-diversification activities. Wondim [24] discussed the effect of age of the household head on diversification and pointed out that as age increases, a farmer will be less capable of diversifying outside agriculture. Older farmers are more experienced in agricultural production, more resistant to new ideas and information, and, hence, less likely to diversify. Young farmers are relatively better educated, have better access to technologies, and look for alternative livelihood opportunities.
Women play an essential role in agriculture in Africa [26]. In sub-Saharan Africa, women make up more than half of the agricultural workforce and contribute approximately 80% of the labor in food production [26]. Women are key actors in achieving the transformative economic, environmental, and social changes needed for poverty alleviation and sustainable development [27]. However, persistent gender inequality limits women’s contributions to agricultural development and to accessing the associated agricultural benefits [15]. Compared to men, women farmers usually have limited access to financial services, land, jobs, agricultural training, and advisory services. In Kenya, for example, only 5% of the land is owned by women farmers. This is due to the patriarchal nature of the land heritage culture [26].
According to Gebru et al. [20], the level of education within a household has a positive relationship with the household’s livelihood-diversification strategies. Educated persons have a better ability to diversify livelihood strategies, as they have better skills, experience, and knowledge [24]. The number of dependents in a household positively influences welfare and secures livelihoods through the deployment of active household members in diverse employment opportunities [7].
Leasing land in an irrigation scheme allows farmers to better address rain-independent crop production failures due to climate change-related risks such as drought [20]. In addition, the surplus income generated by irrigation can strengthen the economic capacity that is needed to participate in various non-agricultural livelihood-diversification activities to improve household livelihood and food security levels [20]. Land size allows multiple crops to grow, which generates surplus household income. Additional income might be used to participate in non-farm operations, in particular self-employment [28]. However, Barbier et al. and Kassem et al. [29,30] found that household land size was negatively associated with the probability of diversifying livelihoods. Homes with large land sizes participated less in non-farm and off-farm livelihood-diversification strategies and participated more in on-farm strategies.
Etuk et al. [31] identified marital status as a positive influence on livelihood diversification and a direct influence on income levels. Felkner et al. [32] revealed that market access significantly contributed to livelihood diversification and directly influenced income levels generated from off-farm business activities According to Wondim [24], farming experience has a probability of increasing farming, improving livelihoods, and reducing livelihood diversification. Similarly, [11] revealed that an increasing number of years of experience in farming decreases the probability of livelihood diversification. Scoones et al. [33] analyzed the livelihoods of former farmworkers in Zimbabwe and found that the type of employment influenced farmworkers’ livelihood.
Manase and Takunda [34] asserted that on-farm employment is not guaranteed, which encourages workers to find other ways to fend for themselves and their families. Therefore, compared with casual work, permanent employment limits farmworkers in accessing skills or networks that are needed to engage in sustainable alternative livelihood strategies [33]. In addition to understanding rural households’ preferred livelihood strategies, the underlying variables that are responsible for livelihood-diversification strategies among farm workers are equally important. Livelihood-diversification decisions can clarify farmworkers’ strategic choices. Understanding the local context of household livelihoods is necessary not only to ensure appropriate development strategies, but also as a basis for monitoring and evaluation and as a means of assessing the potential for replication in other contexts.
3. Materials and Methods
3.1. Description of the Study Area
This study was carried out in the Tshiombo Irrigation Scheme located 40 km north of the Thohoyandou Service Centre, Vhembe District, in the Limpopo Province of South Africa (Figure 1). The scheme covers 1195 hectares with 930 plots; each farmer owns an average of 1.286 hectares. The irrigators in the scheme are from seven villages [2]. The average rainfall is ±500 mm/annual, with most rain falling during summer (October to March). The rainfall distribution is uneven and erratic. The average summer temperatures are around 27 °C, though maximum temperatures can be range from 45 °C to 50 °C. The irrigation scheme offers the local community an opportunity to increase income and participate in the local economy. Irrigation development benefits the rural poor in various ways, including (a) reduced food prices resulting from increased production and (b) increased on-farm and off-farm employment, leading to income generation for the poor (Machethe et al., [35]). Approximately 50% of the farmers also sell crops in the formal markets, with maize, cabbages, potatoes, tomatoes, onions, beans, spinach, and butternut being the most commonly produced crops in the irrigation scheme [35].
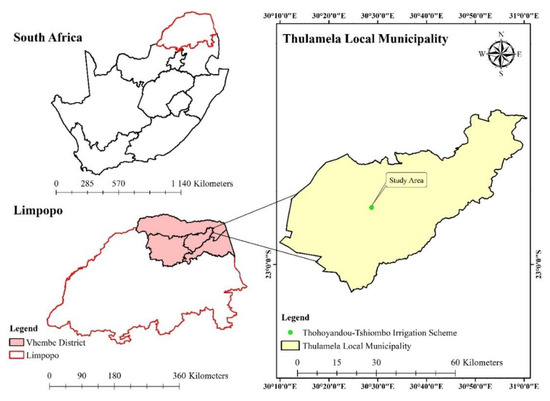
Figure 1.
Study site, Limpopo Province (Source: Author).
3.2. Sampling Size and Sample Technique
A simple random sampling technique was used to identify the Tshiombo Irrigation Scheme’s farmworkers. The sampling formula of [36] was applied to compute the sample size, as shown below:
where n is the sample size, Z is the desired confidence level, e is the desired level of precision, p is the maximum variance, and q is 1 − p. The study used a confidence level of 95% and a 5% level of precision. The p took the value of 0.05, as the variation level among irrigation farmworkers in the Tshiombo Irrigation Scheme was unknown. Therefore, from a population of 225 irrigation farmworkers, the desired sample size was 191.
3.3. Data Collection
A structured questionnaire was administered through face-to-face interviews in the study area with the 191 farmworkers. Irrigation farmworkers were asked if they diversified from farm work and for their choices of livelihood-diversification strategies. Positive responses were coded as Yes (1); otherwise, the responses were coded as No (0). Irrigation farmworkers were asked about their employment types, which were coded as (1) for permanent farmworkers and (0) for seasonal farmworkers. Two focus group discussions with the farmworkers in the irrigation scheme were held to share and validate the survey findings. One focus group comprised eight women and the other had eight men. The group with only women allowed them to participate fully, without intimidation. Consent forms to participate in the meeting were handed to each of the participants, who were asked to sign the forms freely.
3.4. Ethics Statement
The study was performed in accordance with the ethical standards of the 1964 Declaration of Helsinki and its later amendments and approved by the Humanities and Social Sciences Research Ethics Committee (HSSREC) of the University of KwaZulu-Natal (protocol reference number: HSS/0415/019M 19 July 2019). In 2019, the Department of Agriculture in the Vhembe District of the Limpopo Province granted permission to carry out the study.
3.5. Method of Analysis
Data were captured and analyzed using the Statistical Package for Social Scientists (SPSS) version 26 and STATA version 17 software. Before the analysis of the variables, the ShapiroWilk test was applied to test the normality of the explanatory variables using the SPSS. From the test conducted, if the p-value of the Shapiro–Wilk test was greater than 0.05, the data were considered normal. A one-way analysis of variance (ANOVA) parametric test was used to analyze the descriptive statistics for the continuous variables. The p-values were generated by the SPSS for the ANOVA parametric test, which was validated by the following conditions: the variables were checked to satisfy normality, the variance in the samples was approximately equal, and the data were randomly and independently sampled from the population. A chi-square test was used to analyze the descriptive statistics of the categorical variables, using the SPSS. The SPSS generated the p-values throughout the study. The significant levels for the coefficients in the study were categorized into three levels: 1%, 5%, and 10%. STATA was used for econometrics modeling.
3.6. Estimating the Determinants of Farmworkers’ Livelihood Diversification: The Binary Probit Regression Model
The binary probit model was employed to determine whether or not an individual respondent diversified his or her livelihood from farming activities. A probit model is also called a probit regression model, which is used to model a binary response variable. The assumptions under this model are that (1) we must have enough data from more than 30 observations, (2) the data are assumed to follow a normal standard and the error follows the standard normality, and (3) the categorical predictors are assumed to have a linear effect on the response variable [37]. The model perfectly fits the objective of this study, as it applies when the dependent variable has two categorical outcomes, diversified or not diversified, which are coded as 1 and 0, respectively. A respondent who diversified from farm work was coded as (1) and a respondent who had not diversified was coded as (0).
The model may be econometrically stated as follows:
where is the probability that a respondent diversified; represents the ith explanatory variables; α and are regression parameters to be estimated; and e is the base of the natural logarithm.
For ease of interpretation of the coefficients, a probit model may be written in terms of the odds and a log of odds. The odds ratio is the ratio of the probability that a respondent diversified livelihood income () to the probability that a respondent did not diversify livelihood income (1 − ). That is:
Taking the natural logarithm of Equation (2) yields the following:
If the disturbance term Ui is considered, the probit model becomes:
where represents the ith predictor variables. The parameters of the model, α and β, can be estimated using the maximum likelihood method [37].
3.7. Estimating the Determinants of Farmworkers’ Livelihood-Diversification Strategies
Ahmed et al. [38] used the Simpson Diversification In dex to measure livelihood diversification as a vector of income shares associated with different income sources. While Ayana et al. [7] used the Herfindahl–Hirschman Index to estimate the level of households livelihood diversification. However, in our study, a multinomial logistic (MNL) regression model was considered more appropriate for analyzing the factors that influence the choice of livelihood strategies among the Tshiombo Irrigation Scheme farmworkers. The model was selected because the responses of households with respect to livelihood strategies were expected to be polytomous. Logistic regression can be extended to handle polytomous responses, such as responses that are provided in greater than two categories [39]. One of the underlying motivations for a household’s alternative livelihood strategies is maximizing utility [39]. The model for determining the probability that a household chooses an alternative livelihood strategy set is the MNL model, if the sets are nominal. The model exhibits a superior ability to predict livelihood diversification and to pick up the differences between the livelihood strategies of rural households [39]. However, for one to use the MNL model, the households must be clustered into different categories and the basic assumption is that households in a given category participate in some given livelihood strategies; hence, households cannot participate in strategies that are chosen by households in another category [39].
The probability associated with the choice of a livelihood strategy is denoted by (j = 1–4), where i represents the household; j(1) represents the g household choosing on-farm alone; j(2) represents the household choosing on-farm and off-farm; j(3) represents the household choosing on-farm and non-farm; and j(4) represents the laboring household choosing on-farm, off-farm, and non-farm income-generating activities (Table 1). The unobserved portion of the utility (εn) is identically and independently distributed (iid) across alternatives [39].

Table 1.
Description of dependent variables used in the models.
The probability that a household with characteristic chooses livelihood strategy ,is modeled as follows:
with the requirement of for any , where is the probability representing the respondent’s chance of falling into category , are the predictors of response probabilities, and represents the covariate effects specific to the response category, with the category as the reference. Then, through normalization of the model, it is assumed that = 0 (this arises because the probabilities total 1, so only J parameter vectors are needed to determine the J + 1 probabilities) (Tizazu et al., 2018), so that exp () = 1, implying that the generalized Equation (1) above is equivalent to the following:
Like the binary logistic model, this implies that we can compute J log-odds ratios that are specified as follows;
Before running the binary probit model and the MNL model, two continuous and nine discrete or binary explanatory variables were checked for multicollinearity, using the variation inflation factor (VIF) and contingency coefficient, respectively. The VIFs for all the continuous variables were less than 10 and greater than one. Similarly, the result of the contingency coefficient test revealed that there was no problem of association among the eleven discrete explanatory variables. This indicated that there was no serious problem of multicollinearity. Therefore, all of the hypothesized explanatory variables (Table 2) that were expected to determine whether or not an individual respondent diversifies his or her livelihood from farming activities were included in the binary probit model, while the expected effect of livelihood choice and adoption of household livelihood-diversification strategies were included in the MNL analysis using STATA software, and only the marginal effects of statistically significant variables were discussed (Table 3 and Table 4).
Table 2.
Description of independent variables used in the binary probit regression model and the multinomial logistic regression model.
Table 3.
Parameter estimates of the binary probit regression model’s analysis on livelihood diversification.
Table 4.
Multinomial logistic results of the factors that influence livelihood-diversification strategies among irrigation farmworkers.
4. Results
4.1. Descriptive Statistics
The explanatory variables were checked for normality and were deemed to be normal. The sample of 191 irrigation farmworkers was dominated by female farmworkers (62.8%); 37.2% of the participants were male farmworkers. In terms of age, 7.3% of the farmworkers were less than 25 years old, 23.6% were between the ages of 46 and 55, and 15.2% were 66 years old or older. In the study, 22.5% of the farmworkers had farming experience ranging from 1 to 5 years, while 24.6% had farming experience of 31 years. With respect to household size, 51.3% of the farmworkers had five to eight dependents in their households, while 4.7% of the farmworkers had nine to 12 dependents. At least 67.7% of the farmworkers were able to save R 1000 or less within 12 months, while 13.6% of the farmworkers hade saved up to R 4000 or more within the preceding 12 month period. With respect to marital status, 52.4% of the farmworkers were single, while 47.6% of the respondents were married. The workers in the irrigation scheme included 67% who were seasonal farmworkers and 33% who were employed permanently in the irrigation scheme. With respect to education levels, 8.8% of the farmworkers did not go to school, 23.6% completed primary school, 55% completed secondary school, and 12.6% of the farmworkers completed tertiary education. With respect to training, 36.6% of the farmworkers had acquired agricultural training, while 63.4% had no such training. With respect to diversification, 55.5% of the farmworkers diversified their livelihoods, while 44.5% of the farmworkers did not. At least 80.1% of the farmworkers had access to markets. The study revealed that at least 40.3% of the farmworkers were able to lease land, while the rest could not lease land in the irrigation scheme.
4.2. Irrigation Farmworkers’ Livelihood-Diversification Strategies
Figure 2 shows that 43.5% of the irrigation farmworkers were able to diversify their livelihoods into on-farm and non-farm activities: 24.1% of the farmworkers diversified to on-farm alone, 19.4% of the farmworkers diversified to on-farm and off-farm and non-farm, and 13.1% of the farmworkers diversified into on-farm and off-farm income-generating livelihood strategies.
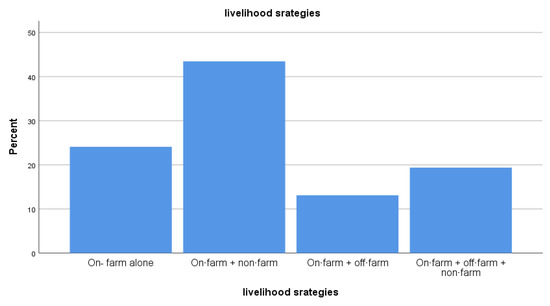
Figure 2.
Choice of livelihood-diversification strategies adopted by the irrigation farmworkers. Source: Research survey, 2020.
Table 5 presents the parametric one-way ANOVA results of the continuous variables. The age of the irrigation farmworkers was statistically significant, differently across the livelihoods (p < 0.01). The ANOVA indicated that farmworkers with a mean age of 48 years only participated in on-farm activities, those who had a mean age of 47 years participated in a combination of on-farm and non-farm activities, those with a mean age of 49 years were able to participate in a combination of on-farm and off-farm activities, and those who had a mean age of 39 years were able to participate in a combination of on-farm, off-farm, and non-farm activities.
Table 5.
Parametric one-Way ANOVA results for irrigation farmworkers’ livelihood-diversification strategies.
Table 6 presents the chi-square test results of the categorical variables. A statistically significant relationship exists between irrigation farmworker livelihood-diversification strategies and marital status (p < 0.01). Table 6 shows that 16% of the irrigation farmworkers who were single participated only in on-farm activity, 54% participated in on-farm and non-farm activities, 12% participated in on-farm and off-farm activities, and 18% participated in a combination of on-farm, off-farm, and non-farm activities. In the category of irrigation farmworkers who were married, 33% participated only in on-farm activity, 31.9% participated in on-farm and non-farm activities, 14.3% participated in on-farm and off-farm activities, and 20.9% participated in a combination of on-farm, off-farm, and non-farm activities.
Table 6.
Association between livelihood-diversification strategies and socioeconomic parameters.
A statistically significant relationship, as shown in Table 6, was found between irrigation farmworkers’ livelihood-diversification strategies and their levels of education (p < 0.05). The results indicated that 22.4% of irrigation farmworkers who did not have any formal education participated only in on-farm activity, 48.2% participated in on-farm and non-farm activities, 18.8% participated in on-farm and off-farm activities, and 10.6% were able to participate in a combination of on-farm, off-farm, and non-farm activities. In the category of irrigation farmworkers who obtained formal education, 25.5% participated only in on-farm activity, 39.6 participated in on-farm and non-farm activities, 8.5% participated in on-farm and off-farm activities, and 26.4% were able to participate in a combination of on-farm, off-farm, and non-farm activities.
A statistically significant relationship, as shown in Table 6, was found between irrigation farmworkers’ livelihood-diversification strategies and farmworkers’ leasing of land from employers (p < 0.01). The results indicated that 28.1% of irrigation farmworkers who leased land from employers participated only in on-farm activity, 36.8% participated in on-farm and non-farm activities, 8.8% participated in on-farm and off-farm activities, and 26.3% participated in a combination of on-farm, off-farm, and non-farm activities. In the category of irrigation farmworkers who could not lease land from employers, 18.2% participated only in on-farm activity, 53.2% participated in on-farm and non-farm activities, 19.5% participated in on-farm and off-farm activities, and 9.1% participated in a combination of on-farm, off-farm, and non-farm activities.
A binary probit model was used to estimate the parameters responsible for livelihood diversification among the irrigation farmworkers in the study areas (Table 3). The results indicated that all of the estimated coefficients were statistically significant, as the LR X2 statistic was statistically significant (p < 0.01). The coefficients of the binary probit model did not represent the magnitude of the effects of the explanatory variables. Instead, the marginal effects were discussed. The marginal effects (ME) measured how a unit change in the average value of the independent variables influenced the probability of whether or not a respondent diversified his or her livelihood from farming activities.
Table 4 depicts the factors that influence livelihood-diversification strategies of irrigation farmworkers. The results indicated that all of the estimated coefficients were statistically significant, as the LR X2 statistic was statistically significant (p < 0.01). The interpretation of significant variables was based on the marginal effects. The binomial and polynomial responses of the dependent variables and the coefficients of the independent variables had no complete meaning for interpretation, beyond reflecting the direction of the relationship.
Table 7 shows a multicollinearity test for the variables that was carried out, showing a variance inflation factor (VIF) for each variable. A high level of tolerance occurred among the variables, which indicated that there was no serious multicollinearity among the variables used in the analysis. The Cox and Snell square and Nagelkerke R square were not statistically significant. This indicated that the data fit the model well for this study.
Table 7.
Multicollinearity test for explanatory variables.
5. Discussion
5.1. Determinants That Influence Livelihood Diversification among Irrigation Farmworkers
Gender had a positive impact on livelihood diversification among the irrigation farmworkers, implying that male-headed households have a higher probability of diversifying livelihood activities. The marginal effect showed that male-headed homes had a 21.8% higher likelihood of becoming diversified than woman-headed households. This finding was consistent with those of Lutomia et al., and Olumeh [26,40]. During the focus groups, participants mentioned that while women are key participants in agricultural activities, most men migrate from the village to urban areas in search of formal employment, while most women remained in the rural area taking care of their rural households’ livelihoods. Women pointed to the need for them to be participants in various agricultural training, as they are the ones who work on the farms. Therefore, these programs should encourage women to access advanced training in farming, to improve their skills and to be able to sustain their livelihoods and their food security. Goba [41] showed that women face various constraints, such as lack of agricultural training, limited property ownership, and collateral. Women and men have different means of accessing critical economic resources and varying power in making choices that affect their lives, due to gender relations. The variations in power result in an inequality of roles and responsibilities for women and men within rural farming households [41].
Rural farming households engage in non-farm activities, such as migration, to diversify their sources of income and to reduce risks. However, access to the most lucrative non-farm jobs by the poor may depend on gender [42]. For instance, child-care responsibilities can compel women to remain in home-based, labor-intensive jobs, as they are limited in their ability to engage in non-farm activities. The majority of the paid employment options for rural men and women are typically seasonal. However, women are more likely than men to be employed seasonally, part-time, or in low-paying occupations, because they often have less education and work experience than men [42]. Olumeh et al. [26] indicated that women farmers had less access to financial services, land, labor, agricultural markets, and extension services than men. For instance, in Kenya, only 5% of the land is owned by women farmers, which is attributed to the patriarchal culture of land inheritance [26]. By improving gender inequality, women irrigation farmworkers can more effectively adopt adaptive strategies that will alleviate the vulnerability of their livelihoods, help policymakers implement effective policies, and promote sustainable livelihoods.
The number of dependents in a household was found to have a positive and statistically significant impact on livelihood diversification in irrigation farmworkers’ households. The marginal effect showed that a one-unit increase in the number of dependents resulted in a 5.2% higher chance of irrigation farmworkers diversifying their livelihoods. This finding was consistent with that of Ayana et al. [7], who indicated that the number of dependents in a household had a positive effect on livelihood diversification. Oluwaseun and Tekana [11] found similar results and reported that a large dependency ratio significantly and positively influenced a rural household head to diversify livelihood income sources. Therefore, a dependency ratio will push the household head to diversify into other activities that can bring more revenue to the home [25,41]. The implication is that the fewer the number of dependents, the smaller the quantity of food that the household requires and the better the chances of achieving food security and earning more income to sustain their livelihoods (Table 5).
The employment type of the farmworker had a negative effect on livelihood diversification among irrigation farmworkers. The marginal effect showed that the permanent employment of irrigation farmworkers resulted in a 15% lower chance of the irrigation farmworkers becoming diversified. A plausible explanation could be that seasonal employment offered farmworkers a chance to diversify into other income-generating activities, unlike permanent employment. These results were consistent with those of Manase and Takunda [34] and Scoones et al. [33], who showed that permanent employment limited farmworkers’ access skills or networks for engaging in sustainable alternative livelihood strategies, compared with casual farm workers.
Years of farming experience had a negative and statistically significant impact on livelihood diversification among irrigation farmworkers. The implication is that the number of years of farming experience decreased the probability of livelihood diversification. The more the experience in farming, the lower the diversification of livelihoods, as the household head would have greater experience and be more invested in agriculture. The marginal effect showed that a year’s increase in farming experience reduced the probability of irrigation farmworker households becoming diversified by 1.3%. These results were consistent with those of Wondim [24], who asserted that lack of farming experience among rural farming households had a negatively impact on the probability of improving rural farming households’ livelihoods.
This study’s hypothesis was that leasing land from employers influences irrigation farmworkers to diversify their livelihood. The results in Table 4 show that there was a statistically significant and positive relationship between leasing land and food security among irrigation farmworkers. Similarly, Table 5 shows that leasing land was statistically significant and, as expected, had a positive influence on farmworkers’ livelihood diversification. The marginal effect indicated that farmworkers leasing land had a higher chance (16.6%) of diversifying their livelihoods. This result suggests that irrigation farmworkers who have access to lease land have better choices in sustaining their livelihoods by adopting combinations of livelihood-diversification strategies. This finding was consistent with that of Gebru et al. [20] and Chang, and Takahashi [28], who indicated that the ability to access land is a significant resource in the expansion of rural households’ incomes, as it can be combined with two or three other livelihoods activities.
Access to markets increased the probability of a farmworker’s household diversifying livelihood activities. The marginal effect showed that access to markets led to a 19.1% higher chance of irrigation farmworkers becoming diversified. That relationship could indicate that market access exposes farmworker households to other livelihood strategies. Prowse [43] asserted that distance to markets and towns and the availability of electricity determined non-farm income diversification in rural areas.
5.2. Factors That Influence the Choice of Livelihood-Diversification Strategies
Table 3 shows that the age of irrigation farmworkers is significantly different statistically across the livelihood strategies. The MNL, as shown in Table 6, indicated that as the age of farmworkers increased, farmworkers were more likely to adopt a combination of the reference categories only. Therefore, the odds ratio depicted that, if other factors were held constant, the odds ratio in favour of the probability of the households diversifying into livelihood strategies that combined on-farm plus off-farm and non-farm income \decreased by a factor of 0.01 as the farmworkers ages increases by one year. This result aligned with the findings of a study conducted by Emmanuel [44] in Ghana, which concluded that the age of irrigation farmworkers decreased the ability of the household to engage in a combination of livelihood-diversification strategies, thus negatively affecting the welfare and food security status of rural households. The probable reason is that young families are relatively better educated, have better access to technologies, and look for alternative livelihood opportunities [25]. The age structure of rural household heads was also found to negatively and significantly affect the decision choice of respondents regarding a combination of off-farm and non-farm activities [6]. A year’s increase in the age of the heads of households was likely to shift the choices of respondents’ livelihood-diversification strategies to sustain their livelihoods [6].
As shown in Table 3, the results showed that there was a statistically significant and positive relationship between marital status and livelihood income-generating strategies among irrigation farmworkers., Table 6 also shows that the marital status of the respondents significantly and positively influenced the participation of farmworkers in on-farm activities only and in a combination of on-farm, off-farm, and non-farm income-generating activities, respectively. Interpretation of the odds ratio depicted that, if other factors were held constant, the odds ratio in favor of the probability of the households participating in on-farm only activities and a combination of on-farm, off-farm, and non-farm income-diversified livelihood strategies increased by a factor of 0.209 and 0.017, respectively, as the marital status of farmworkers increased by 1. The justification behind this result is that farmworkers who have spouses form part of a productive labor force, as they can join or combine the surplus income acquired from various income-generating activities.
In Table 6, the MNL shows that a unit increase in dependency causes and 0.037 chance of farmworkers adopting the reference category combinations opposing the combination of on-farm and off-farm income-generating activities. The rationale behind this result is that an increase in dependency on the household leads to a shortage of working hands to earn from diversified activities to fulfil household needs and affects livelihood diversification negatively. The result of this study is consistent with the findings obtained by [20].
This study’s hypothesis was that irrigation farmworkers who lease land from their employer have more options in the choice of livelihood diversification income strategies. As shown in Table 4, the results of our study showed that there was a statistically significant and positive relationship between leasing land and farmworkers’ livelihood-diversification strategies. The results shown in Table 6 also indicate that leasing land was statistically significant and, as expected, had a positive influence on farmworkers’ livelihood-diversification strategies. The interpretation of the odds ratio depicted that, if other factors were held constant, the odds ratio in favor of the probability of the irrigation farmworker diversifying into a combination of on-farm plus off-farm and non-farm income-diversified livelihood strategies increased by a factor of 0.114. However, a study by Kassegn and Endris [25] asserted that the area of land owned by the household had a significant and negative association with the probability of selecting a diversified livelihood. Households with large land sizes participated less in non-farm and off-farm livelihood-diversification strategies and participated more in on-farm strategies only. This was plausible and may have been because households with more land tend to follow agricultural intensification rather than diversification [29].
The years of farming experience by farmworkers were statistically significant and positively influenced the participation of the respondents in a combination of on-farm plus off-farm and in a combination of on-farm plus off-farm plus non-farm income-diversified livelihood strategies. The interpretation of the odds ratio in favor of the probability of the respondents diversifying into a combination of on-farm plus off-farm and a combination of on-farm plus off-farm and non-farm income-diversified livelihood strategies increased by a factor of 0.12 and 0.02, respectively. A possible explanation is that irrigation farmworkers who have worked in the agricultural field for an extended period know how to adjust when faced with economic challenges, such as retrenchment or when the farm owner has passed on, off-season unemployment, and general increases in the prices of basic needs, including food, such as maize meal and meat. This finding agreed with that of [24].
As Table 6 shows, farmworkers’ access to attend irrigation training statistically significantly and positively influenced the respondents’ participation. The odds ratio interpretation implied that if other influencing factors were held constant, the odds ratio in favor of the probability of a farmworker household head choosing a combination of on-farm plus off-farm income-diversified livelihood strategies increased by a factor of 0.58. A possible explanation is that the skills acquired from a course assist irrigation farmworker households in obtaining more revenue, as participation in irrigation helps them to strengthen their economic capacity to participate in different livelihood-diversification activities. Gebru et al. [20] showed that household heads who had access to potential small-scale irrigation and use it properly made surplus production and better income. Therefore, this helped them cope with the failure of rain-dependent crop production, compared with nonusers of irrigation, due to the risks associated with drought and other climate-change-induced factors.
As expected, access to the market was statistically significant and had a positive influence on irrigation farmworkers diversifying their livelihoods into a combination of on-farm plus off-farm and non-farm income-generating activities. The result of the odds ratio depicted that by keeping the influence of other factors constant, the odds ratio in favor of the likelihood of the irrigation farmworker choosing a combination of on-farm plus off-farm and non-farm income-generating livelihood-diversification strategies increased by a factor of 0.064. This was in line with the study by Abdiassa [21], which found that rural household heads living around and having access to market centers had higher involvement in livelihood diversification and could diversify their sources of income more than household heads living far from market centers. Gebreyesus [45] concluded that a walking distance to the nearest market yielded a positive and significant influence on the level of livelihood diversification. A positive and meaningful relationship between market distance and non-farm and off-farm activities could mean that residing nearer to the market enables farm households to engage in non-farm and off-farm activities, mainly trading and service provision. Nearness to a market center provides for access to additional income through on-farm and off-farm employment opportunities, information on inputs, and transportation [25,45].
6. Conclusions and Policy Implications
The main aim of this study was to determine livelihood-diversification strategies among farmworkers of the Tshiombo Irrigation Scheme of the Vhembe District in South Africa. The binary probit model revealed that employment type and years of farming experience negatively influenced the probability of irrigation farmworkers diversifying their livelihoods, while gender, number of dependents, leasing of irrigable land, and market access positively influenced the probability of irrigation farmworkers diversifying their livelihoods. The results showed that gender affects diversification, as men have more livelihood-diversification options, which underscores that in order to ensure sustainable livelihoods and agricultural progress, decreasing gender inequities in agriculture should be in line with international, regional, and national norms. By implication, this study suggested that policymakers should design programs that empower women and take account of the other commitments women have. For instance, radio programs that educate women on how to farm should be aired when women have the time away from domestic chores. Furthermore, the rural irrigation farmworkers in the study area were likely to have a diversified livelihood when they had more experience with age, better livelihood skills developed via training, and more working hands in a household.
The results of the multinomial logistic regression model showed that a farmworker’s choice and adoption of livelihood-diversification strategies were determined by the age of the respondent, the marital status of the respondent, access to markets, leasing land from an employer, years of farming experience, and access to agricultural training, and that these factors significantly affected households’ choices and adoptions of livelihood-diversification strategies. Regarding the study’s hypothesis, the results showed that leasing land from employers influences irrigation farmworkers in diversifying their livelihoods and that irrigation farmworkers who lease land from their employers have more options in the choice of livelihood-diversification strategies. The study concluded that the agricultural sector cannot stand alone in sustaining livelihoods, reducing poverty, and achieving food security for the irrigation farmworkers in the study area. This is evident, as the majority of farmworkers who lease land also participate in other income-generating combinations, such as off-farm and non-farm activities.
Based on these findings, this study recommends that to improve the livelihood of the respondents, stakeholders and tribal leaders should permit farm owners to lease irrigation scheme plots to their employees to facilitate their adaptation to livelihood-diversification strategies. Farmworkers, with their past farming experience, can then grow their crops, generate additional income by selling in the nearest markets, and become self-employed instead of looking for jobs outside agriculture. The stakeholders should also develop programs that accommodate both older and younger people in agriculture. Policymakers and stakeholders need to reflect on the most suitable ways of supporting livelihood skills development among rural irrigation farmworkers to bring sustainable livelihood outcomes to the area.
Analysis of livelihood-diversification strategies is a broad subject which can be carried out using various analytical tools, such as the Simpson Diversification Index, the multinomial logistic model, the Herfindahl Index, and other tools. This study used the binary probit model and the MNL model to analyze the factors influencing farmworkers’ livelihood-diversification strategies. This study should be supplemented with studies that use other tools for livelihood diversification so that a more comprehensive conclusions can be drawn. Ongoing research on livelihood diversification among farmworkers in irrigation schemes is needed. To fully understand the complex dynamics of this issue, this research would include the following:
- Policymakers should design policies that are sensitive to laborers’ household-level characteristics in promoting livelihood income diversification.
- Rural development strategies should promote non-farm and off-farm activities in rural areas, as they could positively affect the income-generating capacity of irrigation scheme laborers.
- Policymakers should design policies that encourage engagement in informal land-lease contracts to encourage land rental market participation by both farm employers and employees in the rural areas of Tshiombo Village.
- Policymakers need to focus on the most suitable activities for supporting a sustainable livelihood outcome among rural irrigation scheme farmworkers.
Author Contributions
Conceptualization, R.V.A.M., P.M. and M.M.; methodology, R.V.A.M. and M.M.; software, R.V.A.M.; validation, P.M. and M.M.; formal analysis, R.V.A.M.; investigation, R.V.A.M.; resources, P.M.; data curation, R.V.A.M.; writing—original draft preparation, R.V.A.M.; writing—review and editing, R.V.A.M. and P.M.; visualization, R.V.A.M.; supervision, P.M. and M.M.; project administration, P.M.; funding acquisition, P.M. All authors have read and agreed to the published version of the manuscript.
Funding
This research was funded by South Africa’s National Research Foundation (NRF), grant number (86893), for study and collection.
Institutional Review Board Statement
The study was conducted in accordance with the Declaration of Helsinki and approved by the Humanities and Social Sciences Research Ethics Committee (HSSREC) of the University of KwaZulu-Natal (protocol reference number: HSS/0415/019M 19 July 2019).
Informed Consent Statement
Informed consent was obtained from all subjects involved in the study.
Acknowledgments
The authors acknowledge South Africa’s National Research Foundation (NRF) for funding this study. Extension workers and farmers involved in the Tshiombo Irrigation Scheme are honored for their contributions to the success of this study.
Conflicts of Interest
The authors declare no conflict of interest. The funders had no role in the design of the study; in the collection, analyses, or interpretation of data; in the writing of the manuscript; or in the decision to publish the results.
References
- Burney, J.A.; Naylor, R.L.; Postel, S.L. The case for distributed irrigation as a development priority in sub-Saharan Africa. Proc. Natl. Acad. Sci. USA 2013, 110, 12513–12517. [Google Scholar] [CrossRef] [PubMed]
- Van Averbeke, W.; Denison, J.; Mnkeni, P. Smallholder irrigation schemes in South Africa: A review of knowledge generated by the Water Research Commission. Water SA 2011, 37, 797–808. [Google Scholar] [CrossRef]
- Alexandratos, N.; Bruinsma, J. World Agriculture Towards 2030/2050: The 2012 Revision; Esa Working Paper; pp. 1838–2521. FAO: Rome, Italy, 2012. [Google Scholar]
- Fanadzo, M.; Ncube, B. Challenges and opportunities for revitalising smallholder irrigation schemes in South Africa. Water SA 2018, 44, 436–447. [Google Scholar] [CrossRef]
- Van Koppen, B.; Nhamo, L.; Cai, X.; Gabriel, M.J.; Sekgala, M.; Shikwambana, S.; Tshikolomo, K.; Nevhutanda, S.; Matlala, B.; Manyama, D. Smallholder Irrigation Schemes in the Limpopo Province, South Africa; International Water Management Institute (IWMI): Colombo, Sri Lanka, 2017; Volume 174. [Google Scholar]
- Dinku, A.M. Determinants of livelihood diversification strategies in Borena pastoralist communities of Oromia regional state, Ethiopia. Agric. Food Secur. 2018, 7, 41. [Google Scholar] [CrossRef]
- Ayana, G.F.; Megento, T.L.; Kussa, F.G. The extent of livelihood diversification on the determinants of livelihood diversification in Assosa Wereda, Western Ethiopia. GeoJournal 2021, 8, 2525–2549. [Google Scholar] [CrossRef]
- Abera, A.; Yirgu, T.; Uncha, A. Determinants of rural livelihood diversification strategies among Chewaka resettlers’ communities of southwestern Ethiopia. Agric. Food Secur. 2021, 10, 30. [Google Scholar] [CrossRef]
- Musumba, M.; Palm, C.A.; Komarek, A.M.; Mutuo, P.K.; Kaya, B. Household livelihood diversification in rural Africa. Agric. Econ. 2022, 53, 246–256. [Google Scholar] [CrossRef]
- Ellis, F.; Allison, E. Livelihood Diversification and Natural Resource Access; Overseas Development Group, University of East Anglia: Norwich, UK, 2004. [Google Scholar]
- Samuel, O.O.; Sylvia, T.S. Analysis of rural livelihood diversification strategies among maize farmers in North West province of South Africa. Int. J. Entrep. 2019, 23, 1–11. [Google Scholar]
- Eneyew, A.; Bekele, W. Determinants of livelihood strategies in Wolaita, southern Ethiopia. Agric. Res. Rev. 2012, 1, 153–161. [Google Scholar]
- Nguyen, D.L.; Nguyen, T.T.; Grote, U. Shocks, household consumption, and livelihood diversification: A comparative evidence from panel data in rural Thailand and Vietnam. Econ. Chang. Restruct. 2022, 1–33. [Google Scholar] [CrossRef]
- Sawada, Y.; Takasaki, Y. Natural disaster, poverty, and development: An introduction. World Dev. 2017, 94, 2–15. [Google Scholar] [CrossRef]
- Liu, Y.; Zhang, Q.; Liu, Q.; Yan, Y.; Hei, W.; Yu, D.; Wu, J. Different household livelihood strategies and influencing factors in the inner Mongolian grassland. Sustainability 2020, 12, 839. [Google Scholar] [CrossRef]
- Baiphethi, M.N.; Jacobs, P.T. The contribution of subsistence farming to food security in South Africa. Agrekon 2009, 48, 459–482. [Google Scholar] [CrossRef]
- Moda, H.M.; Nwadike, C.; Danjin, M.; Fatoye, F.; Mbada, C.E.; Smail, L.; Doka, P.J. Quality of work life (QoWL) and perceived workplace commitment among seasonal farmers in Nigeria. Agriculture 2021, 11, 103. [Google Scholar] [CrossRef]
- Devereux, S.; Tavener-Smith, L. Seasonal food insecurity among farm workers in the northern cape, South Africa. Nutrients 2019, 11, 1535. [Google Scholar] [CrossRef]
- Ossome, L.; Naidu, S.C. Does Land Still Matter? Gender and Land Reforms in Zimbabwe. Agrar. South J. Political Econ. 2021, 10, 344–370. [Google Scholar] [CrossRef]
- Gebru, G.W.; Ichoku, H.E.; Phil-Eze, P.O. Determinants of livelihood diversification strategies in Eastern Tigray Region of Ethiopia. Agric. Food Secur. 2018, 7, 62. [Google Scholar] [CrossRef]
- Abdiassa, N. Determinants of Rural livelihood strategies: The case of rural Kebeles of Dire Dawa administration. Res. J. Financ. Account. Vol 2017, 8, 62. [Google Scholar]
- Kramer, B.; Lambrecht, I. Gender and Preferences for Non-Farm Income Diversification: A Framed Field Experiment in Ghana; IFPRI: Washington, DC, USA, 2019. [Google Scholar]
- Mada, M. Small-scale Agriculture and it’s hope to food security in Africa: The case of kamba district in Ethiopia. Int. J. Mgmt. Res. Bus. Strat. 2015, 4, 86–98. [Google Scholar]
- Wondim, A.K. Determinants and challenges of rural livelihood diversification in Ethiopia: Qualitative review. J. Agric. Ext. Rural Dev. 2019, 11, 17–24. [Google Scholar] [CrossRef]
- Kassegn, A.; Endris, E. Review on livelihood diversification and food security situations in Ethiopia. Cogent Food Agric. 2021, 7, 1882135. [Google Scholar] [CrossRef]
- Olumeh, D.E.; Otieno, D.J.; Oluoch-Kosura, W. Effects of gender and institutional support services on commercialisation of maize in Western Kenya. Dev. Pract. 2021, 31, 977–987. [Google Scholar] [CrossRef]
- Sharaunga, S.; Mudhara, M. Analysis of Livelihood Strategies for Reducing Poverty Among Rural Women’s Households: A Case Study of KwaZulu-Natal, South Africa. J. Int. Dev. 2021, 33, 127–150. [Google Scholar] [CrossRef]
- Chang, T.; Takahashi, D. Willingness to Pay and Willingness to Accept for Farmland Leasing and Custom Farming in Taiwan. Int. Assoc. Agric. Econ. 2018, 28, 277–326. [Google Scholar]
- Barbier, E.B.; Hochard, J.P. Poverty and the Spatial Distribution of Rural Population; World Bank Policy Research Working Paper; World Bank Group: Singapore, 2014. [Google Scholar]
- Kassem, H.S.; Alotaibi, B.A.; Muddassir, M.; Herab, A. Factors influencing farmers’ satisfaction with the quality of agricultural extension services. Eval. Program Plan. 2021, 85, 101912. [Google Scholar] [CrossRef]
- Etuk, E.; Udoe, P.; Okon, I. Determinants of livelihood diversification among farm households in Akamkpa Local Government Area, Cross River state, Nigeria. Agrosearch 2018, 18, 101–112. [Google Scholar] [CrossRef]
- Felkner, J.S.; Lee, H.; Shaikh, S.; Kolata, A.; Binford, M. The interrelated impacts of credit access, market access and forest proximity on livelihood strategies in Cambodia. World Dev. 2022, 155, 105795. [Google Scholar] [CrossRef]
- Scoones, I.; Mavedzenge, B.; Murimbarimba, F.; Sukume, C. Labour after land reform: The precarious livelihoods of former farmworkers in Zimbabwe. Dev. Chang. 2019, 50, 805–835. [Google Scholar] [CrossRef]
- Manase, K.C.; Takunda, C. The complexity of farmworkers’ livelihoods in Zimbabwe after the Fast Track Land Reform: Experiences from a farm in Chinhoyi, Zimbabwe. Rev. Afr. Political Econ. 2019, 46, 55–70. [Google Scholar]
- Louw, D.; Flandorp, C. Horticultural Development Plan for the Thulamela Local Municipality: Agricultural Overview; OABS Development (Pty) Ltd.: Paarl, South Africa, 2017. [Google Scholar]
- Cochran, W.G. Sampling Techniques, 3rd ed.; Wiley: New York, NY, USA, 1977. [Google Scholar]
- Moore, C. An introduction to logistic and probit regression models. Lect. Notes Univ. Tex. Austin 2013. [Google Scholar]
- Ahmed, M.T.; Bhandari, H.; Gordoncillo, P.U.; Quicoy, C.B.; Carnaje, G.P. Diversification of rural livelihoods in Bangladesh. J. Agric. Econ. Rural Dev. 2015, 2, 32–38. [Google Scholar]
- Tizazu, M.A.; Ayele, G.M.; Ogato, G.S. Determinants of rural households livelihood diversification strategies in kuarit district, West Gojjam zone of, Amhara region, Ethiopia. Int. J. Econ. Behav. Organ 2018, 6, 61. [Google Scholar]
- Lutomia, C.K.; Obare, G.A.; Kariuki, I.M.; Muricho, G.S. Determinants of gender differences in household food security perceptions in the Western and Eastern regions of Kenya. Cogent Food Agric. 2019, 5, 1694755. [Google Scholar] [CrossRef]
- Goba, Z.Z. Review on Determinants of Rural Livelihood Diversification Strategies in Ethiopia. Int. J. Sci. Technol. Soc. 2021, 9, 98. [Google Scholar] [CrossRef]
- Loison, S.A. Household livelihood diversification and gender: Panel evidence from rural Kenya. J. Rural Stud. 2019, 69, 156–172. [Google Scholar] [CrossRef]
- Prowse, M. The determinants of non-farm income diversification in rural Ethiopia. J. Poverty Alleviation Int. Dev. 2015, 6, 109–130. [Google Scholar]
- Emmanuel, E.A. Rural livelihood diversification and agricultural household welfare in Ghana. J. Dev. Agric. Econ. 2011, 3, 325–334. [Google Scholar]
- Gebreyesus, B. Determinants of livelihood diversification: The case of Kembata Tambaro Zone, Southern Ethiopia. J. Poverty Investig. Dev. 2016, 23, 1–10. [Google Scholar]


Publisher’s Note: MDPI stays neutral with regard to jurisdictional claims in published maps and institutional affiliations. |
© 2022 by the authors. Licensee MDPI, Basel, Switzerland. This article is an open access article distributed under the terms and conditions of the Creative Commons Attribution (CC BY) license (https://creativecommons.org/licenses/by/4.0/).