Article

Enhancing Biogas Production of Corn Stover by Biogas Slurry Reflux Based on Microfiltration Membrane Filtration and Biochar Adsorption

1
Renewable Energy Research Center, Heilongjiang Institute of Energy and Environment, Haerbin 150000, China
2
College of Engineering, Northeast Agricultural University, Haerbin 150030, China
3
Key Laboratory of Development and Application of Rural Renewable Energy, Ministry of Agriculture, Chengdu 610041, China
*
Authors to whom correspondence should be addressed.
Agriculture 2022, 12(12), 2040; https://doi.org/10.3390/agriculture12122040
Submission received: 31 October 2022 / Revised: 26 November 2022 / Accepted: 26 November 2022 / Published: 29 November 2022

Abstract

:
Reflux of biogas slurry is an effective way to reduce the discharge of wastewater. In order to improve the utilization efficiency of reflux fluid and reduce ammonia inhibition in an anaerobic digestion (AD) system, biogas slurry was pretreated by microfiltration membrane and biochar adsorption. In this study, the suspension solid (SS), biochemical oxygen demand (COD) and ammonia nitrogen (NH4+-N) were investigated, as well as the gas production effect of the reflux of biogas slurry in AD, so as to evaluate the filtration effect of the microfiltration membrane with different pore sizes and the adsorption effect of biochar with different dosages. The results showed that 0.65 μm microfiltration had the best interaction effect and 7 g/L biochar had the best adsorption effect. The results of anaerobic co-digestion of the biogas slurry and corn stover showed the peak gas production of the pretreated reflux fluid was advanced by 1 day, and the maximum daily methane production and maximum cumulative methane production reached 39.20 mL·g−1 VS and 137.14 mL·g−1 VS, respectively. These results indicated that the combined treatment of biogas slurry by microfiltration membrane and biochar could have potential applications for the treatment and recycling of biogas slurry.

1. Introduction

With the development of large-scale biogas projects, a large amount of biogas slurry has been produced, and biogas slurry has gradually become an important part of the sewage sources in China [1]. Since biogas slurry contains a high concentration of organic matter and nutrients, it will cause serious pollution to the surrounding environment [2] if directly discharged without meeting the sewage discharge standard. However, it is also an agricultural resource. Biogas slurry is rich in nitrogen, phosphorus [3], potassium, and various trace and medium elements necessary for crop growth. Furthermore, biogas slurry contains some auxins, such as humic acid and indole acetic acid [4], which contribute to pest and disease plant resistance characteristics, soil improvement, and other functions.
Biogas slurry can be directly applied to soil through spray and drip irrigation technologies, which can improve soil quality and nutrient content and increase crop yield [5,6]. However, excessive use of biogas slurry will not only damage plants but also cause environmental pollution when its excess material seeps into the ground. In addition, because the biogas slurry is continuously produced and the crops do require continuous fertilization, the biogas slurry is directly returned to the field, which is limited relatively by the crop growth stage.
Biogas slurry reflux refers to the process of relocating the biogas slurry produced by AD into the fermentation system [7]. Alkaline substances in biogas slurry enhance the buffering ability and the stability of the system [3]. In addition, some organic matter that was not completely degraded in the first round of AD can be degraded again with the biogas slurry reflux. At the same time, the microorganisms in the system are increased, which can accelerate the reaction process of AD and increase gas production [8]. Different reflux conditions of pig manure AD have been studied [9], and the results showed it can increase the pH value and acetic acid content of the acid-producing phase in the two-phase AD. When the reflux ratio is 100%, the biogas production rate and methane production rate reach 259.49 mL/g and 167.44 mL/g, respectively. In summary, biogas slurry reflux is a more economical and effective way to realize biogas slurry reduction and reuse [10].
However, because biogas slurry contains a lot of water, its nutrient content is relatively dispersed, so the ability to improve the gas production characteristics of the AD system is limited. The membrane with characteristics of separation, removal, or enrichment of substances is used to treat the biogas slurry so that the organic or inorganic particles, nutrient elements, and macromolecular matter in the biogas slurry can be intercepted and concentrated in the intercepted liquid [11,12], so as to improve the organic matter, microbial, and other components required by the reflux liquid and strengthening the AD gas production performance. However, it is easy to simultaneously cause the problem of inhibiting the accumulation of ammonia nitrogen and COD [13], which affects the gas production of the AD system. Biochar is made from biomass after high temperature carbonization. Because of its strong adsorption capacity and large porosity, it can absorb pollutants. The reflux effect of biogas slurry adsorption by biochar needs to be further explored.
Therefore, in order to reduce the discharge of biogas slurry and improve the utilization efficiency of biogas slurry, the pretreatment of biogas slurry by membrane separation and biochar adsorption technology is a novel and effective method. In this paper, the biogas slurry discharged from the AD system of corn stover was taken as the research object, which was filtered by a microfiltration membrane and adsorbed by biochar and then returned to the AD system. The purpose is to promote the efficiency of biogas slurry reflux and improve the performance of biogas production through the pretreatment of biogas slurry. It can not only improve the efficiency of AD after the reuse of biogas slurry but also provide a theoretical reference for the high-value utilization of biogas slurry.

2. Materials and Methods

2.1. Material

The biogas slurry used in this study was obtained from the by-products of AD in the laboratory after separation of solids and liquids. Corn stover was taken from surrounding fields. After drying in the air, it was crushed to a size of 5–10 mm. Biochar was prepared at 550 °C at a heating rate of 10 °C/min using corn stover as a raw material, and the heating temperature was held for 1 h. The physical and chemical characteristics of raw materials are shown in Table 1.

2.2. Filtration Experiment of Biogas Slurry with a Microfiltration Membrane

The biogas slurry was separated from the AD residue with 60-mesh, 100-mesh, and 120-mesh nylon to avoid the filtering film being blocked by suspended impurities. Polyether sulphone (PES) hydrophilic water solutions with high-current filter films of 0.65 μm (S1), 1.2 μm (S2), 3 μm (S3), and 5 μm (S4) were selected to filter the hydrophilic solution and placed in a sand core filtering device at the operating pressure of 0.2 MPa and 25 °C. The biogas slurry samples were grouped, poured in separately, and filtered through a water circulation vacuum pump connected to the sand core filtering device. The obtained solutions were stored in a centrifuge tube and refrigerated for the measurement of solid solution (SS), ammonia nitrogen (NH4+-N), and chemical oxygen demand (COD).

2.3. Biochar Adsorption Experiment of Biogas Slurry Filtered by a Microfiltration Membrane

Considering economic costs and adsorption effects, the most suitable biochar addition amounts were determined to be 4 g/L (K1), 7 g/L (K2), 10 g/L (K3), and 13 g/L (K4) in this experiment for different trials. The biochar was loaded into a 2 L wide-mouth bottle, and 1.5 L of biogas slurry interception filtrated by 0.65-μm was poured into the system. The biochemical solution obtained by filtering was stirred well, mixed at 165 R/min on a constant-temperature shaking bed, and removed from the wide-mouth bottle at room temperature. The biochar naturally descended to the bottom of the wide-necked bottle, and the upper layer of liquid clearance retained the upper layer of liquid as SS, COD, and ammonia nitrogen emerged before adsorption.

2.4. Anaerobic Digestion Experiment with Biogas Slurry Be Refluxed

The AD experiment was conducted by sequential batching with a digester volume of 1000 mL at 36 ± 1 °C. The AD worked in a liquid state with a TS content of 5%. The content of the inoculum accounted for 30%.
Sequencing batch-type biogas slurry reflux was used to explore the effect of K1, K2, K3, and K4 levels of the treated biogas slurry reflux on the gas production characteristics of the AD system.
A modified Gompertz model was used to analyse and predict the methane capabilities of the AD system. The model equation is shown in (1).
Y ( t ) = Y m exp { exp [ R m e Y m ( λ t ) + 1 ] }
where Ym is the maximum VS production of methane potential (mL/g VS), Rm is the maximum methane rate (mL/g VS−1 d), e is the Euler constant (2.718282), γ is the delinquency, and t is the fermentation time (d).

2.5. Analytical Methods

The TS and VS contents were analyzed according to standard procedures [14]. The TC of corn stover was measured by a TOC analyzer (Teledyne Tekmar, Mason, OH, USA), and the total nitrogen (TN) was determined with an automatic Kjeldahl nitrogen determination analyzer (FOSS, Hilleroed, Denmark). The volatile fatty acid contents were measured with a DB–Heavywax chromatography column and an Agellen 6890N gas phase chromatography with an Agellen detector. The methane output was collected in aluminium foil bags, and a drainage method was used to measure the biogas volume. A chromatographic column with the TDX-01 and a thermal conductivity detector (TCD) from SHIMADZU 2010PLUS (SHIMADZU, Kyoto, Japan) gas phase chromatography was used for biogas composition analysis. COD was determined by seal catalytic and elimination methods, and NH4+-N was determined by a SKALAR SAN continuous flow analyzer. The automatic specific surface area and pore analyzer (WJGS-029, micromeritics, Norcross, GA, USA) was used to determine the specific surface area and pore structure parameters of biochars.

3. Results

3.1. Effects of the Microfilter Membrane System on SS, COD, and Ammonia Nitrogen Conditions in Biogas Slurry

3.1.1. Impact of the Microfilter Membrane System on the SS Characteristics in Biogas Slurry

Microfil membranes mainly include two types of bending holes and cylindrical filter membranes, according to their membrane surface hole characteristics. Among these components, the surface of the bending hole filter membrane is rough and composed of twists formed by interlaced connections. Membrane materials include polyvinyl chloride (PVC), polyvinylidene fluoride (PVDF), polytetrafluoroethylene (PTFE), cellulose acetate (CA), polyethersulfone (PES), and polypropylene (PP) [15]. These gaps are unevenly distributed and penetrate the membrane wall [16]. The pore rates of bending pores range from 35–90%, which is much higher than the approximately 10% pore rate of other pores [17,18]. This experiment involves a polyethersulfone (PES) membrane, which has the characteristics of a high pore rate, a uniform gap, a fast filtration speed, good hydrophilicity, etc. [15,19]. Additionally, they have been widely applied in water treatment due to their high chemical stability and good mechanical properties [20].
Figure 1 shows the content of the liquid SS, the removal rate of the liquid SS, and the removal rate after filtering through four filter membranes with different pore diameters. The figure shows that the SS content sizes of all the biogas liquid through the processing group are in the order of 5 μm > 3 μm > 1.2 μm > 0.65 μm; the SS contents of the samples are 291.88 mg/L, 256.29 mg/L, 177.98 mg/L, 177.98 mg/L, 177.98 mg/L, and 67.63 mg/L, respectively. The SS content of biogas filtered through the liquid decreases by 59.01–81.23% relative to the SS content of the original biogas without pretreatment. Among the tested samples, the SS content removal rate of the membrane filter with 0.65-μm pores has the highest removal rate, reaching 81.23%, and the SS content of the interception liquid is 873 mg/L. The SS removal rate of the membrane with a small aperture is higher than with a large aperture, which may be because the increase in membrane flux with a large aperture also leads to an increase in membrane fouling, which will reduce the decontamination effect of the membrane to a certain extent [21,22].

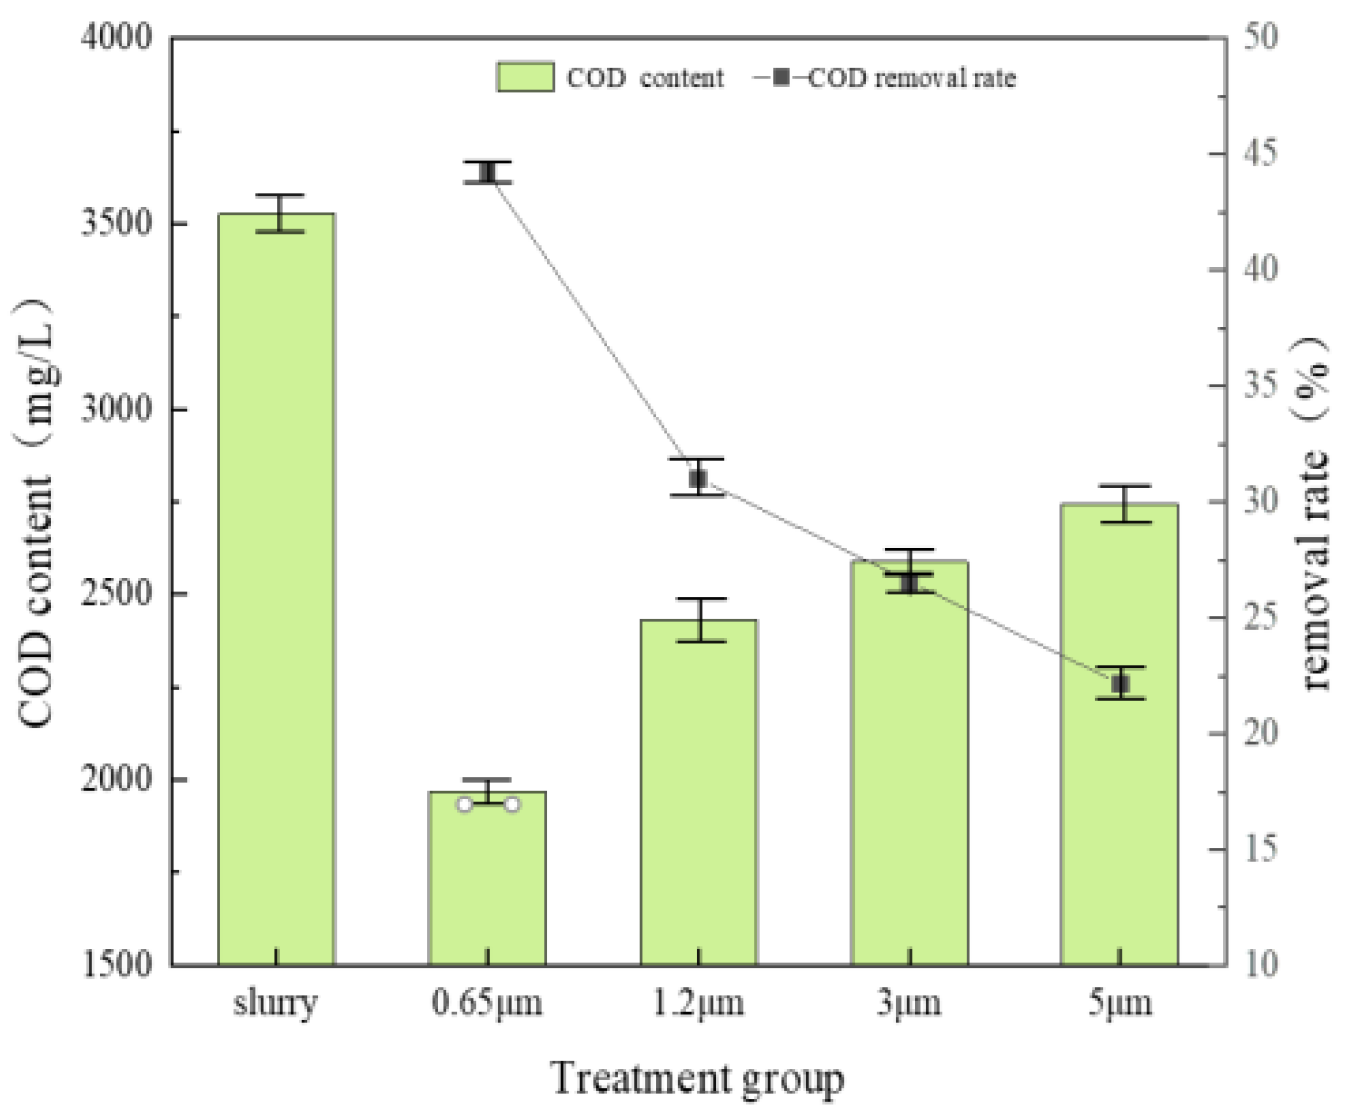
3.1.2. Impact of the Microfilter Membrane System on COD Characteristics in Biogas Slurry

The biogas slurry was filtered through four filter membranes with different pore diameters to determine the COD contents and removal rates of the biogas liquid. Figure 2 shows that the COD contents after filtering with PES microfillets are 1968.23 mg/L, 2432.85 mg/L, 2589.35 mg/L, and 2745 mg/L, and these values are smaller than those of the original biogas (3526.71 mg/L). The final COD content removal rate range was 22.16–44.19%, which shows the COD removal rate increased with decreasing membrane diameter.

3.1.3. Effect of the Microfilter Membrane Filter on NH4+-N Contents in Biogas Slurry

Figure 3 shows that the NH4+-N content of biogas slurry increases with increasing filter membrane pore diameter, and the contents of the four filter membranes with different pore diameters are 408.3 mg/L, 424.8 mg/L, 435.8 mg/L, and 457.3 mg/L, respectively. The NH4+-N content of biogas slurry decreases by 22.45–13.15% compared with the primitive biogas slurry (526.7 mg/L). The removal rate of the membrane filter with the 0.65-μm pores is the highest, reaching 22.46%. The result shows that the PES microporous membrane filters with different pore diameters have certain intercepting effects on the NH4+-N content of biogas slurry, and as the pore diameter decreases, the removal rate of NH4+-N increases. This is probably because the smaller the pore size of the membrane, the more dirt can be trapped. The soluble nitrogen with the suspended particles acting as the carrier is removed, and the ammonia nitrogen content decreases.
It can be concluded from the above results that the membrane with relatively small pores has a better removal effect on pollutants such as SS, COD, and NH4+-N. In addition, PES membrane is stable in water. Being an inert membrane, PES membrane acts only as a barrier in the separation process. As a result, the performances of PES membranes is weakened by unavoidable membrane fouling, and they cannot be used in situations requiring self-regulated permeability and selectivity. As a result, smart PES membranes that can self-regulate their permeability and selectivity via the flexible adjustment of pore sizes and surface properties also need to be developed [23]. Therefore, it is necessary to study the influence of filtration membranes with different pore sizes on the removal effect of pollutants, which can provide a theoretical reference for future research on smart membranes.

3.2. Effects of Biochar Absorption on SS, COD, and NH4+-N of Biogas Slurry Retentate

3.2.1. Effects of Biochar Addition on SS of Biogas Slurry Retentate

The specific surface area, average aperture, and total pore volume of biochar used in this paper are 9.697/m2·g−1, 6.443 nm and 0.0142 cm3·g−1, respectively. The SS content and removal rate of biogas slurry after adsorption with different biochar additions were studied, and the results are shown in Figure 4. The SS content of biogas slurry interception is 872 mg/L. With the increase in biochar addition, the SS content of the supernatant of biogas slurry interception in each treatment group gradually decreases. The SS removal rate indicates that the treatment group with the addition of 13 g/L has the best treatment effect, and the removal rate is 11.93%. The other three treatment groups have certain effects on SS adsorption, but they are not ideal. The content of SS in the biogas slurry decreases by 5.62–11.93%.

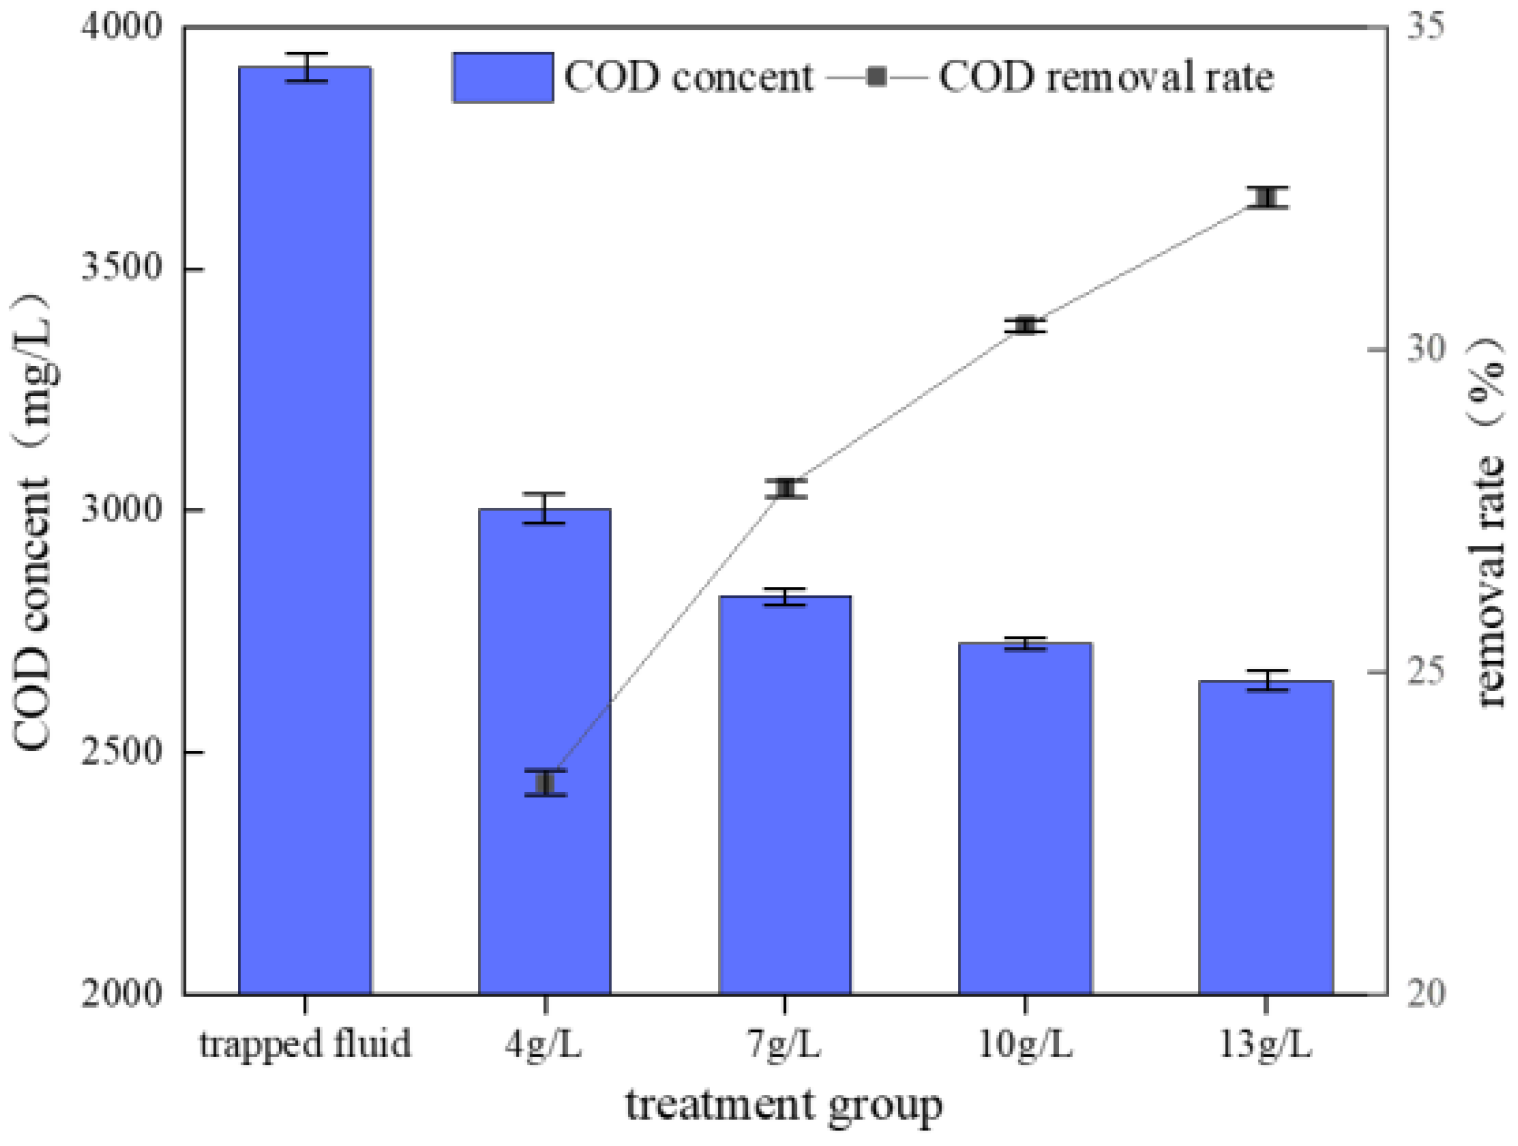
3.2.2. Effects of Biochar Addition on COD of Biogas Slurry Retentate

Figure 5 shows the COD content and removal rate after the adsorption of biogas slurry with different biochar additions. With the increase in the dosage, the COD content of the biogas slurry retention liquid shows a downward trend. The COD content of the biogas slurry interception liquid is 3916 mg/L, and the COD contents of the treatment groups are 23.2–32.3%, which are lower than those of the biogas slurry interception liquid. Among the specimens, when the biochar addition is 13 g/L the treatment effect is the best, and the COD content is 2649.17 mg/L.

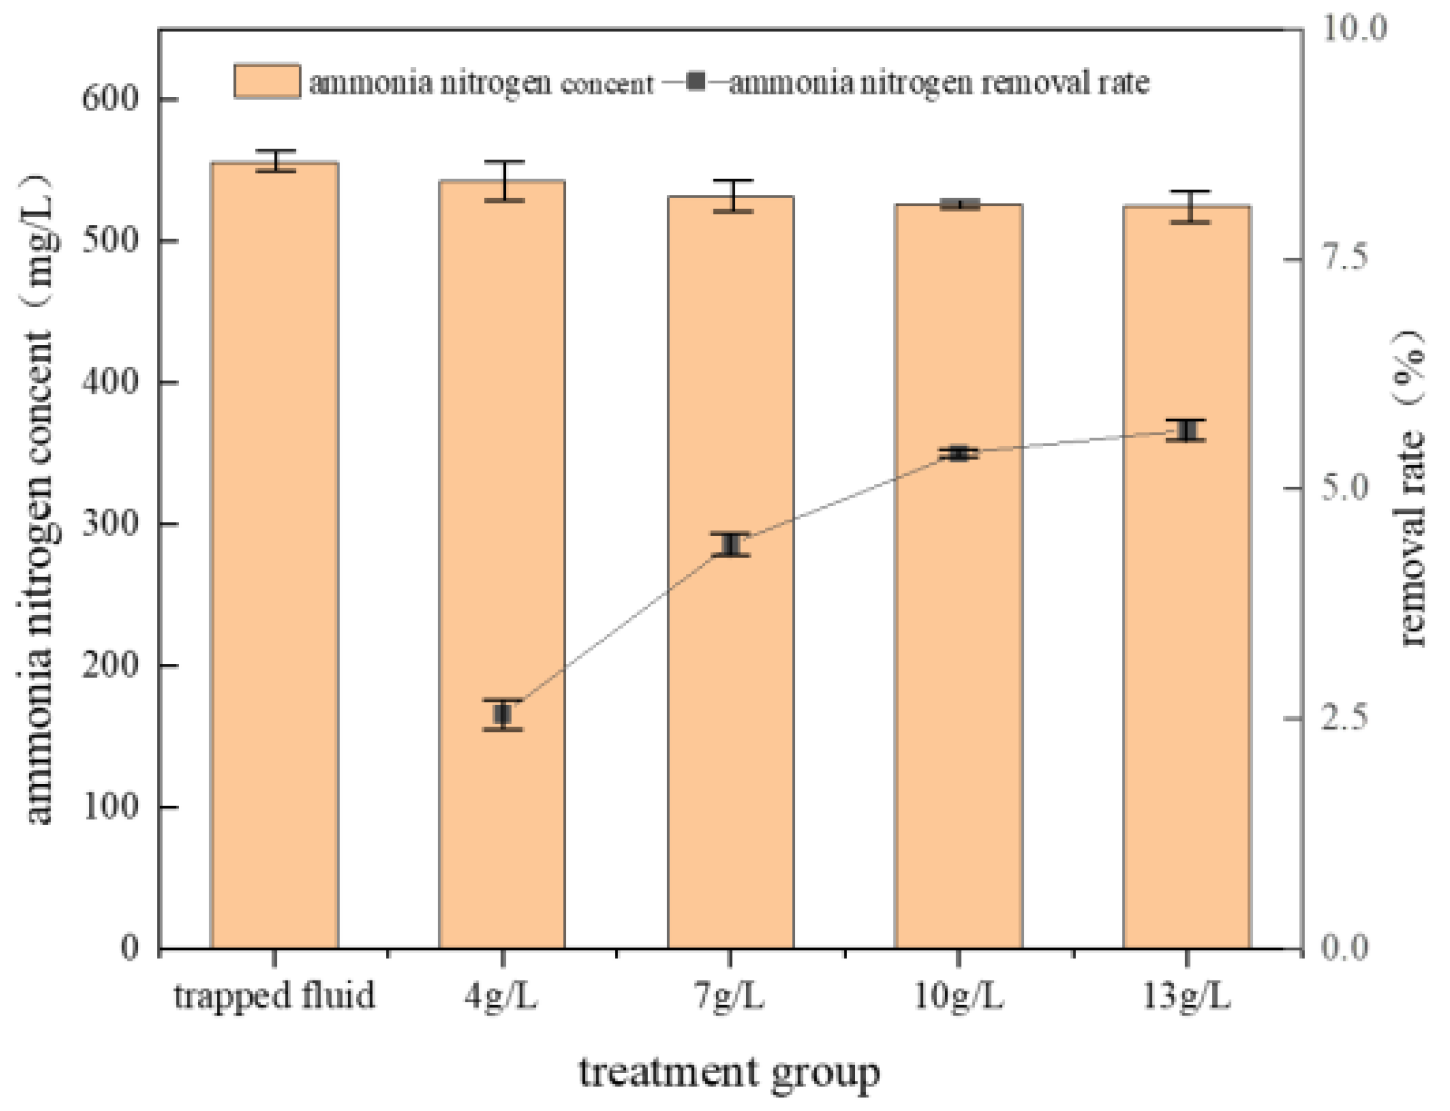
3.2.3. Effects of Biochar Addition on NH4+-N of Biogas Slurry Retentate

Figure 6 shows the adsorption of NH4+-N in biogas slurry with different biochar additions. It shows that the addition of biochar has a certain adsorption effect on the NH4+-N contents of the biogas slurry retention liquid. The NH4+-N content of the retention liquid in each group decreases by 2.55–5.64%. These effects are not obvious relative to the adsorption effects of the SS and COD indicators. This is similar to the result found by some scholars [24,25]. Among the specimens, the removal rate of NH4+-N in the treatment group with a 13 g/L addition is the highest; the NH4+-N content after adsorption is 524.9 mg/L, which is 5.64% lower than that of the retention liquid (the NH4+-N content is 556.3 mg/L).

3.3. Effect of Biogas Slurry Reflux on the AD Process

3.3.1. Effect of Reflux on Ammonia Nitrogen during the AD Process

NH4+-N content is an important index for AD. NH4+-N is used as a nitrogen source for microbial growth and metabolism, and it adjusts the pH value of the AD system, which can improve the stability of the system and promote microbial growth. However, when the NH4+-N content is overly high, it will inhibit the metabolism of methanogens and even poison them, reducing their activity [26]. This phenomenon occurs because the hydrophobic-free ammonia in the total NH4+-N easily diffuses into the cell and produces amino salts. With the continuous accumulation of amino salts, the homeostasis of cellular metabolism is disrupted, and the normal progress of AD is inhibited. Therefore, it is very important to regulate the concentration of NH4+-N during AD.
The change in NH4+-N in the fermentation liquid during biogas slurry interception by biochar when biogas slurry is returned to the AD system, as shown in Figure 7. In the early stages of AD, the initial NH4+-N concentrations of all treatment groups were higher than those of the control group CK (NH4+-N concentration: 560.2 mg/L), and the NH4+-N content of group T3 was the highest, reaching 705.6 mg/L. This phenomenon occurs because the NH4+-N contained in the supernatant of biogas slurry permeates, and the biogas slurry intercept enters the AD system with reflux [25], resulting in the initial ammonia nitrogen content increasing. The figure shows that the changing trends of the NH4+-N concentrations in the treatment groups are similar. All groups show a slight decline after the beginning of AD. They fall slightly between the 13th–17th day, after the 17th day, the concentrations begin to increase until the end of fermentation; at the end of AD, the NH4+-N concentration is slightly higher than at the beginning, but the overall change is small. The same trend in each treatment group indicates that the reflux of biogas slurry supernatant only changes the NH4+-N content in the AD system [26], and there are no significant changes in the NH4+-N utilization rates of microorganisms. At the end of AD, the concentrations of NH4+-N from high to low rank as T3, T2, T4, T2, and CK, and the contents are 736.4 mg/L, 720.1 mg/L, 685.7 mg/L, 635.1 mg/L, and 580.4 mg/L, respectively.

3.3.2. Effect of Reflux on the Volatile Fatty Acid Content during AD

Volatile fatty acids are the products of hydrolysis and acidification of organic matter during AD. They are converted into a substrate available for methanogens (formic acid, acetic acid, propionic acid, etc.). Corn stover are hydrolysed by microbial extracellular enzymes [27] and further decomposed into small molecule compounds under acid-producing bacteria conditions in the AD system. Methane is mostly formed by acetic acid during fermentation, and short-chain fatty acids, such as propionic acid and butyric acid, which are converted into acetic acid by hydrogen-producing acetogenins and then used by methanogens to produce methane.
Figure 8 shows the changes in the volatile fatty acid contents in the AD systems with different reflux ratios. According to the diagram, the contents of volatile fatty acids in the AD processes of all biogas slurry reflux treatment groups are higher than those of the CK group, especially the acetic and propionic acids. This phenomenon may occur because the reflux biogas slurry in the previous AD system is not completely converted into methane by the metabolic consumption of methanogens [28]. Small amounts of residual acetic acid and propionic acid are brought into the new AD system through reflux, resulting in increases in the contents of volatile fatty acids in the systems. Each treatment increases the contents by 27.94–37.66% compared with the CK group. The maximum is 3.18 mg/L for T3, and the minimum is 2.84 mg/L for T1. The initial volatile fatty acid content of the treatment group increases compared with the acetic acid content of the CK group due to the reflux of the biogas slurry; then, the volatile acid content gradually decreases under the synergistic effects of acid-producing bacteria and methanogens [29]. The overall change trend of volatile acid content during AD is similar to that of the CK group. Although small amounts of volatile fatty acids are introduced due to biogas slurry reflux, only the peak values change, and the overall trend does not change. In the late stages of fermentation, the remaining amounts of acetic acid in the treatment groups are in the order of T4, T3, T2, and T1 from high to low. This phenomenon may be caused by different biochar addition treatments. Adequate biochar addition enriches more methanogens in biogas slurry, and then the methanogen contents in the AD system are less than those of other treatment groups [30], which makes the AD system less capable of converting acetic acid.

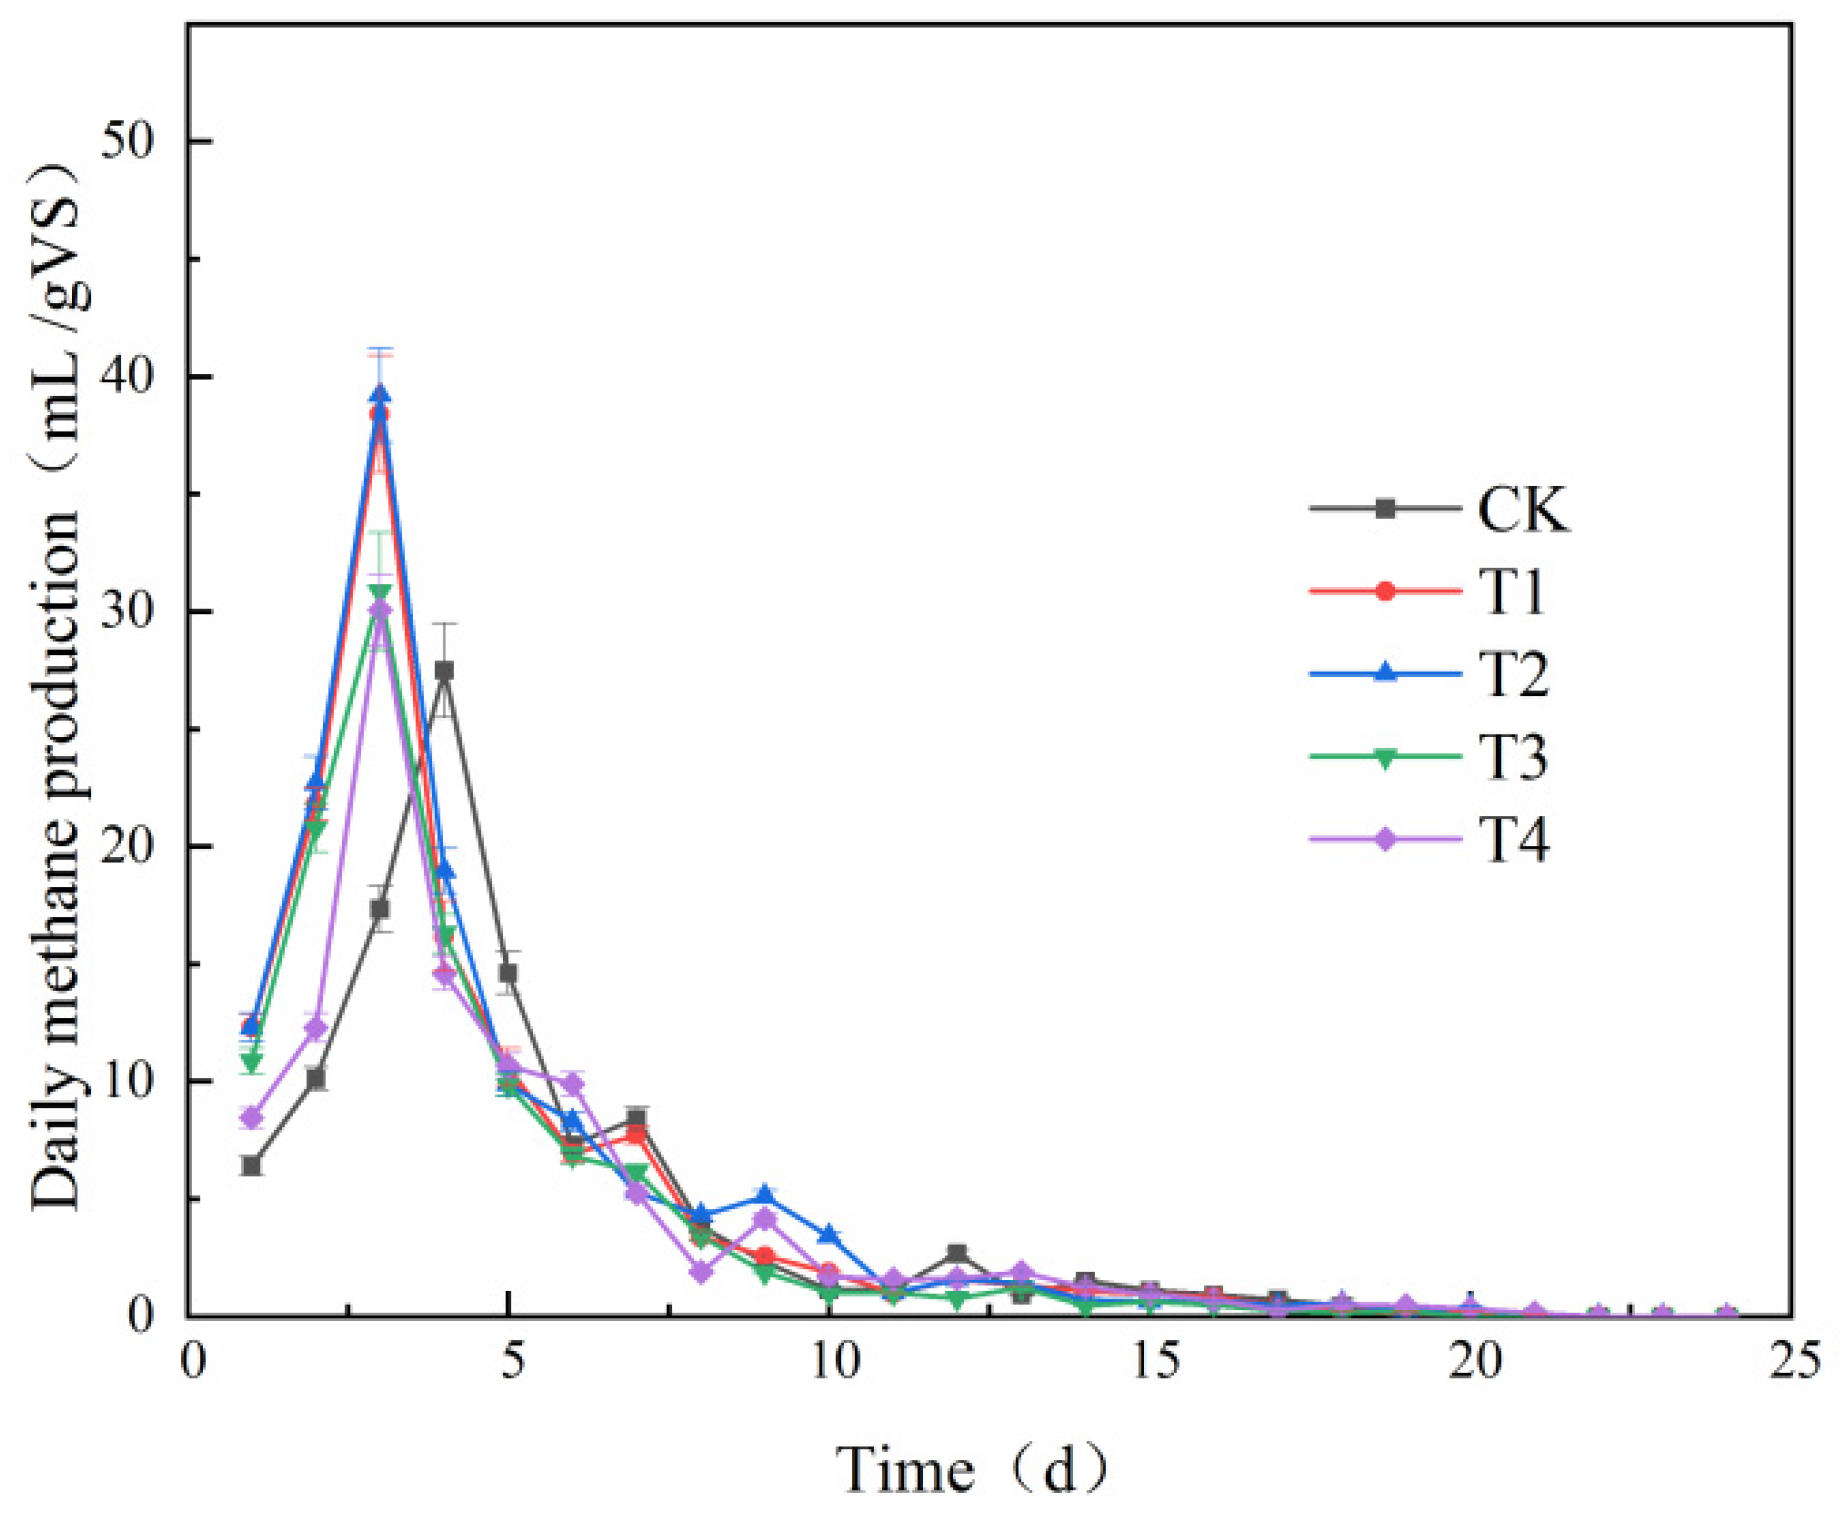
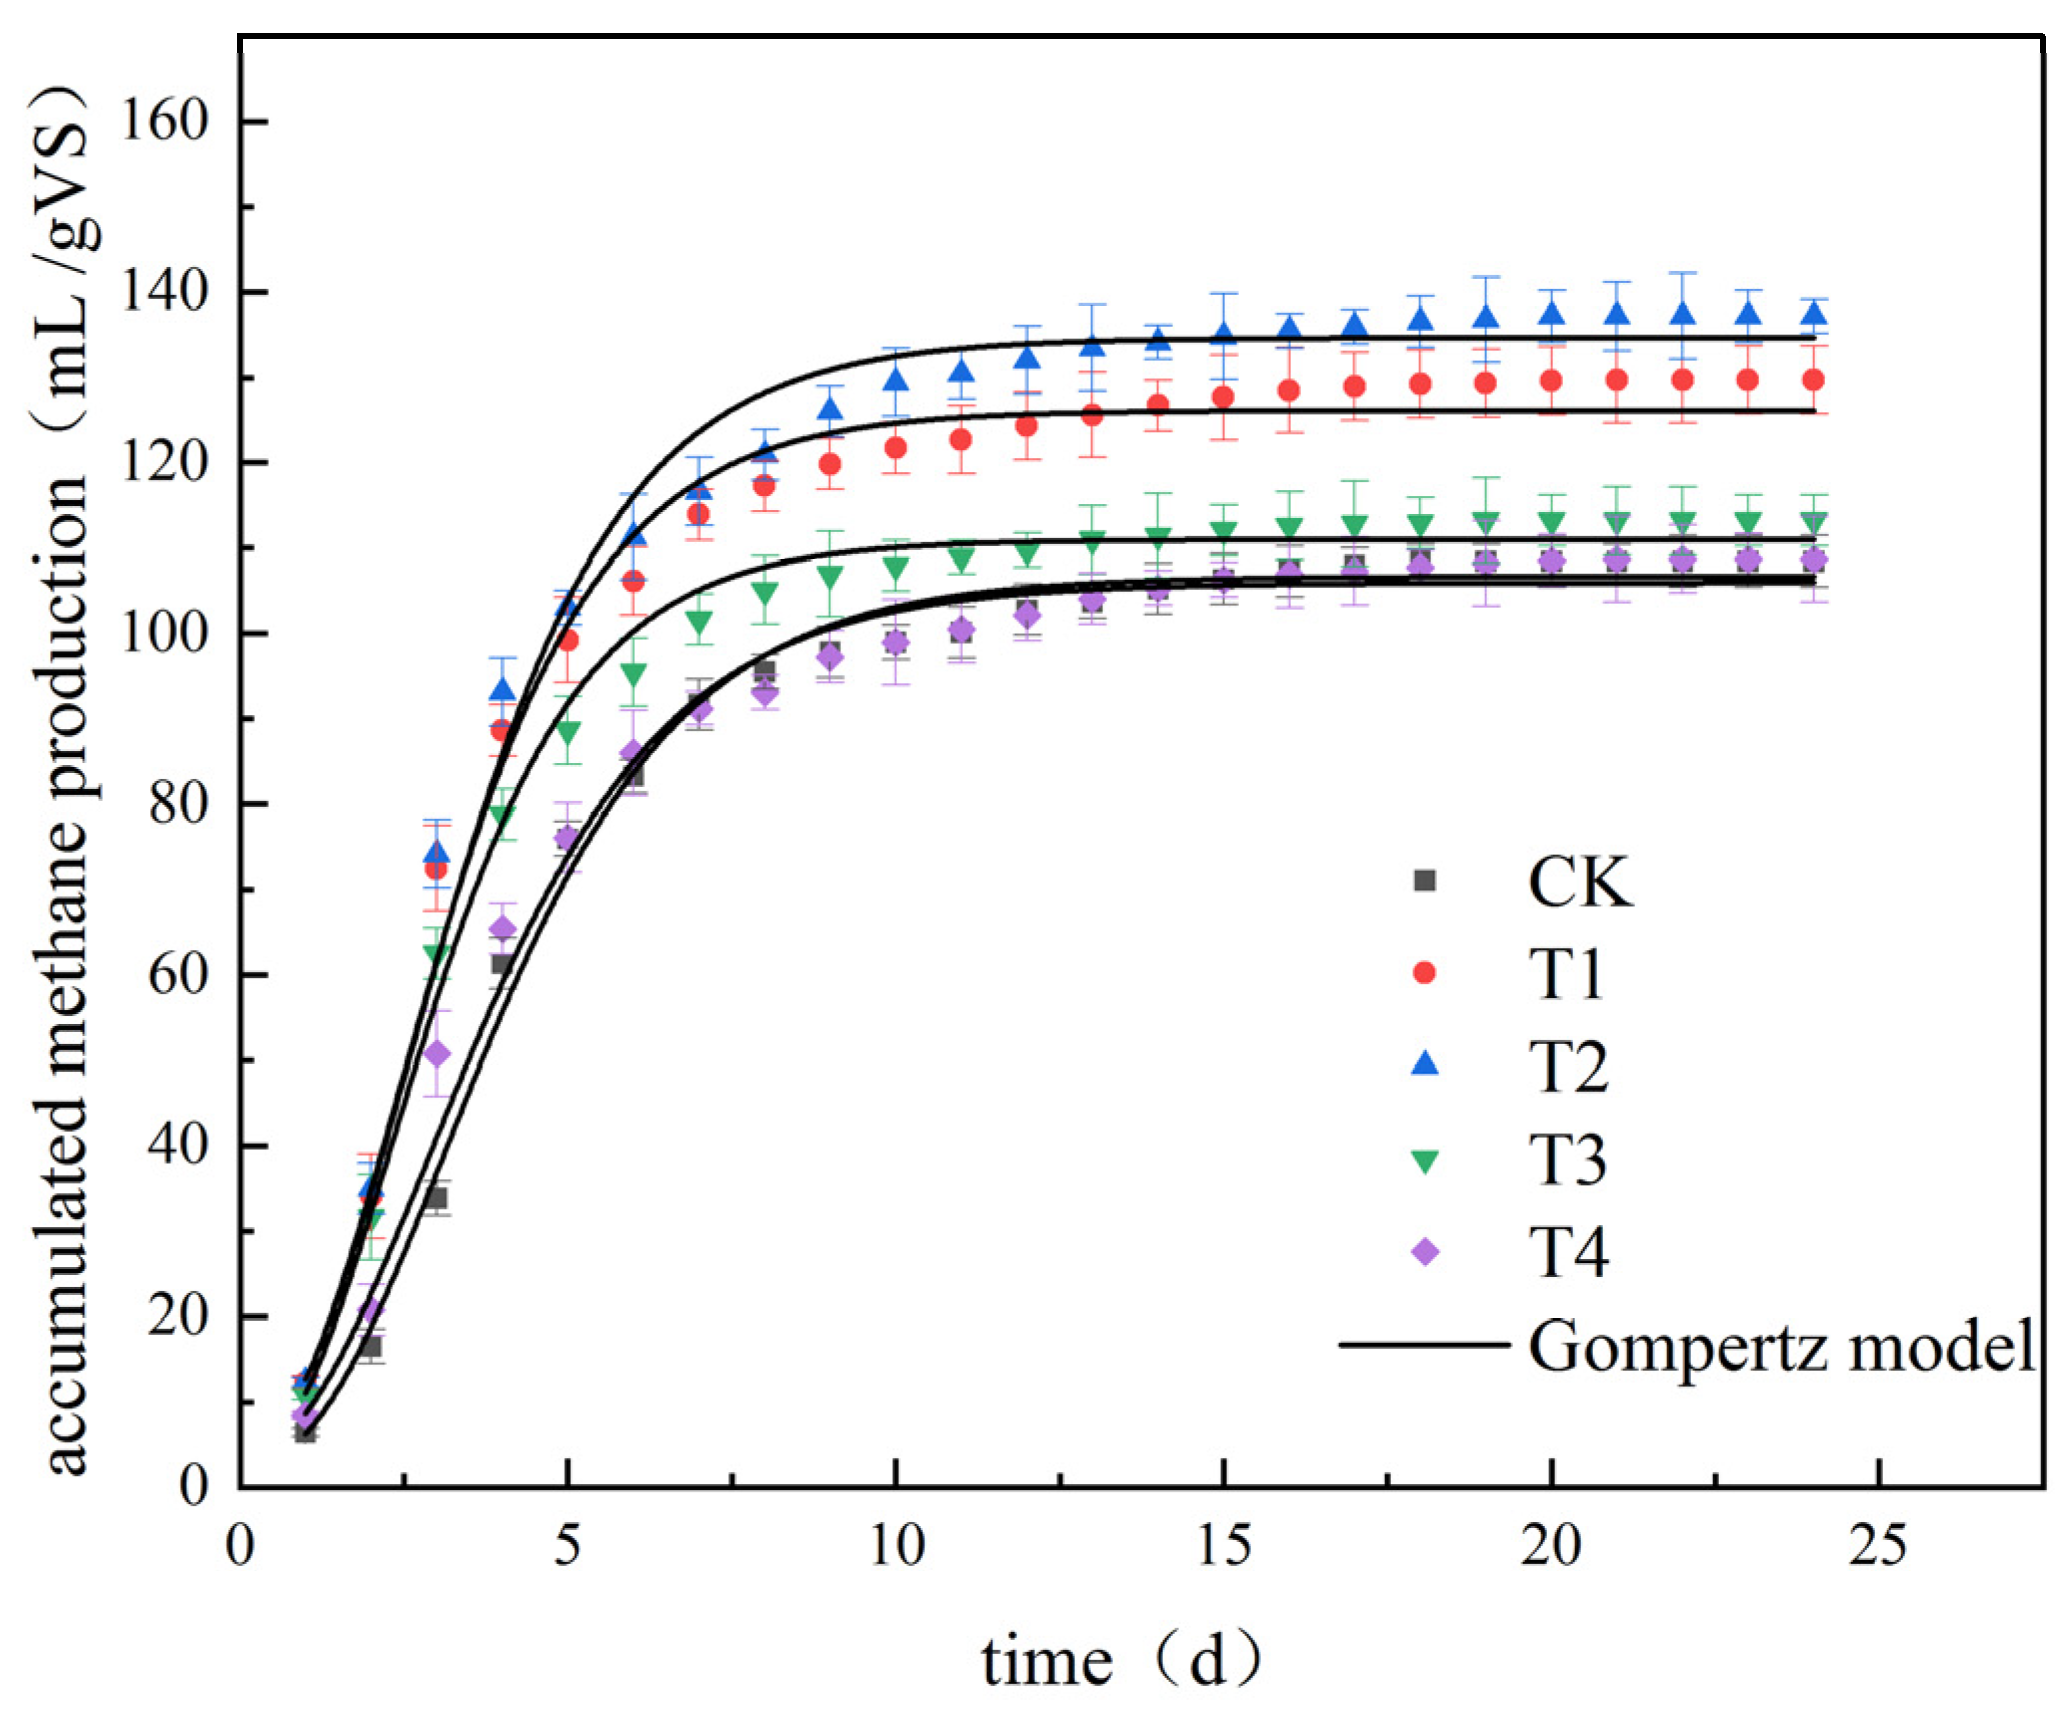
3.3.3. Effect of Reflux on Methanogenic Performance during AD

Kinetic analysis can be used to more fully understand the process of AD in the early stages of the inoculum when in contact with the reactants. This method works due to changes in the microbial growth environment and metabolism characteristics required for a lack of enzymes or some intermediate products, resulting in a microbial need for resynthesis. The time required for the new environment is called the lag phase (λ). Understanding the lag phases under different conditions is of great significance for understanding the AD process.
Table 2 shows the kinetic parameters of AD after biogas slurry retentate reflux. The fitting results show that the fitting coefficient of each treatment group is R2 ≥ 0.98, indicating that the cumulative methane production of each group is well fitted with the modified Gompertz model. The table shows that the lag period of CK in the blank control group is 1.16 d, while the lag periods of the T1, T2, T3, and T4 groups are 0.4 d, 0.37 d, 0.45 d, and 0.66 d, respectively. The lag period of the treatment group, in which the supernatant of all biogas slurry-intercepted liquid returns to the AD system, is smaller than that of the CK group, indicating that the reflux of biogas slurry supernatant shortens the lag period of AD. This phenomenon occurs because the reflux of biogas slurry supernatant is the result of the introduction of extracellular enzymes required for partial AD in the system [31]. It accelerates the start-up time of AD while shortening the lag period of AD.
Figure 9 shows the daily methane production changes in each treatment group. The overall trend of biogas slurry supernatant reflux on AD’s daily methane production does not change; all show a trend of first increasing and then decreasing. All treatment groups are concentrated in the first 6 d of AD to produce methane, and then the methane production gradually decreases until the end of the AD reaction. The daily methane production rate of the CK group is the highest on the 4th day at 27.5 mL/g VS. The daily methane production of the T1–T4 groups peaks on the 3rd day of AD. The peaks of the daily methane production levels for the treatment groups are higher than those for CK, indicating that the reflux of supernatant advances the arrival of the peak of daily methane production and accelerates AD. Due to the sufficient volatile acid content in the reactor during the initial stages of AD, the methanogenic bacteria that re-enter the fermentation system through reflux quickly use the volatile acid accumulated in the fermentation tank to produce methane after adapting to the new environment [32]. Additionally, the undegradable organic matter in the biogas slurry supernatant that returns to the AD system degrades again, resulting in an increase in gas production. Among the specimens, the daily methane production peak of T4 is the lowest at 30.07 mL/g VS, which is 9.34% higher than that of the CK group; the daily methane production peak of T2 reaches 39.20 mL/g VS. The daily methane production values of all treatment groups, ranging from high to low, are listed in the order of T2, T1, T3, and T4.
Figure 10 shows the cumulative methane production levels of each treatment group and the fitting results of the modified Gompertz model. It shows that the treatment group with the supernatant of biogas slurry added for refluxing has a higher cumulative methane production than the CK group. The cumulative methane production of the CK group is 108.44 mL/g VS, and that of the T2 treatment group is 137.164 mL/g VS, which is 26.48% higher than that of CK. The cumulative methane production of each treatment group from high to low is in the order of T2, T1, T3, and T4, and the values are 137.14 mL/g VS, 129.68 mL/g VS, 113.19 mL/g VS, and 108.70 mL/g VS, respectively. Among these specimens, the cumulative methane production levels of T3 and T4 are lower than that of T1 and T2, which may be due to the addition of biochar; more AD microorganisms in biogas slurry retention liquid are adsorbed and enriched by biochar. Since the biochar precipitation does not exist in the supernatant of the retention liquid, it is returned to the AD reactor; this phenomenon results in fewer methanogens in the T3 and T4 groups entering the AD system than in T1 and T2, which in turn affects the methane production efficiency.

4. Discussion

In order to solve the problem of pollution-free treatment and high-value utilization of biogas slurry, this study developed a quality improvement and efficiency utilization model for biogas slurry, which was recycled into an AD system through microfiltration membrane and biochar adsorption. The results showed that the retention effect of the microfiltration membranes with a pore size of 0.65 μm was the best, and the content of SS, COD, and ammonia nitrogen in the permeate obtained by S1 filtration was the lowest, at 81.23%, 44.19%, and 22.46% lower than that of CK, respectively. The contents of SS, COD, and ammonia nitrogen were reduced by adding biochar to the biogas retentate. The removal efficiency of COD was the most obvious and was 32.35% after adding 13 g/L biochar. Compared with CK (without biogas slurry return), the gas production peak of the treatment groups with biogas slurry return was 1 day earlier, and the cumulative methane production and the maximum daily methane production were both increased. The modified Gompertz model was used to fit the data (R2 > 0.98), indicating that the supernatant reflux of biogas slurry retentate can shorten the lag period of AD by 0.5–0.79 d. Comprehensive analysis shows that the supernatant reflux treatment group, after adsorbing the retentate at the addition level of 7 g/L biochar, can achieve the maximum daily methane production (39.20 mL·g−1 VS) and cumulative methane production (137.14 mL·g−1 VS). Therefore, the performance of AD was improved by the reflux of biogas slurry treated by microfiltration membranes and biochemical carbon.
Through this study, we found that the co-treatment of biogas slurry with microfiltration membrane and biochar can promote the production of gas in the reflux fermentation system. However, it is unavoidable to be fouling the membrane. In this case, the PES membrane’s performance would be compromised, and it could not be used in situations requiring self-regulated permeability and selectivity. Therefore, it is necessary to improve the membrane through some advanced technology in order to obtain greater decontamination ability.
Following research should concentrate on the impact of biogas slurry reflux on the microbial flora and relative abundance of the AD system, as well as a comprehensive evaluation of biogas slurry reflux in terms of economic cost and application. Thus, the present study provides a suitable direction for the safe disposal of biogas slurry residues.

Author Contributions

Conceptualization, W.L. and Y.S.; methodology, X.S.; software, J.Q.; validation, X.S. and W.L.; formal analysis, X.S.; investigation, W.L.; resources, W.L. and Y.S.; data curation, J.Q.; writing—original draft preparation, X.S.; writing—review and editing, X.S.; visualization, X.S.; supervision, W.L.; project administration, W.L.; funding acquisition, W.L. and Y.H. All authors have read and agreed to the published version of the manuscript.

Funding

This research was supported by the Joint guidance project of Heilongjiang Provincial Natural Science Foundation OF FUNDER, grant number “LH2019B031” and by an Open Research Project Fund from Key Laboratory of Development and Application of Rural Renewable Energy, Ministry of Agriculture OF FUNDER, grant number “2018–008”.

Institutional Review Board Statement

Not applicable.

Informed Consent Statement

Not applicable.

Data Availability Statement

Not applicable.

Acknowledgments

This research was supported by the Joint guidance project of Heilongjiang Provincial Natural Science Foundation in 2019 OF FUNDER, grant number “LH2019B031” and by an Open Research Project Fund from Key Laboratory of Development and Application of Rural Renewable Energy, Ministry of Agriculture OF FUNDER, grant number “2018-008”.

Conflicts of Interest

The manuscript conforms to MDPI’s policies as described. The authors declare no conflict of interest, issues with authorship, contributorship, disputes, misconduct allegations, data issues, overlap and plagiarism, and peer review integrity.

References

  1. O’kelly, B. Consolidation properties of a dewatered municipal sewage sludge. Can. Geotech. J. 2005, 42, 1350–1358. [Google Scholar] [CrossRef] [Green Version]
  2. Chang, Y.; Zhao, H.; Sun, L.; Cui, J.; Liu, J.; Tang, Q.; Du, F.; Liu, X.; Yao, D. Resource Utilization of Biogas Waste as Fertilizer in China Needs More Inspections Due to the Risk of Heavy Metals. Agriculture 2022, 12, 72. [Google Scholar] [CrossRef]
  3. Song, Y.; Wang, G.; Li, R.; Chen, G. Research progress of biogas slurry treatment and resource utilization. Trans. Chin. Soc. Agric. Eng. 2021, 37, 237–250. [Google Scholar]
  4. Shi, L.; Liu, J.; Wei, Y.; Li, B.; Xue, Y.; Bi, Z. Current Status of Resource Utilization of Biogas Slurry in Agriculture. Chin. Agriculural Sci. Bull. 2019, 35, 109–117. [Google Scholar]
  5. Lai, X.; Wu, J.; Wang, J.; Xu, M.; Meng, X.; Mao, X.; Li, Y. The Long-term Effects of Biogas Slurry on Soil Properties and Potential Risks of Heavy Metals in Soils. J. Soil Water 2018, 32, 359–364+370. [Google Scholar]
  6. Sui, H.; Chen, X.; Qin, N.; Wang, G.; Xu, K.; Ai, P. Effects of Drip Irrigation with Biogas Slurry on Yield and Quality of Tomato and Physical and Chemical Properties of Soil. Shandong Agric. Sci. 2016, 48, 80–84. [Google Scholar]
  7. Xue, S.; Qiu, L.; Guo, X.; Yao, Y. Effect of liquid digestate recirculation on biogas production and enzyme activities for anaerobic digestion of corn straw. Water Sci. Technol. 2020, 82, 144–156. [Google Scholar] [CrossRef]
  8. Yang, Y.; Wang, M.; Yan, S.; Yong, X.; Zhang, X.; Awasthi, M.K.; Xi, Y.; Zhou, J. Effects of hydrochar and biogas slurry reflux on methane production by mixed anaerobic digestion of cow manure and corn straw. Chemosphere 2022, 310, 136876. [Google Scholar] [CrossRef]
  9. Yang, J.; Wang, D.; Luo, Z.; Zeng, W. Influence of reflux ratio on the anaerobic digestion of pig manure in leach beds coupled with continuous stirred tank reactors. Waste Manag. 2019, 97, 115–122. [Google Scholar] [CrossRef]
  10. Zhang, H.; Wang, W.; Yuan, X.; Li, Q.; Yang, Z. Effect of Slurry Recirculation on Methane Production of Cotton Stalk and Its microflora. China Biogas. 2018, 1, 19–25. [Google Scholar]
  11. Xiao, H.; Xu, X.; Zhu, X.; Zhou, W. Application of membrane technology for volume reduction of biogas slurry. Trans. Chin. Soc. Agric. Eng. 2020, 36, 226–236. [Google Scholar]
  12. Yin, F.; Zhan, Y.; Yue, C.; Hu, X.; Zhu, Z.; Dong, H. Research progress on membrane technology for treatment of husbandry biogas slurry and wastewater. J. Agro-Environ. Sci. 2021, 40, 2335–2341. [Google Scholar]
  13. Hu, C.L.; Zhang, D.; Dai, L. Research progress of inhibitory effects of ammonia in an anaerobic digestion system. Environ. Eng. 2016, 34, 23–27. [Google Scholar]
  14. APHA. Standard Methods for the Examination of Water and Wastewater, 18th ed.; American Public Health Association: Washington, DC, USA, 1998. [Google Scholar]
  15. Chen, Z.; Zhang, R.; Chen, S. Effects of peg on pore formation of polyether sulfone microporous membranes. Acta Polym. Sin. 2005, 4, 566–570. [Google Scholar]
  16. Dong, H.B.; Xu, Y.Y.; Zhu, L.P.; Yi, Z.; Zhu, B.K. Structure control and properties of ultrafiltration/microfiltration membranes. J. Funct. Mater. 2008, 39, 1941–1945. [Google Scholar]
  17. Szwast, M.; Szwast, Z.; Grądkowski, M.; Piątkiewicz, W. Modelling of postproduction suspensions concentration processes by “Batch” membrane microfiltration. Chem. Process Eng. Inz. Chem. Proces. 2013, 34, 313–325. [Google Scholar] [CrossRef]
  18. Xu, Y.; Zou, D.; Xiong, J. Microfiltration membrane materials and techniques. J. Clin. Rehabil. Tissue Eng. Res. 2011, 15, 2949–2952. [Google Scholar]
  19. Camilleri-Rumbau, M.S.; Norddahl, B.; Wei, J.; Christensen, K.V.; Søtoft, L.F. Microfiltration and ultrafiltration as a post-treatment of biogas plant digestates for producing concentrated fertilizers. Desalin. Water Treat. 2015, 55, 1639–1653. [Google Scholar] [CrossRef]
  20. Ni, C.; Zheng, X.; Zhang, Y.; Zhang, X.; Li, Y. Multifunctional porous materials with simultaneous high water flux, antifouling and antibacterial performances from ionic liquid grafted polyethersulfone. Polymer 2021, 212, 123183. [Google Scholar] [CrossRef]
  21. Wei, Y.; Sun, X.; Chu, R.; Chen, N. Process parameters of biogas slurry concentrating by membrane method. China Biogas 2020, 38, 60–65. [Google Scholar]
  22. Fan, K.; Zhou, G.; Yang, H.; Jun, H.U.; Hou, Z. Ultrafiltration membranes prepared from polyethersulfone-grafted-poly (N-vinyl-pyrrolidone) synthesized via simultaneous irradiation in homogenous phase and their anti-fouling performance. J. Radiat. Res. Radiat. Process. 2018, 36, 020301-1–020301-8. [Google Scholar]
  23. Zhang, X.; Zhao, W.; Zhao, C. Progress in Functionalized Polyethersulfone Membranes. J. Funct. Polym. 2021, 34, 114–143. [Google Scholar]
  24. Wang, M.; Wang, G.; Qian, L.; Yong, X.; Wang, Y.; An, W.; Jia, H.; Zhou, J. Biochar production using biogas residue and their adsorption of ammonium nitrogen and chemical oxygen demand in wastewater. Biomass Convers. Biorefin. 2021. [Google Scholar] [CrossRef]
  25. Zheng, Y.; Yu, Q.; Wang, H.; Wang, Y.; He, N.; Shen, L.; Li, Q. Preparation of biochars from biogas residue and adsorption of ammonia-nitrogen in biogas slurry. Ciesc J. 2014, 65, 1856–1861. [Google Scholar]
  26. Yuxiu, Z.H.; Xiaoshan, M.E.; Yawei, W.A.; Dawei, Y.U.; Yuansong, W.E. Research progress of ammonia inhibition and counter measures during anaerobic digestion of livestock wastes. Chin. J. Environ. Eng. 2018, 12, 985–998. [Google Scholar]
  27. Zhang, B.; Zhao, H.; Hairu, Y.U.; Chen, D.; Xue, L.I.; Changming, G.E.; Renzhe, P.; Cui, Z. Evaluation of Biogas Production Performance of Corn Straw by Anaerobic Digestion. Environ. Sci. Technol. 2016, 39, 70–74. [Google Scholar]
  28. Cheng, H.; Jing, Z.; Zhang, Z.; Tang, H. Ammonia inhibition and its regulation strategy during anaerobic digestion. Appl. Chem. Ind. 2020, 49, 1308–1312. [Google Scholar]
  29. Li, H.; Cao, F.; Wang, Y. The effect of different acetic acid accumulation on the methanogenic population and methane production in dry mesophilic anaerobic digestion. Energy Sources Part A-Recovery Util. Environ. Eff. 2016, 38, 1678–1684. [Google Scholar] [CrossRef]
  30. Shin, D.C.; Kim, I.T.; Jung, J.; Jeong, Y.; Lee, Y.E.; Ahn, K.H. Increasing Anaerobic Digestion Efficiency Using Food-Waste-Based Biochar. Fermentation 2022, 8, 282. [Google Scholar] [CrossRef]
  31. Pan, J.; Ma, J.; Zhai, L.; Liu, H. Enhanced methane production and syntrophic connection between microorganisms during semi-continuous anaerobic digestion of chicken manure by adding biochar. J. Clean. Prod. 2019, 240, 118178. [Google Scholar] [CrossRef]
  32. Wang, S.; Shi, F.; Li, P.; Yang, F.; Pei, Z.; Yu, Q.; Zuo, X.; Liu, J. Effects of rice straw biochar on methanogenic bacteria and metabolic function in anaerobic digestion. Sci. Rep. 2022, 12, 6971. [Google Scholar] [CrossRef]
Figure 1. Effects of the microfilter membrane system on SS.
Agriculture 12 02040 g001
Figure 2. Effects of the microfilter membrane system on COD.
Agriculture 12 02040 g002
Figure 3. Effects of the microfilter membrane system on ammonia nitrogen.
Agriculture 12 02040 g003
Figure 4. Effects of biochar absorption on SS.
Agriculture 12 02040 g004
Figure 5. Effects of biochar absorption on COD.
Agriculture 12 02040 g005
Figure 6. Effects of biochar absorption on ammonia nitrogen.
Agriculture 12 02040 g006
Figure 7. Effect of supernatant reflux of biogas slurry on ammonia nitrogen.
Agriculture 12 02040 g007
Figure 8. Effect of biogas slurry reflux on volatile fatty acid content. (a) CK group (b) T1 treatment, (c) T2 treatment, (d) T3 treatment, (e) T4 treatment.
Agriculture 12 02040 g008
Figure 9. Effect of biogas slurry reflux on methane production during anaerobic digestion.
Agriculture 12 02040 g009
Figure 10. Effect of biogas slurry reflux on cumulative methane production during anaerobic digestion.
Agriculture 12 02040 g010
Table 1. Physical characteristics of the raw materials.
Raw MaterialTotal Carbon a (TC) (%)Total Nitrogen a (TN) (%)C/NTotal Solid (TS) (%)Volatile Solid (VS) (%)
Biogas slurry32.4 ± 0.350.66 ± 0.0849.09 ± 0.723.68 ± 0.411.32 ± 0.33
Corn stover42.67 ± 0.090.98 ± 0.1143.54 ± 0.7889.69 ± 0.2686.37 ± 0.16
Biochar47.56 ± 0.820.96 ± 0.0649.08 ± 0.5298.97 ± 0.0698.89 ± 0.43
Inoculum33.36 ± 0.292.52 ± 0.3313.29 ± 0.213.54 ± 0.151.12 ± 0.44
Note: C/N: The ratio of organic carbon source to total nitrogen, a The parameters were analyzed on a dry basis.
Table 2. Fitting results of cumulative methane production in the anaerobic digestion process.
Kinetic Parameters of Cumulative Methane Production
Treatment
Group
Ym
(ML g−1 VS)
Rm
(mL d−1 g−1 VS)
λ(d)R2Ya
(mL g−1 VS)
Ra
(mL d−1 g−1 VS)
CK106.57 ± 0.7419.84 ± 0.891.16 ± 0.130.9924108.44 ± 2.9827.50 ± 2.51
T1126.71 ± 0.9524.67 ± 1.390.40 ± 0.170.9858129.68 ± 3.5638.40 ± 2.01
T2135.15 ± 0.8524.56 ± 1.330.37 ± 0.180.9864137.14 ± 3.5539.21 ± 2.15
T3111.33 ± 0.5623.17 ± 1.120.45 ± 0.140.9912113.19 ± 2.0330.85 ± 3.12
T4106.22 ± 0.8220.63 ± 1.220.66 ± 0.140.9928108.70 ± 4.0630.07 ± 1.57
Publisher’s Note: MDPI stays neutral with regard to jurisdictional claims in published maps and institutional affiliations.

