Article

The Effect of the Method of Plant Protection on the Quality of Remontant Strawberry Cultivars Grown in a Gutter System under Covers

1
Department of Horticulture, University of Agriculture in Krakow, 31-120 Kraków, Poland
2
Department of Botany, Physiology and Plant Protection, University of Agriculture in Krakow, 31-120 Kraków, Poland
3
Departmentof Dendrology, Pomology and Plant Nursery, Poznan University of Life Sciences, 60-637 Poznań, Poland
*
Author to whom correspondence should be addressed.
Agriculture 2022, 12(12), 2041; https://doi.org/10.3390/agriculture12122041
Submission received: 30 September 2022 / Revised: 18 November 2022 / Accepted: 25 November 2022 / Published: 29 November 2022
(This article belongs to the Special Issue The Impact of Environmental Factors on Fruit Quality)

Abstract

:
To maintain a constant supply of fresh fruit from May to November, producers increase the area of strawberry cultivation under shelters and grow strawberries that repeat fruiting. An additional problem is the reduction of available pesticides caused by the recommendations of the European Green Deal. For these reasons, the authors undertook to compare cultivars to determine which had the best quality fruits and whichplant wasmost resistant to the most dangerous pests.The purpose of this study was to evaluate the effect of the method of plant protection on the health and quality of the fruit yield of three remontant strawberry cultivars grown in a soilless medium. This study evaluated fruit yield and fruit quality as well as the contribution of pathogens to yield losses. For this purpose, standard phytopathological methods were used to identify the causes of disease symptoms on the fruit. At the same time, laboratory tests were carried out on the quality of the harvested strawberries, i.e., firmness and acidity of the fruit, soluble solids content, and respiration rate. The applied protection methods had little effect on the marketable yield and fruit size but had a significant impact on reducing fruit losses caused by the most common diseases. The effectiveness of individual protection methods inreducing the incidence of the tested pathogens and the effect on fruit quality parameters depended on the cultivar and growing season.

1. Introduction

Strawberry (Fragaria ananasa Duch.) is a popular and attractive fruit thanks to its taste and visual qualities [1,2,3]. The physical, sensory, and nutritional properties of strawberry fruit are related to characteristics such as size, firmness, color, taste, aroma, and vitamin C and phenol content [4]. The ratio of soluble solids content to total acidity (SSC/TA) is considered a good indicator of the taste quality of strawberry fruit [5,6]. Strawberries are prized fruits for their antioxidant content and their attributed role in the prevention of chronic diseases [7]. They are the richest source of bioactive compounds with antioxidant properties that provide protection against harmful free radicals [8]. Strawberries are highly susceptible to microbial contamination due to the fact that their skin is soft and easily ruptured, and has numerous indentations and hair-like protuberances, which allow most organisms to attach and proliferate [9]. The fruits have a short shelf life and are highly perishable, with a high rate of respiration, and suffer relatively high post-harvest losses due to fungal development, mechanical damage, physiological deterioration, and water loss [10]. Production volumes vary depending on the selected variety, district, weather conditions, crop management, and pest and disease management. The industry experiences losses due to fungal diseases [11]. The most important strawberry fruit rot problems are grey mould caused by the fungus Botrytis cinerea; anthracnose, primarily caused by Colletotrichum acutatum and other species of the genus Colletotrichum and strawberry leak, generally caused by Rhizopus spp. and Mucor spp. [11,12]. Very dangerous pathogens for both plants and fruit are fungus-like organisms of the genus Phytophthora, most commonly Phytophthora cactorum, which unfortunately attack strawberries even in soilless crops [13]. In Poland, the symptoms of powdery mildew on strawberry fruit are of lesser importance and dangerous only on strawberry varieties susceptible to the pathogen, since the fungus Podosphaera macularis does not cause strawberry rot but only disfigures it with a white coating of mycelium and conidia on the skin. In addition, sometimes this pathogenic fungus is responsible for the smallness of the fruit; caused by an excessive escape of water from the plants, infected fruit becomes hard, especially during the summer heat [14,15]. In intensive fruit production, in order to obtain high yields, it is necessary to use high fertilization rates as well as plant protection products [16]. Chemical compounds have been used to control these pathogens; however, their excessive utilization has favoured the development of pathogens resistant to pesticides, and recourse to broad-spectrum biocides is no longer an option because of their hazardous environmental risks [17,18]. Although fungicide treatments have been the main method for controlling postharvest diseases, public concern about fungicide residues in food and the development of fungicide resistance by pathogens haveincreased the search for alternative means of controlling the disease [19,20].
The aim of this study was to evaluate the effect of plant protection methods on the health and quality ofremontant strawberry cultivars.

2. Materials and Methods

2.1. Plant Material

The research was conducted overthree consecutive seasons throughout 2018–2020. The subject of this study was the fruit of three remontant strawberry cultivars: San Andreas®, Albion®, and Murano®, under standard protection with chemicals protection with biological preparations and control fruit, without plant protection treatments. The experiment was established with A+ cold storage frigo seedlings.

2.2. Treatments

Fungicides with different mechanisms of action were used alternately in chemicalprotection: Frupica 440 SC (mepanipyrim 440 g/L, 42.85%), Pyrus 400 SC (pyrimethanil 400 g/L, 34.30%), Luna Sensation 500 SC (fluopyram 250 g/L, 21.33%, and trifloxystrobin 250 g/L, 21.33%), Scorpion 325 SC (azoxystrobin 200g/L, 18.10%, and diphenoconazole 125 g/L, 11.30%), Siarkol 80 WG (sulphur 800 g/kg, 80%), Signum 33 WG (boscalid 267 g/kg, 26,70%, and pyraclostrobin 67 g/kg, 6.70%), Switch 62,5 WG (cyprodinil 375 g/kg, 37.50%, and fludioxonil 250 g/kg, 25%). Biological protection used preparations containing beneficial microorganisms: Serenade ASO (Bacillus subtilis QST 713 13.96 g/L, 1.34%, 1.042 × 10¹² CFU/L), Prestop WG (Gliocladium catenulatum J1446 32%, 107–109 CFU/g), Polyversum WP (Pythium oligandrum 106 oospores/g). Each combination consisted of 5 coconut mats, each 1 m in length, with 8 plants, in 4 repetitions. In each year, the following treatments were carried out, respectively: in 2018-7, 2019-7 and 2020-9, the amount of which depended on the indications of monitoring and signaling of pathogen development using the iMetos system weather station and computer models of agrophage development [21]. Additional pest control measures included painting support pipes for structural gutters with glue to reduce spider mite migration, yellow universal sticky boards for insects, and blue sticky boards to reduce thrips. Strawberries were grown in a gutter system under covers of coconut substrate (Figure 1).

2.3. Harvest

Strawberries were harvested three times a month at intervals of about 10 days, i.e., in July, August, and September. The average daily temperature was recorded in July, August, and September. In 2018, the average temperature was 19.0 °C, 19.6 °C, and 14.6 °C, respectively; it was 18.6 °C, 20.1 °C, and 14.8 °C in 2019, respectively; and it was 20.0 °C, 20.4 °C, and 14.9 °C in 2020, respectively. The harvest date was determined on the basis of the coloring of the fruit surface, and it fell at a stage close to full maturity, where the fruit surface was colored red.

2.4. Fruit Quality Measurement

At harvest, the marketable yield, the non-marketable yield (deformed, agrophage-damaged fruit), and the weight of 100 fruits from each repetition were weighed. The causes of lesions on fruit were then analyzed in the laboratory using standard phytopathological methods: wet camera, trap method for Phytophthora, culture on agar media, and identification with mycological keys [13,22,23,24]. The representative fruit samples for the tested cultivar and harvest date were divided into 4 replicates, each representing approximately 0.5 kg of fruit.
Fruit measurements and chemical analyses were performed on a random sample for each combination of 40 fruits. Strawberry fruit firmness [N] was measured with a TA 500 Lloyd Texture Analyzer using a 6.35 mm diameter tip. The measurement of fruit firmness was performed 1 for one fruit. Soluble solids content SSC (%) and total acidity TA (% citric acid) were determined in the juice of strawberries, whose firmness was previously measured using an Atago Pal-BX/Acid 4 instrument. The soluble solids content to total acidity ratio (SSC/TA) was calculated. The fruit respiration rate (mg CO2 kg−1 h −1) was measured (on a sample of 9 strawberries from the combination) with an Air Tech 2500-P CO2 analyzer.

2.5. Statistical Analysis

Data were analyzed using one-way analysis of variance (ANOVA) implemented in the Statistica software v. 13.3 (Tibco Software Inc., Palo Alto, CA, USA); calculations were conducted for each season and cultivar separately. The values expressed as a percentage were transformed according to the Bliss function (y = arcsin √ x). Fisher’s LSD test for laboratory results of fruit quality and Duncan’s MRT test for yields and the contributions of individual pathogens to fruit damage were used to determine the significance of differences between mean values at the p ≤ 0.05 significance level.

3. Results and Discussion

3.1. Fruit Yield

The results of the fruit harvest of the ‘San Adreas’ cultivar indicate that the applied methods of plant protection did not significantly impact the marketable yield of strawberries as well as the fruit weight of 100 fruits throughout this study period except in 2019 (Table 1). In contrast, in 2018 and 2020, it was found that chemical protection significantly reduced the amount of non-marketable yield, including a significant reduction in the amount of fruit infected by pathogens, primarily fungal pathogens. In addition, protection with biological preparations effectively reduced the amount of non-commercial yield compared to the control in 2018.
Summarizing the fruit yield of the ‘Albion’ variety (Table 2), it can be said that depending on the season and climatic conditions, the impact of the applied methods of strawberry protection varied. In the first year of this study, there was no significant effect of the applied methods on marketable yield. In 2019, protection with the use of biological preparations had a significantly favorable effect, while in 2020, chemical protection had the most favorable effect on the size of the marketable yield. In the first year of this study, chemical protection did not reduce the amount of marketable yield, which was higher in this combination than in the control. However, in subsequent years of this study, chemical protection significantly reduced the non-commercial yield, including pathogen-infested fruit. In 2020, protection with biological preparations also significantly reduced the amount of non-commercial yield compared to the control. The plant protection methods used had little effect on fruit weight; only chemical protection significantly influenced this parameter of fruit in 2018 and 2019 compared to the control.
Analyzing the fruit yield results of the ‘Murano’ cultivar, it can be noted that, similar to the ‘San Andreas’ cultivar, the applied plant protection methods did not significantly affect the marketable yield of strawberries as well as the weight of 100 fruits, compared to the control during 2019 and 2020. In 2018, the marketable fruit yield from the combination of chemical protection was significantly higher than that from plants protected with biological preparations. However, there was no significant difference compared to the control (Table 3). Despite the highest values of non-marketable yield in the control combination, statistical analysis of the results did not confirm a significant effect of chemical and biological protection on the reduction of non-marketable yield during the three years of this study.
The applied methods of strawberry protection showed no significant effect on the commercial yield and fruit weight. This is related to the small number, and thus rotation, of chemicals registered for strawberry protection in Poland and other European countries. The longer growing season and harvesting period of strawberries repeated fruiting grown under covers require the appropriate use of fungicides to ensure the correct rotation of chemicals, which is becoming increasingly difficult with the number of registered products decreasing every year. This threatens the formation of resistant races of pathogens to a particular chemical, making subsequent treatments with a preparation containing a particular compound pointless [25]. This phenomenon has been known for a long time in the protection of apple trees against Venturia inaequalis; in many orchards, strobilurin preparations are already completely ineffective [26]. It should be noted that they continue to dominate crop protection in single component as well as combination preparations, so during strawberry protection, chemical protection may not have been significantly effective in marketable yield. The European Green Deal calls for a further reduction in crop protection products by 2030, so the effectiveness of using biological preparations as well as biotech preparations based on natural substances that can be used in organic crop protection should be studied and tested. The short grace period of these agents encourages the protection of fruit from rot; however, the use of preparations based on beneficial microorganisms is burdened by a regime of appropriate climatic conditions—moderate temperature and high humidity [27]. Unfortunately, during the growing seasons when this study was conducted, there were high temperatures and air humidity dropped to low values, which resulted in poor colonization of plants by these microorganisms in the periods preceding infection and thus lower effectiveness of protection with biological preparations.

3.2. Fruit Quality

The values of fruit quality indicators determined immediately after harvesting were often different. However, the influence of the method of plant protection manifested itself differently depending on the characteristics studied (Table 4, Table 5 and Table 6). In general, control (unprotected) strawberries of the ‘San Andreas’cultivar were characterized by lower firmness and higher respiration intensity compared to fruit harvested from plants protected with fungicides or biological preparations (Table 4). The values of the other fruit quality indicators (SSC, TA, and Ratio SSC/TA) generally depended on the method of plant protection, but their changes varied from year to year. According to Kader [28], ripe strawberries contain about 7% SSC. In the present study, SSC content in all strawberry cultivars was higher in the harvest.
The three-year study showed that strawberries of the ‘Albion’ cultivar treated with chemicals had higher firmness and lower respiration intensity than the control fruit, except in 2018 (Table 5), while the method of plant protection had no effect on the values of the SSC/TA ratio. On the other hand, the effect of the method of plant protection on SSC and TA values became apparent in different ways during the 3-year study.
The quality of ‘Murano’ strawberries depended on the method of plant protection used (Table 6). As in the case of the ‘San Andreas’ cultivar, fruits protected with chemicals were characterized by higher firmness and lower respiration intensity compared to control strawberries. In general, a significant effect of the method of plant protection on the other studied quality traits of strawberries was also recorded. However, this influence manifested itself in different ways. It was reported that in 2019, strawberries protected with biological preparations showed higher SSC and TA content compared to other fruits. On the other hand, in the last year of this study, fruits treated with biological preparations contained more SSC and TA than fruits protected with fungicides, and their SSC/TA ratio value was significantly lower than that of the other fruits.
Whitaker et al. [6] showed that strawberries contain 0.56 to 1.05% citric acid, and the value of the SSC/TA ratio ranges from 6.4 to 15.7. In this study presented here, strawberries contained between 0.70 and 0.99% citric acid, depending on the variety, protection method, and year of the study, and the value of the SSC/TA ratio ranged from 9.0 to 13.6. The data presented here refer to the values of quality indicators of all tested strawberry varieties. In contrast, the respiration rate of strawberries ranged from 26.4 to 77.5 mg CO2kg−1h−1. Nunes et al. [29] reported that strawberries are metabolically very active. The rate of ethylene evolution is low, but they are characterized by high respiration rates of 50–100 mL CO2 per kg of fruit per hour at 20 °C. According to Błaszczyk et al. [30] remontant strawberry cultivars ‘San Andreas’, ‘Albion’, and ‘Murano’ grown in gutters under canopies are characterized by good quality. The results of the presented research confirm the good quality of strawberries regardless of the method of plant protection used.

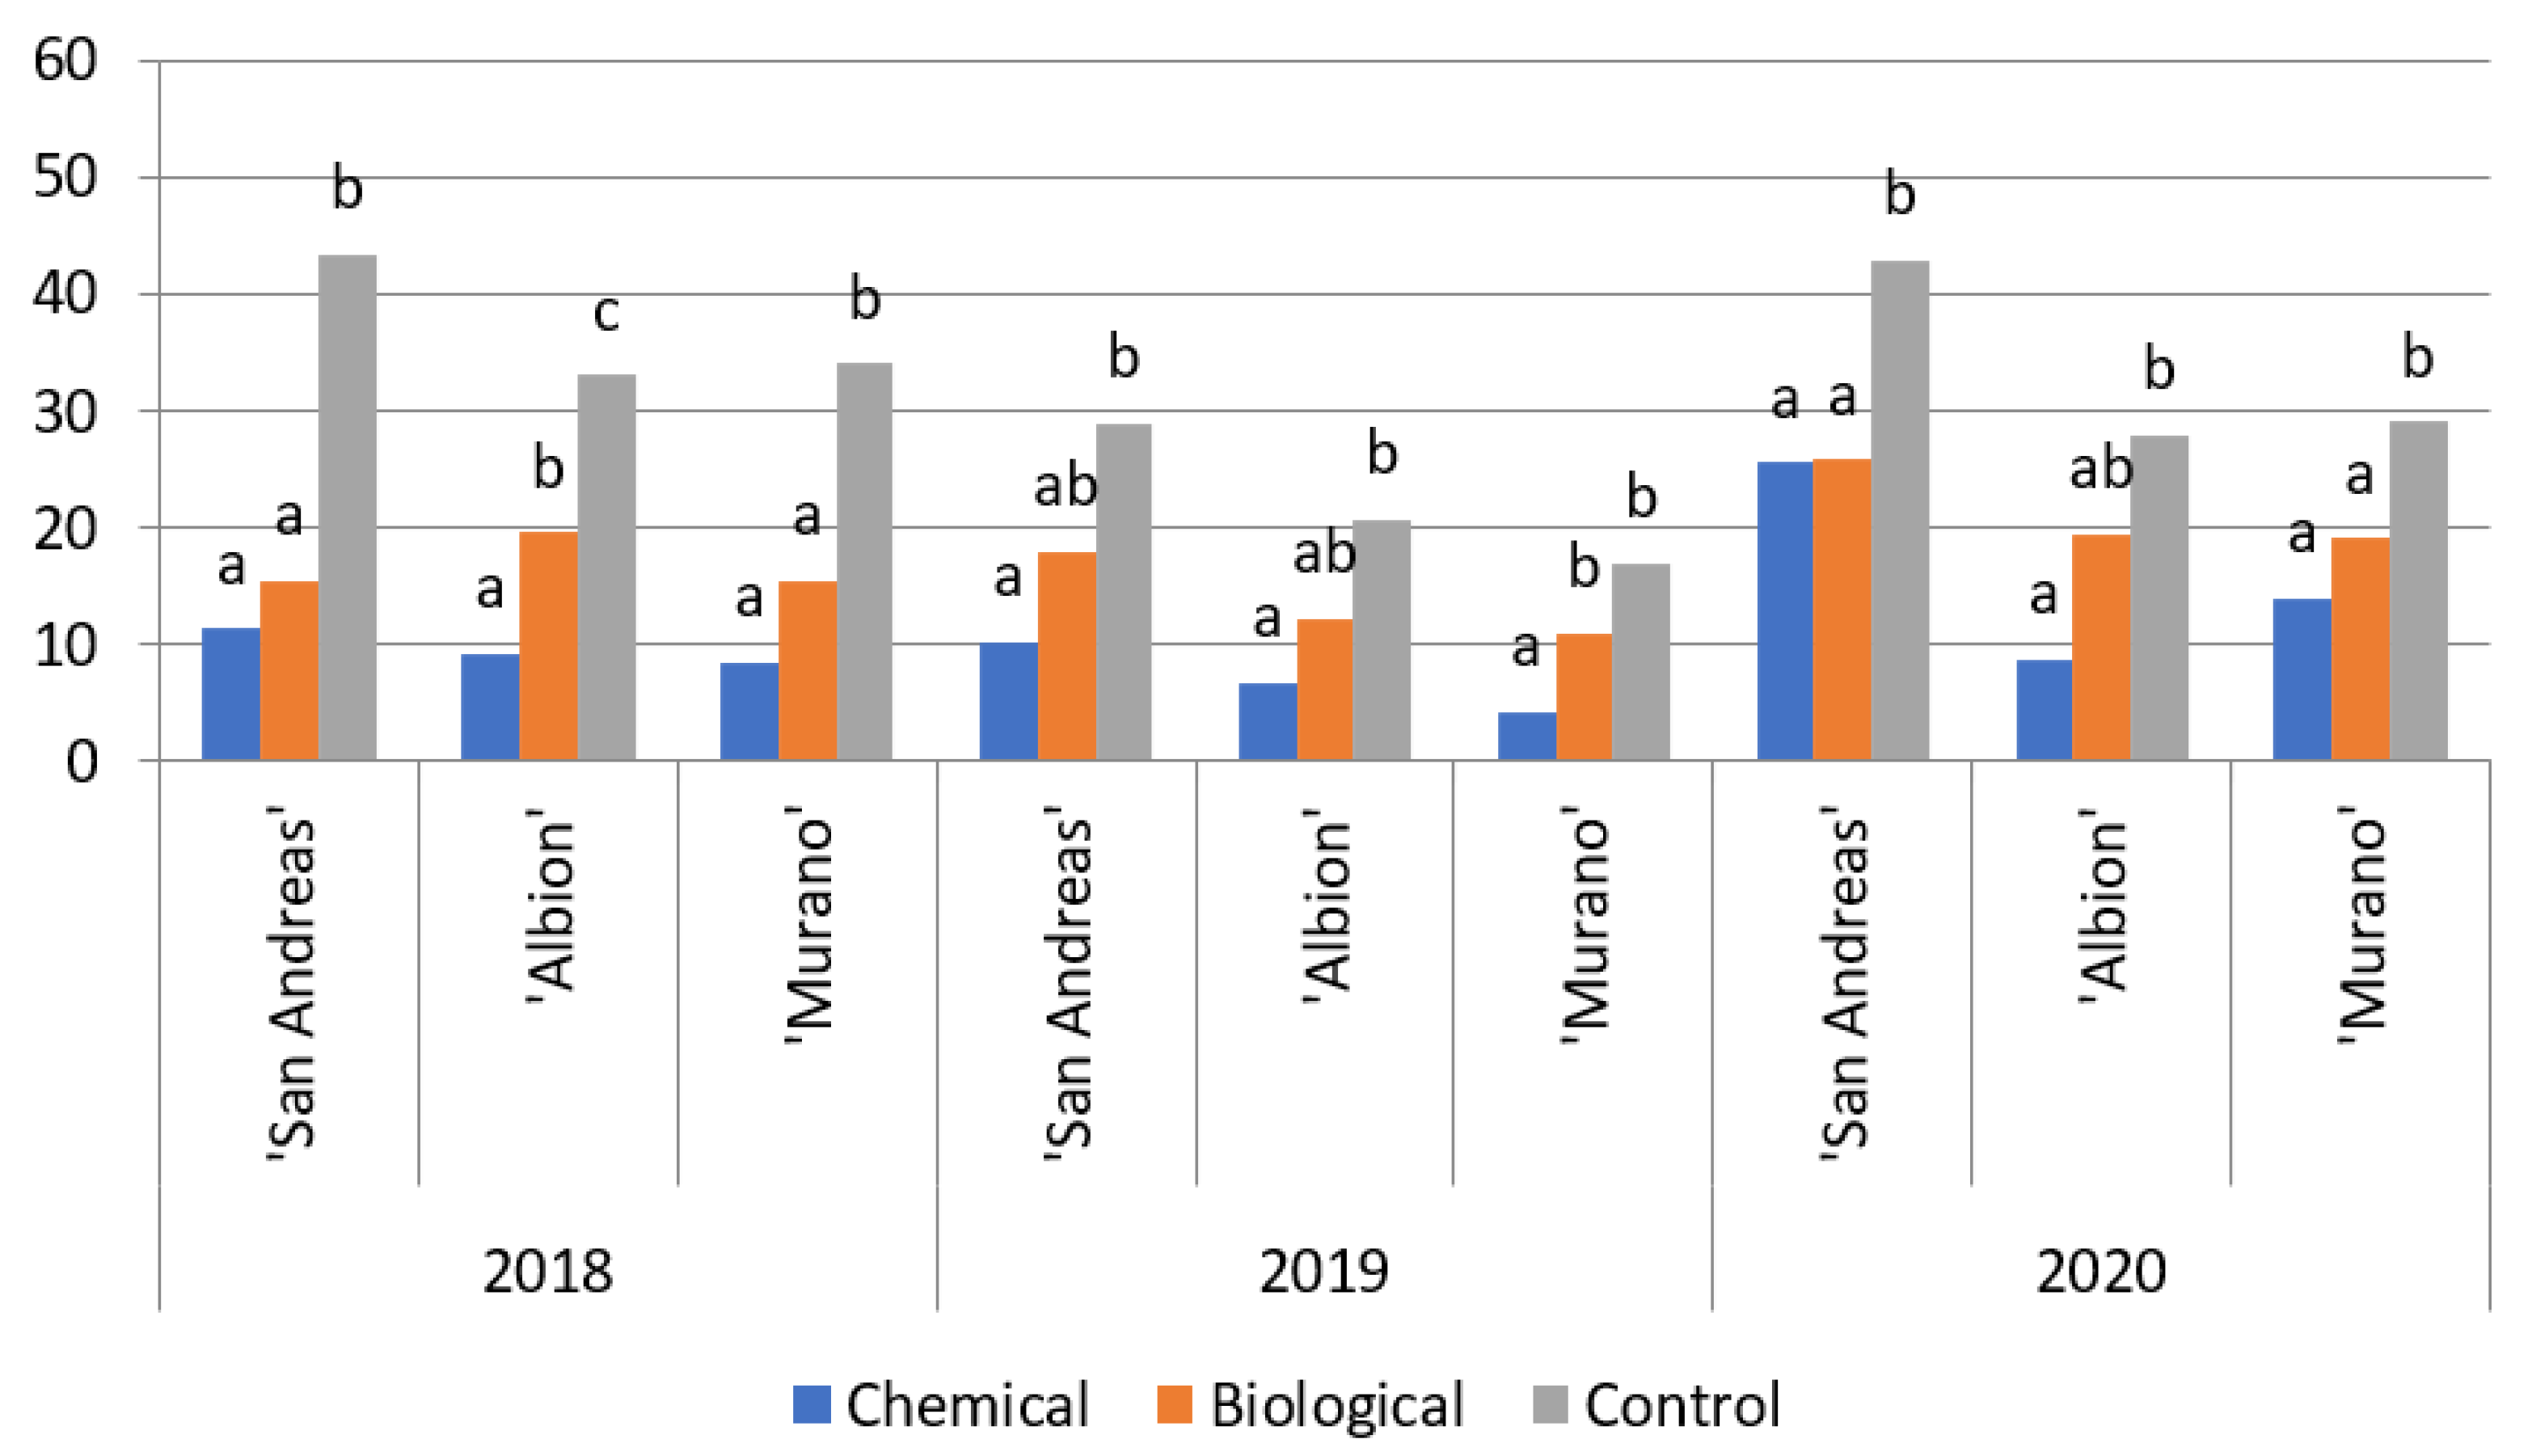
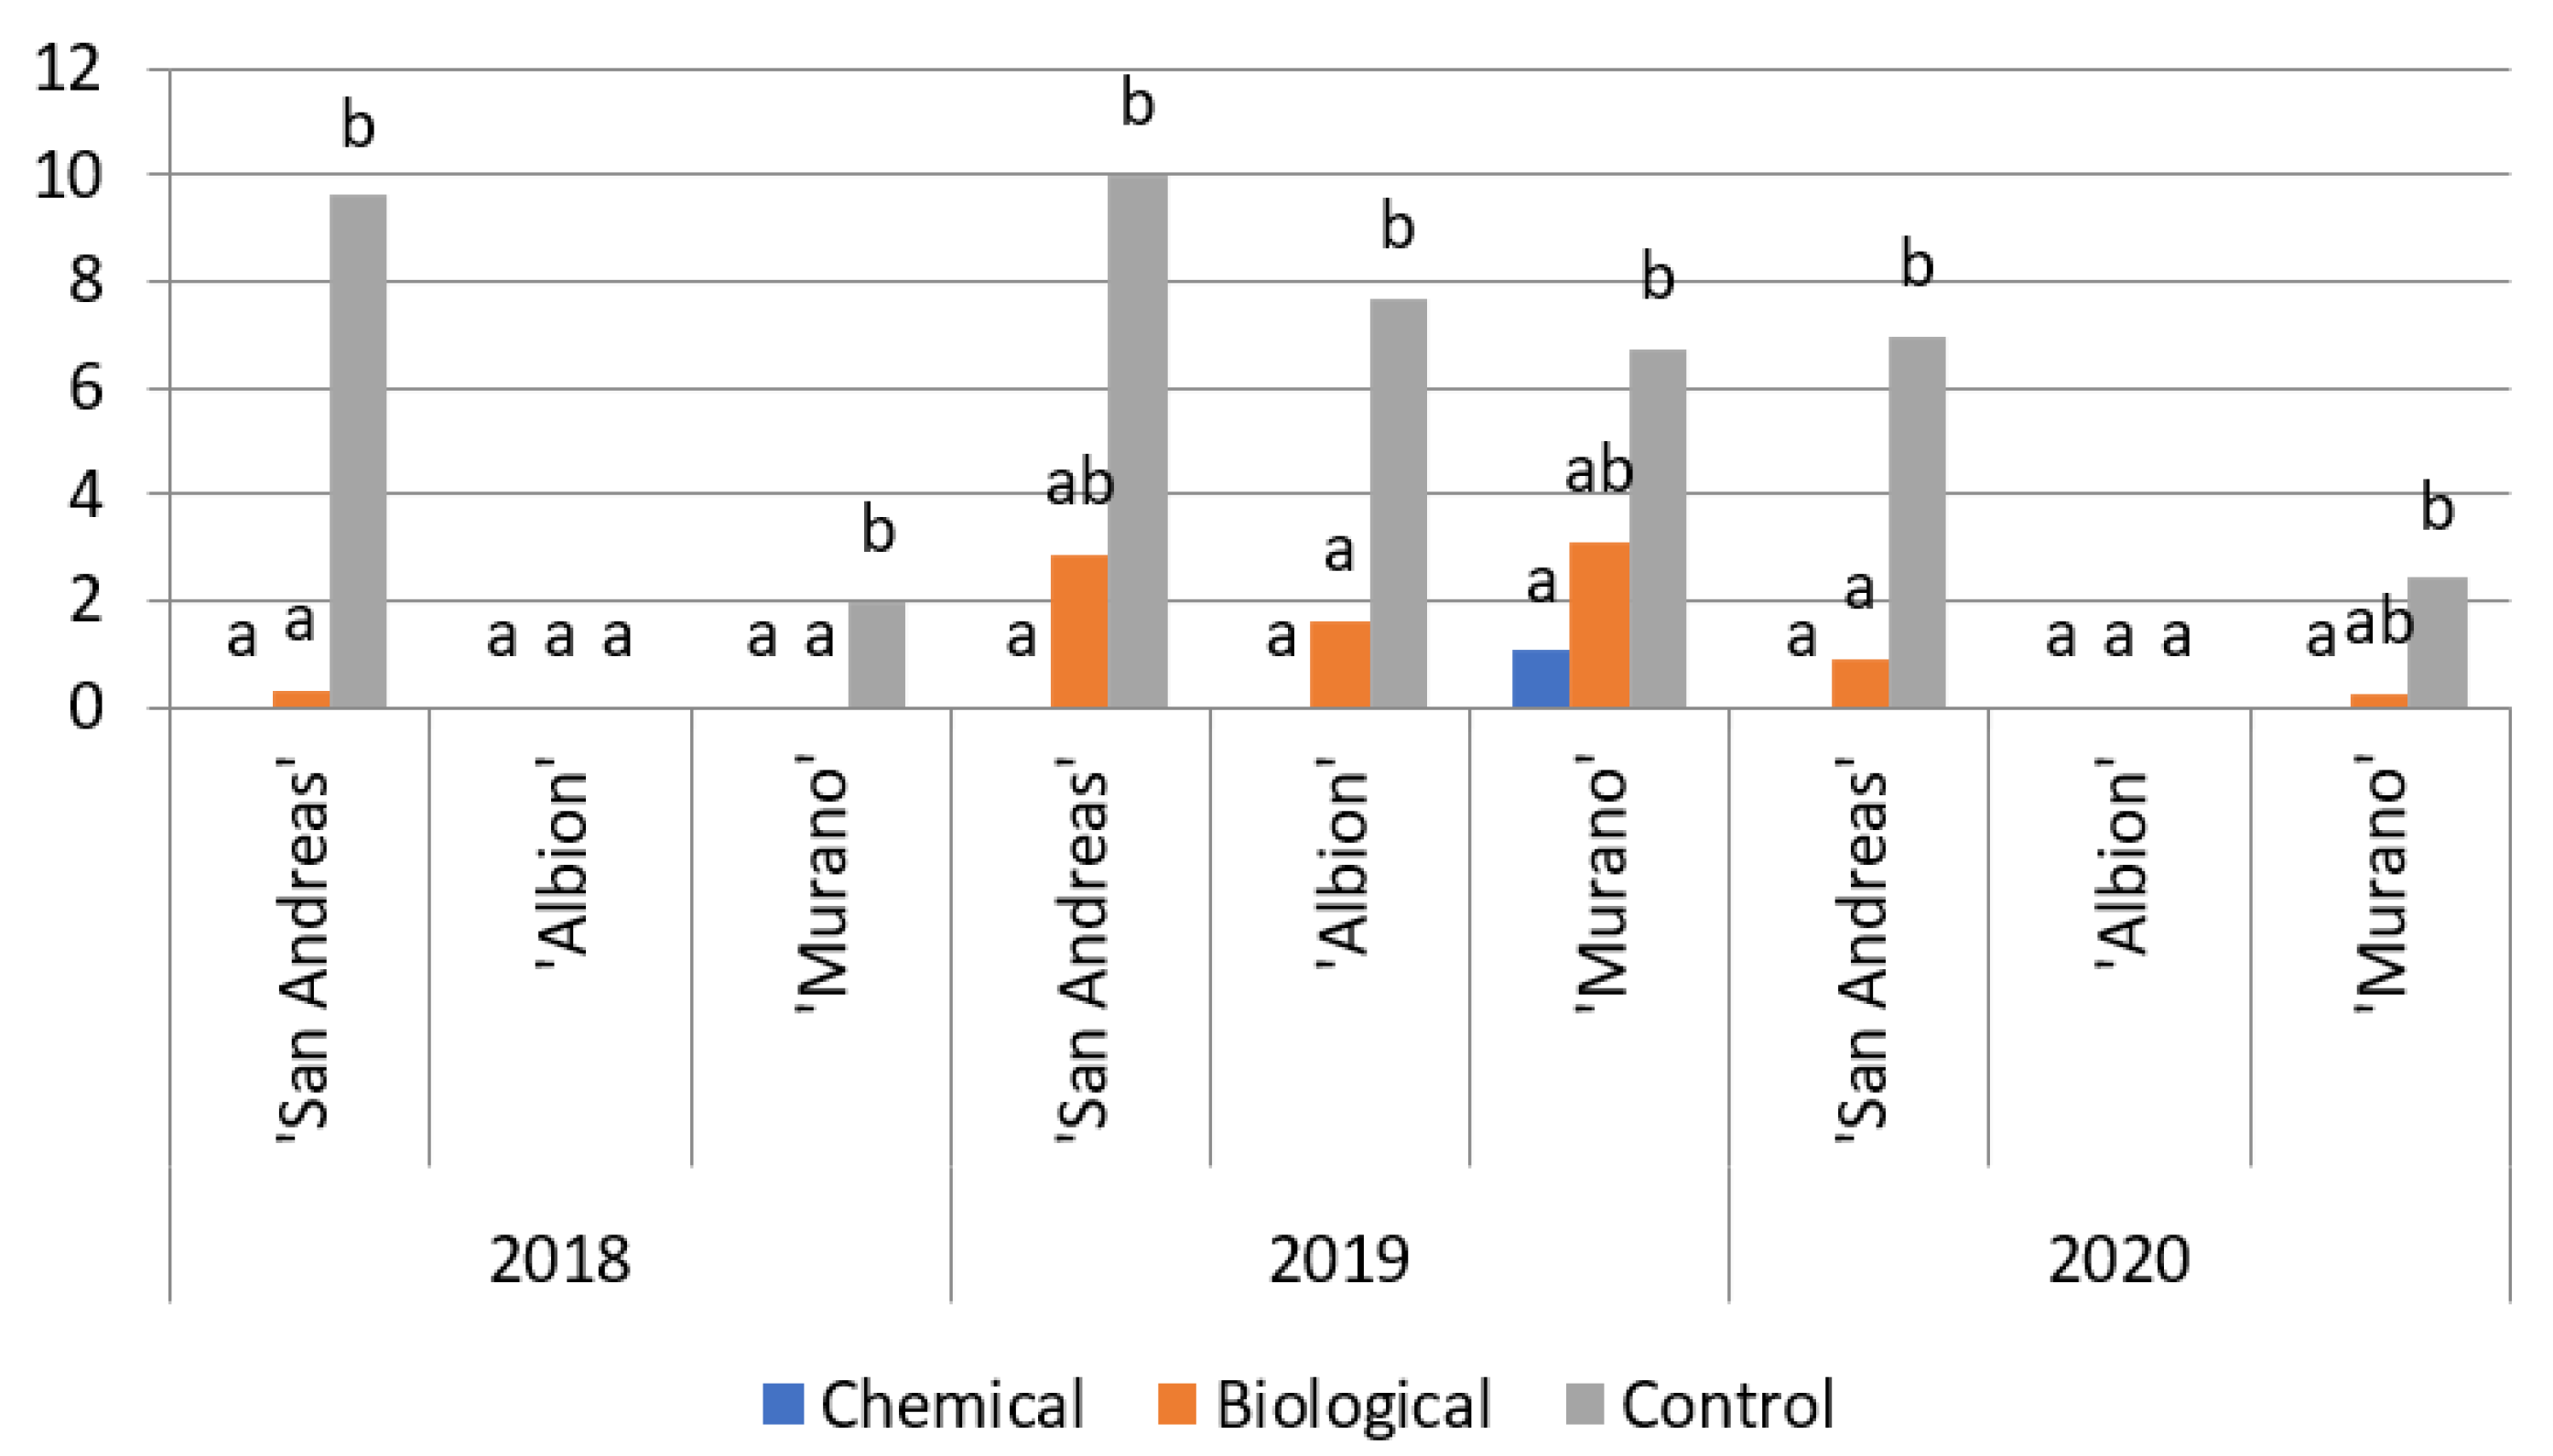
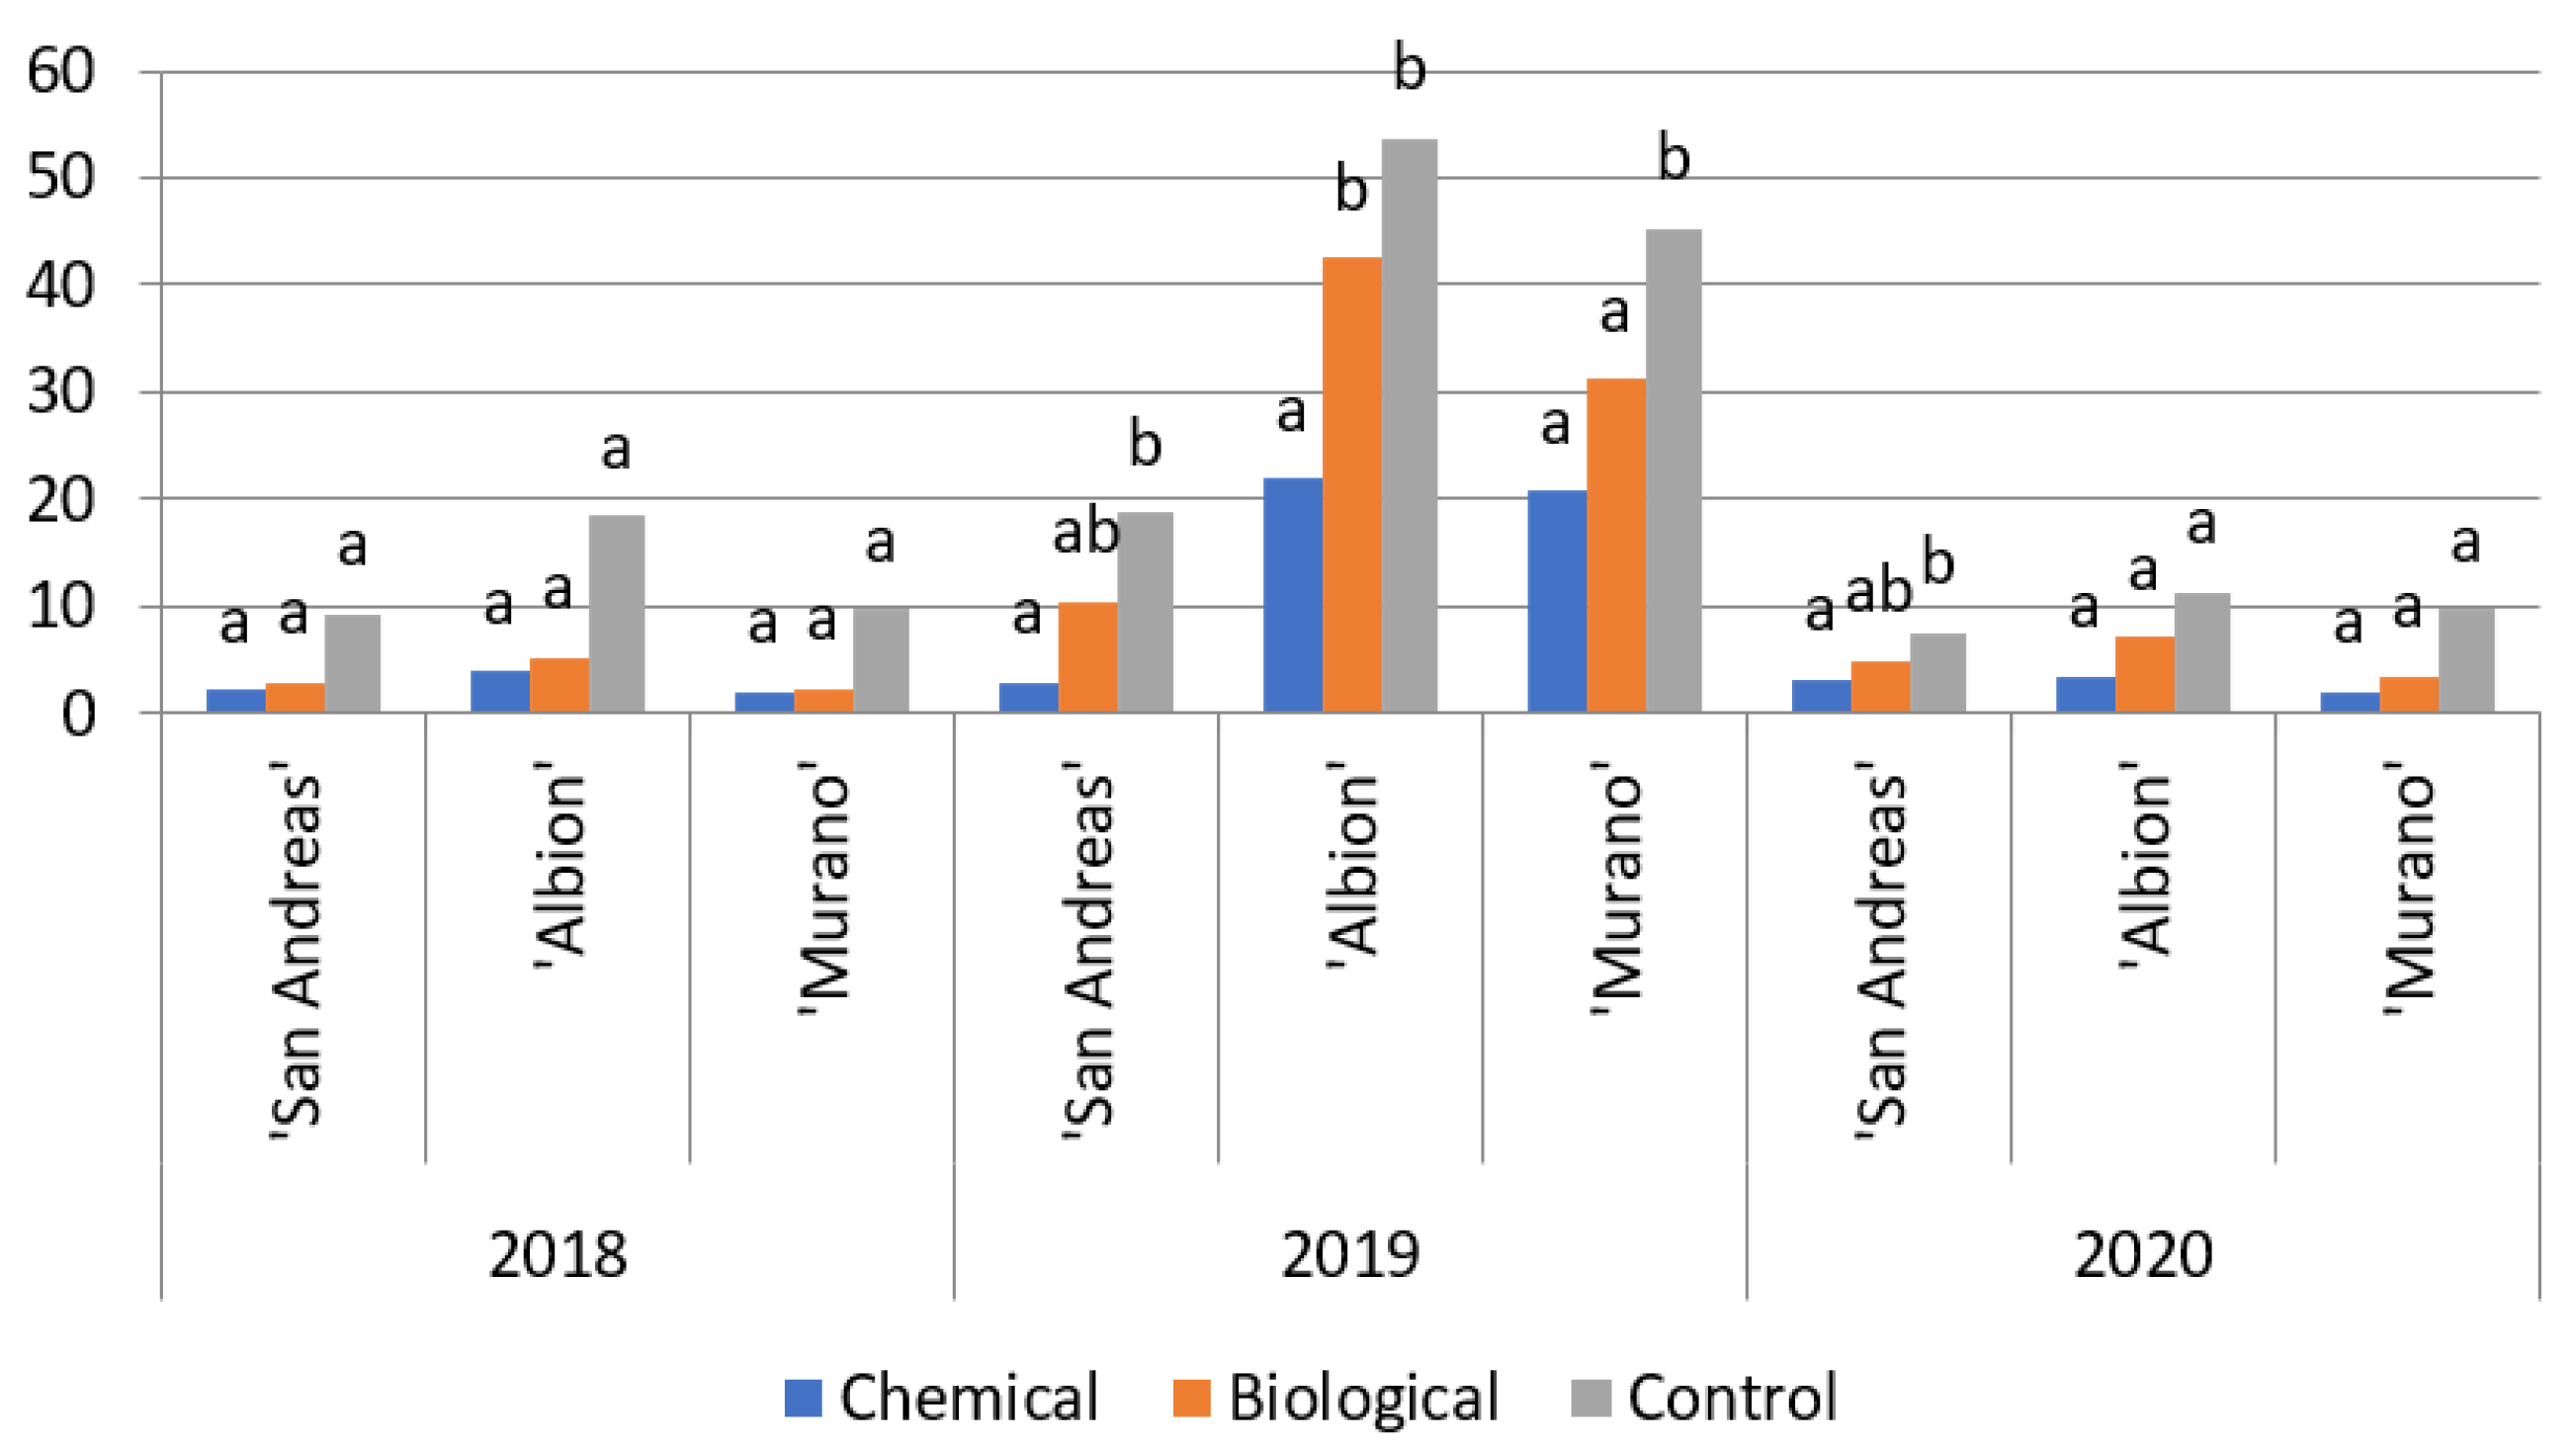
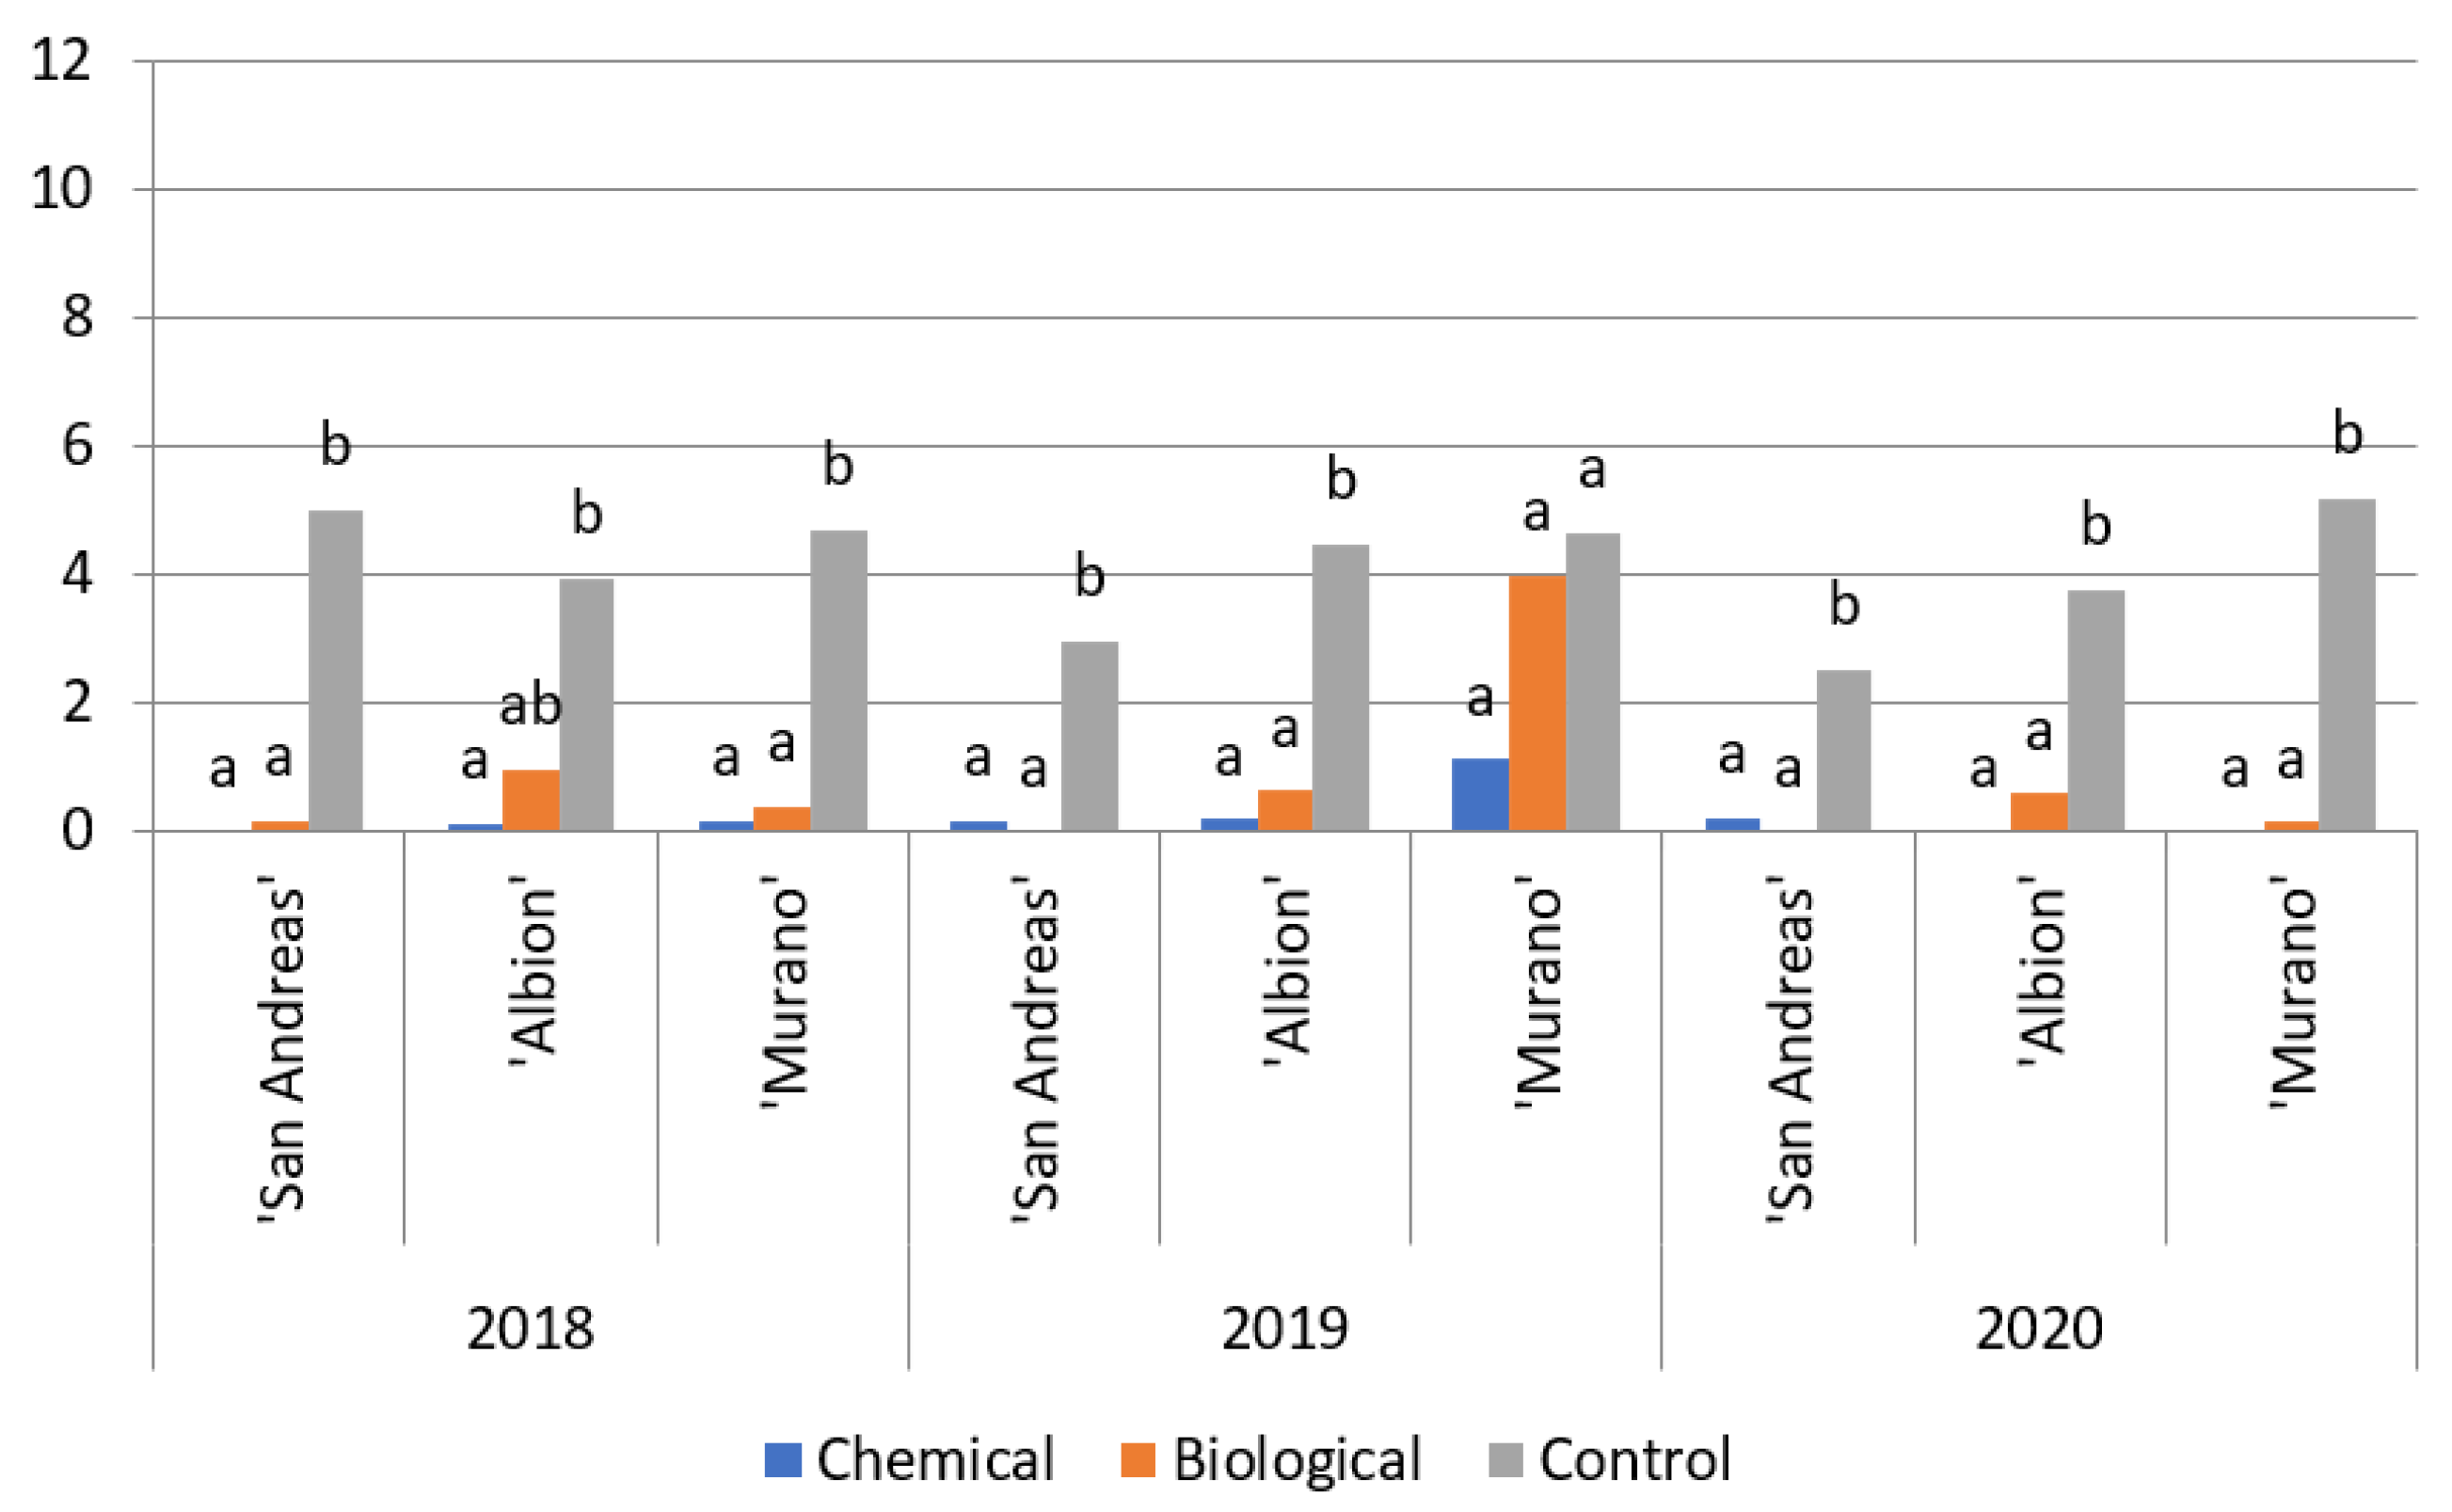
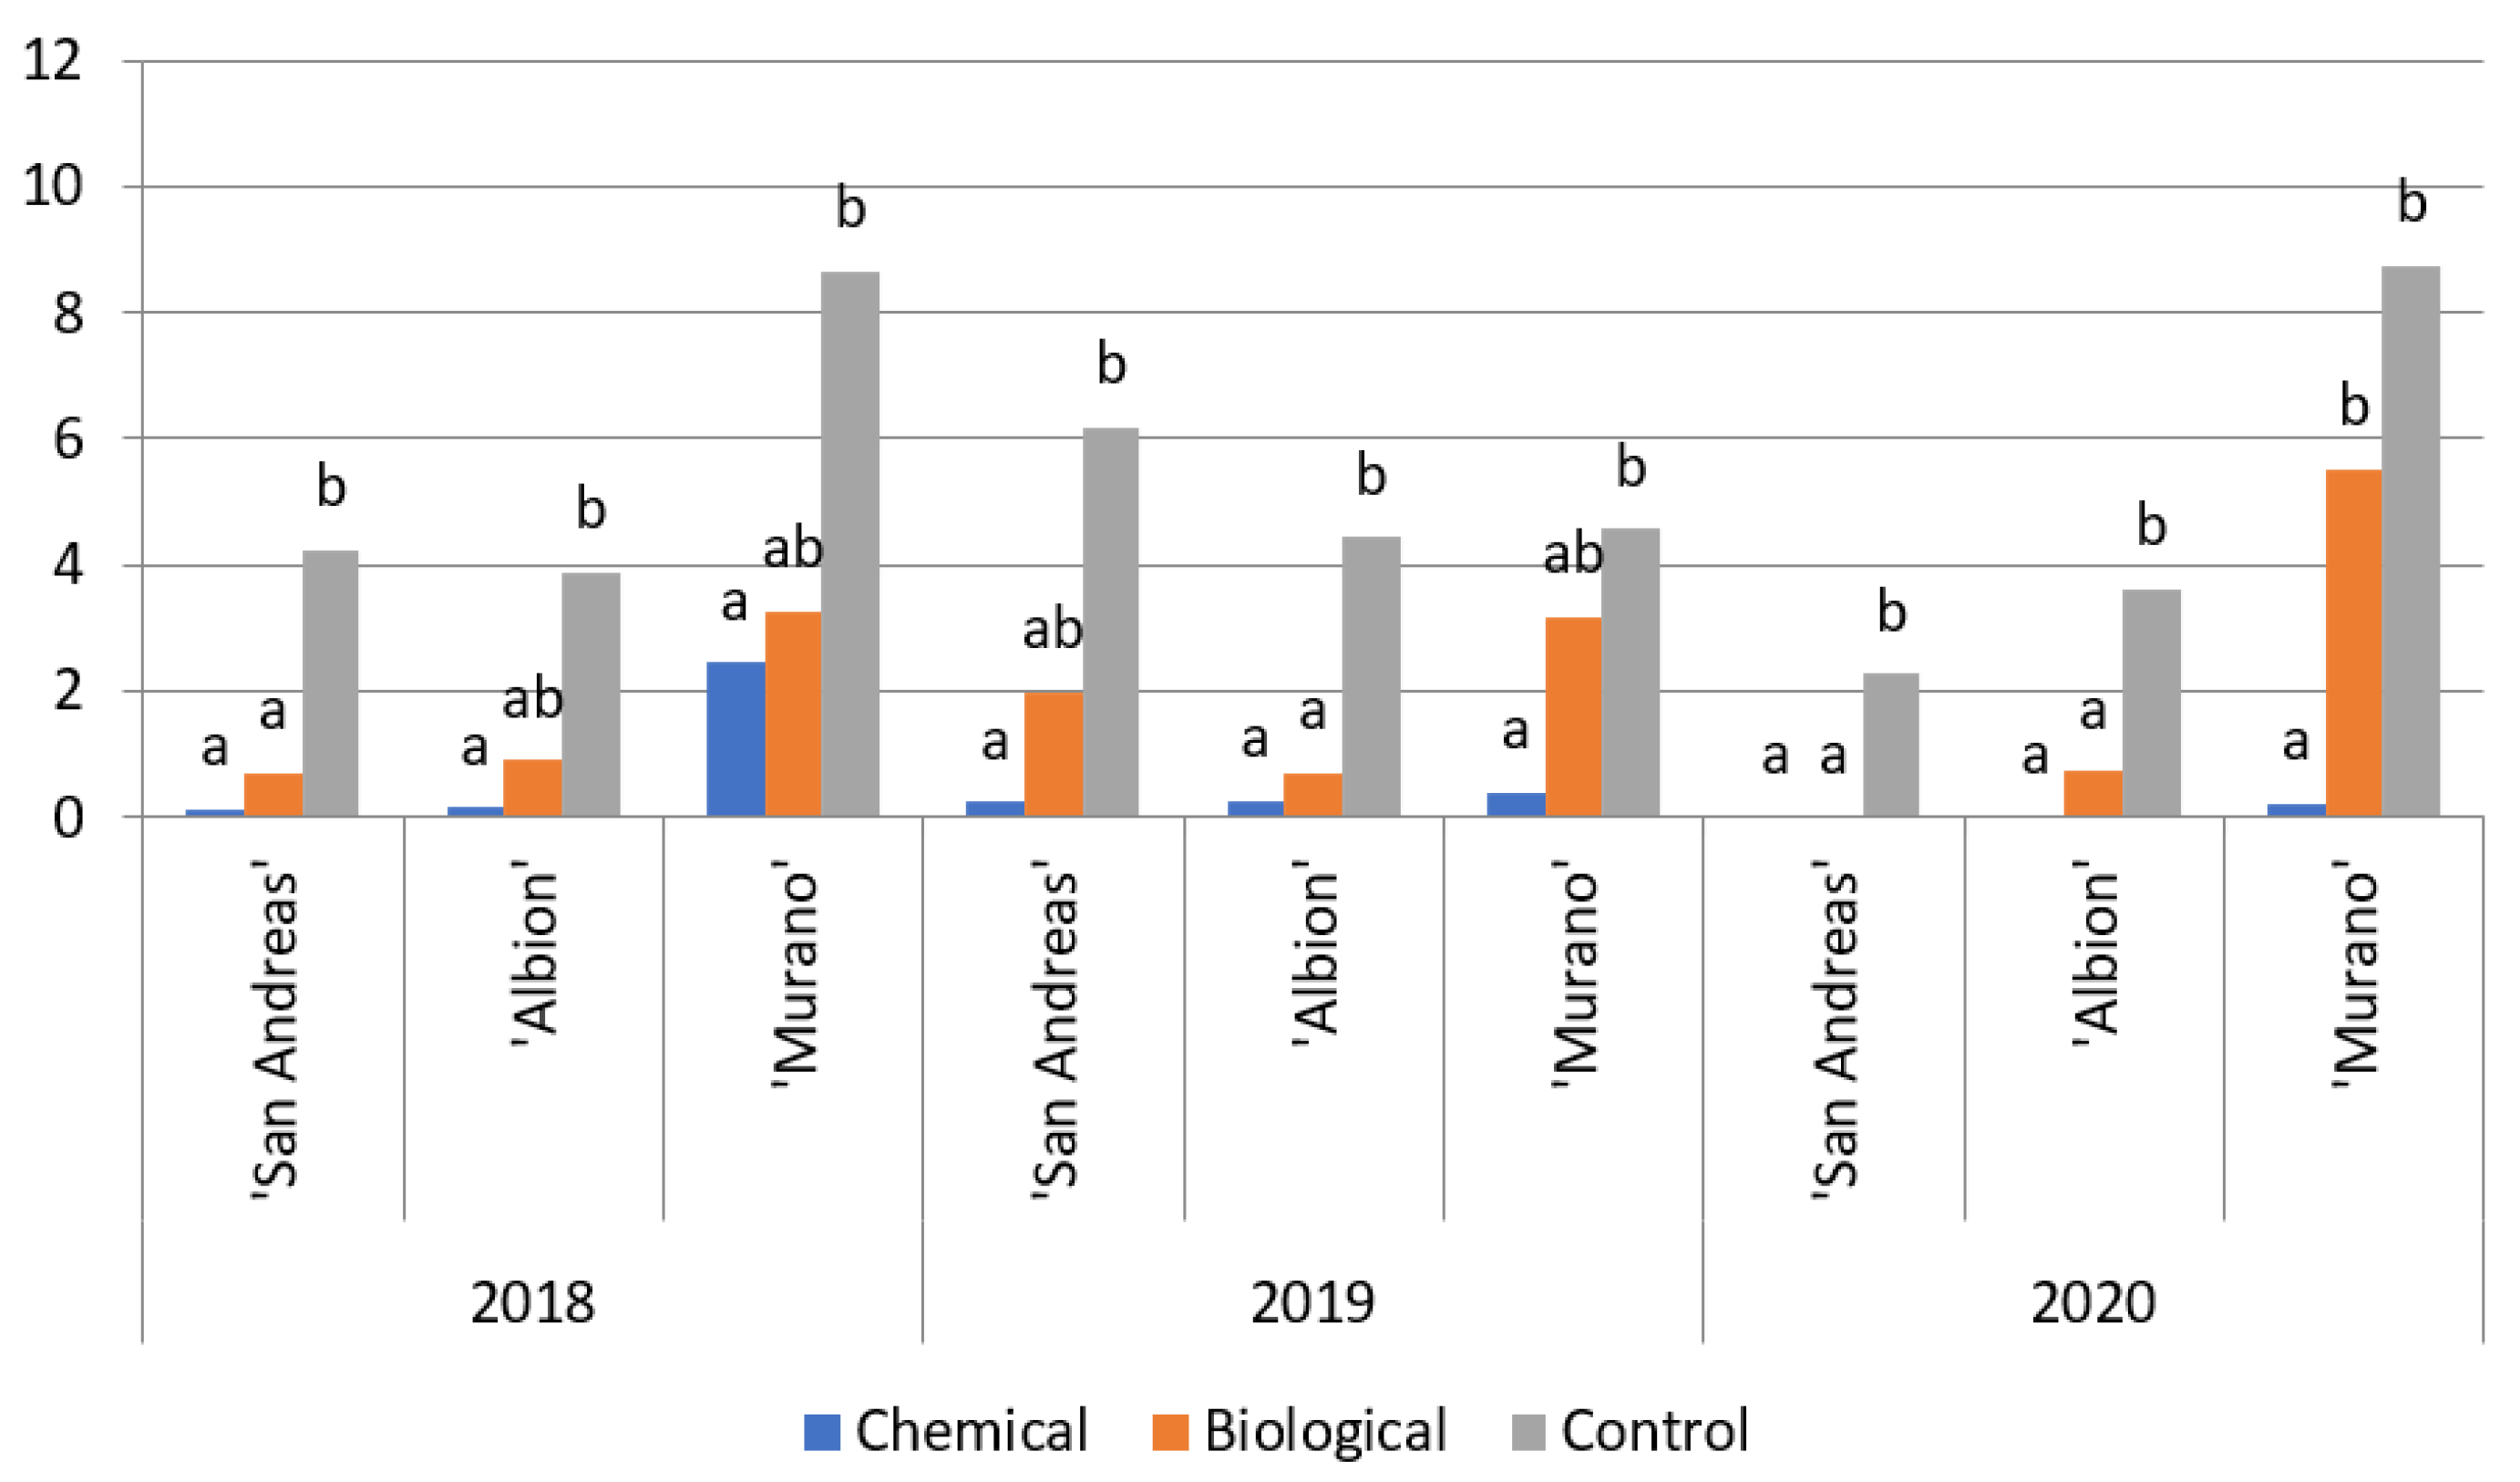
3.3. Infested Fruits

Analyzing the contribution of the gray mold pathogen as the cause of the most numerous fruit damage, it can be concluded that chemical protection effectively reduced the presence of this pathogen on the fruit of the tested varieties throughout the growing season (Figure 2). The pathogen was most numerous on unprotected fruit, especially of the ‘San Andreas’ cultivar. Protection with biological preparations effectively reduced the occurrence of Botrytis cinerea on the fruit of the cultivars ‘San Andreas’ and ‘Albion’ in 2018 and ‘San Andreas’ and ‘Murano’ in 2020.
The plant protection methods used were effective in reducing the occurrence of fungi of the genus Colletotrichum (Figure 3). Only on the fruit of the cultivars ‘San Andreas’ in 2019 and ‘Murano’ in 2019 and 2020, protection with biological preparations had a non-significant effect on reducing the occurrence of anthracnose on fruit compared to the control.
Effective reduction of symptoms of powdery mildew on the fruit of the cultivar ‘San Andreas’ with chemical protection was observed in 2019 and 2020, as well as ‘Albion’ and ‘Murano’ in 2019 (Figure 4). This is related to the high intensity of this disease in 2019; in other years, even under control, the share of the pathogen did not exceed several percent. In 2019, biological protection also significantly reduced the presence of disease symptoms on the fruit of the ‘Murano’ cultivar.
Chemical and biological protection significantly reduced the occurrence of fruit rot of the ‘San Andreas’ variety caused by Rhizopus and Mucor fungi throughout the experimental period (Figure 5). Additionally, both methods of plant protection were effective for the fruit of the ‘Murano’ variety in 2018 and 2020 and the ‘Albion’ cultivar in 2019 and 2020. In 2018, only chemical protection significantly reduced fruit rot of the ‘Albion’ variety compared to the control.
Both crop protection methods significantly reduced the incidence of fruit rot caused by Phytophthora spp. on the cultivar ‘San Andreas’ in 2018 and 2020, and the cultivar ‘Albion’ in 2019 and 2020 (Figure 6). Fruit of the ‘Murano’ variety was effectively protected by the application of chemical fungicides in 2018, 2019, and 2020. Similarly, the fruit of the ‘Albion’ variety in 2018 was effectively protected only during chemical protection.
The plant protection methods used significantly reduced the most common fruit pathogens, resulting in a decrease in strawberry rot. The use of chemical preparations was most effective in reducing the causes of rot, especially on the ‘San Andreas’ cultivar. The ‘Murano’ variety, during the whole experimental period, had the worst health among the cultivars tested, this applied to both the plants themselves and the fruit. It is a cultivar that is less resistant to adverse weather conditions, especially high air temperatures and humidity. The effectiveness of the preparations differed depending on the growing season and the associated conditions promoting or inhibitingthe development of fruit pathogens. During this study, among the chemical preparations used, agents from the strobilurin group were applied most often. These fungicides are registered for strawberry protection against most fungal pathogens and, at the same time, have a relatively short grace period, a feature important for frequent fruit harvests. In Meszka et al.’s [31] experiments, the effectiveness of these fungicides in strawberry protection was the highest, but too frequent use of these fungicides leads to lower effectiveness with each year of application. In addition, it is necessary to ensure proper fertilization of macro and micronutrients, especially calcium ions, who deficiency can cause damage to the fruit or increase its susceptibility to infection by secondary pathogens [32]. The effectiveness of protection also depends on ensuring correct phytosanitary recommendations regarding, among other things, the substrate, which can be a source of dangerous agrophages [33]. During this study, despite the annual replacement of mats, there were soil-borne pathogens, i.e., Phytophthora cactorum, but this was related to an incidental infestation of seedlings. This pathogen was brought into the plantation with a few seedlings that were infested in the nursery but did not show disease symptoms when they were planted into mats. Climate conditions during the growing season is a key factor in each fruit production [34,35] and this study found out that they were also important for the introduced beneficial microorganisms themselves. Protection with biological preparations can be supported by the mycorrhizae of plants or substrate, immediately during or after planting [36]. The effectiveness of biological preparations is closely related to the timing of application, so as to provide the correct conditions for the component microorganisms as well as sufficiently in advance of the development of pathogens against which they are intended to protect plants. This is due to their preventive effect on the protected plant.

4. Conclusions

The crop protection methods used had little effect on marketable yield and fruit weight. This depended on the variety of climatic conditions for a given growing season. In contrast, chemical and biological protection significantly reduced the size of the non-commercial yield, a relationship that differed from year to year and for each variety tested. Chemical protection effectively reduced the incidence of the most dangerous fruit pathogens on the studied strawberry varieties throughout the research period. The effectiveness of biological preparations depended on the climatic conditions prevailing in each year of this study, and the susceptibility of the variety to a given pathogen also influenced the effectiveness of biological protection. During laboratory tests of fruit quality, a significant influence of the method of plant protection on the studied quality properties of strawberries was found. However, this influence manifested itself in different ways, depending on the cultivar and the method of protection.

Author Contributions

Conceptualization, J.N., J.B. and G.P.Ł.; methodology, J.N. and J.B.; validation, J.N. and J.B.; formal analysis, J.N. and J.B.; resources, J.N. and J.B.; data curation, J.N. and J.B.; writing—original draft preparation, J.N. and J.B.; writing—review and editing, J.N. and G.P.Ł.; supervision, G.P.Ł.; project administration, J.N. All authors have read and agreed to the published version of the manuscript.

Funding

This research received no external funding.

Institutional Review Board Statement

Not applicable.

Informed Consent Statement

Informed consent was obtained from all subjects involved in the study.

Data Availability Statement

Not applicable.

Acknowledgments

Research funded under project no. RPMP.01. 02.01-12-0430/16 entitled: Development of an optimal, innovative model for growing remontant strawberry in modern gutter systems under covers on soilless substrate.

Conflicts of Interest

The authors declare no conflict of interest.

References

  1. Abu-Zahra, T.R. Effect of Cold Storage and Modified Atmosphere Packaging on Strawberry (Fragaria × ananassaDuch.) cv. ‘Arben’ Fruit Keeping Quality. Biosci. Biotechnol. Res. Asia 2017, 14, 1251–1258. [Google Scholar] [CrossRef]
  2. Forney, F.C.; Kalt, W.; Jordan, M.A. The Composition of Strawberry Aroma is Influenced by Cultivar, Maturity, and Storage. HortScience. 2000, 35, 1022–1026. [Google Scholar] [CrossRef] [Green Version]
  3. Mishra, R.; Kar, A. Effect of Storage on the Physicochemical and Flavour Attributes of Two Cultivars of Strawberry Cultivated in Northern India. Sci. World J. 2014, 2, 794926. [Google Scholar] [CrossRef]
  4. Mazur, S.P.; Nes, A.; Wold, A.B.; Remberg, S.F.; Martinsen, B.K.; Aaby, K. Effects of ripeness and cultivar on chemical composition of strawberry (Fragaria × ananassa Duch.) fruits and their suitability for jam production as a stable product at different storage temperatures. Food Chem. 2014, 146, 412–422. [Google Scholar] [CrossRef]
  5. Domínguez, P.; Medina, J.J.; Miranda, L.; López-Aranda, J.M.; Ariza, M.T.; Soria, C.; Bielinski, M.S.; Torres-Quezada, E.A.; Hernández-Ochoa, I. Effect of Planting and Harvesting Dates on Strawberry Fruit Quality under High Tunnels. Int. J. Fruit Sci. 2016, 16, 228–238. [Google Scholar] [CrossRef]
  6. Whitaker, V.M.; Hasing, T.; Chandler, C.K.; Plotto, A.; Baldwin, E. Historical Trends in Strawberry Fruit Quality Revealed by a Trial of University of Florida Cultivars and Advanced Selections. HortScience 2011, 46, 553–557. [Google Scholar] [CrossRef] [Green Version]
  7. Battino, M.; Beekwilder, J.; Denoyes-Rothan, B.; Laimer, M.; McDougall, G.J.; Mezzetti, B. Bioactive compounds in berries relevant to human health. Nutr. Rev. 2009, 67 (Suppl. S1), 145–150. [Google Scholar] [CrossRef] [PubMed]
  8. Sa Yang, D.; Xie, H.; Jiang, Y.; Wei, X. Phenolics from strawberry cv. Falandi and their antioxidant and α-glucosidase inhibitory activities. Food Chem. 2016, 194, 857–863. [Google Scholar] [CrossRef]
  9. Tournas, V.H.; Katsoudas, E. Mould and yeast flora in fresh berries, grapes and citrus fruits. Int. J. Food Microbiol. 2005, 23, 684–688. [Google Scholar] [CrossRef] [PubMed] [Green Version]
  10. Cordenunsi, B.R.; Genovese, M.I.; Nascimento, J.R.O.; Hassimotto, N.M.A.; Santos, R.J.; Lajolo, F.M. Effects of temperature on the chemical composition and antioxidant activity of three strawberry cultivars. Food Chem. 2005, 91, 113–121. [Google Scholar] [CrossRef]
  11. Timudo-Torevilla, O.E.; Everett, K.R.; Waipara, N.W.; Boyd-Wilson Weeds, K.S.H.; Langford, G.I.; Walters, M. Present Status of Strawberry Fruit Rot Diseases in New Zealand. N. Z. Plant Prot. 2005, 58, 74–79. [Google Scholar] [CrossRef] [Green Version]
  12. Walter, M.; Braithwaite, B.; Smith, B.J.; Langdorf, G.I. Nutrient Nitrogen Management for Disease Control in Strawberry. N. Z. Plant Prot. 2008, 61, 70–79. [Google Scholar] [CrossRef]
  13. Meszka, B.; Michalecka, M. Identification of Phytophthora spp. isolated from plants and soil samples on strawberry plantations in Poland. J. Plant Dis. Prot. 2016, 123, 29–36. [Google Scholar] [CrossRef] [Green Version]
  14. Palmer, M.G.; Holmes, G.J. Fungicide Sensitivity in Strawberry Powdery Mildew Caused by Podosphaera aphanis in California. Plant Dis. 2021, 105, 2601–2605. [Google Scholar] [CrossRef]
  15. Blanco, C.; de los Santos, B.; Barrau, C.; Arroyo, F.T.; Porras, M.; Romero, F. Relationship Among Concentration of Sphaerotheca macularis Conidia in the Air, Environmental Conditions, and the Incidence of Powdery Mildew in Strawberry. Plant Dis. 2004, 88, 878–881. [Google Scholar] [CrossRef] [Green Version]
  16. Cordova, L.G.; Amiri, A.; Peres, N.A. Effectiveness of fungicide treatments following the Strawberry Advisory System for control of Botrytis fruit rot in Florida. Crop Prot. 2017, 100, 163–167. [Google Scholar] [CrossRef]
  17. Camprubi, A.; Estaun, V.; El Bakali, M.A.; Garcia-Figueres, F.; Calvet, C. Alternative strawberry production using solarization, metham sodium and beneficial soil microbes as plant protection methods. Agron. Sustain. Dev. 2007, 27, 179–184. [Google Scholar] [CrossRef]
  18. Mouden, N.; Chiliyeh, M.; Benkirane, R.; Touhami, A.O.; Douira, A. Chemical Control of Some Strawberries Fungal Pathogens by Foliar Fungicides Under In Vitro and In Vivo Conditions. Int. J. Recent Sci. Res. 2016, 7, 9037–9051. [Google Scholar]
  19. El-Mougy, N.S.; El-Gamal, N.G.; Abdalla, M.A. The use of fungicide alternatives for controlling postharvest decay of strawberry and orange fruits. J. Plant Protect. Res. 2008, 48, 385–395. [Google Scholar] [CrossRef]
  20. Wszelaki, A.L.; Mitcham, E.J. Effect of superatmospheric oxygen on strawberry fruit quality and decay. Postharvest Biol. Technol. 2000, 20, 125–133. [Google Scholar] [CrossRef]
  21. Brischetto, C.; Bove, F.; Fedele, G.; Rossi, V. A Weather-Driven Model for Predicting Infections of Grapevines by Sporangia of Plasmopara viticola. Front. Plant Sci. 2021, 12, 636607. [Google Scholar] [CrossRef]
  22. Garrido, C.; Carbú, M.; Fernández-Acero, F.J.; González-Rodríguez, V.E.; Cantoral, J.M. New Insights in the Study of Strawberry Fungal Pathogens. Genes Genomes Genom. 2011, 5, 24–39. [Google Scholar]
  23. Jarmoliča, S.; Bankina, B. Powdery mildew of strawberries in Latvia under field conditions. Sodinink. Ir Daržininkyste. 2009, 28, 79–83. [Google Scholar]
  24. Siefkes-Boer, H.J.; Boyd-Wilson, K.S.H.; Petley, M.; Walter, M. Influence of cold-storage temperatures on strawberry leak caused by Rhizopus spp. N. Z. Plant Prot. 2009, 62, 243–249. [Google Scholar] [CrossRef]
  25. Nielsen, K.A.G.; Skårn, M.N.; Strømeng, G.M.; Brurberg, M.B.; Stensvand, A. Pervasive fungicide resistance in Botrytis cinerea from strawberry in Norway: Identification of the grey mould pathogen and mutations. Plant Pathol. 2022, 71, 1392–1403. [Google Scholar] [CrossRef]
  26. Piwowar, A. The use of pesticides in Polish agriculture after integrated pest management (IPM) implementation. Environ. Sci. Pollut. Res. 2021, 28, 26628–26642. [Google Scholar] [CrossRef]
  27. Alizadeh, H.R.; Sharifi-Tehrani, A.; Hedjaroude, G.A. Evaluation of the effects of chemical versus biological control on Botrytis cinerea agent of gray mould disease of strawberry. Commun. Agric. Appl. Biol. Sci. 2007, 72, 795–800. [Google Scholar]
  28. Kader, A.A. Fruit maturity, ripening, and quality relationships. Acta Hortic. 1999, 485, 203–208. [Google Scholar] [CrossRef]
  29. Nunes, M.C.N.; Brecht, J.C.; Morais, A.M.; Sargent, S.A. Physiochemical changes during strawberry development in the field compared with those that occur in harvested fruits during storage. J. Sci. Food Agric. 2006, 1, 180–190. [Google Scholar] [CrossRef]
  30. Błaszczyk, J.; Bieniasz, M.; Nawrocki, J.; Kopeć, M.; Mierzwa-Hersztek, M.; Gondek, K.; Zaleski, T.; Knaga, J.; Bogdał, S. The Effect of Harvest Date and Storage Conditions on the Quality of Remontant Strawberry Cultivars Grown in a Gutter System under Covers. Agriculture 2022, 12, 1193. [Google Scholar] [CrossRef]
  31. Meszka, B.; Labanowska, B.; Bielenin, A. Possibilities of strawberry complex protection against fungal diseases and two-spotted spider mite using strobilurin fungicides. Acta Hortic. 2009, 842, 367–370. [Google Scholar] [CrossRef]
  32. Bieniasz, M.; Malodobry, M.; Dziedzic, E. The effect of foliar fertilization with calcium on quality of strawberry cultivars ‘Luna’ and ‘Zanta’. Acta Hortic. 2012, 926, 457–461. [Google Scholar] [CrossRef]
  33. Wysocki, K.; Kopytowski, J.; Bieniek, A.; Bojarska, J. The effect of substrates on yield and quality of strawberry fruits cultivated in a heated foil tunnel. Zemdirb. Agric. 2017, 104, 283–286. [Google Scholar] [CrossRef] [Green Version]
  34. Rutkowski, K.; Łysiak, G.P. Weather Conditions, Orchard Age and Nitrogen Fertilization Influences Yield and Quality of ‘Łutówka’ Sour Cherry Fruit. Agriculture 2022, 12, 2008. [Google Scholar] [CrossRef]
  35. Łysiak, G.P.; Rutkowski, K.; Walkowiak-Tomczak, D. Effect of Storage Conditions on Storability and Antioxidant Potential of Pears cv. ‘Conference’. Agriculture 2021, 11, 545. [Google Scholar] [CrossRef]
  36. Mikiciuk, G.; Sas-Paszt, L.; Mikiciuk, M.; Derkowska, E.; Trzciński, P.; Głuszek, S.; Lisek, A.; Wera-Bryl, S.; Rudnicka, J. Mycorrhizal frequency, physiological parameters, and yield of strawberry plants inoculated with endomycorrhizal fungi and rhizosphere bacteria. Mycorrhiza 2019, 29, 489–501. [Google Scholar] [CrossRef]
Figure 1. Strawberry grown in technology in the described experiment.
Agriculture 12 02041 g001
Figure 2. Percentage of fruit infected by Botrytis cinerea among fruit waste at harvest [%]. Bars on which the same letter follows within a cultivar for each year are not significantly different at p ≤ 0.05.
Agriculture 12 02041 g002
Figure 3. Percentage of fruit infected by fungi of the genus Colletotrichum among fruit waste at harvest [%]. Bars on which the same letter follows within a cultivar for each year are not significantly different at p ≤ 0.05.
Agriculture 12 02041 g003
Figure 4. Percentage of fruit with symptoms of powdery mildew caused by Podosphaera macularis among fruit waste at harvest [%]. Bars on which the same letter follows within a cultivar for each year are not significantly different at p ≤ 0.05.
Agriculture 12 02041 g004
Figure 5. Percentage of fruit infected by Rhizopus and Mucor fungi among fruit waste at harvest [%]. Bars on which the same letter follows within a cultivar for each year are not significantly different at p ≤ 0.05.
Agriculture 12 02041 g005
Figure 6. Percentage of fruit infected by fungus-like organisms of the genus Phytophthora among fruit waste at harvest [%]. Bars on which the same letter follows within a cultivar for each year are not significantly different at p ≤ 0.05.
Agriculture 12 02041 g006
Table 1. Fruit yield of ‘San Andreas’ directly after harvest.
YearPlant ProtectionAverage Marketable Yield per Linear Meter of Coconut Mat [g]Average Non-Marketable Yieldfrom 1 Linear Meter [g]Average Weight of 100 Fruits
[g]
2018Chemical
Biological
Control
4108.6 ± 791.8 a
3699.5 ± 546.1 a
3601.9 ± 320.5 a
362.7 ± 36.9 a
520.7 ± 41.9 b
601.3 ± 54.6 b
1871.2 ± 32.6 a
1918.3 ± 55.4 a
1870.3 ± 33.1 a
2019Chemical
Biological
Control
3623.2 ± 487.0 a
3105.9 ± 306.1 a
3187.2 ± 85.2 a
177.1 ± 47.9 a
137.0 ± 31.2 a
217.2 ± 66.5 a
1558.3 ± 0.4 a
1522.6 ± 22.2 a
1573.1 ± 3.8 b
2020Chemical
Biological
Control
5237.3 ± 346.6 a
5147.3 ± 407.3 a
4709.3 ± 426.6 a
370.2 ± 24.5 a
381.7 ± 30.2 a
506.5 ± 0.44 b
1933.3 ± 161.7 a
2026.7 ± 265.6 a
1780.0 ± 225.4 a
Means followed by the same letter within a column, for each year, do not differsignificantly at p ≤ 0.05.
Table 2. Fruit yield of ‘Albion’ directly after harvest.
YearPlant ProtectionAverage Marketable Yield per Linear Meter of Coconut Mat [g]Average Non-Marketable Yield from 1 Linear Meter [g]Average Weight of 100 Fruits
[g]
2018Chemical
Biological
Control
3473.6 ± 814.5 a
3164.9 ± 733.4 a
2913.0 ± 460.7 a
617.7 ± 35.6 b
431.4 ± 0.27 a
540.3 ± 0.32 ab
1862.3 ± 59.4 b
1782.7 ± 26.3 ab
1715.6 ± 5.7 a
2019Chemical
Biological
Control
2443.2 ± 90.6 a
2695.5 ± 151.9 b
2227.3 ± 122.6 a
121.3 ± 19.2 a
172.2 ± 19.5 b
210.4 ± 22.2 b
1482.7 ± 0.9 b
1417.4 ± 41.0 a
1409.7 ± 0.1 a
2020Chemical
Biological
Control
3623.2 ± 14.2 b
3164.6 ± 204.7 a
3048.6 ± 55.3 a
280.6 ± 1.1 a
336.7 ± 21.8 b
368.2 ± 6.7 c
1873.3 ± 110.2 a
1700.0 ± 433.1 a
1846.7 ± 161.7 a
Means followed by the same letter within a column, for each year, do not differsignificantly at p ≤ 0.05.
Table 3. Fruit yield of ‘Murano’ directly after harvest.
YearPlant ProtectionAverage Marketable Yield per Linear Meter of Coconut Mat [g]Average Non-Marketable Yieldfrom 1 Linear Meter [g]Average Weight of 100 Fruits
[g]
2018Chemical
Biological
Control
3015.9 ± 144.2 b
2417.9 ± 318.7 a
2626.7 ± 304.9 ab
765.4 ± 136.1 a
785.1 ± 207.7 a
1016.9 ± 120.9 a
1552.6 ± 112.6 a
1519.6 ± 38.1 a
1442.5 ± 97.4 a
2019Chemical
Biological
Control
3125.7 ± 277.6 a
2694.0 ± 542.3 a
2261.3 ± 467.2 a
346.6 ± 50.2 a
326.6 ± 50.3 a
367.2 ± 17.8 a
1241.6 ± 63.0 a
1177.3 ± 46.1 a
1129.3 ± 70.4 a
2020Chemical
Biological
Control
3190.3 ± 815.3 a
3054.4 ± 897.0 a
2269.3 ± 658.1 a
511.3 ± 130.7 a
495.3 ± 145.4 a
637.9 ± 222.6 a
1426.7 ± 194.3 a
1340.0 ± 64.3 a
1393.3 ± 250.1 a
Means followed by the same letter within a column, for each year, do not differsignificantly at p ≤ 0.05.
Table 4. Fruit quality of ‘San Andreas’ strawberry directly after harvest, average for harvest dates.
YearPlant ProtectionFruit Firmness
[N]
Soluble Solids Content [%]Total Acidity
[% Citric Acid]
Ratio SSC/TARespiration Rate
[mg CO2 kg−1·h−1]
2018Chemical
Biological
Control
4.2 ± 0.12 b
4.3 ± 0.20 b
3.7 ± 0.28 a
8.3 ± 0.38 a
8.1 ± 0.27 a
8.1 ± 0.32 a
0.89 ± 0.08 c
0.77 ± 0.04 a
0.82 ± 0.03 b
9.7 ± 0.96 a
10.5 ± 0.87 b
10.0 ± 0.58 ab
61.6 ± 11.86 a
77.1 ± 16.32 b
64.7 ± 18.09 ab
2019Chemical
Biological
Control
3.9 ± 0.24 b
3.8 ± 0.26 b
3.6 ± 0.30 a
8.3 ± 0.26 a
8.9 ± 0.42 b
8.9 ± 0.38 b
0.91 ± 0.06 a
0.93 ± 0.02 a
0.94 ± 0.05 a
9.3 ± 0.75 a
9.8 ± 0.66 b
9.7 ± 0.80 ab
61.7 ± 15.95 b
49.1 ± 13.47 a
77.5 ± 16,88 c
2020Chemical
Biological
Control
3.8 ± 0.35 b
3.6 ± 0.22 a
3.5 ± 0.18 a
8.7 ± 0.38 b
8.0 ± 0.30 a
8.3 ± 0.44 ab
0.88 ± 0.05 a
0.90 ± 0.09 ab
0.92 ± 0.07 b
9.9 ± 0.34 b
9.0 ± 0.47 a
9.3 ± 0.63 a
47.9 ± 18.74 a
48.2 ± 16.24 a
68.3 ± 20.12 b
Means followed by the same letter within a column, for each year, do not differsignificantly at p ≤ 0.05.
Table 5. Fruit quality of ‘Albion’ strawberry directly after harvest, average for harvest dates.
YearPlant ProtectionFruit Firmness
[N]
Soluble Solids Content [%]Total Acidity
[% Citric Acid]
Ratio SSC/TARespiration Rate
[mg CO2 kg−1·h−1]
2018Chemical
Biological
Control
3.6 ± 0.28 a
3.6 ± 0.32 a
3.5 ± 0.25 a
9.8 ± 0.36 b
9.3 ± 0.33 a
9.6 ± 0.41 b
0.91 ± 0.03 b
0.85 ± 0.02 a
0.93 ± 0.04 b
11.3 ± 0.64 a
10.9 ± 0.56 a
11.2 ± 0.60 a
34.9 ± 12.18 a
64.7 ± 20.06 b
71.9 ± 17.84 c
2019Chemical
Biological
Control
4.1 ± 0.22 b
3.8 ± 0.18 a
3.9 ± 0.30 a
9.6 ± 0.34 a
9.9 ± 0.27 b
9.5 ± 0.20 a
0.93 ± 0.05 a
0.92 ± 0.06 a
0.92 ± 0.06 a
10.6 ± 0.72 a
11.1 ± 0.38 a
10.7 ± 0.54 a
54.0 ± 20.04 b
49.6 ± 18.94 a
76.4 ± 24.01 c
2020Chemical
Biological
Control
4.4 ± 0.44 b
3.8 ± 0.22 a
3.9 ± 0.24 a
9.3 ± 0.38 b
9.1 ± 0.42 ab
8.9 ± 0.32 a
0.89 ± 0.04 b
0.84 ± 0.07 a
0.86 ± 0.02 ab
10.9 ± 0.72 a
10.8 ± 0.66 a
10.4 ± 0.78 a
44,9 ± 24.26 a
47.5 ± 28.45 a
47.1 ± 16.75 a
Means followed by the same letter within a column, for each year, do not differsignificantly at p ≤ 0.05.
Table 6. Fruit quality of ‘Murano’ strawberry directly after harvest, average for harvest dates.
YearPlant ProtectionFruit Firmness
[N]
Soluble Solids Content [%]Total Acidity
[% Citric Acid]
Ratio SSC/TARespiration Rate
[mg CO2 kg−1·h−1]
2018Chemical
Biological
Control
4.2 ± 0.32 b
4.3 ± 0.28 b
3.7 ± 0.16 a
9.5 ± 0.65 a
9.3 ± 0.50 a
9.7 ± 0.24 a
0.70 ± 0.04 a
0.70 ± 0.02 a
0.72 ± 0.04 a
13.8 ± 0.86 a
13.3 ± 0.73 a
13.6 ± 0.78 a
59.3 ± 14.86 b
41.9 ± 17.22 a
70.7 ± 26.18 c
2019Chemical
Biological
Control
3.9 ± 0.10 c
3.5 ± 0.52 b
3.1 ± 0.34 a
9.5 ± 0.48 a
9.8 ± 0.62 b
9.4 ± 0.70 a
0.86 ± 0.03 a
0.99 ± 0.05 b
0.86 ± 0.02 a
11.3 ± 0.66 a
10.8 ± 0.74 a
11.3 ± 0.58 a
63.3 ± 19.88 a
69.7 ± 15.76 b
68.4 ± 12.73 b
2020Chemical
Biological
Control
4.7 ± 0.48 c
4.4 ± 0.42 b
4.1 ± 0.26 a
9.7 ± 0.38 a
10.2 ± 0.60 b
10.3 ± 0.54 b
0.75 ± 0.06 a
0.80 ± 0.02 b
0.75 ± 0 03 a
13.2 ± 0.84 b
12.7 ± 0.88 a
13.6 ± 0.91 b
26.4 ± 10.67 a
44.9 ± 18.28 b
52.1 ± 14.63 c
Means followed by the same letter within a column, for each year, do not differsignificantly at p ≤0.05.
Publisher’s Note: MDPI stays neutral with regard to jurisdictional claims in published maps and institutional affiliations.

