Article

1H NMR Reveals Dynamic Changes of Primary Metabolites in Purple Passion Fruit (Passiflora edulis Sims) Juice during Maturation and Ripening

1
Department of Crop Science, Faculty of Agriculture, Universiti Putra Malaysia, Serdang 43400, Malaysia
2
Department of Food Science, Faculty of Food Science and Technology, Universiti Putra Malaysia, Serdang 43400, Malaysia
3
Institute of Systems Biology (INBIOSIS), Universiti Kebangsaan Malaysia, Bangi 43600, Malaysia
*
Author to whom correspondence should be addressed.
Agriculture 2022, 12(2), 156; https://doi.org/10.3390/agriculture12020156
Submission received: 11 December 2021 / Revised: 16 January 2022 / Accepted: 18 January 2022 / Published: 22 January 2022
(This article belongs to the Section Crop Production)

Abstract

:
Passion fruit (Passiflora edulis Sims) is a tropical fruit that shows an increasing demand from global fresh fruit industries. The fruit is known to have climacteric properties that allow it to achieve ripening during distribution and transportation. However, the metabolic alterations that occur during ripening are poorly understood. Thus, this study was conducted to analyze the metabolites in passion fruit juice at different harvesting stages (35, 42, 49, 56 and 63 days after anthesis), employing 1H NMR spectroscopy combined with chemometric analysis. A total of 30 metabolites were successfully identified using 1H NMR, the majority of which belong to primary metabolites, consisting of 14 amino acids, 7 sugars and 6 organic acids. Nevertheless, only three secondary metabolites were detected. Analyzing the metabolites using multivariate analysis reveals 13 of the metabolites were highly influential metabolites. These primary metabolites play essential roles in the maturation and ripening of fruit. Glycolysis, the tricarboxylic acid (TCA) cycle and the shikimate pathway were differentially regulated during maturation and ripening of passion fruit. Profiling the metabolome of fruit during maturation and ripening reveals that all metabolites are interconnected with each other to cause maturation and ripening in passion fruit. This work will enhance the knowledge of physiological changes in purple passion fruit during maturation and ripening.

1. Introduction

Passion fruit is a modified berry fruit evolved from a single ovary flower [1]. All fruits undergo three distinct stages of development before senescence, including fruit set, growth and maturation, and ripening. Fruit ripening is genetically programmed, involving physiological, physicochemical, molecular, and cellular changes. Maturation and ripening stages are critical in determining the quality and shelf-life of a fruit [2]. Tackling the climacteric features of a fruit shall benefit the industry as it allows early harvested of the fruit [3]. Furthermore, climacteric fruit is suitable for long-distance marketing since it can ripen during transportation and distribution, extending the fresh fruit market window [4].
Metabolomics is a research technique that involves a comprehensive analysis of the whole metabolome under given conditions [5]. This technique allows in-depth understanding of an organism’s biochemical and metabolic composition, bridging the gap between genotype and phenotype [6,7]. Thus, investigating the fruit metabolites underlying fruit maturation and ripening can deepen the understanding of fruit physiology. This knowledge is essential because it can be employed to manipulate fruit quality and postharvest life. Proton nuclear magnetic resonance (1H NMR) is a tool that can simultaneously measure all proton-containing metabolites [8]. Due to its technical simplicity, 1H NMR becomes one of the most commonly used methods for metabolic detection in plant science studies as it is able to screen complex plant matrices. The fingerprint can be linked to the spectrum of various plant metabolites including sugar, organic acid and amino acid [6,7]. The 1H NMR is the most suitable platform for its rapid analysis which can provide highly reproducible data while requiring the least sample preparation. The 1H NMR was previously applied to assess and compare juices of conventional and organic grown pomegranate [9]. In addition, it was applied to monitor the metabolic changes during the fermentation process of dragon fruit juice [10]. The use of 1D NMR to identify the major plant’s metabolome relying on Chenomx and other databases is useful in generating valuable information [10,11].
In addition, combining both 1H NMR and chemometric analysis has successfully revealed metabolic variation during the developmental process of plants. For example, 1H NMR-based metabolomics was used to study the nutritional property of a new hybrid tomato (Lycopersicon esculentum) that was first cultivated in the Lazio region (Central Italy) [12], predicting the maturity stage of berries (Rubus coreanus Miquel) [13], estimating the bioactivity of herbs (Phyllanthus niruri) during development [5], and evaluating the efficiency of hydro-cooling treatment in extending the shelf-life of rock melon (Cucumis melo L. reticulatus cv. Glamour) [11].
To our knowledge, no study has been undertaken to examine the metabolomics alterations in passion fruit juice during maturation and ripening. Thus, the current study was conducted to understand the metabolic changes of passion fruit juice as maturity and ripening progressed. The responsible metabolites for maturation and ripening were further elucidated by using multivariate analysis. This is the first report on the metabolite alterations in passion fruit juice using 1H NMR coupled with chemometrics analysis.

2. Materials and Methods

2.1. Solvents and Chemicals

Methanol d4-(CD3OD, 99.8%) (Cambridge Isotope, Cambridge, MA, USA), 3-(trimethylsilyl) propionic-2,2,3,3-d4 acid sodium salt (TSP; 99.9%) and deuterium oxide (D2O) 99.8%, were purchased from Sigma Aldrich (St. Louis, MO, USA). The NMR tubes were obtained from Thermo Fisher Scientific (Waltham, MA, USA).

2.2. Fruit Harvesting Stage and Experimental Design

For this study, 20 passion fruits were cultivated at Farm 10, Universiti Putra Malaysia, following the commercial agricultural practice [14]. The fruits were harvested at five different harvesting stages calculated from their first day after flower anthesis (DAA). As studied previously by Shahidah and Ding (2021) [15], the passion fruit cultivated in Malaysia took 63 days to complete its full development. Thus, fruits were harvested starting from 35 to 63 DAA with 7 days interval. The phenotypic appearance of harvested fruit was as follows: 35 DAA; green, 42 DAA; green-yellowish, 49 DAA; yellowish with purple patches, 56 DAA; 75% purple color, and 63 DAA; 100% purple color (Figure 1). Six biological replicates were prepared from 36 individual harvested fruits (six random fruits were pooled to represent one biological replicate). Each harvesting stage consisted of six biological replicates. In total, 180 fruits were used in this study.
After cutting transversely, the pulp of the fruit was scooped manually using a stainless-steel spatula. The pulp was squeezed manually utilizing a spatula and separated through a 0.63-mm pore sieve size to separate seeds and juice. Juice was quenched immediately with liquid nitrogen before being lyophilized in a freeze drier (Labconco, Kansas State City, MO, USA) until a constant weight was obtained.

2.3. Preparation of 1H NMR Extraction

The procedure for the 1H NMR extraction of the metabolite was adopted from Zainal et al. (2019) [11]. The lyophilized juice samples were transferred to a 2-mL Eppendorf tube. The samples were then extracted with 375 μL methanol-d4 (CD3OD; 99.8%; Cambridge Isotope Laboratories) and the same volume of 1 M KH2PO4 buffer in D2O (pH 6.0, 99.9%; Sigma Aldrich), containing 0.1% sodium trimethylsilyl propionate (TSP). The mixture was vortexed for 1 min followed by 30 min ultrasonication at room temperature (25 °C) before being centrifuged at 13,350 rpm for 20 min. After that, 600 μL of supernatant was transferred to a labelled NMR tube and subjected to 1H NMR measurements (Figure 1).

2.4. 1H NMR Spectroscopy Measurement

The 1H NMR spectra were recorded using 500 MHz INOVA NMR spectrometer (Varian Inc., Palo Alto, CA, USA), functioning at 25 °C with frequency 499.887 MHz. The measurement was conducted using pre-saturation (PRESAT) setting for all the samples. The TSP was used as an internal standard for chemical shift reference and intensity scaling of all NMR signals. The 1H NMR spectra were obtained using 64 scans, 3.53 min of acquisition time, pulse width of 3.75 μs, and relaxation delay of 1.0 s. The spectral width was adjusted to 20 ppm [16].

2.5. 1H NMR Spectra Multivariate Statistical Analysis

All raw 1H NMR spectra were manually phased, baseline corrected and referenced to the internal standard TSP at 0.00 ppm using Chenomx (Chenomx NMR Suite 5.1 Professional, Edmonton, AB, Canada). Bucketing the 1H NMR spectra was performed automatically into ASCII files by Chenomx software (Chenomx Inc., Edmonton, AB, Canada). The chemical shift was binned to 0.04 ppm width, forming a region of 0.0–14.0 ppm to give 270 integrated regions of the 1H NMR spectrum. The regions δ 4.82–5.06 and δ 3.26–3.34 were excluded, which corresponded to the residual signals of water and methanol, respectively. The binned data obtained from Chenomx were exported to SMICA-P (version 13, Umetrics AB, Umea, Sweden). The data were mean-centered and Pareto scaled prior to principal component analysis (PCA). The PCA as an unsupervised method was first conducted to check the separation without prior classification and detect outliers. Then, partial least square discriminant analysis (PLS-DA) was used to cluster the metabolites according to the maturity and ripening stages. Internal cross validation of the model was done by reflecting to total variance (R2) and cross-validating predictive ability (Q2) values. If the values of total variance (R2) exceed 0.5 and are higher than the cross-validate predictive ability (Q2) values, the model is considered valid [17]. Permutation testing (20 times simulation) was also conducted as external validation. The permutation test was done to provide statistical significance of estimated predicted power of PLS-DA model by comparing R2Y and Q2Y values of the original model with the re-ordered model using Y data that has been permutated randomly. It is known that the R2Y intercept is below 0.3–0.4 and that the Q2Y intercept is less than 0.05, indicating that the PLS-DA model is valid [18,19]. Variable importance in the projection (VIP) is a sum of squares of the PLS-DA weight, both with respect to Y as the correlation with all the responses and X as its projection, picking components that play important roles in the PLS-DA separation. The highly responsible metabolites that contribute to clustering were derived using VIP obtained by PLS-DA analysis. Generally, the cut off value around 0.7–0.8 works well [20]. The metabolites that obtained values over 0.7 were considered highly influenced metabolites [13]. After selecting the highly influenced metabolites, the concentration of metabolites was quantified by relative intensity (RI) based on the peak area reflected to the internal standard of TSP. Significant differences in individual metabolite levels were detected by one-way analysis of variance (ANOVA) using statistical analysis system (SAS Institute, Cary, NC, USA) [21].

2.6. Construction of Metabolic Pathway

The metabolic pathways of juice were manually constructed using the information from the KyotoEncyclopaedia of Genes and Genome (KEGG), available online: http://www.genome.jp/kegg/ (accessed on 10 December 2021) and SolCycwebsite, available online: http://solcyc.solgenomics.net/ (accessed on 10 December 2021) as reference to Solanum lycopersicum (LycoCyc). Data were also cross validated with several reviews and research articles (Mamat et al., 2020; Mazlan et al., 2018). Heatmap was applied to represent the juice metabolites at each developmental stage using GraphPad Prism version 6.07 (GraphPad Software Inc., San Diego, CA, USA). After that, the heatmap was inserted into the metabolic pathways [22].

3. Results

3.1. Metabolic Assignments for Passion Fruit Juice

In this study, metabolites of juice (Figure 2) were identified based on a peak fitting routine with Chenomx database (Version 8.1, Edmonton, AB, Canada) and data from previous literature. Amino acids corresponding to aliphatic amino acids, such as leucine, valine, methionine, and threonine were observed at the amino acids’ region between 0.50 to 3.00 ppm, while aromatic amino acids such as phenylalanine were assigned at 7.32 and 7.36–7.38 ppm (Figure 2, Table 1). Organic acids including malic acid (2.50 and 3.00 ppm), citric acid (2.72 ppm), tartaric acid (4.38 ppm) and shikimic acid (2.80 ppm) were also identified in this study. A total of 30 metabolites were identified, with the majority belonging to primary metabolites, including 14 amino acids, 7 sugars and 6 organic acids. Three secondary metabolites were also present in the juice (Table 1).

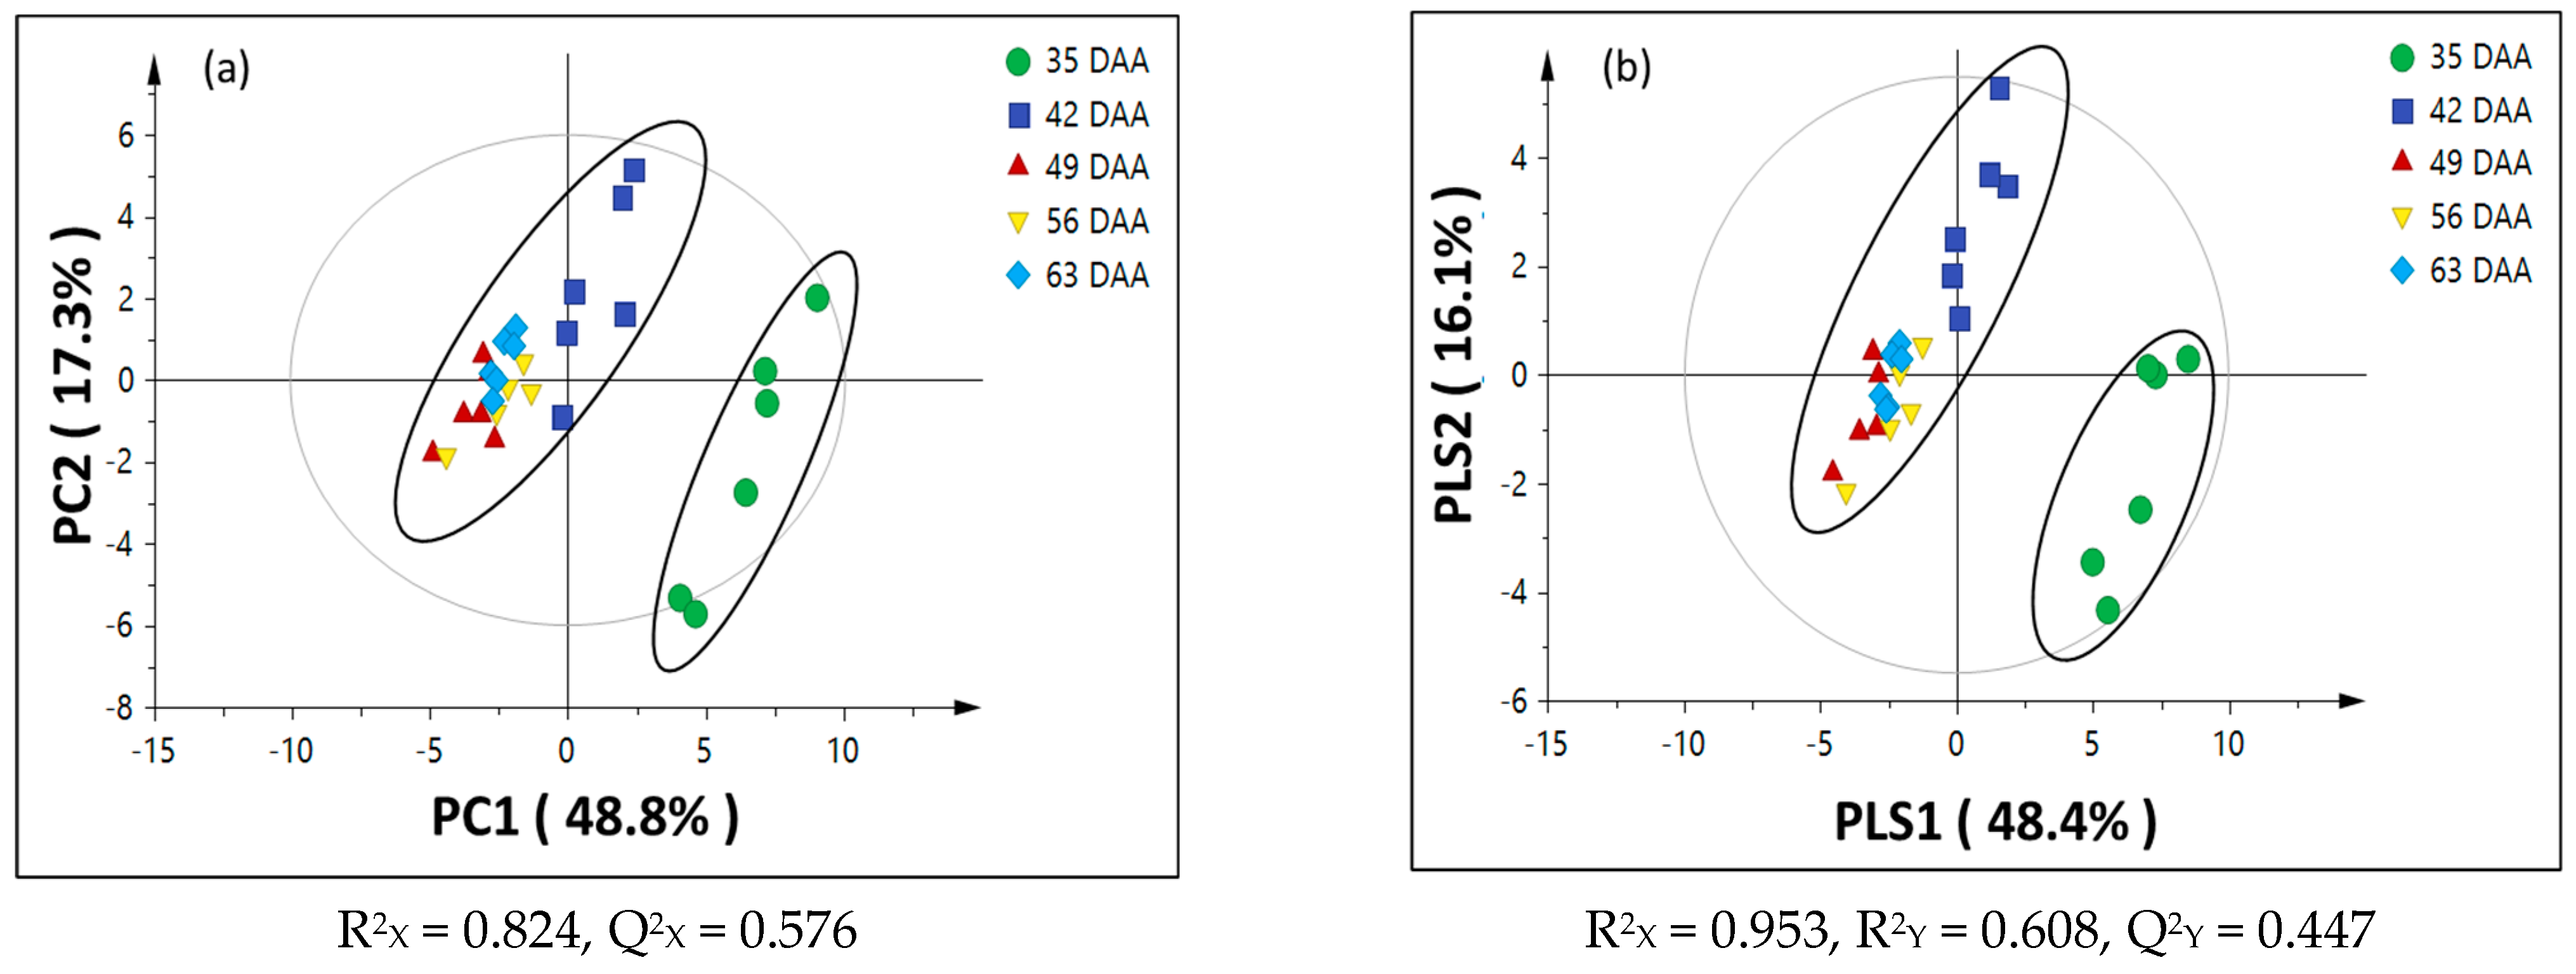
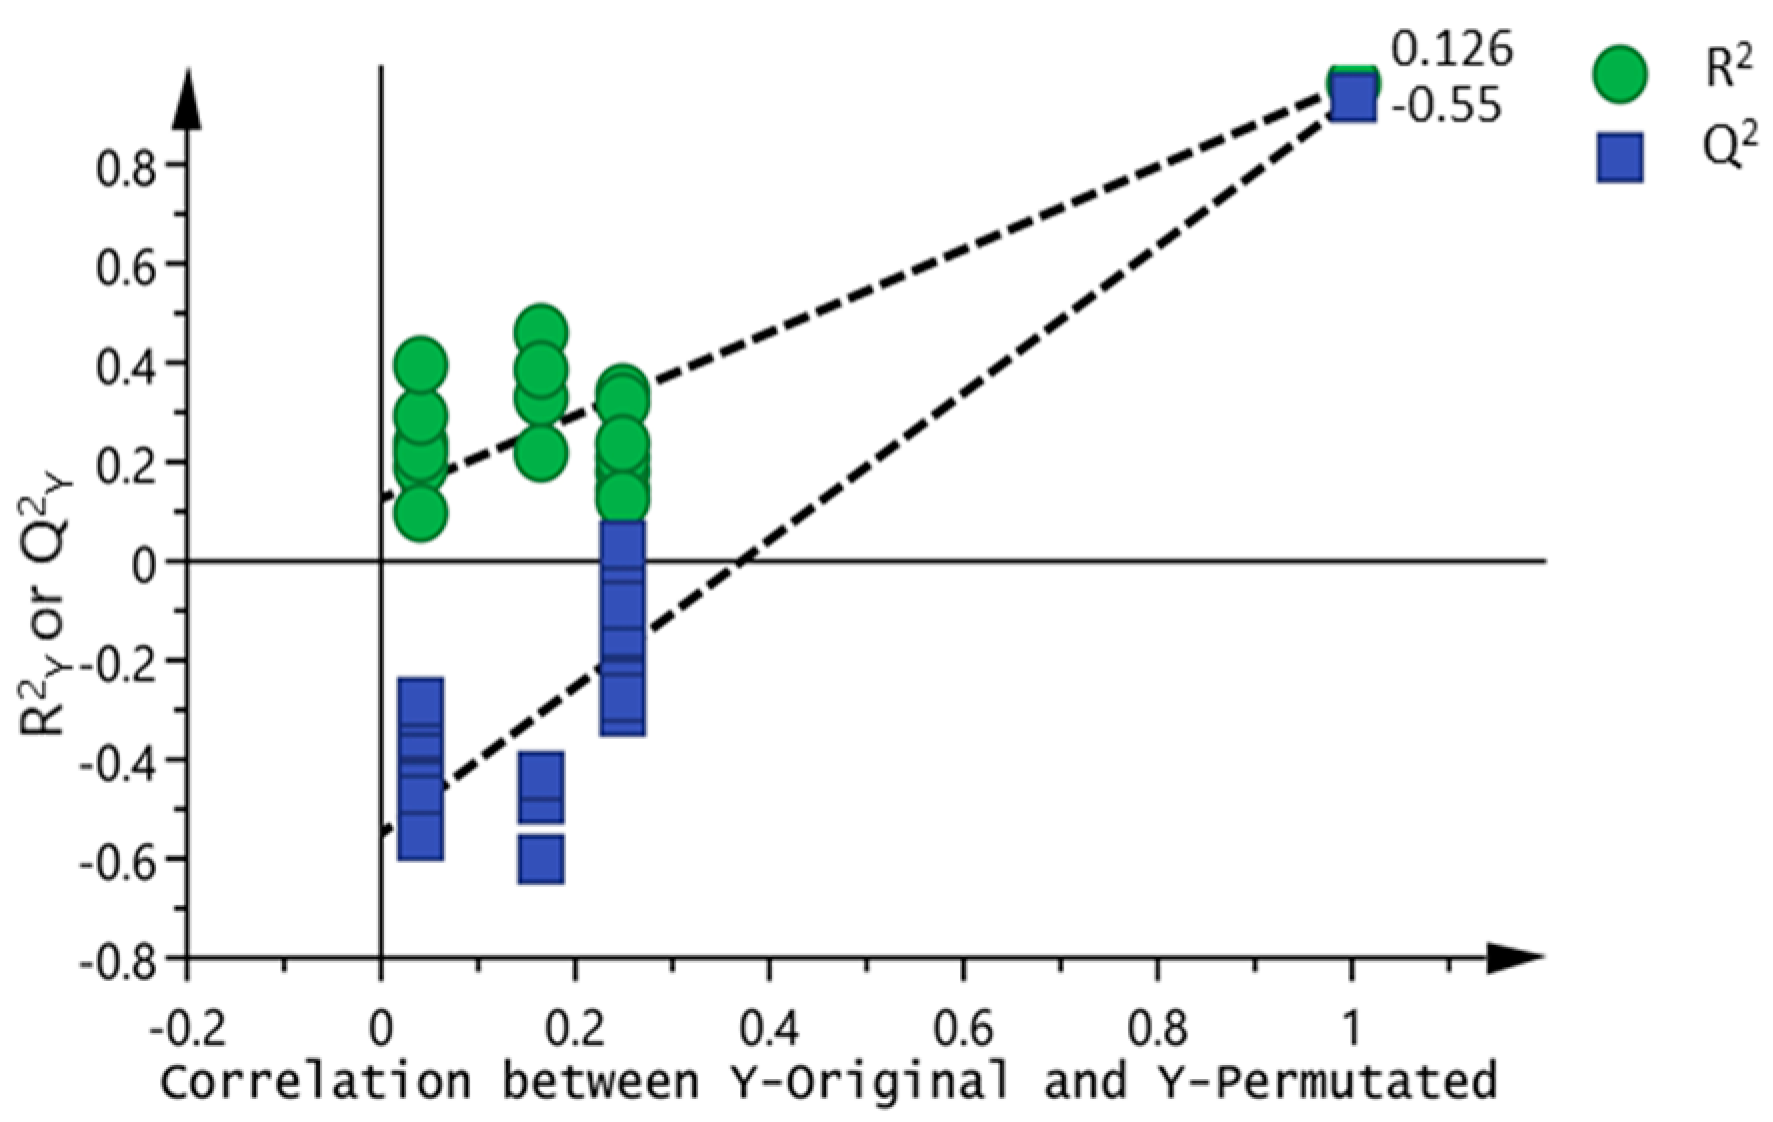
3.2. Chemometric Analysis of Passion Fruit Metabolite Data

A total of 30 samples composed of six biological replicates from each DAA were analyzed in the chemometric analysis. In this study, unsupervised PCA was used to visualize the distribution of metabolites. The PCA analysis separated passion fruit juice into two main clusters (Figure 3a). The juice sample from 35 DAA formed a distinct cluster with the rest of the DAAs as explained by 48.8% variance at principal component 1 (PC1). Meanwhile, principal component 2 (PC2) shows a variation of 17.73%. Then, a supervised Partial least square discriminant analysis PLS-DA was conducted further to evaluate differences among metabolites at different maturity stages. The PLS-DA analysis possesses similar variance with PCA in which the value of 48.4% for partial least squares-discriminant 1 (PLS1) and 16.1% for partial least squares-discriminant 2 (PLS2) (Figure 3b). The goodness of fit of PCA and PLS-DA was presented by the value of total variance (R2) and cross-validated predictive ability (Q2) value. Internal cross-validation relying upon R2 and Q2 values showed all the models were free of overfitting to explain the difference in maturity and ripening stages of juice as R2 value > 0.5 and presented greater than Q2 value.
Then, a loading plot of PLS-DA was conducted to identify the specific metabolites that responsible for separating the maturity stages in the score plot. The loading column plot of PLS-DA marked on the positive side indicates significant metabolites in the juice that segregates 35 DAA with the rest of DAAs observed in the score plot of PLS-DA (Figure 3b). Twenty metabolites, mainly belonging to amino acids, were responsible for making the 35 DAA (Figure 4a) highly distinct from the rest of the maturity and ripening stages (Figure 3b). Weak metabolite separation at both positive and negative loading columns of PLS2 (Figure 4b) explains the overlapping between all the DAAs that occur in the PLS-DA score plot (Figure 3b).
Permutation tests were conducted to further validate the PLS-DA model. The random permutation tests (20 times) on the PLS-DA model confirmed the validation of the model that can be suitable to determine the separation of metabolites in juice at different maturation and ripening stages. The juice sample has a PLS-DA model with R2 intercepts at 0.126 and Q2 intercept at −0.55 (Figure 5).

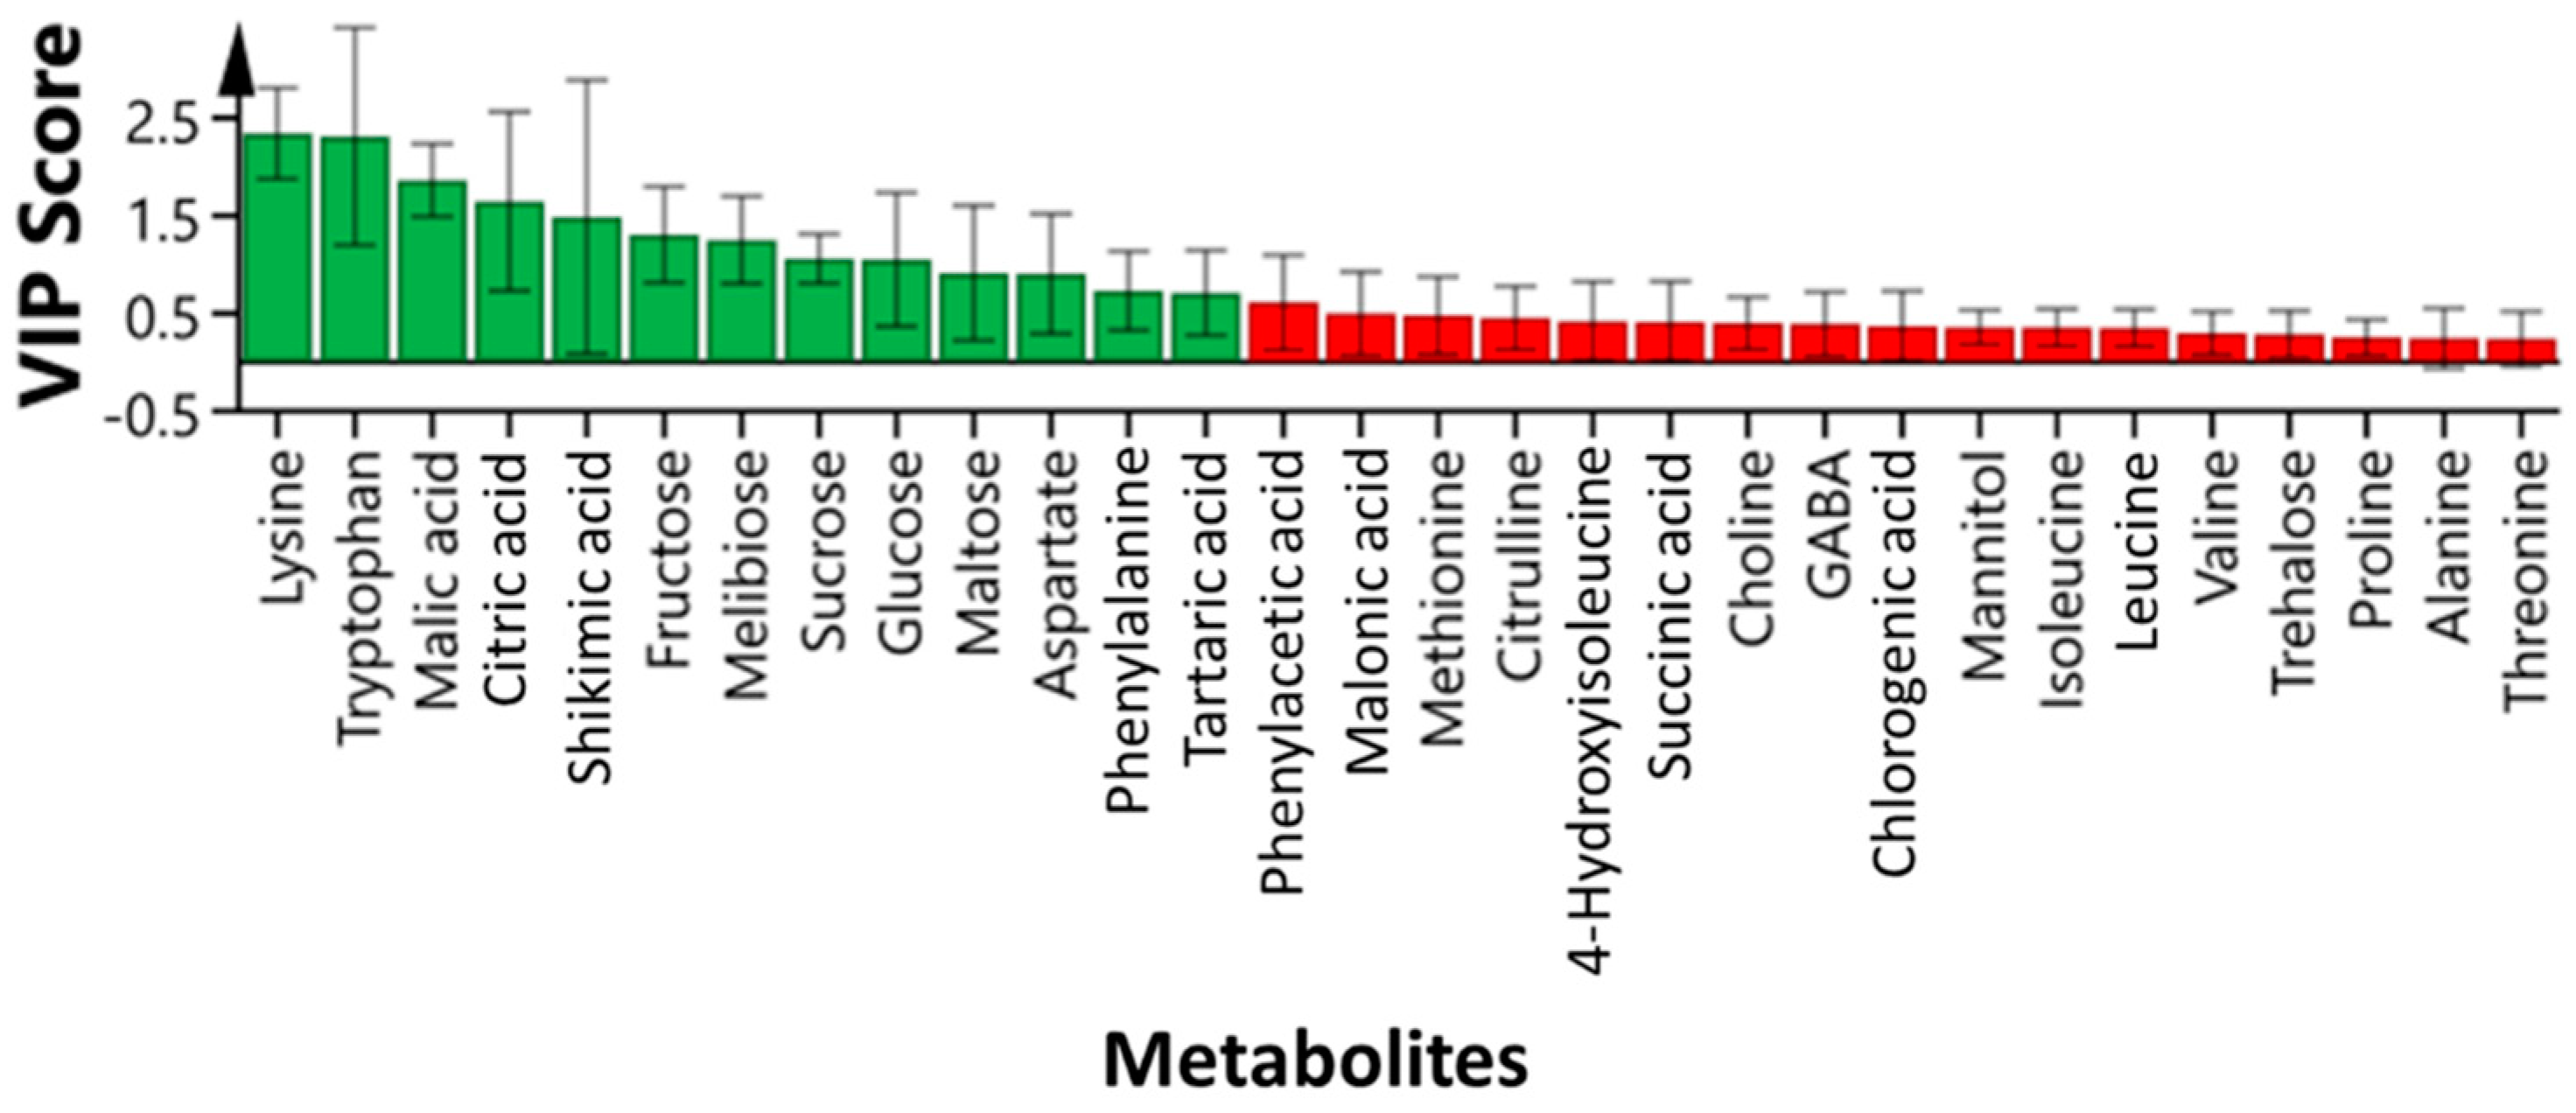
3.3. Identification of Highly Influenced Primary Metabolites in Passion Fruit Using 1H NMR

The PLS-DA model in this study enables us to identify and discriminate specific highly influential metabolites using the values of variable importance in the projection (VIP). There were 13 metabolites in juice (Figure 6), which have VIP value ≥ 0.7 with the highest VIP score around 2.34 (Supplementary Material).

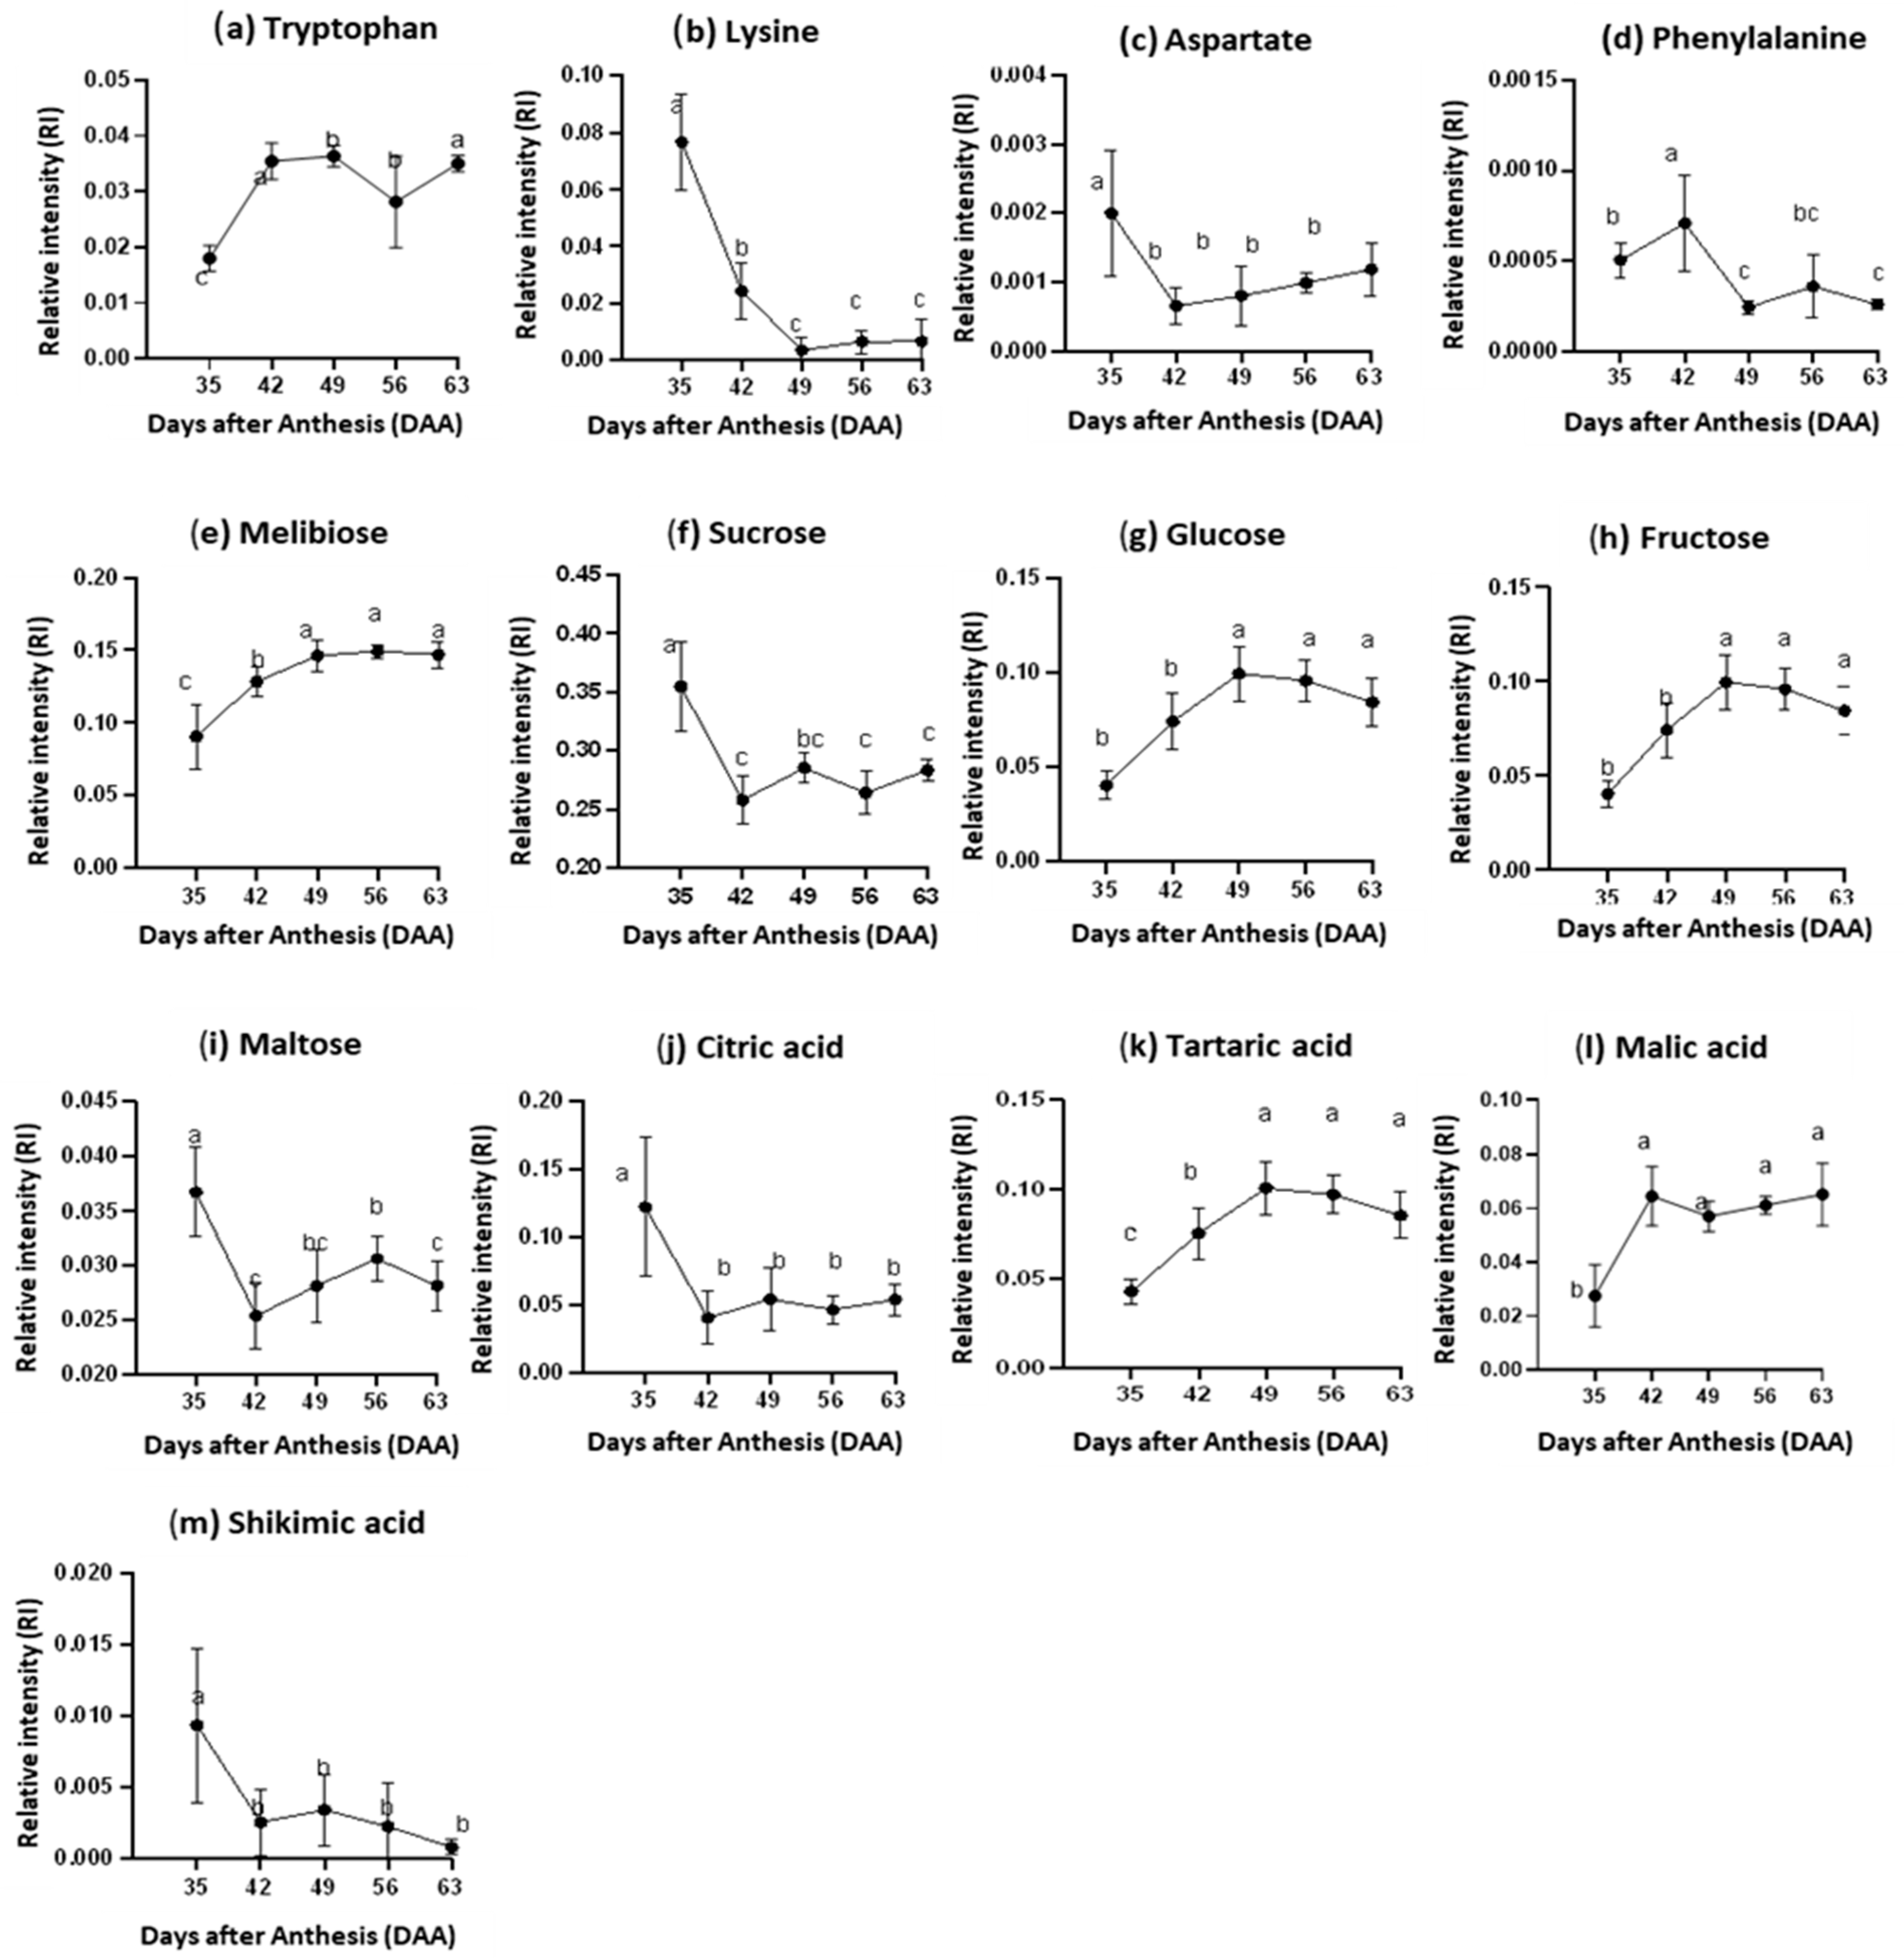
3.4. Changes of Highly Influential Metabolites in Juice

In the 1H NMR data of purple passion fruit juice, the PLS-DA analysis reveals 13 metabolites with VIP ≥ 0.7 (Figure 6). All of the highly influential metabolites belong to primary metabolites that consist of four amino acids, five sugars and four organic acids (Figure 7). The levels of metabolites varied at p ≤ 0.05 depending on the ripening stages. The concentration of amino acids (tryptophan and lysine) in fruit juice were relatively low, with an RI ranging from 0.004 to 0.079 (Figure 7a,b). Simple sugars, such as sucrose, glucose and fructose, were denoted as dominant metabolites as they presented in high RI that ranged from 0.04 to 0.35 (Figure 7f–h). Nevertheless, maltose presented in low RI (0.025–0.038) (Figure 7i) and was denoted as minor sugar in the juice. Organic acids such as citric acid, tartaric acid and malic acid were present in higher RI that ranged from 0.025 to 0.13 and were denoted as dominant organic acids (Figure 7i–k), while shikimic acid was denoted as a minor organic acid due to a low RI value that ranged from 0.01 to 0.003 (Figure 7m).

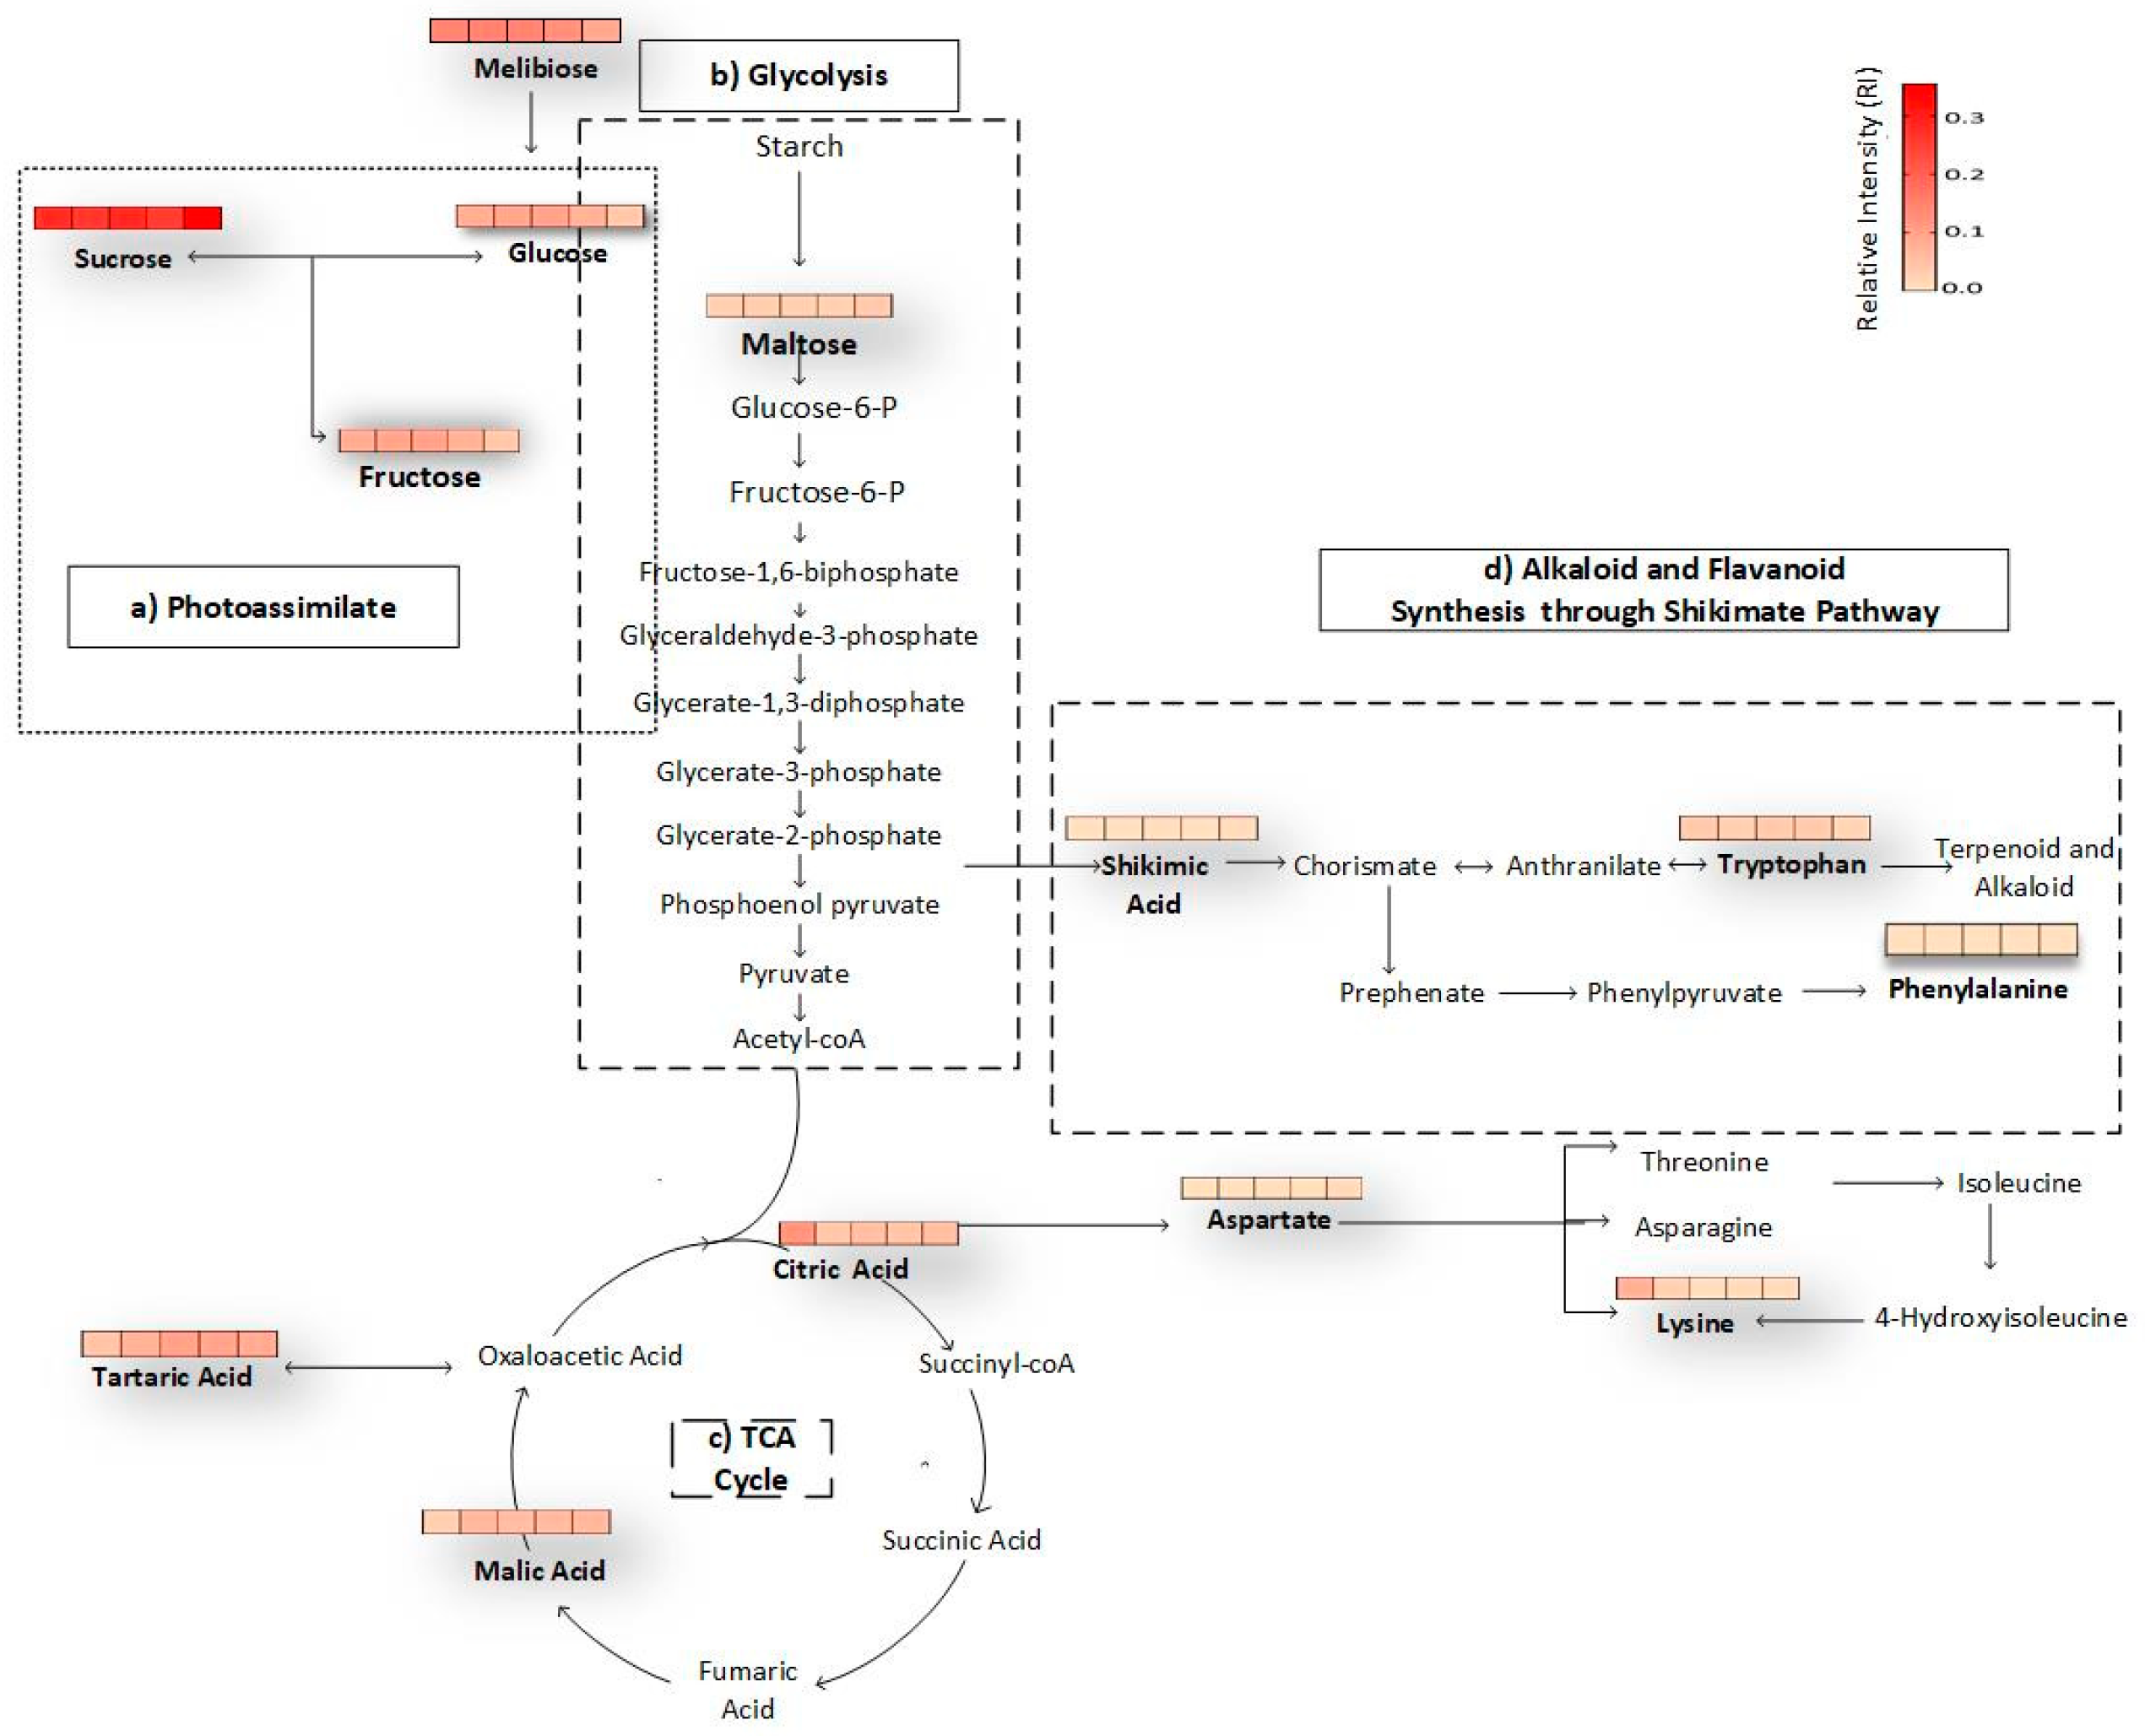
3.5. Biochemical Pathways of Passion Fruit during Maturation and Ripening Process

The highly influential metabolites selected from VIP values were used to sketch metabolic pathways during maturation and ripening of passion fruit (Figure 8). Sugars composed of glucose, sucrose and fructose are identified as photoassimilate products (Figure 8a). Glycolysis (Figure 8b) and TCA cycle (Figure 8c) were responsible for the modification of sugar, organic acid, and amino acid precursors in the juice. Synthesis of aromatic amino acids such as tryptophan and phenylalanine may be related to the shikimate pathway (Figure 8d).

4. Discussion

This study reveals four amino acids (tryptophan, lysine, aspartate and phenylalanine) (Figure 7a–d), five sugars (melibiose, sucrose, glucose, fructose, and maltose) (Figure 7e–i) and four organic acids (citric, tartaric, malic and shikimic acids) (Figure 7j–m) which changed dynamically from 35–63 DAA. These metabolites may play important roles in fruit maturation and ripening. The presence of sugar in fruit juice is known as a photoassimilate product that is being transported to the juice vacuole during the full fructification process [29]. Passion fruit accumulates sucrose, glucose and fructose as its dominant sugars (Figure 7f–h), while maltose was quantified as minor sugar by 1H NMR (Figure 7i). Different sugar accumulation was reported to occur in other fruits. For instance, apple (Malus domestica) [30] and peach (Prunus persica (L.) Batsch) [31] accumulate fructose, glucose, starch and sorbitol as their major sugars and polysaccharide. Strawberry (Fragaria × ananassa Duch) accumulates glucose, fructose, and sucrose as its dominant sugars, while inositol, xylose, and galactose are minor sugars [32]. Sugar accumulation is a species-dependent response where different photoassimilates from leaf mesophyll can be translocated to the fruit tissue [33].
Sucrose is the most common fixed carbon form of carbohydrates for long-distance transport from mesophyll leaves to non-photosynthetic sink organs during fruit development [34]. High sucrose concentration in passion fruit juice (Figure 7f) is suggested to be the main photoassimilate translocated to the juice. Upon arrival in the juice vacuole, sucrose could probably act as the carbon backbone for other metabolite synthesis, especially in generating other sugar compounds, such as glucose (Figure 7g) and fructose (Figure 7h). Some studies have explained that once sucrose is translocated to fruit, the neutral invertase enzyme converts sucrose to fructose and glucose in the sucrose cycle process [34]. In this study, the reduction of sucrose (Figure 7f) was probably due to the utilization of sucrose for generating glucose and fructose that increased in concentration from 35–49 DAA (Figure 7g,h). Fructose, glucose and sucrose are important sugars, contributing to the sweet taste of fruit juice that affects its quality [35]. The presence of sucrose, glucose and fructose (Figure 7f–h) as highly influential metabolites in juice was suggested to be an essential parameter in determining the passion fruit juice quality. In addition, the sucrose cycle is the center of sugar metabolism linked to other metabolic pathways, including glycolysis, tricarboxylic acid cycle, starch synthesis, and cellulose synthesis to produce various types of metabolites [29,36].
Accumulation of organic acids in the juice sac of fruit was reported to be synthesized in the juice sac’s mitochondria [37]. Metabolism of organic acid is different from sugar since they are not direct photoassimilate products [38]. Glycolysis and TCA cycles are the most common linked pathways known as the central carbon metabolism that are responsible for the maturation and ripening process reported in many fruits, such as berries, tomatoes, chilies, and mangosteen [13,22,39]. In the passion fruit metabolism, the sugar may first be assimilated (Figure 8a) to fruit juice and later metabolized through a series of glycolysis reactions before it forms citric acid (Figure 8b). Later, the citric acid may serve as the carbon source for the generation of tartaric and malic acids through TCA cycle (Figure 8c). This metabolic pathway was assumed to take place in the mitochondria and later accumulate in the juice sac vacuole, leading to the generation of major organic acids such as citric, tartaric and malic acid in the juice (Figure 7j–l).
Citric and malic acids were also detected as major organic acids in the ripened purple passion fruit cultivated in Borneo Island [40]. The presence of organic acid gives a sour and astringent taste. For instance, citric acid gives a tart taste that bursts in the mouth, while malic acid gives a smooth taste that disappears gradually in the mouth [41] combination of sugar and organic acids resulting in a sweet-sour taste becomes a determinant factor in fruit quality [42]. The type of organic acids accumulated in fruit can be affected by maturation and ripening stages. In immature lychee fruit, succinic acid was found to be the dominant acid [43]. As the lychee matured, citric, succinic, levulinic, glutaric, malonic, and lactic acids presented in relatively low amounts [43]. Reflecting on passion fruit development, the trend of citric acid (Figure 7j) has declined significantly, while tartaric acid (Figure 7k) and malic acid (Figure 7l) increased significantly from 35–42 DAA. The significant changes in organic acids may indicate dramatic transformation has occurred during passion fruit maturation, which began at 42 DAA. Since malic and tartaric acids were identified as the major organic acid in matured passion fruit, these acids could have played an important role in rating the organoleptic property of the fruit.
During maturation and ripening of fruit, the shikimate pathways (Figure 8iv) may also be interconnected with the central carbon metabolism (glycolysis) for derivation of aromatic amino acid such as tryptophan and phenylalanine in the juice (Figure 7a,d). The presence of shikimic acid as highly influential metabolites in juice (Figure 6) may indicate that the shikimate pathway is active during the maturation and ripening of passion fruit (Figure 8d). Shikimic acid has a benzene ring in its structure, making it an aromatic acid [44]. Shikimic acid serves as a central intermediate to form phenylalanine, tyrosine, and tryptophan in a series of metabolic reactions known as the shikimate pathway [45]. Through this metabolic pathway, chorismic acid is converted into anthranilate before condensing with phosphoribosyl diphosphate (PRPP) and further reacting with five subsequent enzymatic steps until tryptophan is formed [46]. This mechanism could explain the increase of tryptophan (Figure 7a) levels in passion fruit during 42 DAA, as the tryptophan is actively synthesized. Parallel with tryptophan synthesis, phenylalanine (Figure 7d) may be actively synthesized by utilizing shikimic acid as the central intermediate (Figure 8d). These two aromatic amino acids may act as important precursors for generating a wide range of secondary metabolites in passion fruits juice [47]. Thus, this study suggests that the shikimate pathway serves as one of the important metabolic pathways that may present with glycolysis and the TCA cycle in preparing the passion fruit for its maturation and ripening.

5. Conclusions

The metabolomics approach using 1H NMR is a spectroscopy technique that can detect various types of metabolites in passion fruit. Glycolysis, TCA cycle and shikimate pathways were the significant biochemical processes that are responsible for passion fruit maturation and ripening. The juice contains metabolites that perform a specific physiological function in passion fruit maturation and ripening. Sugar (glucose, sucrose and fructose) and organic acids (tartaric acid, malic acid and citric acid) can be denoted as key metabolites to rate the juice’s organoleptic quality of a purple passion fruit.

Supplementary Materials

The following are available online at https://www.mdpi.com/article/10.3390/agriculture12020156/s1, Table S1: The VIP value of passion fruit juice metabolites in the PLS-DA score plot.

Author Contributions

Conceptualisation, S.M.N. and P.D.; data curation, S.M.N.; formal analysis, S.M.N.; funding acquisition, S.M.N.; investigation, S.M.N. and P.D.; project administration, P.D.; software, A.M.; supervision, P.D. and F.A.; validation, P.D., F.A. and A.M.; visualisation, S.M.N.; writing—original draft preparation, S.M.N.; writing—review and editing, S.M.N., A.M. and P.D. All authors have read and agreed to the published version of the manuscript.

Funding

This research was supported by UPM, Malaysia for Graduate Research Fellowship (UPM/SGS/GS51388); SEARCA (ASEAN) for PhD Research Scholarship Grant 2019 (19-1404) and DAAD (Germany) and SEARCA (ASEAN) for In-Country SEAMEO-SEARCA PhD Scholarship (91739221).

Data Availability Statement

The data presented in the study are available on request from the corresponding author. The data are not publicly available due to privacy.

Conflicts of Interest

The authors declare no conflict of interest.

References

  1. He, X.; Luan, F.; Yang, Y.; Wang, Z.; Zhao, Z.; Fang, J.; Wang, M. Passiflora edulis: An insight into current research on phytochemistry and pharmacology. Front. Pharmacol. 2020, 11, 1–16. [Google Scholar] [CrossRef] [PubMed]
  2. Ding, P.; Syazwani, S. Physicochemical quality, antioxidant compounds and activity of MD-2 pineapple fruit at five ripening stages. Int. Food Res. J. 2016, 23, 549–555. [Google Scholar]
  3. Shahidah, M.N.; Ding, P. Trends and advances in edible biopolymer coating for tropical fruit: A Review. Food Res. Int. 2020, 134, 109208. [Google Scholar] [CrossRef]
  4. Shahidah, M.N.; Siti, N.F.M.H.; Ding, P. Effects of temperature and storage duration on keeping quality of Malaysian grown passion fruit (Passiflora edulis Sims f. flavicarpa Deg.). Acta Hortic. 2021, 1327, 557–562. [Google Scholar] [CrossRef]
  5. Mediani, A.; Abas, F.; Maulidiani, M.; Khatib, A.; Tan, C.; Ismail, I.S.; Shaari, K.; Ismail, A. Characterization of metabolite profile in Phyllanthus niruri and correlation with bioactivity elucidated by nuclear magnetic resonance-based metabolomics. Molecules 2017, 22, 902. [Google Scholar] [CrossRef]
  6. Zhou, X.; Liu, L.; Li, Y.; Li, K.; Liu, X.; Zhou, J.; Yang, C.; Liu, X.; Fang, C.; Luo, J. Integrative metabolomic and transcriptomic analyses reveal metabolic changes and its molecular basis in rice mutants of the strigolactone pathway. Metabolites 2020, 10, 425. [Google Scholar] [CrossRef]
  7. Muriel, Q.; Angosto, T.; Yuste-Lisbona, F.; Blanchard-Gros, R.; Bigot, S.; Martinez, J.; Lutts, S. Tomato fruit development and metabolism. Front. Plant Sci. 2019, 10, 1–23. [Google Scholar] [CrossRef] [Green Version]
  8. Hanganu, A.; Chira, N.A. When detection of dairy food fraud fails: An alternative approach through proton nuclear magnetic resonance spectroscopy. J. Dairy Sci. 2021, 104, 8454–8466. [Google Scholar] [CrossRef]
  9. Villa-Ruano, N.; Rosas-Bautista, A.; Rico-Arzate, E.; Cruz-Narvaez, Y.; Zepeda-Vallejo, L.G.; Lalaleo, L.; Hi-dalgo-Martínez, D.; Becerra-Martínez, E. Study of nutritional quality of pomegranate (Punica Granatum L.) juice using 1H NMR-based metabolomic approach: A comparison between conventionally and organically grown fruits. LWT 2020, 134, 110222. [Google Scholar] [CrossRef]
  10. Muhialdin, B.J.; Kadum, H.; Zarei, M.; Meor Hussin, A.S. Effects of metabolite changes during lacto-fermentation on the biological activity and consumer acceptability for dragon fruit juice. LWT 2020, 121, 108992. [Google Scholar] [CrossRef]
  11. Zainal, B.; Ding, P.; Ismail, I.S.; Saari, N. 1H NMR metabolomics profiling unveils the compositional changes of hydro-cooled rockmelon (Cucumis melo L. reticulatus cv glamour) during storage related to in vitro antioxidant activity. Sci. Hortic. 2019, 246, 618–633. [Google Scholar] [CrossRef]
  12. Ingallina, C.; Sobolev, A.P.; Circi, S.; Spano, M.; Giusti, A.M.; Mannina, L. New hybrid tomato cultivars: An NMR-based chemical characterization. Appl. Sci. 2020, 10, 1887. [Google Scholar] [CrossRef] [Green Version]
  13. Kim, H.; Park, S.; Hyun, S.; Yang, S.; Lee, J.; Auh, J.; Kim, J.; Cho, S.; Marriott, P.; Choi, H. Biochemical monitoring of black raspberry (Rubus coreanus Miquel) fruits according to maturation stage by 1H NMR using multiple solvent systems. Food Res. Int. 2011, 44, 1977–1987. [Google Scholar] [CrossRef]
  14. Shahidah, M.N.; Phebe, D.; Choon, S. Role of assisted pollination in fruit shape of purple passion fruit (Passiflora edulis Sims.). Int. J. Agric. For. Plant. 2018, 8, 128–131. [Google Scholar]
  15. Shahidah, M.; Ding, P. Size and area of Passiflora edulis Sims. mesocarp cells during fruit growth and development. Trans. Malays. Soc. Plant Physiol. 2021, 28, 58–62. [Google Scholar]
  16. Zolkeflee, N.K.; Isamail, N.; Maulidiani, M.; Abdul Hamid, N.; Ramli, N.; Azlan, A.; Abas, F. Metabolite variations and antioxidant activity of Muntingia calabura leaves in response to different drying methods and ethanol ratios elucidated by NMR-based metabolomics. Phytochem. Anal. 2020, 32, 69–83. [Google Scholar] [CrossRef]
  17. Kiralj, R.; Ferreira, M.M. Basic validation procedures for regression models in QSAR and QSPR studies: Theory and application. J. Braz. Chem. Soc. 2009, 20, 770–787. [Google Scholar] [CrossRef] [Green Version]
  18. Min, H.; Mi, K.; Ho, C.; Hwa, B.; Lee, J.; Kong, G.; Jin, S.; Kim, S.; Wook, S.; Chul, B. Mass spectrometry based metabolomic approaches in urinary biomarker study of women’s cancers. Clin. Chim. Acta 2009, 400, 63–69. [Google Scholar] [CrossRef]
  19. Oh, J.; Yoon, D.; Han, J.; Choi, H.; Sung, G. 1H NMR based metabolite profiling for optimizing the ethanol extraction of Wolfiporia cocos. Saudi J. Biol. Sci. 2018, 25, 1128–1134. [Google Scholar] [CrossRef]
  20. Eriksson, L.; Johansson, E.; Kettaneh-Wold, N.; Trygg, J.; Wikström, C.; Wold, S. Multivariate analysis. In Multi-and Megavariate Data Analysis: Part II: Advanced Applications and Method Extensions; Umetric Academy: Malmö, Sweden, 2006; pp. 24–56. [Google Scholar]
  21. Villa-Ruano, N.; Velásquez-Valle, R.; Zepeda-Vallejo, L.; Pérez-Hernández, N.; Velázquez-Ponce, M.; Arcos-Adame, V.; Becerra-Martínez, E. 1H NMR-based metabolomic profiling for identification of metabolites in Capsicum annuum cv. mirasol infected by beet mild curly top virus (BMCTV). Food Res. Int. 2018, 106, 870–877. [Google Scholar] [CrossRef]
  22. Aizat, W.; Dias, D.; Stangoulis, J.C.; Able, J.; Roessner, U.; Able, A. Metabolomics of capsicum ripening reveals modification of the ethylene related-pathway and carbon metabolism. Postharvest Biol. Technol. 2014, 89, 19–31. [Google Scholar] [CrossRef]
  23. Li, Y.; He, Q.; Du, S.; Guo, S.; Geng, Z.; Deng, Z. Study of methanol extracts from different parts of Peganum harmala L. using 1H-NMR plant metabolomics. J. Anal. Methods Chem. 2018, 2018, 6532789. [Google Scholar] [CrossRef] [Green Version]
  24. Awin, T.; Mediani, A.; Maulidiani; Leong, S.; Muhd Faudzi, S.M.; Shaari, K.; Abas, F. Phytochemical and bioactivity alterations of Curcuma species harvested at different growth stages by NMR-based metabolomics. J. Food Compos. Anal. 2019, 77, 66–76. [Google Scholar] [CrossRef]
  25. Jia, J.; Zhang, F.; Li, Z.; Qin, X.; Zhang, L. Comparison of fruits of Forsythia suspensa at two different maturation stages by NMR-based metabolomics. Molecules 2015, 20, 10065–10081. [Google Scholar] [CrossRef] [PubMed] [Green Version]
  26. Sobolev, A.; Brosio, E.; Gianferri, R.; Segre, A. Metabolic profile of lettuce leaves by high-field NMR spectra. Magn. Reson. Chem. 2005, 43, 625–638. [Google Scholar] [CrossRef] [PubMed] [Green Version]
  27. Zhang, P.; Huang, J.; Chen, F. NMR studies of a series of shikimic acid derivatives. J. Chin. Chem. Soc. 2007, 54, 1313–1320. [Google Scholar] [CrossRef]
  28. Mendoza, D.; Pablo, J.; Cuaspud, O.; Esturau-Escofet, N.; Hernández-espino, C.; Rodríguez, E.; Miguel, D.; Arias, M. 1H-NMR-based metabolomic of plant cell suspension cultures of Thevetia peruviana treated with salicylic acid and methyl jasmonate. Ind. Crop. Prod. 2019, 135, 217–229. [Google Scholar] [CrossRef]
  29. Fisher, G.; Almanza-Merchán, J.; Ramírez, F. Source-sink relationships in fruit species: A review. Rev. Colomb. Cienc. Hortícolas 2012, 6, 238–253. [Google Scholar] [CrossRef] [Green Version]
  30. Li, M.; Li, P.; Ma, F.; Dandekar, A.; Cheng, L. Sugar metabolism and accumulation in the fruit of transgenic apple trees with decreased sorbitol synthesis. Hortic. Res. 2018, 5, 60. [Google Scholar] [CrossRef] [PubMed] [Green Version]
  31. Yu, S.; Lo, S.; Ho, T.H. Source–sink communication: Regulated by hormone, nutrient, and stress. Trends Plant Sci. 2015, 20, 844–857. [Google Scholar] [CrossRef] [PubMed]
  32. Moing, A.; Renaud, C.; Gaudillère, M.; Raymond, P.; Roudeillac, P.; Denoyes-Rothan, B. Biochemical changes during fruit development of four strawberry cultivars. J. Am. Soc. Hortic. Sci. 2001, 126, 394–403. [Google Scholar] [CrossRef]
  33. Falchi, R.; Bonghi, C.; Drincovich, M.; Famiani, F.; Lara, M.; Walker, R.; Vizzotto, G. Sugar Metabolism in stone fruit: Source-sink relationships and environmental and agronomical effects. Front. Plant Sci. 2020, 11, 573982. [Google Scholar] [CrossRef]
  34. Aluko, O.; Li, C.; Wang, Q.; Liu, H. Sucrose utilization for improved crop yields: A review article. Int. J. Mol. Sci. 2021, 22, 4704. [Google Scholar] [CrossRef]
  35. Li, J.; Zhang, C.; Liu, H.; Liu, J.; Jiao, Z. Profiles of sugar and organic acid of fruit juices: A comparative study and implication for authentication. J. Food Qual. 2020, 2020, 7236534. [Google Scholar] [CrossRef]
  36. Li, M.; Feng, F.; Cheng, L. Expression patterns of genes involved in sugar metabolism and accumulation during apple fruit development. PLoS ONE 2012, 7, e33055. [Google Scholar] [CrossRef] [PubMed] [Green Version]
  37. Takehiko, S.; Ryohei, N.; Vladimir, S.; Avi, S.; Eduardo, B. Vacuolar citrate/H+ symporter of citrus juice cells. Planta 2014, 224, 472–480. [Google Scholar] [CrossRef]
  38. Sadka, A.; Shlizerman, L.; Kamara, I.; Blumwald, E. Primary metabolism in citrus fruit as affected by its unique structure. Front. Plant Sci. 2019, 10, 1167. [Google Scholar] [CrossRef] [PubMed]
  39. Mazlan, O.; Aizat, W.; Baharum, S.; Azizan, K.; Noor, N. Metabolomics analysis of developing Garcinia mangostana seed reveals modulated levels of sugars, organic acids and phenylpropanoid compounds. Sci. Hortic. 2018, 233, 323–330. [Google Scholar] [CrossRef]
  40. Ramaiya, S.D.; Bujang, J.S.; Zakaria, M.H.; King, W.S.; Shaffiq Sahrir, M.A. Sugars, ascorbic acid, total phenolic content and total antioxidant activity in passion fruit (Passiflora) cultivars. J. Sci. Food Agric. 2013, 93, 1198–1205. [Google Scholar] [CrossRef] [PubMed]
  41. Hartwig, P. Flavour Characterization of Selected Acidulants in Model and Food System. Master’s Thesis, Oregon State University, Corvallis, OR, USA, 1994. [Google Scholar]
  42. Ikegaya, A.; Toyoizumi, T.; Ohba, S.; Nakajima, T.; Kawata, T.; Ito, S.; Arai, E. Effects of distribution of sugars and organic acids on the taste of strawberries. Food Sci. Nutr. 2019, 7, 2419–2426. [Google Scholar] [CrossRef]
  43. Pareek, S. Nutritional and biochemical composition of lychee (Litchi chinensis Sonn.) cultivars. In Nutritional Composition of Fruit Cultivars; Elsevier Inc.: Amsterdam, The Netherlands, 2015; pp. 395–418. [Google Scholar]
  44. Bacher, A.; Eisenreich, W. Metabolic studies using the retrobiosynthesis concept–Theory, Technology, and Examples. In Comprehensive Natural Products II: Chemistry and Biology; Elsevier Inc.: Amsterdam, The Netherlands, 2010; pp. 675–694. [Google Scholar]
  45. Erb, M.; Kliebenstein, D. Plant secondary metabolites as defenses, regulators, and primary metabolites: The blurred functional trichotomy. Plant Physiol. 2020, 184, 39–52. [Google Scholar] [CrossRef] [PubMed]
  46. Radwanski, E.; Last, R. Tryptophan biosynthesis and metabolism: Biochemical and molecular genetics. Plant Cell 1995, 7, 921–934. [Google Scholar] [CrossRef] [PubMed] [Green Version]
  47. Xie, X.; Chen, C.; Fu, X. Study on the bioaccessibility of phenolic compounds and bioactivities of passion fruit juices from different regions in vitro digestion. J. Food Process. Preserv. 2021, 45, e15056. [Google Scholar] [CrossRef]
Figure 1. Workflow of metabolite profiling for passion fruit juice harvested at 35, 42, 49, 56, and 63 days after anthesis (DAA).
Agriculture 12 00156 g001
Figure 2. Typical 500 MHz 1H NMR spectrum of passion fruit juice extracted using methanol. Spectra are represented as (a) full view at 0.00–14.00 ppm, (b) expansion at 0.60–2.50 ppm, (c) expansion at 2.50–4.30 ppm, (d) expansion at 4.30–6.00 ppm, and (e) expansion at 6.00–7.90 ppm. Annotations for identified metabolites are displayed in Table 1.
Agriculture 12 00156 g002
Figure 3. Passion fruit juice analyzed by (a) principal component analysis (PCA) and (b) partial least squares-discriminant analysis (PLS-DA) using fruit with harvesting stages of 35, 42, 49, 56 and 63 days after flower anthesis (DAA).
Agriculture 12 00156 g003
Figure 4. Column loading plots of PLS-DA (PLS1 (a) and PLS2 (b)) representing methanolic extract of passion fruit juice harvested at 35, 42, 49, 56 and 63 days after flower anthesis. Each loading column represents metabolite and numbers in the significant loading column plot are assigned according to metabolites in Table 1.
Agriculture 12 00156 g004
Figure 5. Statistical validation of the corresponding PLS-DA by permutation analysis 20 times for juice.
Agriculture 12 00156 g005
Figure 6. VIP values of metabolites responsible for the separation of passion fruit juice in the PLS-DA score plot. The green color represents metabolites with VIP ≥ 0.7. The most influential metabolites were aligned from left to right.
Agriculture 12 00156 g006
Figure 7. Relative levels of 13 metabolites of passion fruit juice with VIP ≥ 0.7 at harvesting stages of 35, 42, 49, 56 and 63 days after flower anthesis (DAA). The highly influential metabolites belonging to amino acid group include tryptophan (a), lysine (b), aspartate (c), and phenylalanine (d). Metabolites such as melibiose (e), sucrose (f), glucose (g), fructose (h) and maltose (i) are sugar group, while citric acid (j), tartaric acid (k), malic acid (l) and shikimic acid (m) are organic acids. Data represent the average total peak area relative to 3-(trimethylsilyl) propionic-2,2,3,3-d4 acid sodium salt (TSP) ± SE of six biological replicates. Means followed by different lowercase letters indicate a significant difference (p ≤ 0.05) among DAA, according to the least significant difference (LSD).
Agriculture 12 00156 g007
Figure 8. Schematic metabolite diagram for passion fruit juice metabolism. The mean level of metabolites identified by 1H NMR analysis in passion fruit juice at harvesting stages of 35, 42, 49, 56 and 63 days after flower anthesis (DAA) are indicated using heatmaps (from left to right box). The level of metabolites is represented according to color scale; red indicates high relative intensity metabolites while peach indicates low relative intensity metabolites. Photoassimilates are general products of photosynthesis (a) that can be further modified through a series of metabolic reactions such as glycolysis (b), TCA cycle (c) and shikimate pathway (d).
Agriculture 12 00156 g008
Table 1. Assignment of 1H NMR spectral peak of passion fruit juice extracted by d4-methanol (J: coupling constant, s: singlet, d: doublet, t: triplet, m: multiplet and dd: doublet of doublet) identified in passion fruit juice.
Assigned No. Metabolite CompoundChemical Shift (ppm)References
Amino Acid
1Leucine0.94 (t, J = 6.5 Hz) [13]
2Valine1.05 (d, J = 7.0 Hz), 0.99 (d, J = 7.0 Hz) [16]
3Threonine1.33 (d, J = 6.6 Hz) [19]
4Alanine1.48 (d, J = 7.3 Hz) [16]
54-Aminobutyrate (GABA)1.90 (m) [19]
6Proline 1.98 (m), 2.02 (m) [19]
74-Hydroxyisoleucine2.16 (m) [23]
8Citrulline1.15 (m) [13]
9Isoleucine0.85–0.96 (m), 1.42–1.46 (m) [19]
10Lysine3.03 (t, J = 7.5 Hz) [23]
11Methionine2.12 (s) [24]
12Phenylalanine7.32 d (J = 7.5 Hz), 7.36–7.38 (m) [25]
13Aspartate2.57 dd (J = 7.4, 18.9 Hz) [19]
14Tryptophan3.57 (dd, J = 13.4, 5.0 Hz) [11]
Sugar
15Glucose3.21 (dd, J = 10.5, 6.3), 3.46 (m), 4.59 (d, J = 7.9 Hz) [11]
16Sucrose3.59 (m), 3.78 (t, 9.5), 3.87 (dd, J = 8.1, 3.9 Hz),
4.17 (d, J = 8.7 Hz)
[11]
17Fructose3.54–3.59 (m), 3.65–3.70 (m), 3.73–3.82 (m), 4.01 (dd, J = 12.7, 1.3 Hz)[11]
18Mannitol3.89 (m) [13]
19Maltose5.39 (d, J = 3.8 Hz) [13]
20Melibiose3.76 (d, J = 3.3 Hz), 3.82 (d, J = 5.0 Hz) [6]
21Trehalose5.18 (d, J = 3.8 Hz) [19]
Organic Acid
22Tartaric acid 4.34 (s) [26]
23Succinic acid2.38 (s), 2.43 (s) [19]
24Malic acid2.50 (dd, J = 15.5, 8.6 Hz), 3.0 (m) [13]
25Citric acid2.72 (d, J = 15.1 Hz) [13]
26Shikimic acid2.80 (d, J = 15.5 Hz) [27]
27Malonic acid3.10 (s) [19]
Secondary Metabolites
28Choline3.18 (s) [16]
29Chlorogenic acid2.08 (m), 2.20 (m), 4.04 (m), 6.39 (d, J = 16.0 Hz) [26]
30Phenylacetic acid7.30 (m), 3.50 (s) [28]
Publisher’s Note: MDPI stays neutral with regard to jurisdictional claims in published maps and institutional affiliations.

