Abstract
The relative poverty statuses of female and male migrant workers are complex: (i) as a group, migrant workers are relatively better off than their rural hometown fellow residents but are deprived compared to the long-term residents of the cities to which they have immigrated, and (ii) gender differences exist between female and male subgroups, resulting from the interaction of gender bias and empowerment. The former can be further decomposed into characteristic-led bias and bias arising from discrimination. However, little is known about the different facets of gender-differentiated poverty that pose challenges for migrant workers. This study used data collected from Chinese Family Panel Studies (CFPS) during the period 2012–2018 to address this research deficiency. This study conducted a poverty aggregation using a multidimensional relative poverty index system based on the Alkire and Foster (A–F) method to offer an overview of the gender differences in the overall relative poverty statuses of Chinese migrant workers. Further, to validate the existence of gender bias, this study conducted a decomposition analysis based on unconditional quantile regression (UCQR) of the explanatory model of relative poverty. The results of the combination of the aggregation and decomposition analysis data imply that, despite the gender discrimination that female migrant workers encounter, they are generally better off than male migrant workers due to their slight characteristic-led advantages and, more importantly, their autonomous poverty reduction activities. This study theoretically contributes to an in-depth understanding of gender differences in migrant workers’ relative poverty. In addition, this study advocates more targeted and sustainable poverty reduction solutions. For instance, more targeted payment transfer and long-term (vocational development, entrepreneurship, and lifestyle) empowering projects should be highlighted.
1. Introduction
Poverty, which is involved in many important issues related to economic development, social stability, and even the sustainability of humankind, is a significant issue worldwide [1,2]. Nevertheless, poverty itself is a complex issue as: (i) poverty is ubiquitous yet contextually diverse among countries, regions, regimes, societies, and population groups [3,4,5]; (ii) how poverty manifests is continually evolving [1,6], generating dynamics in assessing, interpreting, and reducing poverty; and (iii) poverty interacts with various social phenomena, such as urbanization, industrialization, migration, feminist activity, and aging [7,8,9,10,11]. Particularly in several developing countries, urbanization and industrialization processes have resulted in many surplus rural laborers migrating to and working in cities, leading to a rise in their incomes (compared to their previous incomes or the incomes of their hometown fellow residents). However, the migration of workers also leads to the emergence of treatment inequalities in payment or living facilities compared to those of long-term urban residents, resulting in livelihood restrictions [9,12]. In other words, the issue of relative poverty has been alternating with that of absolute poverty for such rural–urban worker migration [13,14,15,16]. Researchers and policymakers in many countries have become aware of the relative poverty issue of migrant workers (see, for example, Albania [12]; China [15]; India [17]; Mexico [18]; Nepal [19]). However, some essential phenomena (i.e., the gender-group difference) around this issue are still waiting to be explored.
On closer examination, migrant workers’ gender-group differences in relative poverty exist. Taking China as an example, among the total population of 169.59 million rural-to-urban working migrants, there are 59.2 million female workers (data for the year 2020) (data source: Monitoring and Investigation Report of Rural Migrant Workers in 2020, released by China’s National Bureau of Statistics, http://www.stats.gov.cn/tjsj/zxfb/202104/t20210430_1816933.html (accessed on 30 April 2021)), who are probably more vulnerable and more deprived than their male counterparts due to gender bias existing in the workplace, in their social lives, and even within households [20,21]. Although worldwide gender differences in poverty have attracted attention in many studies [7,22,23,24], the majority of them have been conducted in a general sample or focused on local residents: gender-differentiated poverty statuses (and causes) of migrant workers are rarely examined. Moreover, relative poverty statuses of migrant workers in different gender groups are a nexus of characteristic-led and discrimination-led biases and empowerment. However, little is known about these different facets of gender-differentiated poverty that pose challenges for migrant workers. The authors provide a literature review on poverty, migrant workers’ poverty, and gender-differentiated poverty and describes the research gap on the gender-differentiated poverty of migrant workers in the following.
1.1. Definitions, Features, and Measurements of Poverty
Poverty describes a state in which humans lack access to those resources necessary for providing basic material needs [6,9,25]. Therefore, researchers have evolved a better understanding of poverty by defining more precisely what those vital-for-human-lives resources are. Baulch summarized the concepts related to poverty in a pyramid-like format [25], in which the narrowest definition of poverty (the consumption/income approach) emphasizes humans’ private consumption, which is dependent on their income. In comparison, the broadest definition of poverty (the human development approach) extends the concept of poverty to include other essentially important things, such as common property resources, public provisions, and human dignity and autonomy [5,9,26]. Other approaches to understanding poverty have also emerged. For example, by emphasizing the accessibility/exclusion of social networks vital for sustaining livelihoods [6], the social exclusion approach has offered a valuable complement to the conceptualization of poverty.
Poverty has a complex and dynamic nature. First, it exists pervasively yet contextually. Pervasively, the phenomenon of poverty exists in numerous countries, including both lower-income/higher-income and developing/developed countries. Regarding its diversification, poverty occurs in situ, alongside inequality, across population groups in different countries, regions, regimes, and societies [3,5,27]. For example, Alkire and Seth found that reducing national poverty does not necessarily mean a uniform reduction in all population groups [4]. Second, poverty interacts with other social phenomena, not limited to migration, feminist activity, urbanization, and population aging [7,8,9,10,11]. Third, poverty develops dynamically. Microscopically, the deprived, rather than being passive victims waiting for handouts, are agents struggling to cope with poverty with whatever resources they possess [2,6], thus leading to the macroscopic poverty index of a specific population constantly being transformed [2].
The complex and dynamic nature of poverty has caused the measurement of poverty to evolve from absolute to relative and from unidimensional to multidimensional measures. All poverty measurements are founded essentially on the basis of comparing available resources to basic human needs: a person/family is identified as poor if their resources fall short of the poverty threshold [26,27]. However, a relative poverty threshold (a cutoff level depending on specific resource distribution) is increasingly replacing the conventional absolute threshold (a fixed cutoff level, or the so-called poverty line, being applied across all resource distributions) [26]. At the same time, the conventional unidimensional measure of poverty (i.e., private consumption/income) has been altered by the multidimensional poverty structure, which could include a variety of dimensions/indicators, including nutrition, clothing, housing, public facilitation, psychological well-being [4,5], etc. Accordingly, several methodologies for such multidimensional poverty measurement have been proposed, grouped broadly into axiomatic and information theory approaches, fuzzy set theories, and latent variable methods [28].
1.2. Poverty Realities of Migrant Workers
Migration is usually understood as a spatial separation between the location of a person’s/household’s place of residence and that of the place where they are engaged in activities to sustain their livelihood [29]. Migration essentially involves the mobility of labor, together with a person’s/household’s experience, skills, education level, and health status [11]. There are multiple migration types, which play various roles in reducing poverty: while poverty seems to act as a constraint on international migration (i.e., migration across national borders), it acts as a push factor for internal migration (i.e., migration within national borders, of which rural–urban migration for the purposes of working is a typical form) [9,29,30].
Regarding internal migration, the urbanization process has promoted large-scale rural–urban worker migration in many developing countries in recent decades. The ranks of rural–urban worker migration (hereinafter referred to as worker migration) have swelled, which has aroused the attention of poverty researchers in several countries [12,15,17,18,19]. This type of migration contributes positively to poor people achieving secure livelihoods and constructing pathways for themselves out of poverty [29]. However, migrant workers may now constitute “new” poor communities in urban areas [18,31] for several reasons. First, migrant workers are in a relatively weak position in the labor market: for example, migrant workers work longer hours, with much lower hourly wages, than local residents. Moreover, significant differences in the non-income welfare earned by migrant workers and local residents exist, such as housing conditions and access to social insurance programs as a result of inequalities in the distribution of urban infrastructure (both private and public) and basic services across the length of local stay [18].
1.3. Gender-Differentiated Poverty
Women are more likely to live in poverty than men in various parts of the developing world, as reported by the Key UN Entity Focused on Development (United Nations Development Programme) in 2017. Along with “gender equality and the empowerment of women and girls” being included as a stand-alone goal among the set of Sustainable Development Goals (SDGs) in the United Nations Agenda for Sustainable Development (Agenda 2030), gender-differentiated poverty has attracted much research interest [7,22,23,24].
Does poverty actually have a “female face”? There are quite a few studies (see, for example, in ten developing countries [32]; in Nicaragua [33]) that empirically challenge the universal acknowledgment of the feminization of poverty (which, however, is still being supported by cross-regional data presented at the United Nations [34] and by data for 26 diverse Luxembourg Income Study (LIS) countries [22]). Accordingly, researchers have begun to advocate a more nuanced and complex analysis for validating gender-differentiated poverty [32,35]. Nevertheless, despite the fact that researchers have identified “structural poverty,” or a multiplicity of gender-biased social processes and structures [7,24,32], as a component of “transitory poverty” as random shocks and shortfalls in social support in times of emergencies (Casper et al., 1994; Gornick and Jäntti, 2010) [22,36], proper tools and methods that would enable more in-depth empirical examinations of the causes of poverty are still lacking [7].
1.4. Gender-Differentiated Poverty among Chinese Migrant Workers
China is among those countries experiencing issues related to both the relative poverty levels resulting from worker migration and gender-differentiated poverty. Having generally eliminated absolute poverty by the year 2020 (ten years ahead of the target date for achieving the poverty reduction goal set by the UN 2030 Agenda for Sustainable Development), China is now facing some of the most crucial relative poverty issues and has placed the alleviation of relative poverty into its future developing blueprint plans (see, for example, the proposal of the Fourth Plenary Session of the 19th Central Committee of China’s Communist Party, 2019). In addition to the historically urban–rural difference in poverty, newly emerging phenomena of differentiated poverty, such as differences between urban residents and urban migrants and between male and female population groups, now play a major role concerning relative poverty.
Several researchers have explored the poverty levels among Chinese migrant workers [37,38,39,40], and while some researchers have demonstrated relative poverty inequalities among different subgroups (see, for example, different occupations [41]; different ages [42]), gender differences have rarely been examined empirically (with a few exceptions, such as that by [43]).
To sum up, the gender-differentiated poverty of migrant workers is an important research topic for developing countries with a high degree of population mobility (such as China) but has so far received little empirical investigation.
Based on the above considerations, this study addresses this research deficiency in studies of migrant workers’ gender-differentiated poverty levels by first aggregating data collected in China to provide an overview of the poverty differences between the female and male groups and then decomposing the relative poverty gender bias into different gender-bias accounts. This study aims to answer the following questions:
- RQ1: Do gender differences exist in the relative poverty levels of migrant workers moving from rural to urban districts of China?
- RQ2: If so, how are such gender differences to be interpreted?
Generally, the present study is among the first to investigate gender differences in relative poverty among migrant workers. It helps to gain in-depth knowledge and optimizes the method of measuring and decomposing gender differences in relative poverty among migrant workers. This study also demonstrates the necessity of targeted and sustainable gender-differentiated poverty reduction solutions and offers detailed suggestions on establishing those solutions.
The rest of this paper proceeds as follows. Section 2 presents the process of poverty aggregation and decomposition that this study employs to investigate gender-differentiated poverty among migrant workers. Section 3 and Section 4 present the analysis results and discussion based on those results correspondingly. Section 5 states the conclusion, limitations, and future research directions.
2. Materials and Methods
This study employed a process of poverty aggregation and decomposition to investigate gender-differentiated poverty among migrant workers. In the poverty aggregation stage, a multidimensional measurement model of migrant workers’ relative poverty levels was established, aggregating individual-level data into group-level poverty indexes and thus offering an overview of the gender differences relating to workers’ relative poverty levels. In the poverty decomposition stage, an explanatory model was built to investigate the factors affecting poverty gender bias and then to decompose gender effects (gender bias) on relative poverty levels as characteristic-led and discrimination-like biases. The overall research design is illustrated in Appendix A: Figure A1.
2.1. Aggregation of Migrant Workers’ Relative Poverty Levels
2.1.1. Construction of the Multidimensional Index Model
The relative poverty index was first constructed to measure the relative poverty of migrant workers based on the Alkire and Foster (A–F) method [44], which is a widely used axiomatic method in this field of research [45,46,47]. The A–F method identifies poverty in two steps: the first step determines who is poor, and the second step is to aggregate the information for individuals related to their poverty level across society [48]. The A–F method applied in the multidimensional context is more complex, combining methods for identifying the deprived based on counting the number of (weighted) deprivations and the aggregation of unidimensional measures into the multidimensional case [28,44]. Specifically, it first identifies multiple dimensions/indicators and the cutoffs for each indicator and then determines whether a person is deprived in that dimension by using the corresponding cutoff. It next aggregates deprivation information across society, which means that it sets up cross-dimensional cutoffs that identify the deprived by (weighted) aggregation of the deprivation dimension numbers. We present these steps below.
First, as poverty is represented multidimensionally, the sample observation matrix is constructed, where the sample size is n, represents the value of the individual in the poverty dimension of , represents the set of values of individual i on s dimensions, is the vector composed of cutoff values in the corresponding dimension, and indicates that individual belongs to the relatively poor population in dimension , namely:
If an individual is deprived in or above dimensions, they are considered to be relatively poor, which can be expressed as:
in which indicates the individual’s degree of relative poverty, while denotes the number of deprivation dimensions for the individual.
We also have:
in which is the weight of poverty dimension j.
The relative poverty index was then constructed using two indexes: the relative poverty incidence index and the average relative deprivation index . Accordingly, we constructed the relative poverty incidence index to denote the proportion of the relative poverty population in the total sample population . is expressed as the incidence of the relatively poor population , and the subscript represents the critical value of the poverty dimension:
Similarly, the average relative deprivation index, also known as the relative poverty intensity index, that is, the ratio of the average number of dimensions of deprivation of all of the relatively poor individuals to the total number of dimensions, can also be expressed in the form of the average relative deprivation :
It can be deduced from Equation (5) that shows that all individuals in the survey sample are in a state of relative poverty in dimensions on average.
The relative poverty index is the product of the relative poverty incidence index and the relative poverty intensity index :
In Equation (6), is the relative poverty index of the dimension. Furthermore, the contribution of dimension j to relative poverty can be obtained, which can be expressed as:
2.1.2. Selection of Dimensions/Indicators
This study constructed a measurement system for the relative poverty index of migrant workers using a modification of the Chinese Multidimensional Poverty Index (MPI) [49]. The MPI is an index system established in the Chinese context and widely applied when investigating Chinese samples [50,51]. This system measures household-level poverty in relation to health, education, and economic provision [49]. However, when measuring migrant workers’ relative poverty levels, modifications must be made to three factors. The first modification results from differences in the evaluation object. Since the MPI is a household-level evaluation system, it is more appropriate to use the migrant workers’ relative poverty index to assess individual-level poverty since families are sometimes fragmented during worker migration (different members possibly live and work in different places). The second modification is based on the differences in comparable objects: while the comparable objects in the MPI are other rural households within the group, the comparable objects of the migrant workers’ relative poverty index are not other migrant workers but rather other urban residents. The third modification relates to differences in the focus of the measurements: the MPI measures poverty only in terms of capacity and welfare, without directly considering economic dimensions, while the migrant workers’ relative poverty index has a broader connotation, including not only subjective needs but also objective material needs. Therefore, this study built a measurement system integrating the MPI as well as those aforementioned Chinese researchers’ attempts at constructing extended poverty indexes, including the dimensions of income, education, health, life, employment, and social integration [37,38,39,40,41,42]. The meanings and indicators of each dimension are explained below.
Income dimension. Generally speaking, the average income level of migrant workers is higher than that of their rural fellows (as income is one prominent promoter of rural–urban migration [52,53]); however, the living costs of migrant workers in cities are also much higher than those of rural residents [54,55]. Therefore, it is not appropriate to use the rural income poverty cutoff to measure the income poverty of migrant workers; rather, a modification of the urban income poverty cutoff is more appropriate. Based on this consideration, this study adopted Wang (2014)’s cutoff value, which is 1.5 times the urban subsistence allowance standard, in the measurement of the income dimension [12].
Educational dimension. The educational dimension in the MPI includes mainly the number of years of schooling (limited to academic education) and the children’s dropout rate. This study investigates at the individual level rather than at the household level; thus, the index of children’s dropout rate is not within the scope of this study. More importantly, non-academic education received by migrant workers after working has an essential impact on their career development [56,57]. Therefore, the measurement index of the educational dimension in this study includes both academic and non-academic education (evaluated by the number of years the education lasted).
Health dimension. Health status can directly affect individuals’ work and lives [58]; thus, the MPI includes this as a third dimension, in addition to the income and life dimensions (Alkire and Shen, 2017) [49]. However, the MPI measures the health dimensions of child mortality and primary nutrition [49]. Once again, child mortality is out of the scope of this study. Moreover, primary health and nutrition can be assessed by other indicators, either objective (e.g., height and weight measures [37,39]; body mass index (BMI) index [59]; chronic disease history [59]) or subjective (e.g., research subjects’ self-reported evaluation of health and nutrition status [59]). As for medical services, a lack of access to full-time employment [37] and medical insurance [37,59]) were previously commonly used indicators, especially for migrant workers. This paper selects both objective and subjective indicators of primary health and nutrition status, such as BMI, chronic disease, and self-reported health status.
Employment dimension. Migrant workers have to face various levels of differentiated treatment during their time working. For example, they may work longer hours per day; more importantly, they may work without a formal employment contract, which adds risk to their employment stability [60]. Although some migrant workers do sign an employment contract with their employers, they are more than likely to be excluded from the company’s employee well-being plans, such as job insurance and housing funds. (Chinese employers selectively afford their employees some guaranteed treatments. The most typical unit is “five insurances and one fund,” or Wu Xian Yi Jin in Mandarin, which consists of endowment insurance, medical treatment insurance, unemployment insurance, industrial injury insurance, birth insurance, and a housing accumulation fund. Birth insurance has been included in medical treatment insurance since 2016. However, not every employee is provided with such treatments).
Based on these considerations, the indicators selected for the employment dimension in this study include migrant workers’ working hours (judged by the standard of eight hours per day), whether they have formal work contracts, employer-provided job insurances, and employer-provided housing funds.
Living dimension. The MPI’s living dimension includes cooking fuel, sanitation, drinking water, electricity, floor materials, and assets [49], which are more appropriate for measuring the poverty of rural households than of migrant workers. However, among the most prominent living problems faced by migrant workers are housing problems: workers may not possess their own houses or apartments, and the living spaces they rent are usually communal rental spaces or employee dormitories occupied by multiple persons, so each worker might only have a limited area to use as their own [59,61]. Moreover, historically, self-evaluated life satisfaction has been used as an indicator in the living dimension [62,63]. Additionally, the mobile Internet plays an increasingly important role in the daily lives and work of urban residents. Thus, this study stresses that the ability of migrant workers to have plenty of time to use the mobile Internet is essential for maintaining their living standards. Therefore, the living dimension of the present study selects as indicators: the level of overcrowding in housing, the hours of available use of the mobile Internet, and the self-evaluated degree of life satisfaction of migrant workers.
Social integration dimension. Whether migrant workers are socially integrated into city life is crucial for their future development and their life choices for settling down in an urban environment [21,64]. Thus, some researchers include the social integration dimension in measurements of migrant workers’ poverty. Social integration indicators cover both commonly occurring aspects, such as participation in social organizations and social activities and subgroup integration [65], and several contextual aspects, among which discrimination between rich and poor and discrimination based on the urban–rural dichotomy of household registration are noteworthy [21,37,64]. Specifically, migrant workers are usually blue-collar workers who will probably be mistreated or disrespected due to the social gap that exists between them and the wealthier classes. Moreover, migrant workers are sometimes discriminated against because they do not register themselves as urban citizens in the national household registration system [65]. Based on these considerations, this study employs as indicators: migrant workers’ self-reported rich–poor discrimination, household registration discrimination, and organizational participation (i.e., judged by whether they participate in trade unions or other kinds of workers’ associations).
2.1.3. Assignment of Indicator Weights
The weight assignment methods applied to the poverty index include the entropy value method, the principal component analysis method, and the equal weight method (Alkire and Foster, 2011a, b) [28,44]. Of these, the entropy value method is used mainly to judge the degree of dispersion of the indicators, which is unsuitable for dummy variables, whose values are either 0 or 1 [28,44] (which this study’s variables contain). The principal component analysis method is unsuitable when the correlation coefficients of the indicators are too small (in this study, however, most of the correlation coefficients are less than 0.1). In contrast, the equal weight method is the one most adopted, and it is relatively easy to operate [28,44]. Based on these considerations, the present study uses this equal weight method; that is, each dimension is given the same weight of 1.0, and then the weights are equally distributed to the indicators within this dimension (each dimension’s distributed weight depends on how many indicators are in this dimension) [49]. The assignments of the indicator weights are listed in Table 1.

Table 1.
Measurement of migrant workers’ relative poverty: dimensions, indicators, cutoff values, and weights.
2.2. Decomposition of Migrant Workers’ Relative Poverty Using Unconditional Quantile Regression (UCQR)
2.2.1. Establishment of the Explanatory Model of Gender-Differentiated Poverty
This study built an explanatory model of the gender differences found in the levels of migrant workers’ poverty. Average relative deprivation (individual level) is the dependent variable in this model, while the independent variables can be roughly divided into two categories: transitory-based factors that include age, public living facilities, and medical expenditure, which are highly associated with the ability of migrant workers to fend off contemporary risks such as deteriorating health and degrading working capacity; structure-based factors that include appearance, proficiency in Mandarin, sensitivity to news, and social status identification, which are more closely related to the long-term working and development status of migrant workers.
Age. In addition to the commonly acknowledged relationship between aging and poverty, there is also the claim that the poverty gender gap arises from health status or working capacity as determined by the aging characteristics of the different genders [66,67,68].
Public living facilities. Facilities such as public toilets, dressing rooms, and baby care rooms are conducive to improving the quality of life and health of migrant workers [69]. However, the poverty gender gap might be influenced by variability in public living facilities between the two genders [69,70].
Medical expenditure. Excessive medical expenditure usually indicates that migrant workers require treatment for health problems [71]. Worse still, excessive medical expenditure is a burden on the incomes of migrant workers and reduces other types of consumption, such as education and improving living conditions [72,73,74], which further increases the vulnerability of migrant workers. However, females and males often face different health challenges, and medical expenditure might also be unbalanced between the two genders within households [69,75].
Appearance. Appearance can affect employment opportunities and job-seeking performance [76]. Moreover, females and males will almost certainly have different sensitivities to the influence of appearance on employment opportunities [77].
Mandarin proficiency. Fluent language skills of migrant workers are necessary in order to communicate with residents in urban districts, affecting job acquisition, job promotion, and integration into city life [78,79]. However, females and males might have different sensitivities to the effect of their different language capacities due to differences in their communication abilities and communication habits.
News sensitivity. Migrant workers have higher job mobility than city residents, so those who often follow daily news (including information related to labor market requirements, position gaps, the economy, and developing social trends) will usually make more rational decisions in job hunting and be more autonomous in protecting their own rights [80]. Like Mandarin proficiency, news sensitivity might have different effects on the work and lives of females and males due to differences in their information-seeking habits.
Social status. Generally, social status can affect migrant workers’ access to resources and how they protect their rights [60]. Moreover, their perception of social status will impact migrant workers’ psychological well-being and how they integrate into the urban community and lifestyle [81]. Thus, their social status will affect their poverty/affluence status.
2.2.2. Counter-Group Comparison
To investigate whether gender bias exists in the relative poverty levels of migrant workers, a counter-factual group, namely, “female regarded as male,” needs to be constructed. The logic for doing this is as follows: if women are perceived as men, and there is no gender bias toward them, they are at the same risk of poverty as men. Consequently, the poverty status of this counter-factual group should be consistent with that of male migrant workers. Otherwise, if the poverty status of this counter-factual group is significantly different from that of male migrant workers, gender bias is indicated. This counter-group comparison method reveals the net effect of gender on creating differences in migrant workers’ relative poverty.
Conventionally, the Oaxaca–Blinder decomposition method has been the most commonly used method to investigate differences between two counter groups [82]. However, this method is based on the mean decomposition of linear regression and cannot obtain differences in poverty levels at different subpoints [83]. This will inevitably lead to deviations in the estimated results when the explanatory variable has a strong distributive complexity and explanatory variables have different effects on explanatory variables due to changes in distribution between counter groups (which applies to the poverty case). In such circumstances, the UCQR decomposition method can be applied, which establishes the corresponding relationships between the recentered influence function (RIF) and conditional quantile regression (CQR) [84]. Thus, UCQR shows the influence of explanatory variables on the statistics to be analyzed using the Oaxaca–Binder decomposition method. By doing this, we can decompose the gender bias into two different magnitudes: characteristic-led bias (the characteristic effect in the UCQR) and gender discrimination (the coefficient effect in the UCQR). The specific decomposition process is shown in Section 2.2.3.
2.2.3. UCQR Decomposition of Gender Differences
First, the reset weight function recommended by DiNardo et al. (1996) [85] was used to decompose the gender differences in the migrant workers’ relative poverty distribution into a characteristic effect and a coefficient effect. Specifically, the poverty distribution of gender n ( for female migrant workers and for male migrant workers) is denoted as . Since the poverty level of migrant workers is affected by observable covariables and unobservable factors , can be expressed as:
The counter-factual marginal distribution of relative poverty was then constructed; when the coefficient effect is female, the distribution of the covariable is male. On the other hand, the distribution of relative poverty can also be described by distribution statistics, expressed as . When the counter-factual marginal distribution of poverty is obtained, the gender difference in the poverty distribution can be decomposed into the characteristic effect and the coefficient effect , that is:
Next, UCQR decomposition was applied to further decompose the characteristic effect and coefficient effect for every single covariable (i.e., explanatory variable), namely:
In Equation (10), represents the synthesis of coefficient effect subdivision on each covariate, represents the synthesis of characteristic effect subdivision on each covariate, and represents the approximation error, including the conditional expectation linear setting error (set as the difference between the explicable part of the traditional Oaxaca–Binder decomposition and the weighted regression decomposition) and the weighted error (set as the difference between the undecomposable part of the conventional Oaxaca–Binder decomposition and the weighted regression decomposition). It is noteworthy that the characteristic effect is the explicable part of the influences of those explanatory factors on the gender bias between male and female migrants, while the coefficient effect, or the inexplicable part, determines gender discrimination.
2.3. Research Sample
This study collected data from Chinese Family Panel Studies (CFPS), a research project carried out by the Chinese Social Science Survey Center of Peking University. CFPS covers 31 provinces, municipalities, and autonomous regions in China and collects two-year tracking data at three levels: individual, household, and community, under multiple themes of economic activities, education outcomes, family relationships and dynamics, population migration, health, etc. This study matched the individual-level data for 2012, 2014, 2016, and 2018 (four consecutive two-year periods) and included 1638 migrant workers (34.8% female and 65.2% male) in the research sample.
3. Results
3.1. Statistics of Overall Migrant Workers’ Relative Poverty
Table 2 lists the relative poverty incidence, average relative deprivation index, and the relative poverty index of migrant workers of different genders. Generally, all three types of indexes showed a downward trend (regardless of the value of k), indicating that the relative poverty of both genders was alleviated between 2012 and 2018. More specifically, the relative poverty of migrant workers had the following features.
Table 2.
Results of migrant workers’ relative poverty measurement and gender differences.
Cutoff specialty of relative poverty. The relative poverty index, relative poverty incidence index, and the average deprivation index were all sensitive to changes in k (the multidimensional cutoff value). The values of those indexes decreased as k increased: as for the four-year average data for migrant workers as a whole, the relative poverty incidence index decreased from 96.06% for k = 1 to 0.07% for k = 5; the average deprivation index decreased from 39.25% for k = 1 to 8.75% for k = 5; and the relative poverty index decreased from 37.93% for k = 1 to 0.05% for k = 5. For k = 6, no migrant workers were assessed as being in the state of relative poverty.
Relative poverty across indicators. The incidence of relative poverty across different indicators is shown in Figure 1. On the whole, the four-year average relative poverty incidence index of migrant workers for non-academic education (H = 80.46%), Internet access (H = 57.69%), working hours (H = 50.80%), employer-provided job insurances (H = 56.65%), employer-provided housing fund (H = 90%), and participation in organizations (H = 92.24%) were among the highest, indicating that migrant workers were relatively poor in those six aspects. The relative poverty incidence index for formal job contract (H = 37.54%), academic education (H = 27.89%), and housing overcrowding (H = 20.4%) were at relatively high levels, while the relative poverty incidence index of annual income (H = 12.62%), rich–poor discrimination (H = 7.47%), and urban–rural discrimination (H = 13.96%) were the lowest. Later, the contribution of each indicator to the relative poverty index was explored by means of index decomposition. As listed in Table 3, in general, the contributions of non-academic education, Internet use, provident fund, and organization participation were the highest, ranging from 6% to 18%, while the contributions of self-rated health, chronic diseases, housing congestion, wealth discrimination, and the wealth gap were relatively low, ranging from 1% to 5%.
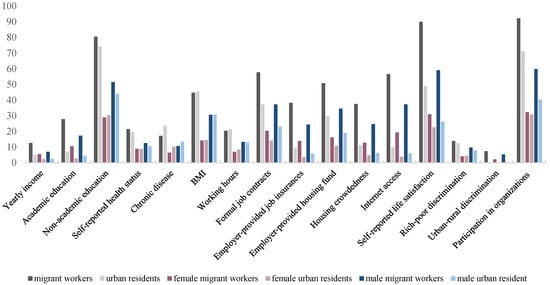
Figure 1.
Migrant workers’ relative poverty incidence index (%) in multiple dimensions.
Table 3.
Percentage contribution of dimensions/indicators to migrant workers’ relative poverty incidence index and gender differences.
3.2. Gender Differences in Migrant Workers’ Relative Poverty
Generally, all three types of indexes showed considerable stability (regardless of the value of k), indicating that gender differences in migrant workers’ relative poverty remained between 2012 and 2018. More specifically, gender-differentiated relative poverty had the following features.
The cutoff specialty of gender-differentiated relative poverty. When examining migrant workers’ relative poverty for the different genders, the data in Table 2 demonstrate that, for low values of k (), the poverty incidence indexes of male migrant workers were much higher than those of female migrant workers in all four years. At the same time, the average deprivation indexes of male migrant workers were slightly lower than those of female migrant workers, which makes male migrant workers’ relative poverty indexes significantly higher than those of female migrant workers. However, for k = 4 or 5, the relative poverty index and poverty incidence index of female migrant workers were higher than those of male migrant workers, indicating that female migrant workers were more prone to experiencing poverty under higher multidimensional cutoff values.
Gender-differentiated relative poverty across indicators.Table 3 also lists the gender-differentiated contributions of various indicators to the poverty incidence index. For male migrant workers, the relative poverty incidence index for non-academic education, Internet use, job insurances, provident fund, and participation in organizations had the highest levels (ranging from 30% to 65%). The poverty incidence indexes for these indicators also had the highest levels for female migrant workers, with the levels ranging from 15% to 35%. The incidences of relative poverty for academic education, BMI, self-rated life satisfaction, working hours, and working contracts for male migrant workers were relatively high, ranging from 15% to 30%, and those for female migrant workers ranged from 10% to 20%. The incidences of self-rated health, chronic disease, overcrowding, rich–poor discrimination, and urban–rural discrimination among male migrant workers were between 5% and 15%, and those among female migrant workers were between 2% and 10%. As can be seen from the above statistics, except for the result showing no significant difference in the incidence of poverty between the annual income indicators of male and female migrant workers, the incidence of poverty for all other indicators of male migrant workers was approximately two times that of female migrant workers. Additionally, there was little difference in the contributions of each indicator between male and female migrant workers for . However, for k = 4 or 5, the contributions of specific indicators, i.e., chronic diseases and housing overcrowding, were significantly higher for female migrant workers than for male migrant workers.
3.3. Gender Bias in Migrant Workers’ Relative Poverty
Descriptive statistics of the relative deprivation intensity and its explanatory variables are given in Table 4. The UCQR results of 25 (lower), 50 (middle), and 75 (higher) quantiles are reported in Table 5.
Table 4.
Statistics of the variables.
Table 5.
Results for the UCQR of migrant workers’ relative poverty.
Generally speaking, age, public living facilities, medical expenditure, appearance, Mandarin proficiency, news attention, and social status identification had different effects on male and female migrant workers in different poverty distributive statuses, which are described in more detail below.
Age. Age had a significant positive effect on the relative poverty of male and female migrant workers. More specifically, the impact of age on the relative poverty of female migrant workers presented an “inverted U” shape across the different quantiles. In contrast, the effect of age on the relative poverty of male migrant workers increased slowly. By comparing the sizes of the age estimation coefficients, it can be seen that the impact of age on the relative poverty of female migrant workers was greater than that for male migrant workers for each quantile, indicating that the relative poverty of female migrant workers was more sensitive to age.
Access to public living facilities. Public living facilities had no significant effect on female migrant workers but had a significant positive effect on male migrant workers; the regression coefficient increased from the lower to the higher quantiles, indicating that good public living facilities can promote poverty reduction among male migrant workers.
Medical expenditure. Medical expenditure had a significant positive impact on female migrant workers at the high quantile level and significantly impacted male migrant workers at all quantile levels. Moreover, the regression coefficients for male migrant workers were greater than those for female migrant workers at all quantile levels. Additionally, the regression coefficient for medical expenditure for male migrant workers showed a first decreasing and then increasing trend from the lower to the higher quantiles, but the overall trend was not significant.
Mandarin proficiency. Mandarin proficiency had a significant negative effect on female migrant workers in the middle and low quantiles and significantly affected male migrant workers in the high quantile. Its impact on the relative poverty of female migrant workers decreased from the lower to the higher quantiles. In comparison, its effect on the relative poverty of male migrant workers increased from the lower to the higher quantiles.
Appearance. Appearance significantly affected female migrant workers’ relative poverty in the low and middle quantiles (the effect was lower in the median quantile than in the low quantile). In contrast, it significantly affected male migrant workers’ relative poverty in the middle and high quantiles. These results indicate that appearance had a more significant effect on poverty reduction for female migrant workers with lower poverty levels. It had a more significant effect on poverty reduction for male migrant workers with higher poverty levels.
News attention. News attention had significant negative effects on the relative poverty of both male and female migrant workers. The regression coefficients for male and female migrant workers showed a decreasing trend. Additionally, the impact of news attention on the relative poverty of male migrant workers was greater than that of female migrant workers.
Social status. Social status had a significant negative effect on both female and male migrant workers, and both genders showed the highest regression coefficients in the middle quantile. Moreover, the regression coefficients of female migrant workers were higher than those of male migrant workers at each quantile level.
3.4. Characteristic-Led Gender Bias and Gender Discrimination
UCQR decomposition results (including the overall and itemized characteristic and coefficient effects) are reported in Table 6. Model 1 in Table 6 shows decomposition coefficients of 25 (low), 50 (middle), and 75 (high) quantiles, and Model 2 shows the differences in the decomposition coefficients among three quantile levels (75-25, 50-25, and 75-50 quantiles).
Table 6.
Results of the UCQR decomposition of migrant workers’ relative poverty.
Generally speaking, as shown in Model 2, the differences between the upper and median quantiles were the largest among all quantile differences, further indicating the “sticky floor effect” of relative poverty. Here, the latter effect means that the differences in poverty levels of migrant workers of different genders were larger at the top of the poverty distribution. The poverty gap for migrant workers of different genders was more evident in migrant workers with higher poverty levels.
It can be seen from Model 1 that the explicable part of the three quantile levels was marginally negative, meaning that the characteristic effect reduced the gender bias slightly. According to the itemized effects, although the impact of each explanatory variable on gender bias changed across the different quantile levels, factors such as appearance, social status, and living facilities contributed little to gender bias. At the same time, the inexplicable part of each quantile level was significantly positive, indicating that the coefficient effect (or gender discrimination) enlarged the poverty gender bias. Gender discrimination based on age and access to public living facilities contributed the most to gender bias. Moreover, age and social status identification contributions to gender discrimination decreased from the lower quantile level to the higher quantile levels. In contrast, the contributions of public living facility access, medical expenditure, Mandarin proficiency, appearance, and news sensitivity to gender discrimination increased from the lower quantile level to the higher quantile levels.
Figure 2 vividly depicts the decomposed characteristic effect and coefficient effect at each quantile level (0–100). The characteristic effect decreases from lower to higher quantiles, fluctuating slightly below zero. Conversely, the coefficient effect decreases and then increases after the 35 quantile level to a high-above-zero value, making the total gender bias almost always significantly positive and exhibiting the form of a U-shaped curve. Such trends indicate that the coefficient effect (or gender discrimination) is a fundamental reason for gender bias in migrant workers’ relative poverty.
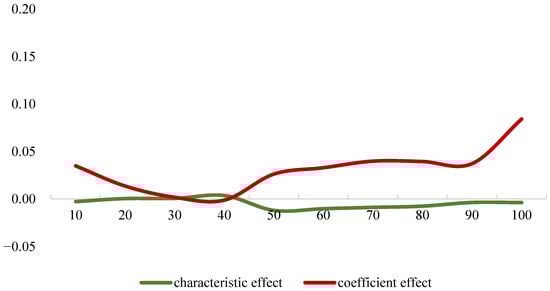
Figure 2.
Variation in characteristic and coefficient effects.
4. Discussion
4.1. Main Findings
This study provides an overview of the relative poverty status of Chinese migrant workers, especially with regard to gender differences, using a multidimensional index system. Contrary to conventional thinking [22,34] that women are poorer than men, the results of this study show that the relative poverty index of male migrant workers was much higher than (almost twice) that of female migrant workers if a small multidimensional cutoff value was assigned. Despite such gender differences, the contributions of the various indicators were approximately similar between the two genders. However, for larger multidimensional cutoff values, the relative poverty index of female migrant workers surpassed that of male migrant workers, and indicators such as chronic disease and rural–urban discrimination contributed much more to female migrant workers’ relative poverty than to that of male migrant workers. This result indicates that male and female migrant workers face different relative poverty realities: male workers are prominently poor in specific dimensions (e.g., income, non-academic education, and Internet use), while deprivation of female migrant workers is less but has more severe consequences, and the most significant risks might result from the effects of chronic disease and rural–urban discrimination.
To further illustrate such differences and validate the existence of gender bias, this study establishes an explanatory model of migrant workers’ relative poverty by comparing counter-factual groups, which validates the existence of gender bias. Moreover, this study also finds that gender bias has a “sticky floor effect:” the more severe the poverty, the more influential the gender bias. Looking closer at the latter, we find two accounts: the characteristic effect, indicating the gender bias brought about by gender characteristics in the explanatory variables, such as age, public facilities access, media expenditure, appearance, Mandarin proficiency, and news sensitivity, and the coefficient effect, indicating the inexplicable part of the relationship between those already mentioned variables and poverty; we describe this as gender discrimination. More importantly, gender discrimination (the coefficient effect) surpasses the characteristic-led bias to become the more significant component of gender bias.
Altogether, when integrating the gender difference and gender bias results relating to migrant workers’ relative poverty, we find that gender differences can be interpreted as a combination of gender bias (resulting mainly from gender discrimination) and empowerment activities to reduce poverty. In this study, Chinese female migrant workers managed to combat poverty autonomously, despite gender bias, thus gaining a better-off status compared to male migrant workers.
4.2. Theoretical Implications
This study contributes to optimizing the measurement of migrant workers’ relative poverty levels and their corresponding gender differences, as advocated by several researchers [32,35]. The most noticeable difference in the results obtained by the present study compared with previous studies lies in the fact that this study “relates” migrant workers’ affluence to that of a city’s local (long-term) residents, rather than to that of their hometown fellow residents. Moreover, the multidimensional indicators employed in this study include income indicators and cover many important aspects of migrant workers’ lives, work, and personal development. Additionally, the majority of previous research on female poverty used data from ”female-head households” (FHHs, see, for example, [86]), not touching on females in male-head households yet also introducing severe bias from external factors (e.g., accidents, diseases, or divorces leading to the FHHs) [7]. The current study addresses the limitations incurred by using only FHHs, applying data from individual female and male migrant workers to offer a more general and clear view of how female and male migrant workers are separately challenged by their poverty characteristics. Such a measurement discloses migrant workers’ “real” poverty status: although their incomes may be relatively higher than those of their hometown fellow residents, and their incomes are above the poverty line, they are still more deprived and vulnerable in many aspects than the local residents in the cities where they live and work. More importantly, gender differences exist between male and female migrant workers.
This study also provides in-depth data and calculated results that illustrate gender differences in migrant workers’ relative poverty. Our study responds to Bradshaw et al.’s (2017) [7] suggestion that work on measurements can reveal women’s relative poverty status and proceeds several steps forward by revealing three facets of female migrant workers’ relative poverty: (i) they are relatively poorer than the local residents of the cities where they have migrated to; (ii) their poverty status is different from that of male migrant workers; and (iii) during their struggle out of relative poverty, they face gender bias not only because of their feminine characteristics but also due to more explicit factors (i.e., gender discrimination); however, they still attain a better-off status than their male migrant “co-workers.” Therefore, three layers of indicators/effects (gender-differentiated relative poverty, gender bias, and characteristic-led gender bias vs. gender discrimination) were highlighted using decomposition analysis of levels of deprivation, which offers a valuable schema when examining gender-differentiated poverty in any nation/region to achieve a more comprehensive overview of the relationships between gender and relative poverty.
Our analysis describes a highly complex gender-differentiated relative poverty status among Chinese migrant workers. It incorporates previous analyses of a less poor (see, for example, [32,33]) and more discriminated-against female group (see, for example, [7,24,32]) to reveal the complex status of the “feminization of poverty.” Therefore, gender differences in relation to poverty should be distinguished from gender bias. Our study found that, from certain viewpoints, females were less poor than males, which does not imply the non-existence of poverty gender bias, which might still linger and severely impact migrant workers. Moreover, the integrated findings in this study also suggest that, despite significant gender bias in female migrant workers’ opportunities to attain a better-off status, they still manage to perform better in combating poverty. Based on these findings, we advocate viewing the deprived as not being “victims” of development deprivation but rather as enablers managing their, albeit limited, resources to lessen the effects of poverty.
The current study additionally offers some implications on the dynamics, the motivations, and the outcomes of working migration. Previous literature has extended the fundamental reason for migration from an income gap between the migration source and destination to a well-being gap (or multidimensional poverty gap) between the two places [29]. The present study implies that a relative well-being gap could explain migration mobility [18,31]. Moreover, the current study advocates further research on outcomes led by gender differences in migrant workers’ relative poverty. For instance, those differences may promote the preference differentiation of migrating destinations for different gender groups, and the mobility divergence within one household could lead to in-depth impacts on agricultural households’ lifestyles.
4.3. Practical Implications
Considering that most poverty-reduction measurements are gender-neutral, the present study demonstrates the necessity of gender-differentiated poverty reduction solutions. For example, despite the common challenges facing Chinese female and male migrant workers (such as the decoupling of labor productivity and income resulting from lack of non-academic education, employer-provided housing funds and job insurances, and participation in organizations [87]), the levels of male migrant workers’ relative poverty are severe in certain specific aspects, ranging over various dimensions, while female workers are potentially more challenged by chronic diseases and urban–rural discrimination. Therefore, it would be more effective for governments and not-for-profit organizations to initiate and execute targeted plans to lift female migrant workers out of relative poverty.
Moreover, poverty reduction solutions should be targeted according to the different subdivisions of relative poverty. For example, government transfers and organizational donations could play an essential role in helping the most deprived subgroup of female migrant workers, who, according to the “sticky floor” effect, are suffering the most severe gender bias and are lacking basic needs for guaranteed dignity and autonomy of life. However, as implied by this study’s results, the well-off status and gender bias (especially gender discrimination) of female migrant workers have been diverging in recent years, which can possibly be explained by their accumulated levels of self-awareness and self-empowerment: they automatically combat poverty by better allocating their work capacities, income, assets, and social networks, despite existing in less-than-advantaged environments. Such a phenomenon draws the poverty reduction devotions out of a payment transfer and provides opportunities for success for government and not-for-profit organizations administering empowerment projects. In China, although empowerment projects have helped many female farmers/city residents out of poverty, they do not specifically target female migrant workers, nor do they conduct specific measurements of working women moving from rural to urban environments. Thus, government and not-for-profit organizations should initiate additional empowerment projects to devote more attention and resources to the needs of such female migrant workers. Themes of empowerment projects can include: vocational development, such as free career training (to help upgrade work capacity and thus increase earning power); entrepreneurship, such as policy incentives for female-owned agriculture companies (to help start businesses and work near their homes) [88], and support for financial technology usage (to help collect their finance capital more conveniently and at lower costs) [89]; lifestyle, such as public-supported childcare (to allow more time and effort to be devoted to their careers), and interest-free life loans (to reduce vulnerability when facing uncertainties such as shrinking job markets and ever-decreasing payments due to the COVID-19 pandemic).
Last but not least, relative poverty reduction is never a “once-and-for-all task” but a sustainable goal that humans strive to achieve together. In this regard, governments, not-for-profit organizations, and human society as a whole should work to provide those suffering deprivation with more public offerings (e.g., improvements in healthcare, living conditions, and educational opportunities), supervision (normalization of employment contracts and insurances), and better opportunities to live more satisfying lives (e.g., discrimination-free environments and a more open household registration system).
5. Conclusions
This study addresses the insufficiencies in research on migrant workers’ gender-differentiated relative poverty using an aggregation process (i.e., the A–F method to establish a multidimensional relative poverty model) followed by a decomposition process (the UCQR method to analyze an explanatory regression model of relative poverty). Generally, even when encountering gender discrimination, female migrant workers utilize their characteristic-led advantages and engage in autonomous poverty reduction activities. Thus, they are better off than male workers. This study offers the contemporary research community knowledge on relative poverty by uncovering the overall features of Chinese migrant workers’ gender-differentiated relative poverty levels, validating the existence of gender bias, and illustrating the decomposed gender bias accounts. This study also provides valuable suggestions on establishing targeted and sustainable poverty reduction solutions for governments and non-profit organizations.
This study still has limitations, which we believe offer opportunities for future research. More comprehensive investigations are advocated to offer more details for understanding female and male migrant workers’ relative poverty differences and their reasons. First, future research could update the multidimensional measurement model of migrant workers’ poverty that we developed in the current study to include more dimensions/indicators, such as security, recreational opportunities, and psychological health. Second, future research could consider the possibility that the redistribution of income and other resources within households, the spatial distribution of those workers’ migrating destinations, or workers’ migrating mobility (which the current study does not consider) could lead to the poverty differentiation between two gender groups. Third, researchers can conduct investigations in other countries to validate the present study’s findings or organize cross-country investigations to uncover more internal mechanisms of gender-differentiated poverty among migrant workers.
Author Contributions
Conceptualization, J.P. and J.C.; methodology, J.P.; software, J.P.; validation, J.P., J.C. and L.Z.; formal analysis, J.C.; resources, J.P.; data curation, J.P.; writing—original draft preparation, J.C.; writing—review and editing, J.C. and L.Z.; project administration, J.C.; funding acquisition, J.P. and L.Z. All authors have read and agreed to the published version of the manuscript.
Funding
This research was funded by National Natural Science Foundation of China (grant number 72063012), General Project of Humanities and Social Science of China’s Ministry of Education (grant number 20YJC790103), General Project of Science and Technology Research of Jiangxi Provincial Department of Education (grant number GJJ210526), and Postdoctoral Research Routine Funding Project of Jiangxi Province (grant number 2020RC23).
Institutional Review Board Statement
Ethical review and approval were waived for this study because it uses second-hand data collected from an open access database.
Informed Consent Statement
Consent was waived for this study because it uses second-hand data collected from an open access database.
Data Availability Statement
Data supporting reported results can be found at the open access database of China Family Panel Studies (CFPS). http://www.isss.pku.edu.cn/cfps/download (accessed on 30 April 2022).
Conflicts of Interest
The authors declare no conflict of interest.
Appendix A

Figure A1.
Overall research design.
Figure A1.
Overall research design.

References
- Coulthard, S.; Johnson, D.; McGregor, J.A. Poverty, sustainability and human wellbeing: A social wellbeing approach to the global fisheries crisis. Glob. Environ. Chang. 2011, 21, 453–463. [Google Scholar] [CrossRef]
- Moser, C.O. The asset vulnerability framework: Reassessing urban poverty reduction strategies. World. Dev. 1998, 26, 1–19. [Google Scholar] [CrossRef]
- Alkire, S.; Roche, J.M.; Ballon, P.; Foster, J.; Santos, M.E.; Seth, S. Multi-Dimensional Poverty Measurement and Analysis; Oxford University Press: New York, NY, USA, 2015. [Google Scholar]
- Alkire, S.; Seth, S. Selecting a targeting method to identify BPL households in India. Soc. Indic. Res. 2013, 112, 417–446. [Google Scholar] [CrossRef]
- Anand, S.; Sen, A. Concepts or human development and poverty! A multi-dimensional perspective. In Poverty and Human Development: Human Development Papers 1997; United Nations Development Programme: New York, NY, USA, 1997; pp. 1–20. [Google Scholar]
- Chambers, R. Whose Reality Counts? IT Publications: London, UK, 1996. [Google Scholar]
- Bradshaw, S.; Chant, S.; Linneker, B. Gender and poverty: What we know, don’t know, and need to know for Agenda 2030. Gend. Place Cult. 2017, 24, 1667–1688. [Google Scholar] [CrossRef]
- Crimmins, E.M.; Kim, J.K.; Seeman, T.E. Poverty and biological risk: The earlier “aging” of the poor. J. Gerontol. A-Biol. 2009, 64, 286–292. [Google Scholar] [CrossRef] [PubMed]
- Xu, D.; Deng, X.; Huang, K.; Liu, Y.; Yong, Z.; Liu, S. Relationships between labor migration and cropland abandonment in rural China from the perspective of village types. Land Use Policy 2019, 88, 104164. [Google Scholar] [CrossRef]
- Xu, D.; Guo, S.; Xie, F.; Liu, S.; Cao, S. The impact of rural laborer migration and household structure on household land use arrangements in mountainous areas of Sichuan Province, China. Habitat Int. 2017, 70, 72–80. [Google Scholar] [CrossRef]
- Massey, D.S.; Gross, A.B.; Shibuya, K. Migration, segregation, and the geographic concentration of poverty. Am. Sociol. Rev. 1994, 59, 425–445. [Google Scholar] [CrossRef]
- Wang, Q.; Su, M.; Li, R. Toward to economic growth without emission growth: The role of urbanization and industrialization in China and India. J. Clean. Prod. 2018, 205, 499–511. [Google Scholar] [CrossRef]
- Keung Wong, D.F.; Li, C.Y.; Song, H.X. Rural migrant workers in urban China: Living a marginalised life. Int. J. Soc. Welf. 2007, 16, 32–40. [Google Scholar] [CrossRef]
- Park, A.; Wang, D. Migration and urban poverty and inequality in China. China Econ. J. 2010, 3, 49–67. [Google Scholar] [CrossRef]
- Haan, A.D. Rural-urban migration and poverty: The case of india. IDS Bull.-I Dev. Stud. 1997, 28, 35–47. [Google Scholar] [CrossRef]
- Xu, D.; Yong, Z.; Deng, X.; Zhuang, L.; Qing, C. Rural-urban migration and its effect on land transfer in rural China. Land 2020, 9, 81. [Google Scholar] [CrossRef]
- Xu, D.; Peng, L.; Liu, S.; Su, C.; Wang, X.; Chen, T. Influences of migrant work income on the poverty vulnerability disaster threatened area: A case study of the Three Gorges Reservoir area, China. Int. J. Disast. Risk Reduct. 2017, 22, 62–70. [Google Scholar] [CrossRef]
- Zezza, A.; Carletto, G.; Davis, B. Moving away from poverty: A spatial analysis of poverty and migration in Albania. J. South. Eur. Balk. 2005, 7, 175–193. [Google Scholar] [CrossRef]
- Lokshin, M.; Bontch-Osmolovski, M.; Glinskaya, E. Work-related migration and poverty reduction in Nepal. Rev. Dev. Econ. 2010, 14, 323–332. [Google Scholar] [CrossRef]
- Qi, L.; Dong, X.Y. Gender, low-paid status, and time poverty in urban China. Fem. Econ. 2018, 24, 171–193. [Google Scholar] [CrossRef]
- Dobrowolsky, A. Women, Migration and Citizenship: Making Local, National and Transnational Connections; Routledge: London, UK, 2016. [Google Scholar]
- Gornick, J.C.; Jäntti, M. Women, poverty, and social policy regimes: A cross-national analysis. In Luxembourg Income Study (LIS) Working Paper Series; LIS: Luxembourg, 2010; No. 534. [Google Scholar]
- Murphy, S. Glass ceilings and iron bars: Women, gender, and poverty in the post-2015 development agenda. Glob. Justice Theory Pract. Rhetor. 2015, 8, 74–96. [Google Scholar] [CrossRef]
- Nieuwenhuis, R.; Munzi, T.; Neugschwender, J.; Omar, H.; Palmisano, F. Gender equality and poverty are intrinsically linked: A contribution to the continued monitoring of selected sustainable development goals. In Luxembourg Income Study (LIS) Working Paper Series; LIS: Luxembourg, 2019; No. 759. [Google Scholar]
- Baulch, B. The New Poverty Agenda: A Disputed Consensus. IDS Bull.-I Dev. Stud. 1996, 27, 1–10. [Google Scholar] [CrossRef][Green Version]
- Foster, J.E. Absolute versus relative poverty. Am. Econ. Rev. 1998, 88, 335–341. [Google Scholar]
- Sen, A. Poverty: An ordinal approach to measurement. Econometrica 1976, 44, 219–231. [Google Scholar] [CrossRef]
- Alkire, S.; Foster, J. Counting and multi-dimensional poverty measurement. J. Public Econ. 2011, 95, 476–487. [Google Scholar] [CrossRef]
- Ellis, F. A Livelihoods Approach to Migration and Poverty Reduction. Paper Commissioned by the Department for International Development (Contract No: CNTR 03 4890). 2003. Available online: http://citeseerx.ist.psu.edu/viewdoc/download?doi=10.1.1.553.5678&rep=rep1&type=pdf (accessed on 10 June 2021).
- Stecklov, G.; Winters, P.; Stampini, M.; Davis, B. Do conditional cash transfers influence migration? A study using experimental data from the Mexican PROGRESA program. Demography 2005, 42, 769–790. [Google Scholar] [CrossRef] [PubMed]
- Foulkes, M.; Schafft, K.A. The impact of migration on poverty concentrations in the United States, 1995–2000. Rural Sociol. 2010, 75, 90–110. [Google Scholar] [CrossRef]
- Quisumbing, A.R.; Haddad, L.J.; Peña, C. Gender and poverty: New evidence from 10 developing countries. In Food Consumption and Nutrition Division Discussion Papers; International Food Policy Research Institute (IFPRI): Washington, DC, USA, 1995; No. 583-2016-39551. [Google Scholar]
- Montoya, Á.J.A.; Teixeira, K.M.D. Multidimensional poverty in Nicaragua: Are female-headed households better off? Soc. Indic. Res. 2017, 132, 1037–1063. [Google Scholar] [CrossRef]
- Marcoux, A. The feminization of poverty: Claims, facts, and data needs. Popul. Dev. Rev. 1998, 24, 131–139. [Google Scholar] [CrossRef]
- Chant, S. New Contributions to the Analysis of Poverty: Methodological and Conceptual Challenges to Understanding Poverty from a Gender Perspective; Economic Commission for Latin America: Santiago, Chile, 2003. [Google Scholar]
- Casper, L.M.; McLanahan, S.S.; Garfinkel, I. The gender-poverty gap: What we can learn from other countries. Am. Sociol. Rev. 1994, 59, 594–605. [Google Scholar] [CrossRef]
- Jiang, N.; Zheng, W. Multi-dimensional poverty measurement for Chinese rural migrant workers that return to poverty. Chin. Rural Econ. 2017, 33, 58–69. [Google Scholar]
- Wang, Q.; Liu, S. Multidimensional poverty and inequality of migrant workers in urban areas. J. Quant. Tech. Econ. 2020, 37, 83–101. [Google Scholar]
- Cao, M.; Xu, D.; Xie, F.; Liu, E.; Liu, S. The influence factors analysis of households’ poverty vulnerability in southwest ethnic areas of China based on the hierarchical linear model: A case study of Liangshan Yi autonomous prefecture. Appl. Geogr. 2016, 66, 144–152. [Google Scholar] [CrossRef]
- Wu, L.; Luo, C. Mental health and the multidimensional poverty of migrant workers in cities. J. South China Agric. Univ. 2021, 20, 84–95. [Google Scholar]
- Peng, J.; Zhang, L.; Chen, S. Study on the intergenerational differences of relative poverty among migrant workers in cities—Decomposition method based on RIF Unconditional Quantile Regression. Collect. Essays Financ. Econ. 2020, 20, 3–12. [Google Scholar]
- Peng, J. Measurement and decomposition of migrant workers’ multi-dimensional poverty from the perspective of industry heterogeneity. Stat. Decis. 2021, 37, 57–62. [Google Scholar]
- Kuai, P.; Zhang, L. Gender wage differentials of migrant workers and its origins: Would discrimination make a notable difference? Issues Agric. Econ. 2016, 37, 43–50+111. [Google Scholar]
- Alkire, S.; Foster, J. Understandings and misunderstandings of multi-dimensional poverty measurement. J. Econ. Inequal. 2011, 9, 289–314. [Google Scholar] [CrossRef]
- Afrakhteh, H.; Jalalian, H.; Tahmasebi, A.; Armand, M. Evaluation of multi-dimensional poverty (capability) in rural areas of Hamadan County by using Alkire and Foster method. Hum. Geogr. Res. 2019, 51, 989–1010. [Google Scholar]
- Maduekwe, E.; de Vries, W.T.; Buchenrieder, G. Measuring human recognition for women in Malawi using the Alkire Foster method of multi-dimensional poverty counting. Soc. Indic. Res. 2020, 147, 805–824. [Google Scholar] [CrossRef]
- Wang, W.; Luo, X.; Zhang, C.; Song, J.; Xu, D. Can Land Transfer Alleviate the Poverty of the Elderly? Evidence from Rural China. Int. J. Environ. Res. Public Health 2021, 18, 11288. [Google Scholar] [CrossRef]
- Alkire, S.; Foster, J. Counting and multidimensional poverty. In Oxford Poverty & Human Development Initiative (OPHI) Working Paper; OPHI: Oxford, UK, 2009; No. 32. [Google Scholar]
- Alkire, S.; Shen, Y. Exploring multi-dimensional poverty in China: 2010 to 2014. In Research on Economic Inequality; Bandyopadhyay, S., Ed.; Emerald Publishing Limited: Bingley, UK, 2017; Volume 25, pp. 161–228. [Google Scholar]
- Huang, F.; Wang, Z.; Liu, J.; Shuai, C.; Li, W. Exploring rural energy choice from the perspective of multi-dimensional capabilities: Evidence from photovoltaic anti-poverty areas in rural China. J. Clean. Prod. 2021, 283, e124586. [Google Scholar] [CrossRef]
- Zeng, X.; Fu, Z.; Deng, X.; Xu, D. The Impact of Livelihood Risk on Farmers of Different Poverty Types: Based on the Study of Typical Areas in Sichuan Province. Agriculture 2021, 11, 768. [Google Scholar] [CrossRef]
- Akay, A.; Giulietti, C.; Robalino, J.D.; Zimmermann, K.F. Remittances and well-being among rural-to-urban migrants in China. Rev. Econ. Househ. 2014, 12, 517–546. [Google Scholar] [CrossRef]
- Poncet, S. Provincial migration dynamics in China: Borders, costs and economic motivations. Reg. Sci. Urban Econ. 2006, 36, 385–398. [Google Scholar] [CrossRef]
- Tombe, T.; Zhu, X. Trade, migration, and productivity: A quantitative analysis of china. Am. Econ. Rev. 2019, 109, 1843–1872. [Google Scholar] [CrossRef]
- Tuñón, M. Internal Labour Migration in China: Features and Responses; ILO office: Beijing, China, 2006. [Google Scholar]
- Söhn, J.; Prekodravac, M. Upward, lateral, or downward? Multiple perspectives on migrants’ educational mobilities. Soc. Incl. 2021, 9, 140–151. [Google Scholar] [CrossRef]
- Trzcinski, E.; Randolph, S. Human capital investments and relative earnings mobility: The role of education, training, migration, and job search. Econ. Dev. Cult. Chang. 1991, 40, 153–168. [Google Scholar] [CrossRef]
- Tulloch, O.; Machingura, F.; Melamed, C. Health, Migration and the 2030 Agenda for Sustainable Development. 2016. Available online: https://kmhub.iom.int/sites/default/files/health_and_migration.pdf (accessed on 10 June 2021).
- Gao, S.; Guo, C.; Zhang, Q. Social exclusion, human ritual expenses and multidimensional poverty alleviation of migrant workers. Financ. Econ. 2018, 18, 110–120. [Google Scholar]
- Gao, Q.; Yang, S.; Li, S. Labor contracts and social insurance participation among migrant workers in China. China Econ. Rev. 2012, 23, 1195–1205. [Google Scholar] [CrossRef]
- He, S. The construction of measurement index system for urban poverty of migrant workers—Based on multi-dimensional perspective. Chin. Public Adm. 2018, 38, 107–112. [Google Scholar]
- Gilbert, N. European measures of poverty and “social exclusion”: Material deprivation, consumption, and life satisfaction. J. Policy. Anal. Manag. 2009, 28, 738–744. [Google Scholar] [CrossRef]
- Martin, K.D.; Hill, R.P. Life satisfaction, self-determination, and consumption adequacy at the bottom of the pyramid. J. Consum. Res. 2012, 38, 1155–1168. [Google Scholar] [CrossRef]
- Zhang, L. Economic migration and urban citizenship in China: The role of points systems. Popul. Dev. Rev. 2012, 38, 503–533. [Google Scholar] [CrossRef]
- Wang, Z.; Zhang, F.; Wu, F. Intergroup neighbouring in urban China: Implications for the social integration of migrants. Urban Stud. 2016, 53, 651–668. [Google Scholar] [CrossRef]
- Blackden, C.M. Gender, growth, and poverty reduction. In Africa Region Findings & Good Practice Infobriefs; World Bank Publications: Washington, DC, USA, 1999; No. 129. [Google Scholar]
- Knodel, J.; Ofstedal, M.B. Gender and aging in the developing world: Where are the men? Popul. Dev. Rev. 2003, 29, 677–698. [Google Scholar] [CrossRef]
- Stone, R. The feminization of poverty among the elderly. Women’s Stud. Q. 1989, 17, 20–34. [Google Scholar]
- Eneh, O.C.; Nkamnebe, A.D. Gender gap and sustainable human development in Nigeria: Issues and strategic choices. Asian J. Rural Dev. 2011, 1, 41–53. [Google Scholar] [CrossRef]
- Fodor, E. A different type of gender gap: How women and men experience poverty. East Eur. Polit. Soc. 2006, 20, 14–39. [Google Scholar] [CrossRef]
- Peng, Y.; Chang, W.; Zhou, H.; Hu, H.; Liang, W. Factors associated with health-seeking behavior among migrant workers in Beijing, China. BMC Health Serv. Res. 2010, 10, 69. [Google Scholar] [CrossRef]
- Case, A.; Deaton, A. Consumption, Health, Gender, and Poverty; World Bank Publications: Washington, DC, USA, 2003; No. 3020. [Google Scholar]
- Emmett, T. Disability, poverty, gender and race. Disabil. Soc. Chang. A S. Afr. Agenda 2006, 17, 207–233. [Google Scholar]
- Whitehead, M.; Dahlgren, G.; Evans, T. Equity and health sector reforms: Can low-income countries escape the medical poverty trap? Lancet 2001, 358, 833–836. [Google Scholar] [CrossRef]
- Iyer, A.; Sen, G.; Östlin, P. The intersections of gender and class in health status and health care. Glob. Public Health 2008, 3, 13–24. [Google Scholar] [CrossRef]
- Shannon, M.L.; Stark, C.P. The influence of physical appearance on personnel selection. Soc. Behav. Personal. 2003, 31, 613–623. [Google Scholar] [CrossRef]
- Heilman, M.E.; Saruwatari, L.R. When beauty is beastly: The effects of appearance and sex on evaluations of job applicants for managerial and nonmanagerial jobs. Organ. Behav. Hum. Perform. 1979, 23, 360–372. [Google Scholar] [CrossRef]
- Kim, S.H.O.; Ehrich, J.; Ficorilli, L. Perceptions of settlement wellbeing, language proficiency, and employment: An investigation of immigrant adult language learners in Australia. Int. J. Intercult. Rel. 2012, 36, 41–52. [Google Scholar] [CrossRef]
- Roshid, M.M.; Chowdhury, R. English language proficiency and employment: A case study of Bangladeshi graduates in Australian employment market. Mevlana Int. J. Educ. 2013, 3, 68–81. [Google Scholar] [CrossRef]
- Wu, L. Social network effects on productivity and job security: Evidence from the adoption of a social networking tool. Inform. Syst. Res. 2013, 24, 30–51. [Google Scholar] [CrossRef]
- Qiu, P.; Caine, E.; Yang, Y.; Chen, Q.; Li, J.; Ma, X. Depression and associated factors in internal migrant workers in China. J. Affect. Disord. 2011, 134, 198–207. [Google Scholar] [CrossRef]
- Jann, B. The Blinder–Oaxaca decomposition for linear regression models. Stata J. 2008, 8, 453–479. [Google Scholar] [CrossRef]
- Firpo, S.; Fortin, N.M.; Lemieux, T. Unconditional quantile regressions. Econometrica 2009, 77, 953–973. [Google Scholar]
- Koenker, R.; Bassett, G. Regression quantile. Econometrica 1978, 46, 33–50. [Google Scholar] [CrossRef]
- DiNardo, J.; Fortin, N.M.; Lemieux, T. Labor market institutions and the distribution of wages, 1973–1992: A semiparametric approach. Econometrica 1996, 64, 1001–1044. [Google Scholar] [CrossRef]
- Çağatay, N. Gender and poverty. In Undp Working Paper Series, Social Development and Poverty Elimination Division; UNDP: New York, NY, USA, 1998; No. 5. [Google Scholar]
- Gil-Alana, L.A.; Škare, M.; Claudio-Quiroga, G. Innovation and knowledge as drivers of the ‘great decoupling’ in China: Using long memory methods. J. Innov. Knowl. 2020, 5, 266–278. [Google Scholar] [CrossRef]
- Aibar-Guzmán, B.; García-Sánchez, I.; Aibar-Guzmán, C.; Hussain, N. Sustainable product innovation in agri-food industry: Do ownership structure and capital structure matter? J. Innov. Knowl. 2022, 7, 100160. [Google Scholar] [CrossRef]
- Ye, Y.; Chen, S.; Li, C. Financial technology as a driver of poverty alleviation in China: Evidence from an innovative regression approach. J. Innov. Knowl. 2022, 7, 100164. [Google Scholar] [CrossRef]


Publisher’s Note: MDPI stays neutral with regard to jurisdictional claims in published maps and institutional affiliations. |
© 2022 by the authors. Licensee MDPI, Basel, Switzerland. This article is an open access article distributed under the terms and conditions of the Creative Commons Attribution (CC BY) license (https://creativecommons.org/licenses/by/4.0/).