
Dielectric Properties of Hydrothermally Modified Potato, Corn, and Rice Starch

 , , , ,
Abstract
:1. Introduction
2. Materials and Methods
2.1. Sample Preparations
2.2. Sample Characterizations
3. Results and Discussion
3.1. Dielectric Constant and Loss Factor over 5 Hz–5 MHz
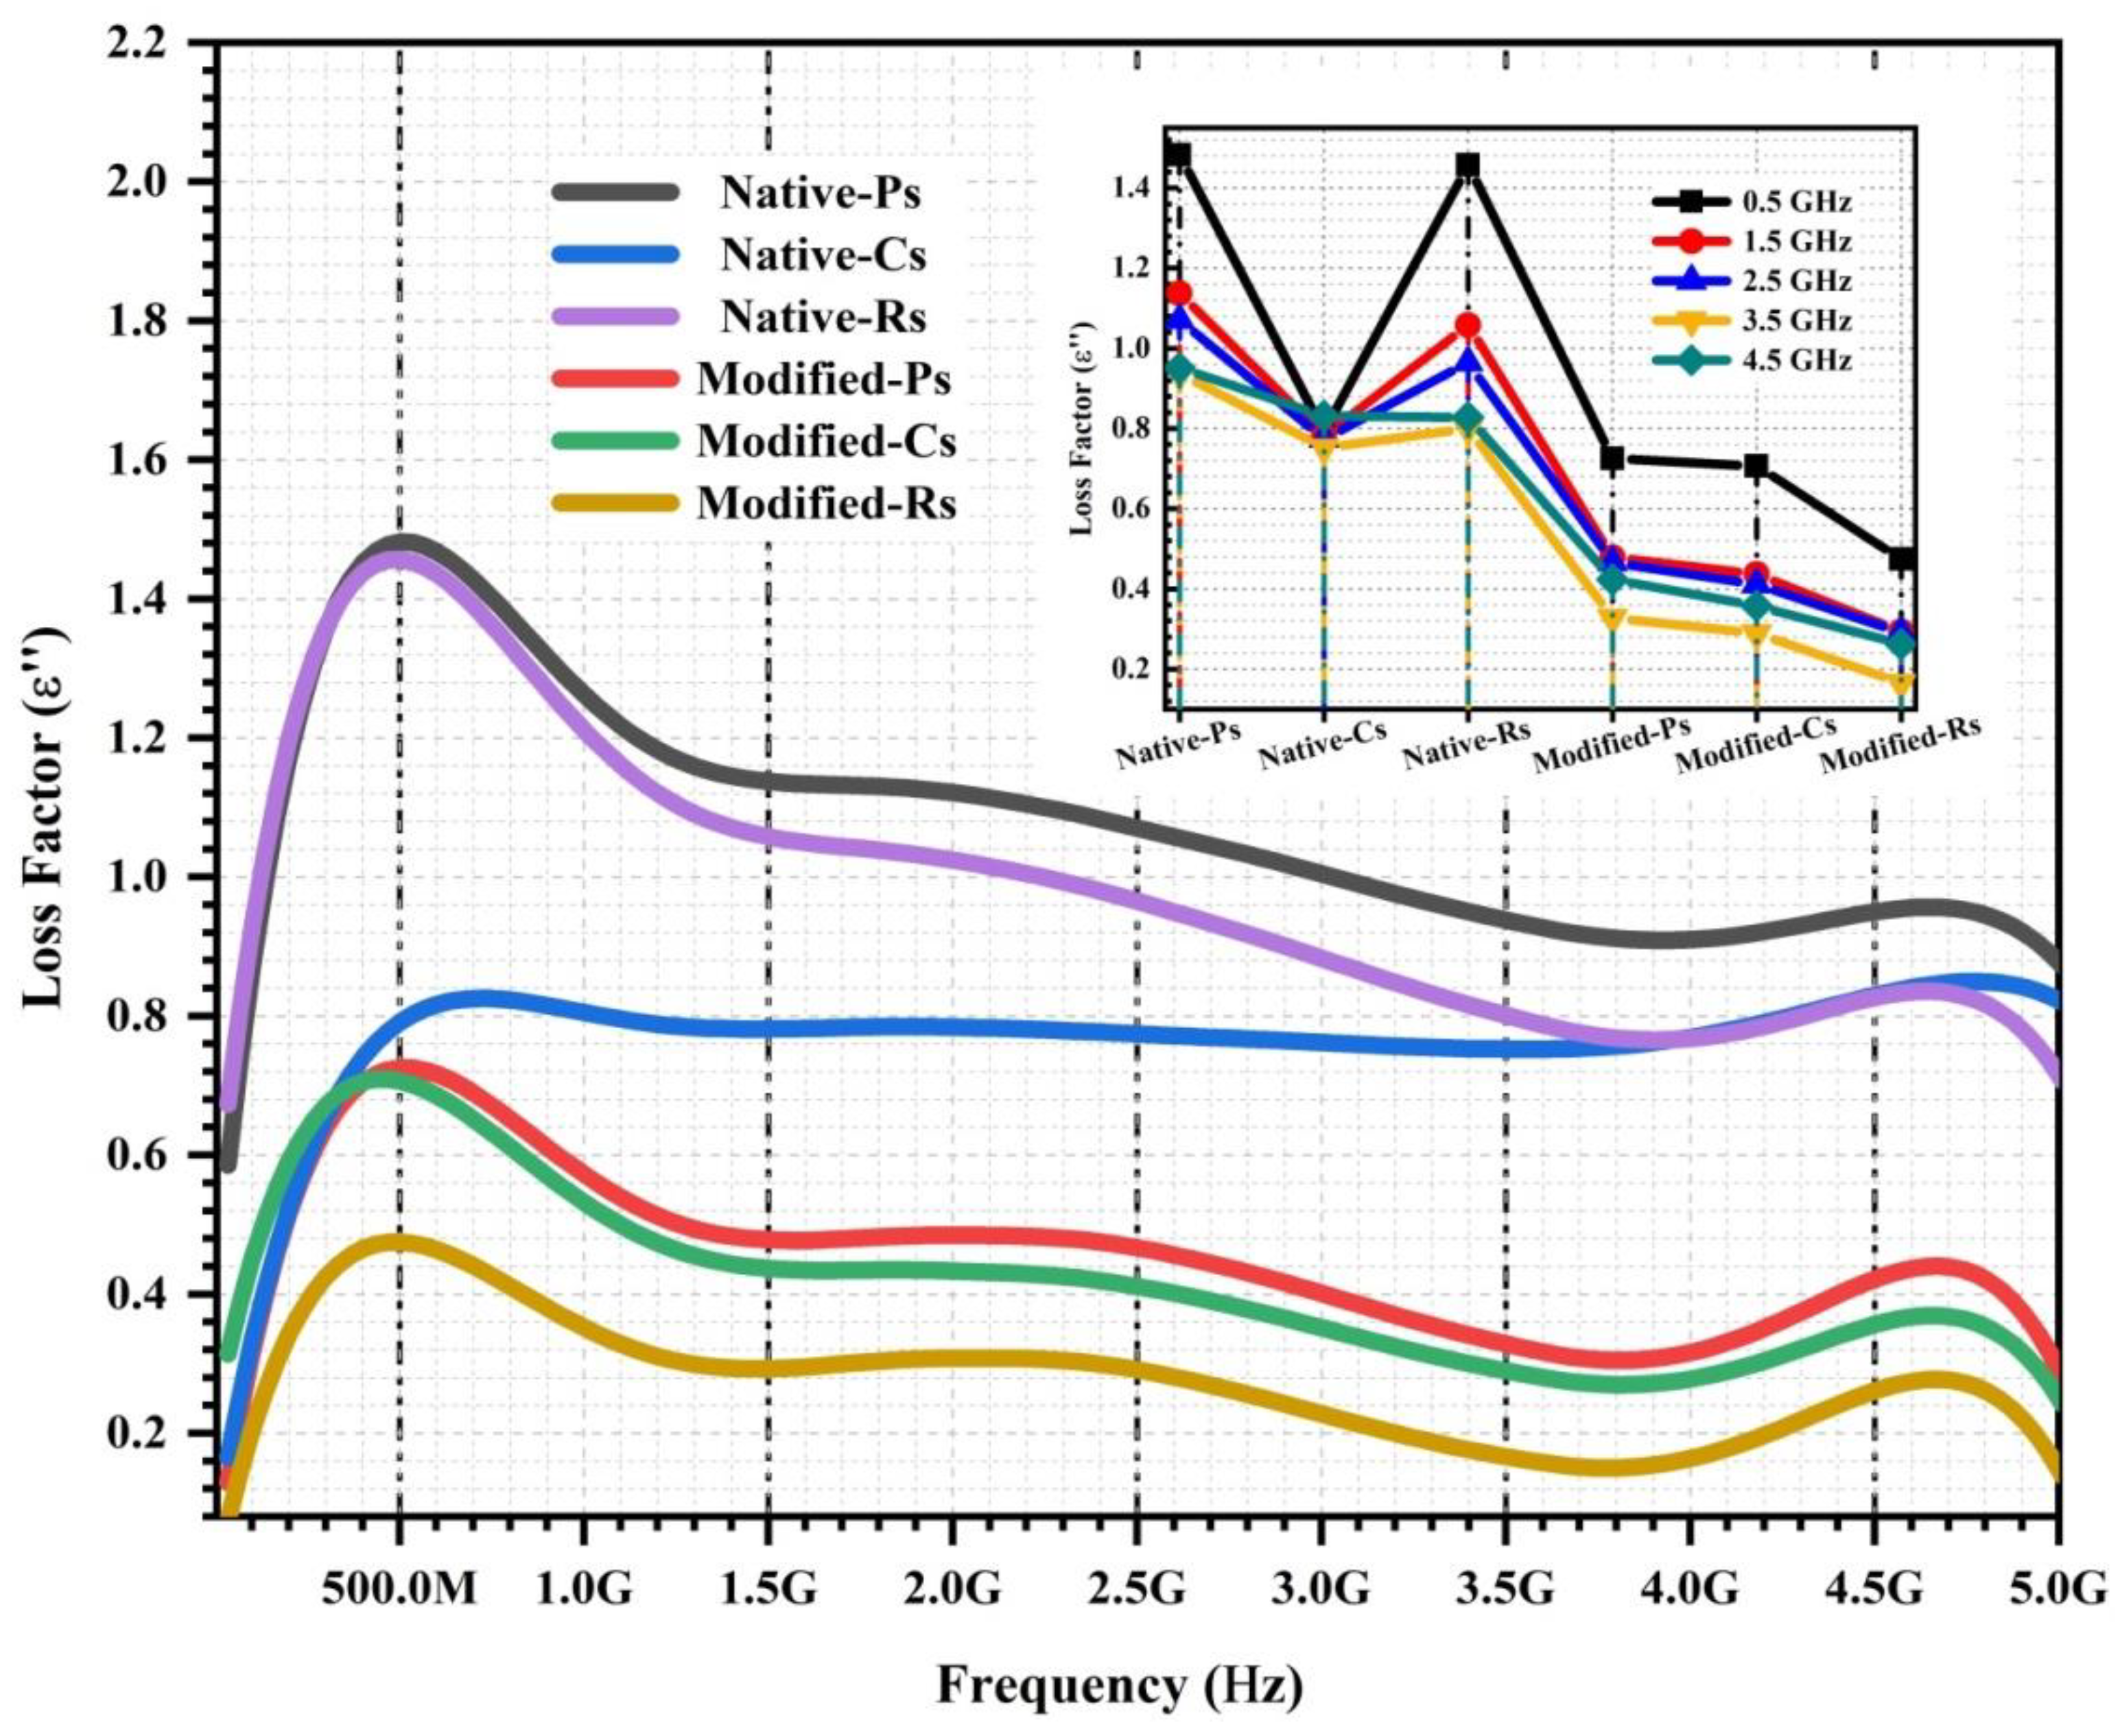
3.2. Dielectric Constant and Loss Factor over 5 MHz–5 GHz
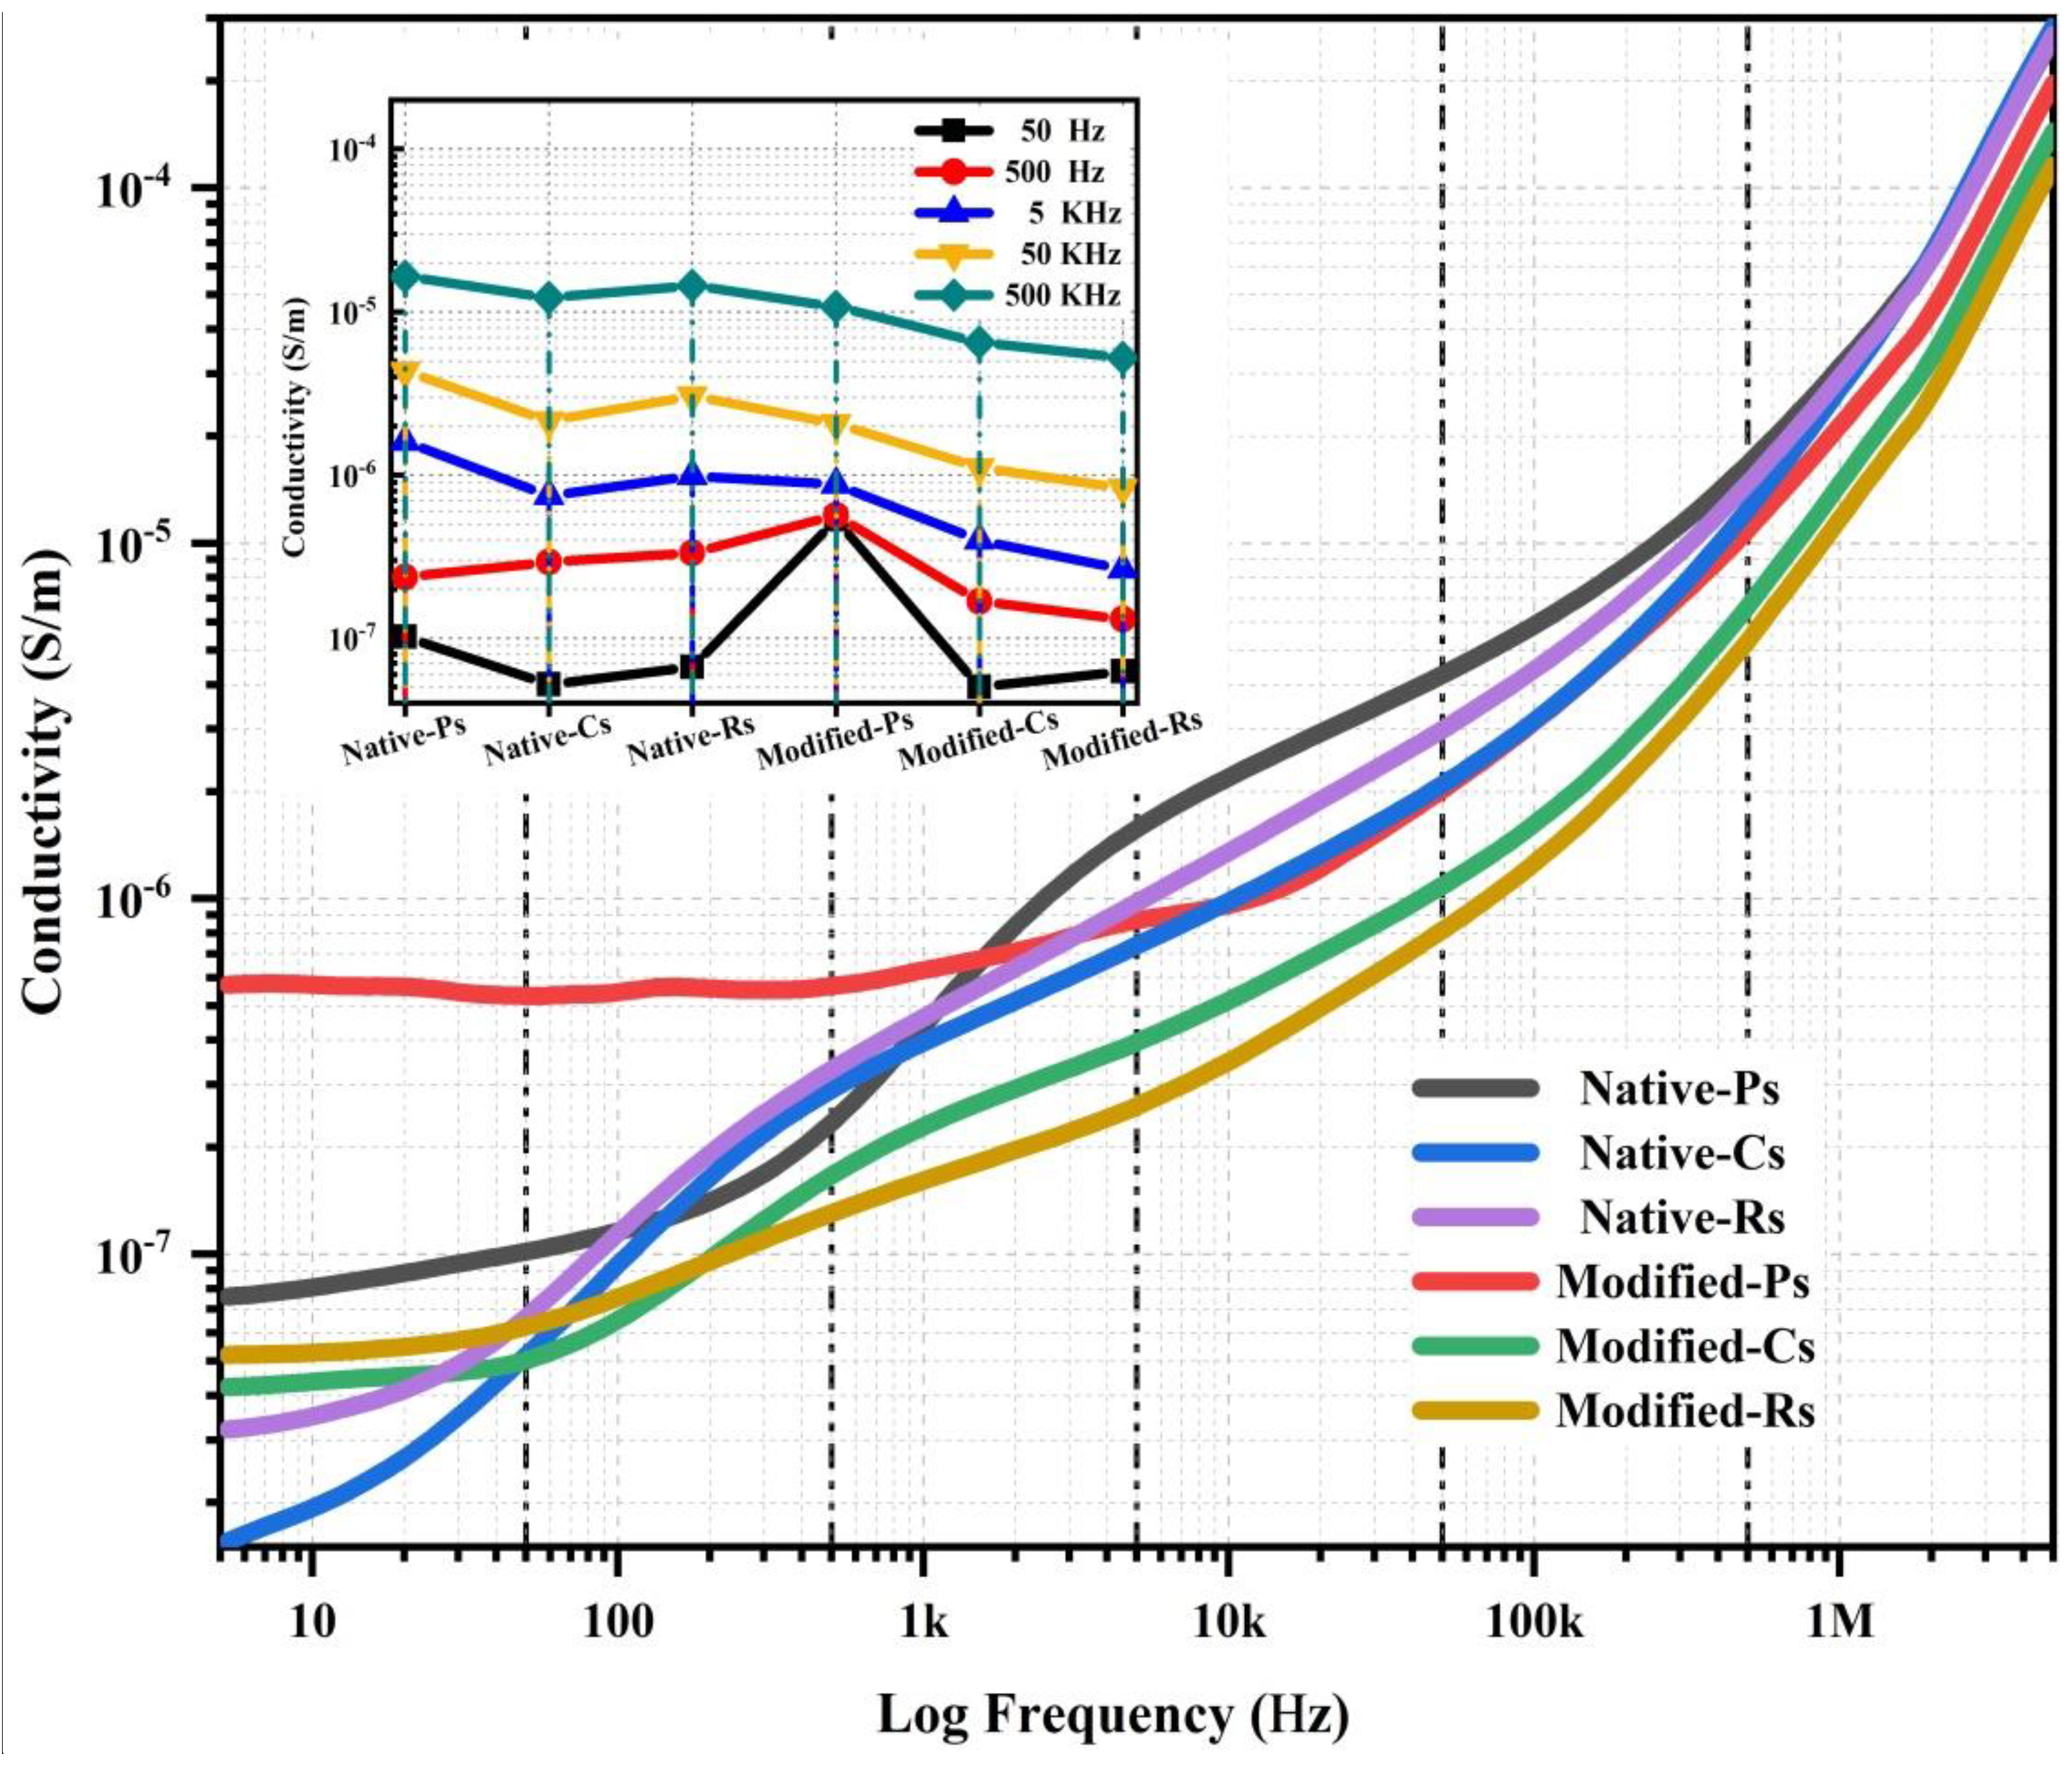
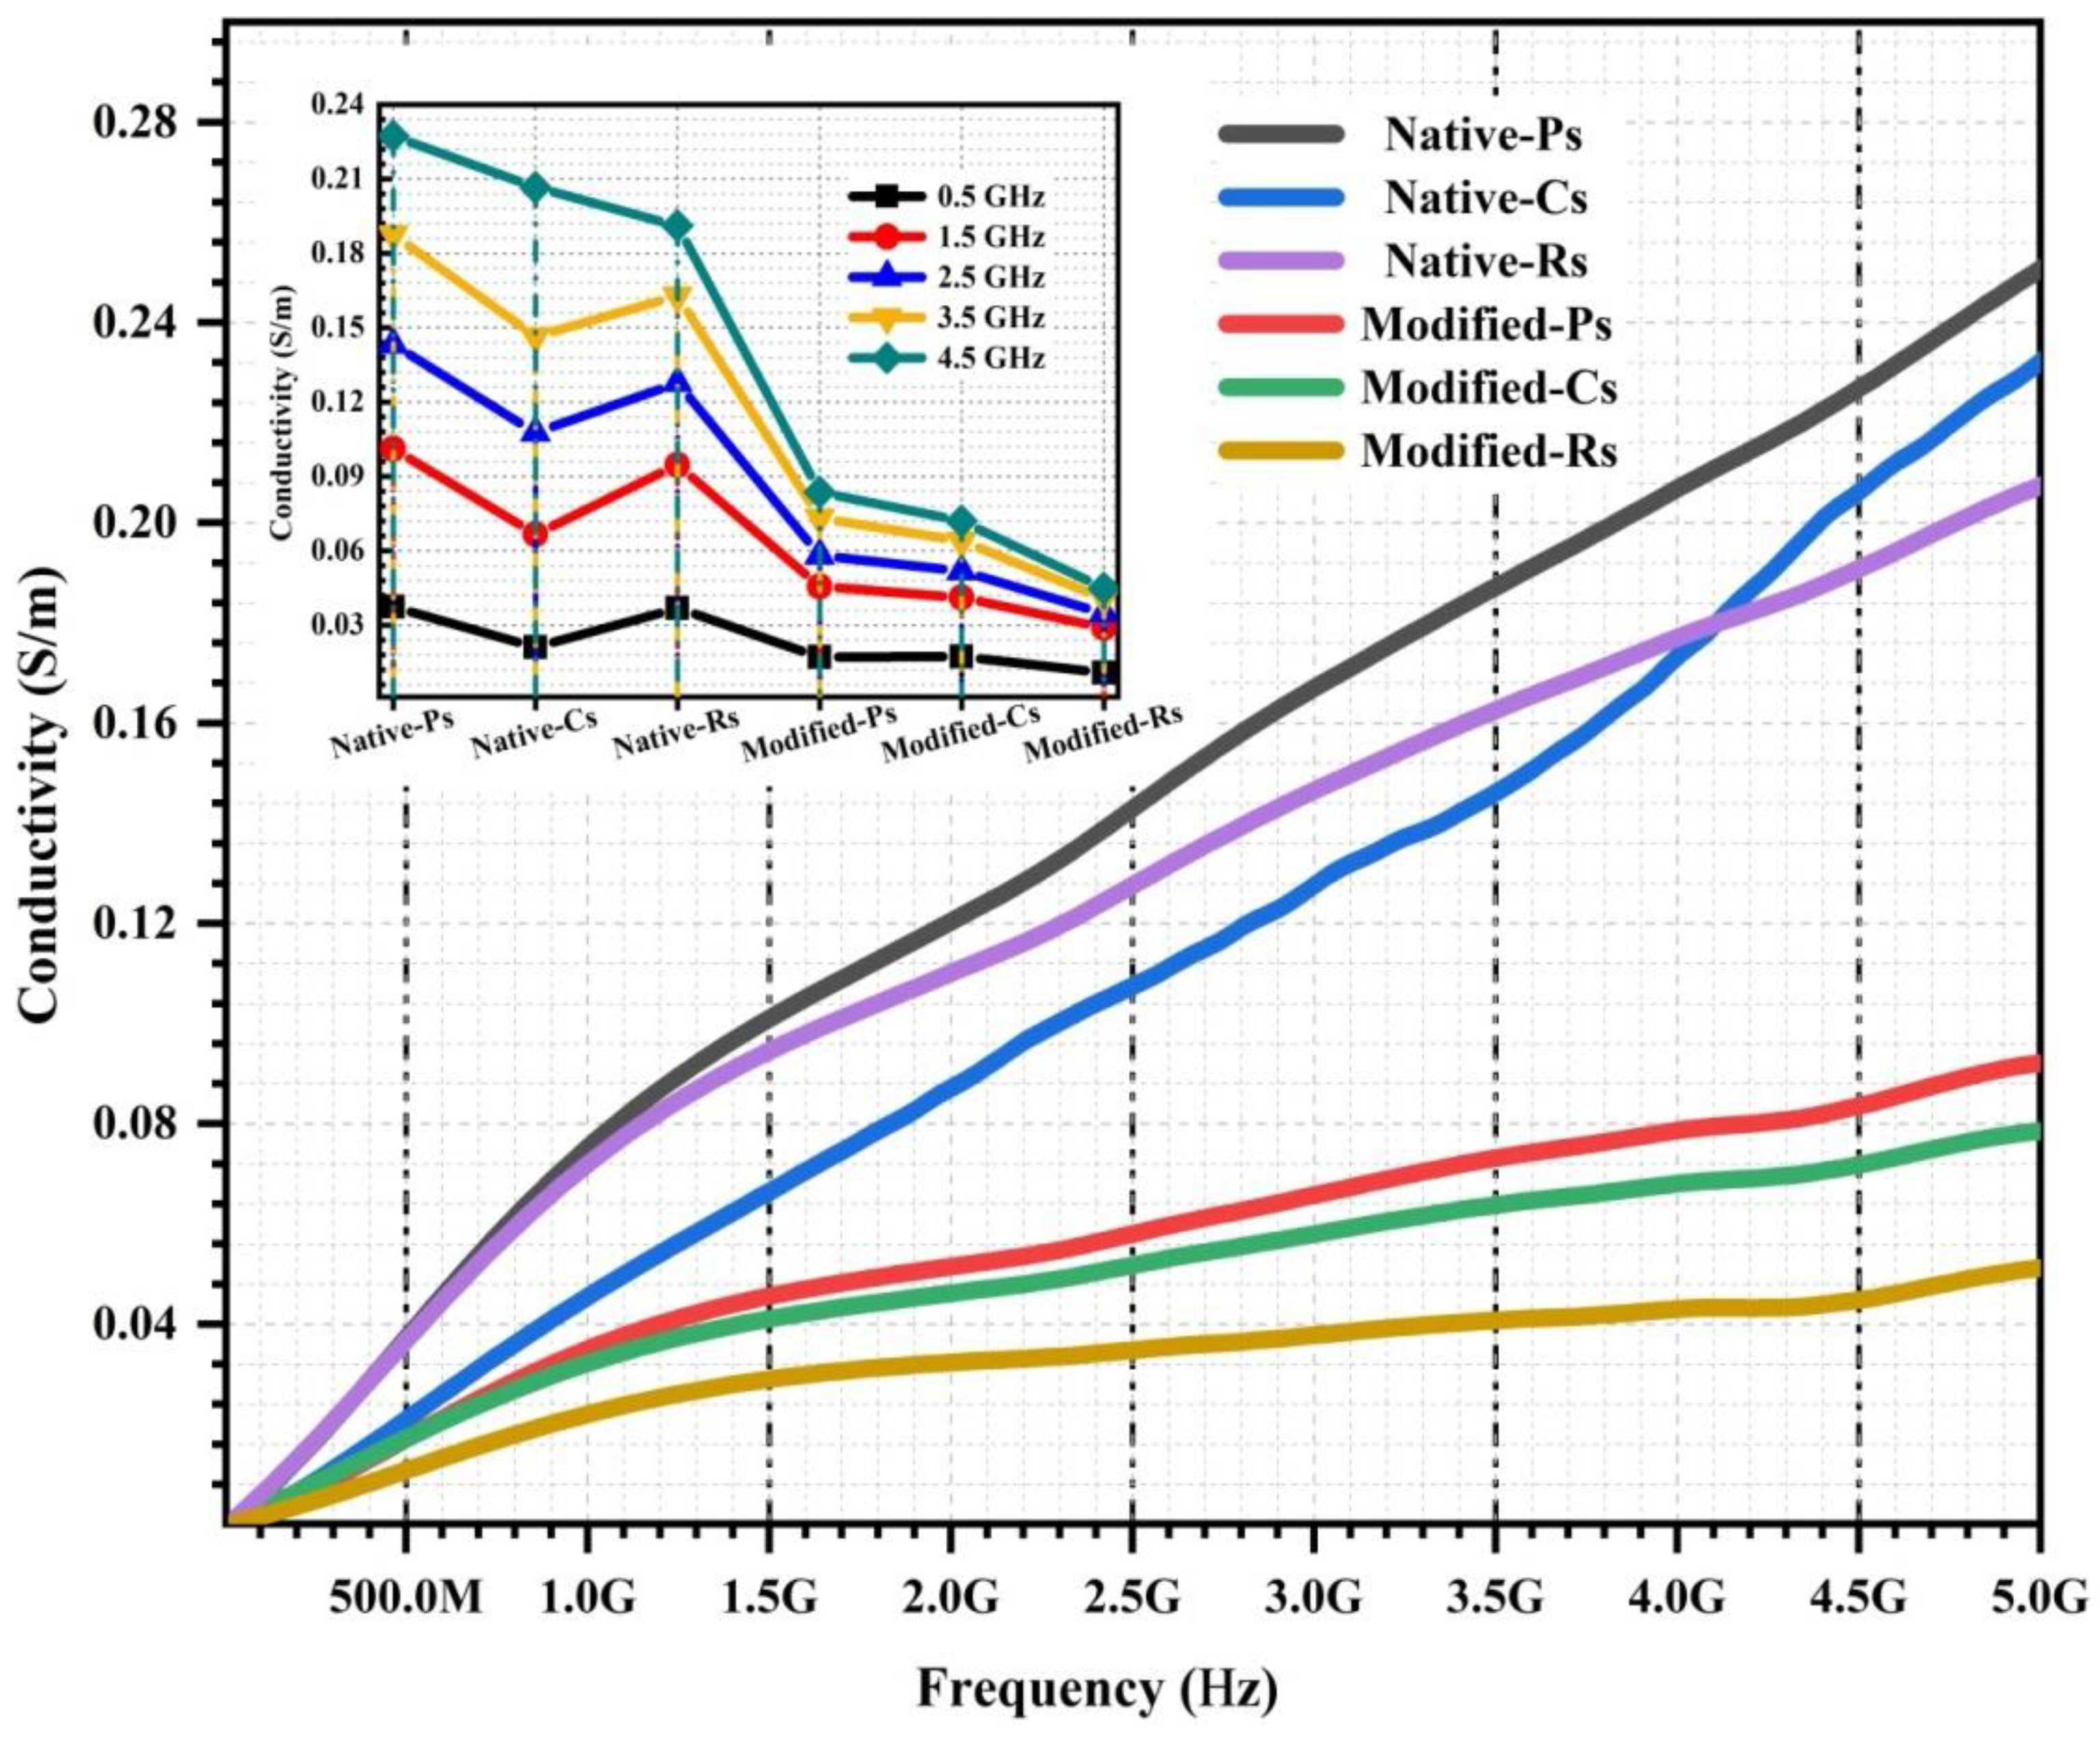
3.3. Electrical Conductivity over 5 Hz–5 MHz and 5 MHz–5 GHz
4. Conclusions
Author Contributions
Funding
Institutional Review Board Statement
Informed Consent Statement
Data Availability Statement
Acknowledgments
Conflicts of Interest
References
- Zhu, Z.; Guo, W. Frequency, moisture content, and temperature dependent dielectric properties of potato starch related to drying with radio-frequency/microwave energy. Sci. Rep. 2017, 7, 9311. [Google Scholar] [CrossRef] [PubMed]
- Drakopoulos, S.X.; Karger-Kocsis, J.; Kmetty, Á.; Lendvai, L.; Psarras, G.C. Thermoplastic starch modified with microfibrillated cellulose and natural rubber latex: A broadband dielectric spectroscopy study. Carbohydr. Polym. 2017, 157, 711–718. [Google Scholar] [CrossRef] [PubMed] [Green Version]
- Meena; Sharma, A. Dielectric spectroscopy of Ag-starch nanocomposite films. Mater. Res. Express 2018, 5, 045041. [Google Scholar] [CrossRef]
- Braşoveanu, M.; Nemţanu, M.R. Behaviour of starch exposed to microwave radiation treatment. Starch-Stärke 2014, 66, 3–14. [Google Scholar] [CrossRef]
- Nafchi, A.M.; Moradpour, M.; Saeidi, M.; Alias, A.K. Thermoplastic starches: Properties, challenges, and prospects. Starch-Stärke 2013, 65, 61–72. [Google Scholar] [CrossRef]
- Marichelvam, M.K.; Jawaid, M.; Asim, M. Corn and rice starch-based bio-plastics as alternative packaging materials. Fibers 2019, 7, 32. [Google Scholar] [CrossRef] [Green Version]
- García, M.A.; Barbosa, S.E.; Castillo, L.A.; Olivia, V.L.; Villar, M.A. Crystalline morphology of thermoplastic starch/talc nanocomposites induced by thermal processing. Heliyon 2019, 5, e01877. [Google Scholar] [CrossRef] [Green Version]
- Bajaj, R.; Singh, N.; Kaur, A.; Inouchi, N. Structural, morphological, functional and digestibility properties of starches from cereals, tubers and legumes: A comparative study. J. Food Sci. Technol. 2018, 55, 3799–3808. [Google Scholar] [CrossRef]
- Tao, Y.; Yan, B.; Fan, D.; Zhang, N.; Ma, S.; Wang, L.; Wu, Y.; Wang, M.; Zhao, J.; Zhang, H.; et al. Structural changes of starch subjected to microwave heating: A review from the perspective of dielectric properties. Trends Food Sci. Technol. 2020, 99, 593–607. [Google Scholar] [CrossRef]
- Mamat, H.; Hill, S.E. Structural and functional properties of major ingredients of biscuit. Int. Food Res. J. 2018, 25, 462–471. [Google Scholar]
- Vamadevan, V.; Bertoft, E. Structure-function relationships of starch components. Starch-Stärke 2015, 67, 55–68. [Google Scholar] [CrossRef]
- Waterschoot, J.; Gomand, S.V.; Fierens, E.; Delcour, J.A. Production, structure, physicochemical and functional properties of maize, cassava, wheat, potato and rice starches. Starch-Stärke 2015, 67, 14–29. [Google Scholar] [CrossRef]
- Ghoshal, S.; Mattea, C.; Denner, P.; Stapf, S. Effect of initial conformation on the starch biopolymer film formation studied by NMR. Molecules 2020, 25, 1227. [Google Scholar] [CrossRef] [PubMed] [Green Version]
- Huang, V.T.; Perdon, A.A. Major changes in cereal biopolymers during ready-to-eat cereal processing. In Breakfast Cereals and How They Are Made; Perdon, A.A., Schonauer, S.L., Poutanen, K.S., Eds.; Elsevier Inc.: Amsterdam, The Netherlands, 2020; pp. 109–140. ISBN 9780128120439. [Google Scholar]
- Bansal, N.; Dhaliwal, A.S.; Mann, K.S. Dielectric properties of corn flour from 0.2 to 10 GHz. J. Food Eng. 2015, 166, 255–262. [Google Scholar] [CrossRef]
- Wang, S.; Copeland, L. Molecular disassembly of starch granules during gelatinization and its effect on starch digestibility: A review. Food Funct. 2013, 4, 1564–1580. [Google Scholar] [CrossRef]
- Zhang, B.; Dhital, S.; Gidley, M.J. Densely packed matrices as rate determining features in starch hydrolysis. Trends Food Sci. Technol. 2015, 43, 18–31. [Google Scholar] [CrossRef] [Green Version]
- Wang, S.; Li, C.; Copeland, L.; Niu, Q.; Wang, S. Starch retrogradation: A comprehensive review. Compr. Rev. Food Sci. Food Saf. 2015, 14, 568–585. [Google Scholar] [CrossRef]
- Li, M.; Dhital, S.; Wei, Y. Multilevel structure of wheat starch and its relationship to noodle eating qualities. Compr. Rev. Food Sci. Food Saf. 2017, 16, 1042–1055. [Google Scholar] [CrossRef] [Green Version]
- Wang, W.; Zheng, B.; Tian, Y. Functional group changes and chemical bond-dependent dielectric properties of lotus seed flour with microwave vacuum drying. J. Food Sci. 2020, 85, 4241–4248. [Google Scholar] [CrossRef]
- Rayssi, C.; El Kossi, S.; Dhahri, J.; Khirouni, K. Frequency and temperature-dependence of dielectric permittivity and electric modulus studies of the solid solution Ca0.85Er0.1Ti1−xCo4x/3O3 (0 ≤ x≤ 0.1). RSC Adv. 2018, 8, 17139–17150. [Google Scholar] [CrossRef] [Green Version]
- Abd El-Kader, M.F.H.; Ragab, H.S. DC conductivity and dielectric properties of maize starch/methylcellulose blend films. Ionics 2013, 19, 361–369. [Google Scholar] [CrossRef]
- Bin-Dahman, O.A.; Rahaman, M.; Khastgir, D.; Al-Harthi, M.A. Electrical and dielectric properties of poly (vinyl alcohol)/starch/graphene nanocomposites. Can. J. Chem. Eng. 2018, 96, 903–911. [Google Scholar] [CrossRef]
- Ahmad, Z. Polymeric dielectric materials. In Dielectric Material; Silaghi, M.A., Ed.; InTechOpen: London, UK, 2012; pp. 3–26. ISBN 978-953-51-0764-4. [Google Scholar]
- Chakraborty, I.; Pallen, S.; Shetty, Y.; Roy, N.; Mazumder, N. Advanced microscopy techniques for revealing molecular structure of starch granules. Biophys. Rev. 2020, 12, 105–122. [Google Scholar] [CrossRef] [PubMed]
- Jiang, H.; Zhang, M.; Fang, Z.; Mujumdar, A.S.; Xu, B. Effect of different dielectric drying methods on the physic-chemical properties of a starch–water model system. Food Hydrocoll. 2016, 52, 192–200. [Google Scholar] [CrossRef]
- Tao, J.; Cao, S.A. Flexible high dielectric thin films based on cellulose nanofibrils and acid oxidized multi-walled carbon nanotubes. RSC Adv. 2020, 10, 10799–10805. [Google Scholar] [CrossRef]
- Mrudula, M.S.; Nair, M.G. Dielectric properties of natural rubber/polyethylene oxide block copolymer complexed with transition metal ions. Polym. Bull. 2020, 77, 6029–6048. [Google Scholar] [CrossRef]
- Sivakumar, D.; Premkumar, S.; Madankumar, M.; Manivannan, M. Structural characterization and dielectric properties of starch coated magnetite nanoparticles. J. Emerg. Technol. Innov. Res. 2018, 5, 61–72. [Google Scholar]
- Cheng, E.M.; You, K.Y.; Lee, K.Y.; Abbas, Z.; Rahim, H.A.; Khor, S.F.; Zakaria, Z.; Lee, Y.S. Dielectric spectroscopy technique for carbohydrate characterization of fragrant rice, brown rice and white rice. In Proceedings of the 2017 Progress in Electromagnetics Research Symposium-Fall (PIERS-FALL), Singapore, 19–22 November 2017; pp. 205–209. [Google Scholar]
- Wang, J.; Lim, E.G.; Leach, M.P.; Wang, Z.; Man, K.L. Open-ended coaxial cable selection for measurement of liquid dielectric properties via the reflection method. Math. Probl. Eng. 2020, 2020, 8942096. [Google Scholar] [CrossRef]
- Seth, A.; Shah, B. Morphology of different parts of medicinal plant. In A Textbook of Pharmacognosy and Phytochemistry; Chauhan, S.K., Ed.; Elsevier Inc.: New Delhi, India, 2009; pp. 29–56. ISBN 9788131222980. [Google Scholar]
- Supriya, S.; Kumar, S.; Kar, M. Grain size and grain boundary effect on dielectric behavior of nanocrystalline cobalt ferrite. In Proceedings of the 2017 IEEE 12th Nanotechnology Materials and Devices Conference (NMDC), Singapore, 2–4 October 2017; pp. 165–166. [Google Scholar]
- Kiliç, M.; Karabul, Y.; Özdemir, Z.G.; Erdönmez, S.; Bulgurcuoğlu, A.E.; Yeşilkaya, S.S.; Okutan, M.; İçelli, O. Effect of borax additive on the dielectric response of polypyrrole. Bull. Mater. Sci. 2018, 41, 52. [Google Scholar] [CrossRef] [Green Version]
- Krithika, P.L.; Ratnamala, K. Modification of starch: A review of various techniques. Int. J. Res. Anal. Rev. 2019, 6, 32–45. [Google Scholar]
- Xu, B.; Yi, X.; Huang, T.; Zheng, Z.; Zhang, J.; Salehi, A.; Coropceanu, V.; Hoi, C.; Ho, Y.; Marder, S.R.; et al. Donor conjugated polymers with polar side chain groups: The role of dielectric constant and energetic disorder on photovoltaic performance. Adv. Funct. Mater. 2018, 28, 1803418. [Google Scholar] [CrossRef]
- Ohki, Y.; Tajitsu, Y.; Kohtoh, M.; Okabe, S. Dielectric properties of biodegradable polylactic acid and starch ester. In Proceedings of the 2004 IEEE International Conference on Solid Dielectrics, Toulouse, France, 5–9 July 2004; pp. 87–89. [Google Scholar]
- Domene-l, D.; Carlos, J.; Martin-gullon, I.; Montalb, M.G. Influence of starch composition and molecular weight on physicochemical properties of biodegradable films. Polymers 2019, 11, 1084. [Google Scholar] [CrossRef] [PubMed] [Green Version]
- Chatterjee, B.; Kulshrestha, N.; Gupta, P.N. Nano composite solid polymer electrolytes based on biodegradable polymers starch and poly vinyl alcohol. Measurement 2016, 82, 490–499. [Google Scholar] [CrossRef]
- Zyane, A.; Belfkira, A.; Brouillette, F.; Lucas, R.; Marchet, P. Microcrystalline cellulose as a green way for substituting BaTiO3 in dielectric composites and improving their dielectric properties. Cellul. Chem. Technol. 2015, 49, 783–787. [Google Scholar]


| Potato | Corn | Rice | |
|---|---|---|---|
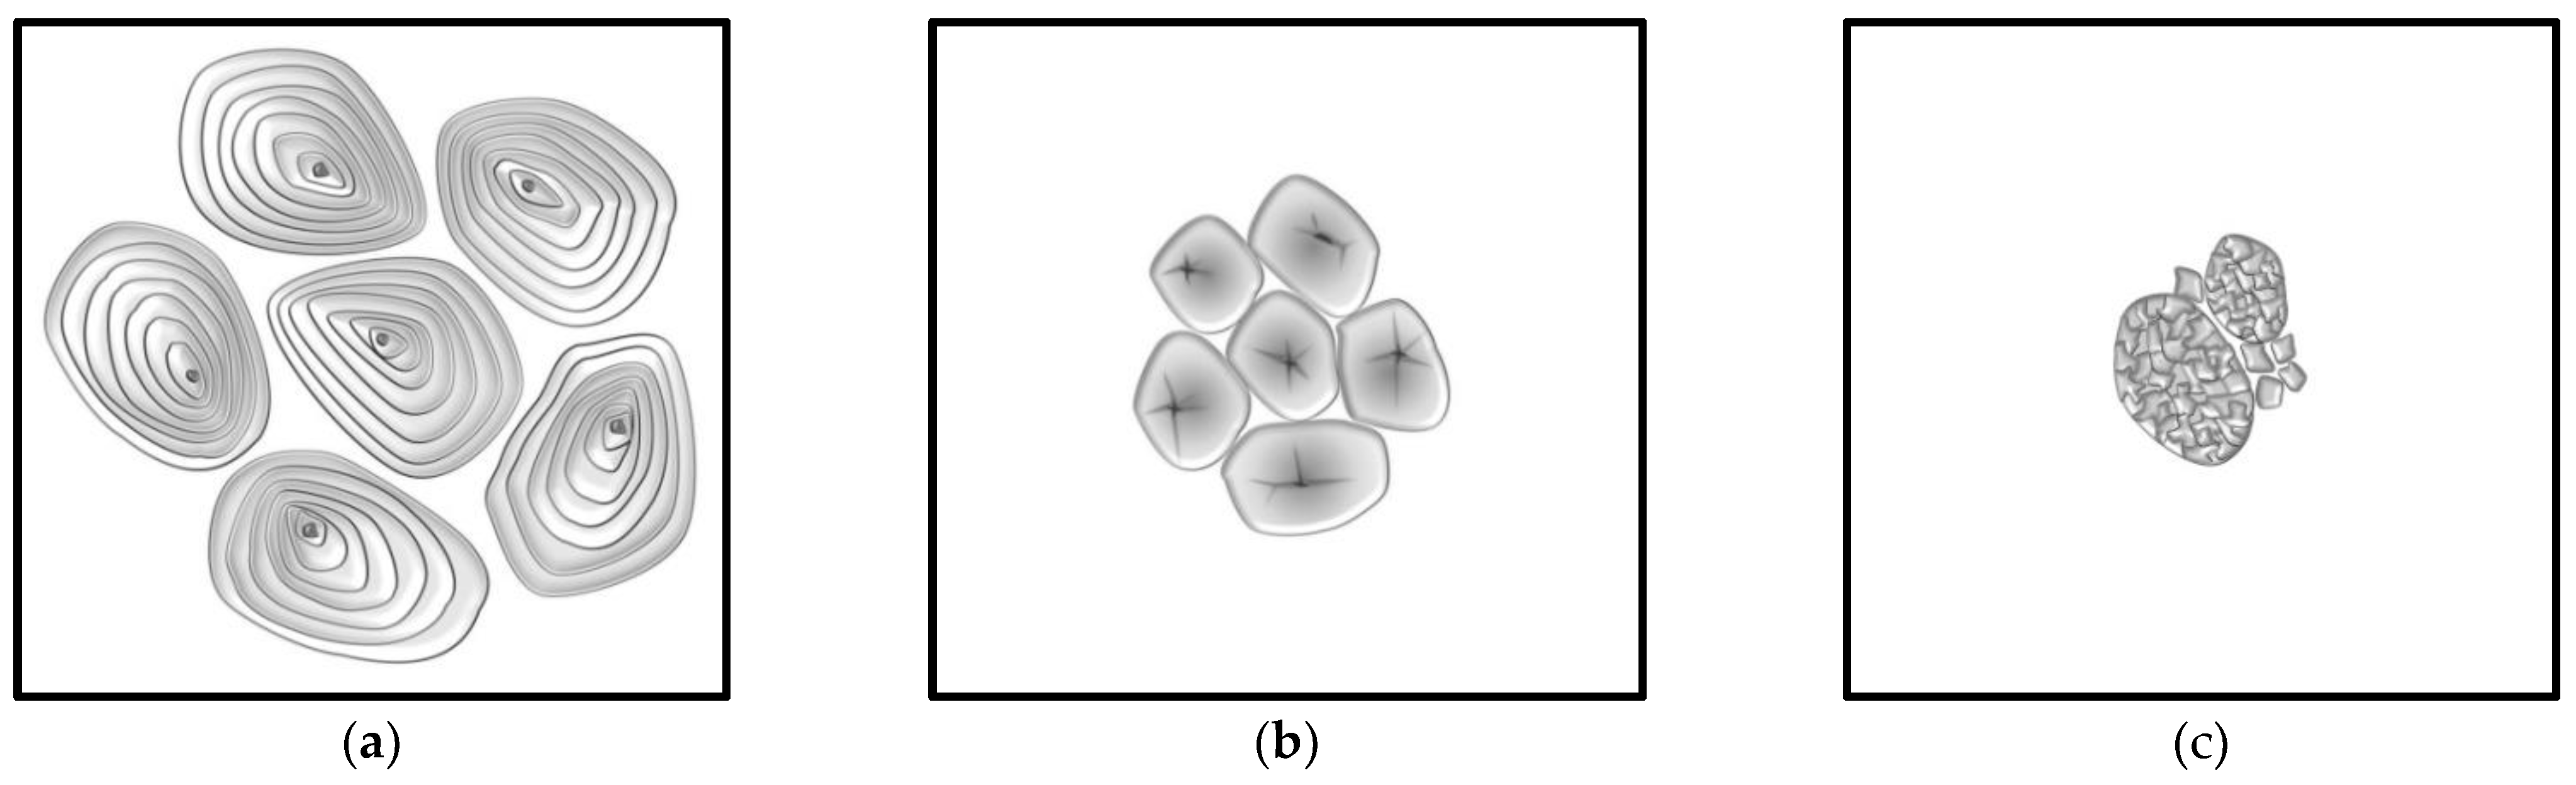
| Granule shape | Lenticular | Spherical/polyhedral | Polyhedral |
| Size (µm) | 5–100 | 2–30 | 3–8 |
| Average diameter (µm) | 36 | 15 | 5 |
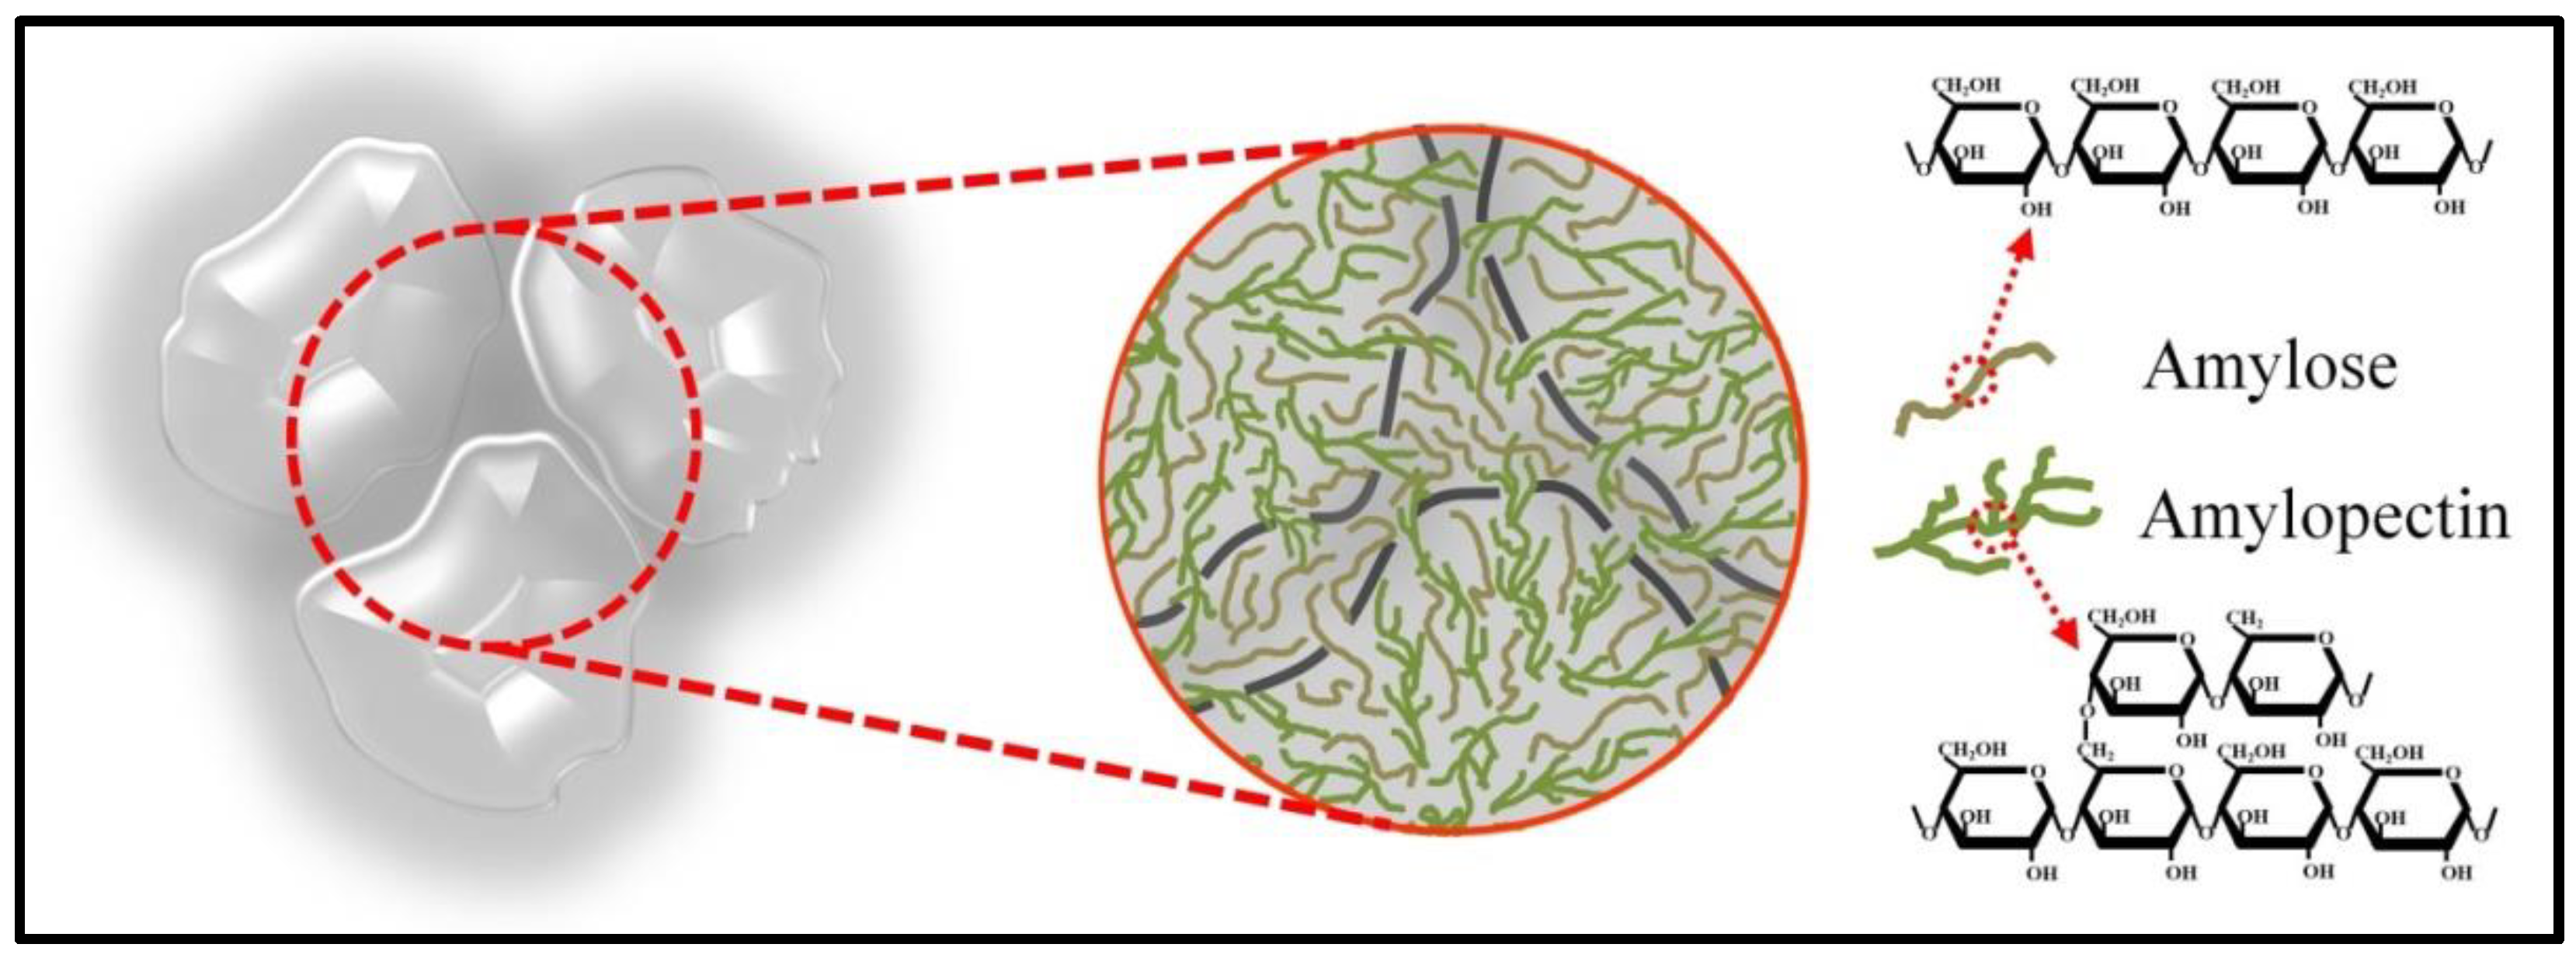
| Amylose (%) | 18 | 28 | 35 |
| Amylopectin (%) | 82 | 72 | 65 |
| Lipid (%) | 0.1 | 0.6–0.8 | 0.6–1.4 |
| Protein (%) | 0.1 | 0.4 | 0.1–0.5 |
| Ash (%) | 0.2 | 0.1 | 0.1 |
| Phosphorus (%) | 0.09 | 0.01 | 0.07 |
Publisher’s Note: MDPI stays neutral with regard to jurisdictional claims in published maps and institutional affiliations. |
© 2022 by the authors. Licensee MDPI, Basel, Switzerland. This article is an open access article distributed under the terms and conditions of the Creative Commons Attribution (CC BY) license (https://creativecommons.org/licenses/by/4.0/).
Share and Cite
Beh, C.Y.; Cheng, E.M.; Mohd Nasir, N.F.; Abdul Majid, M.S.; Khor, S.F.; Mohd Jamir, M.R.; Mohd Tarmizi, E.Z.; Lee, K.Y. Dielectric Properties of Hydrothermally Modified Potato, Corn, and Rice Starch. Agriculture 2022, 12, 783. https://doi.org/10.3390/agriculture12060783
Beh CY, Cheng EM, Mohd Nasir NF, Abdul Majid MS, Khor SF, Mohd Jamir MR, Mohd Tarmizi EZ, Lee KY. Dielectric Properties of Hydrothermally Modified Potato, Corn, and Rice Starch. Agriculture. 2022; 12(6):783. https://doi.org/10.3390/agriculture12060783
Chicago/Turabian StyleBeh, Chong You, Ee Meng Cheng, Nashrul Fazli Mohd Nasir, Mohd Shukry Abdul Majid, Shing Fhan Khor, Mohd Ridzuan Mohd Jamir, Emma Ziezie Mohd Tarmizi, and Kim Yee Lee. 2022. "Dielectric Properties of Hydrothermally Modified Potato, Corn, and Rice Starch" Agriculture 12, no. 6: 783. https://doi.org/10.3390/agriculture12060783