Article

A Comparative Study of Healthy and American Foulbrood-Infected Bee Brood (Apis mellifera L.) through the Investigation of Volatile Compounds

by
Vasilios Liolios
,
Dimitrios Kanelis
,
Chrysoula Tananaki
* and
Maria-Anna Rodopoulou
Laboratory of Apiculture-Sericulture, Aristotle University of Thessaloniki, 57001 Thessaloniki, Greece
*
Author to whom correspondence should be addressed.
These authors contributed equally to this work.
Agriculture 2022, 12(6), 812; https://doi.org/10.3390/agriculture12060812
Submission received: 29 April 2022 / Revised: 1 June 2022 / Accepted: 2 June 2022 / Published: 3 June 2022
(This article belongs to the Section Farm Animal Production)

Abstract

:
American Foulbrood (AFB) is a major endemic disease affecting the bee brood and the absence of chemical therapeutic treatments leads beekeepers to develop alternative management plans, based mainly on the prevention and accurate diagnosis of symptoms. One of the main symptoms of the disease is the unpleasant odor caused by the rot of dead larvae. In the present comparative study, we analyzed the odor profile of bee larvae and the presence of characteristic volatile compounds (Gas Chromatography-Mass Spectometry), in an effort to discriminate healthy and AFB-infected brood. A greater number of volatile compounds was identified in the affected brood than the healthy. The presence of (Ε)-β-ocimene was prominent in healthy brood samples in percentages from 85.25 to 99.14%, a compound also detected in all samples of infected brood but in lower percentages (37%). The compounds toluene, xylene, 1,3-dimethylbenzene, 2-nonanone, dimethyl disulfide, and dimethyl trisulfide were detected in 100% of the diseased brood samples, with the latter three being absent from the healthy brood, while 2-undecanone was found in some samples of diseased brood (40.0%). Further investigation of volatile markers may contribute significantly to the successful diagnosis of the disease, aiming at its rapid treatment.

1. Introduction

American Foulbrood (AFB) is one of the most crucial diseases affecting all stages of the brood of honeybees (Apis mellifera L.) and is caused by the bacterium Paenibacillus larvae, occurring at all times of the year when brood is present [1]. The infected bee colonies may spread the disease in the apiary while other factors, such as shortage of nectar flow that favors the pillage between bees from different colonies, and inappropriate beekeeping practices (e.g., use of non-sterile equipment and tools, feeding with infected honey) may accelerate this spread. P. larvae is characterized by great durability over time as its spores are resistant to drying, heating, chemicals, and antibiotics [2,3]. At the same time, it is classified as a highly infectious pathogen, inevitably lethal for infected larvae [2] and capable of leading to the loss of the infected bee colonies, especially if it is not diagnosed at an initial stage and appropriate measures are not taken [2,4,5].
The diagnosis of the disease is mainly based on macroscopic and microscopic symptoms, as well as biochemical tests (Holst, Vita) [6,7,8] and molecular methods (PCR-tests) [9]. The macroscopic symptoms for AFB include scattered brood, presence of a small hole in the sealed cells, formation of a sticky elastic fiber after immersion of a wooden object in the infected cells’ characteristic unpleasant odor, which in several cases resembles the smell of rotten fish, attachment of the proboscis of the dead pupa to the inner surface of the cells, and formation of a scab that remains attached to the walls of the cell with the impossibility of removal from the bees. To become infected, a larva has to be exposed to spore contaminated food during the first 36 h after egg hatching [10]. The P. larvae spores can also be detected through microscopic examination of carbol fuchsin-stained smears of dead larvae [7,11].
To control the AFB disease, formulations of antibiotics such as tetracyclines, sulfonamides, and streptomycins have been widely used in the past [12,13]; however, according to the European Commission Directive (37/2010), the use of antibiotics was eventually prohibited due to the lack of tolerable concentrations in the hive products. Therefore, the accurate diagnosis of the disease and the required hygiene and precautionary measures (replacement of honey combs every three to four years, cleaning of the hive base, disinfection of the beekeeping material, selection of bee colonies with high hygienic behavior, etc.), along with the application of appropriate beekeeping treatments (transfer to bee plants, varroa control, feeding in flowering gaps, application of transfusion method, etc.), is the only way to deal with the disease.
On the other hand, bees themselves have developed a mechanism of immunity (hygienic behavior) in which they detect and remove the infected brood before the bacterial spores are transmitted into the hive [14,15,16,17]. Detection is done mainly through olfaction, as the infected brood emits characteristic volatile compounds that raise the bee cleaning instinct [18,19,20]. Despite the importance of the volatile compounds that characterize the disease, few are reported as markers [21]. Some compounds have been used for the detection of other diseases, such as varroatosis, caused by mite Varroa destructor [18,22,23] European foulbrood [24] and the fungus Ascosphaera apis [25]. Lee et al. [21], in an effort to define volatile compounds as markers of infected larvae using Gas Chromatography-Mass Spectrometry (GC-MS), report the presence of propionic acid, valeric acid, and 2-nonanone in infected samples, compounds that were absent from healthy larvae. The presence of valeric, and also isovaleric, butyric, 2-methyl-butanoic, and hexanoic acid are indicated in infected brood by Gochnauer [26], who applied gas chromatography technique after methylation of these acids. To date, the greatest research interest is in the use of aromatic oils, fatty acids, and plant extracts against P. larvae [27,28].
The finding of characteristic volatile compounds may contribute to the future construction of sensors that can diagnose the disease without the need for visual observation or sampling and laboratory analysis of the brood, helping the beekeepers in their practices. Thus, the aim of the present study was to compare the volatile profile of healthy and AFB- infected bee larvae and to detect characteristic compounds presented in the diseased brood. The detection of these compounds may comprise an additional method for the reliable AFB-diagnosis, contributing to its rapid treatment and to the reduction of its spread in the same or in a neighboring apiary.

2. Materials and Methods

2.1. Production and Sampling of Healthy and Infected Brood

The experiment was conducted in experimental colonies under continuous inspection, a time-consuming and demanding process, as we wanted to ensure its complete control and to avoid the spread of the disease to neighboring apiaries, because the disease is easily transmitted from infected to healthy colonies [29]. For a close monitoring of the course of the disease, the degree of infection, and the general behavior of the colonies, we preferred to produce the infected samples rather than collect them by beekeepers.
For the collection of samples of infected brood, five colonies were isolated from the rest of the apiary (transferred 3 km away) and contaminated artificially, through the placement of infected frames that had already been diagnosed with AFB during April. The colonies were inspected for two months until the confirmation of the infection, based on the macroscopic symptoms (scattered brood, presence of a small hole in the sealed cells, etc.). Finally, in June, when the infection was observed, we proceeded to the collection of the infected brood samples. At least 150 brood cells were counted in the frames that were diagnosed with AFB and the number of infected larvae was noted in order to determine the degree of infection (%) based on the equation, as described by Mitroudi [30]:
Degree of Infection = (Infected Cells/Total Examined Cells) × 100
To achieve a comparative evaluation of the volatile profile of unhealthy–healthy brood, samples from all the experimental colonies in which the infection degree was over 60% were selected, in order to ensure the contamination (Table 1). To our knowledge at this stage, AFB is irreversible and difficult to be healed by bees themselves. For the confirmation of the diagnosis, all macroscopic characteristics were taken into account (holes in the cells, viscosity of the fiber) while at the same time Vita detection test (AFB Diagnostic Test Kit) was applied in brood cells with typical symptoms (Table 1).
The samples of uninfected brood were taken from healthy bee colonies of the experimental apiary of the Laboratory of Apiculture-Sericulture, AUTH, regularly monitored and inspected by specialized scientific staff. However, for the confirmation of their hygienic condition, diagnostic tests of AFB were also applied. The larvae used in the study were of similar size of the last developmental stages both from the uninfected and infected group. The samples of both groups were analyzed immediately after their collection.

2.2. Apparatus

The extraction of the samples was carried out with the trapping device system (Purge & Trap, OI Analytical, model 4560) and the extraction of the components was carried out in a Tenax 07 column (OI Analytical). An Agilent gas chromatograph (HP, 6890) was used to separate the extracted components, directly connected via a thermostatic transfer line to the extraction system. The gasified mixture was introduced via a split-splitless inlet, while the components were separated on an HP-5MS column (30 × 0.25 mm, df = 0.25 μm) and the detection was performed with a mass spectrometer (Agilent, 5973). The chromatograms were processed with the MSD ChemStation program, while the peaks were identified using the Nist 05 electronic library. The extraction gas as well as the carrier gas was He of high purity (99.999%) and before entering the analysis system, it was passed through a filter in order to remove from it any small amounts of oxygen. The Kern balance (model 770) was used for the weight measurements and a Millipore device (model Simplicity 185) was used for the production of ultra-pure water.

2.3. Pre-Treatment Methodology

2.3.1. Number of Larvae

With the aim to find a suitable methodology to be followed for the pre-treatment of the samples, experimental tests were performed, in order to identify the optimal number of larvae for the analysis. Specifically, 15, 20, 30, and 40 larvae were tested. In the 15 mashed larvae of infected brood, only 14 volatile compounds were detected, in the 20 larvae 18, in the 30 larvae 26, and in the 40 larvae 25 compounds. In the case of 30 and 40 infected larvae, where a similar number of compounds was observed, no differences were found in the chromatograms regarding the peak areas of the identified compounds, so considering the optimal chromatographic result with the smallest possible number of larvae, the number of 30 larvae was selected.

2.3.2. Presence-Absence of Water

When mashed larvae were placed in the glass container of the extraction system in the absence of water, it was not possible to properly stir the samples, as a result of which a sufficient number of volatile compounds was not released. Specifically, in the samples of 30 infected larvae with AFB in the absence of water, only 12 compounds were detected contrary to the presence of water and constant stirring (25 compounds).

2.3.3. Larvae-Pupae

Tests were performed with both larvae and pupae of healthy brood to determine the optimal development stage that could be used. The best chromatographic performance was achieved with the larvae of the healthy brood, as more peaks appeared and they were more intense. Moreover, the infected larvae did not achieve the next stage (pupae) because of the decay. So, for the samples of the infected brood, only larvae in an advanced stage of decay were selected, in order to ensure the symptomatology of the disease and consequently the presence of the characteristic volatile compounds.

2.4. Determination of Volatile Compounds

2.4.1. Sample Preparation

The larvae were placed in the glass container extraction system and diluted with purified water. The mixture was mechanically stirred (vortex) for 30–60 s. For the suppression of foam, a steel (No. 316) spiral component with a total length of 40 cm was used, while a magnet was placed in order to stir during the extraction and to achieve a homogeneous separation of the volatile components. The container was then placed in the Purge & Trap system and extracted.

2.4.2. Sample Extraction

The sample was extracted into the trapping device system and included the following five steps [31]:
  • Warm-up: the sample was heated to low temperature (40 °C) for 2 min, without passing gas.
  • Extraction: the volatiles were isolated by passing He of flow 40 mL min1 through a glass vial for 40 min, maintaining at the same time the sample temperature at 40 °C. At this stage, the volatile and semi-volatile components of the analyte were collected in the Purge & Trap.
  • Removal of moisture from the trap by heating to 100 °C for 2 min.
  • Thermal desorption: the trapped components were released by heating the trap at 180 °C for 6 min and simultaneously passing He (40 mL min1) and transferring on a thermostable (100 °C) transfer line to the gas chromatograph.
  • Trap cleaning by heating for 7 min at 200 °C and prepare it for the next sample.

2.4.3. Gas Chromatography (GC) Analysis

The analysis was based on the methodology described by Tananaki et al. [32]. After the extraction of the samples, the components were transferred via a thermostated transfer line to the gas chromatograph. They entered the column in a splitless type insert, at a temperature of 220 °C. Their separation in the capillary column was performed based on the following temperature program: 40 °C (isothermal for 5 min), increase to 55 °C at a rate of 1 C min1, to 120 °C at a rate of 3 °C min1, to 230 °C at a rate of 10 °C min1, and to 280 °C at a rate 20 °C min1 (isothermal for 5 min). The carrier gas flow (He) was 1 mL min1. The detection of the separated components was performed in a mass spectrometer, operated under the following conditions: interface temperature 280 °C, ionization source temperature 230 °C, quadrupole temperature 150 °C, ionization potential +70 eV. The chromatograms were processed and completed with the MSD ChemStation program.

2.5. Statistical Analysis

For the statistical processing of the results, the non-parametric test Kruskal–Wallis through the SPSS 23.0 (2015 SPSS Inc., Chicago, IL, USA) and Minitab 19.1.1.0 (Brandon Court, Unit E1-E2, Coventry, UK) statistical package software for Windows were used [33]. The level of significance was set at α = 0.05. Moreover, the Principal Component Analysis was applied to the compounds found at 100% not only of healthy but also of infected brood samples.

3. Results

In total, 47 volatile compounds were found in the infected brood, contrary to the healthy one where 13 compounds were detected (Table 2). Peaks with a low match level, according to the Nist 05 Library, were not identified but were rendered “unknown” and their respective fragments were described.
The different categories of organic compounds found in the brood samples are shown in Figure 1, where the presence of hydrocarbons, terpenes, aldehydes, and esters is highlighted. Indeed, the group of hydrocarbons stood out (35.39%), followed by terpenes, aldehydes, and esters, with 12.48%, 12.24%, and 10.20%, respectively. To a lesser extent, ketones (8.16%), alcohols (8.16%), and sulfur compounds (4.08%) were found, whereas a small percentage of organic compounds was not identified, named as “unknown” (4.08%). Another group, which accounted for 6.12%, included volatile compounds such as heterocyclics, which were rarely detectable in brood samples, without justifying their grouping into a separate class of compounds. The high percentage of hydrocarbons, including alkanes such as nonane and decane, terpenoids such as α-pinene, (Ε)-β-ocimene, which were detected in the present study, is also noted by Carroll and Duehl [34] in brood cells that contained larvae of different ages.
Generally, in healthy brood samples, the number of volatile compounds ranged from 9 to 11 while in all samples the presence of (Ε)-β-ocimene (C39) prevailed, in percentages from 85.25% to 99.14%, which is also referred to in the literature as a characteristic volatile brood pheromone [20,24,35,36]. Toluene (C12), octane (C15), o-xylene (C22), and nonane (C25) were also detected in 100% of the healthy brood samples tested, compounds that are also very common in honey samples [32,37].
Respectively, in the infected brood samples, the number of volatile compounds was significantly higher (p value = 0.00 < α = 0.05), according to independent samples t-test) and ranged from 18 to 25. Moreover, in all samples, the compound (Ε)-β-ocimene (C39) dominated at a lower percentage (37.63 ± 27.56) compared to the healthy brood. Indeed, Lee et al. [14] pointed out that infection of larvae with AFB did not affect the release of (Ε)-β-ocimene. It is referred though that in case of varroatosis, this volatile compound triggered the hygienic workers to begin the process of uncapping the cells and removing the infected larvae, and then their healthy behavior is activated by detecting non-volatile signals (oleic acid) [20,38]. Despite the decrease of (Ε)-β-ocimene in the infected samples of the present study, its predominance in combination with the presence of other compounds absent from the healthy, may produce a characteristic odor mixture for the recognition of AFB disease. The compounds toluene (C12), o-xylene (C22), 1,3-dimethylbenzene (C23), 2-nonanone (C44), dimethyl disulfide (C10), and dimethyl trisulfide (C29) were detected in 100% of the infected samples. Indeed, a large percentage increase (~10%) of the compounds toluene (C12) and o-xylene (C22) was observed in the infected samples compared to the healthy ones.
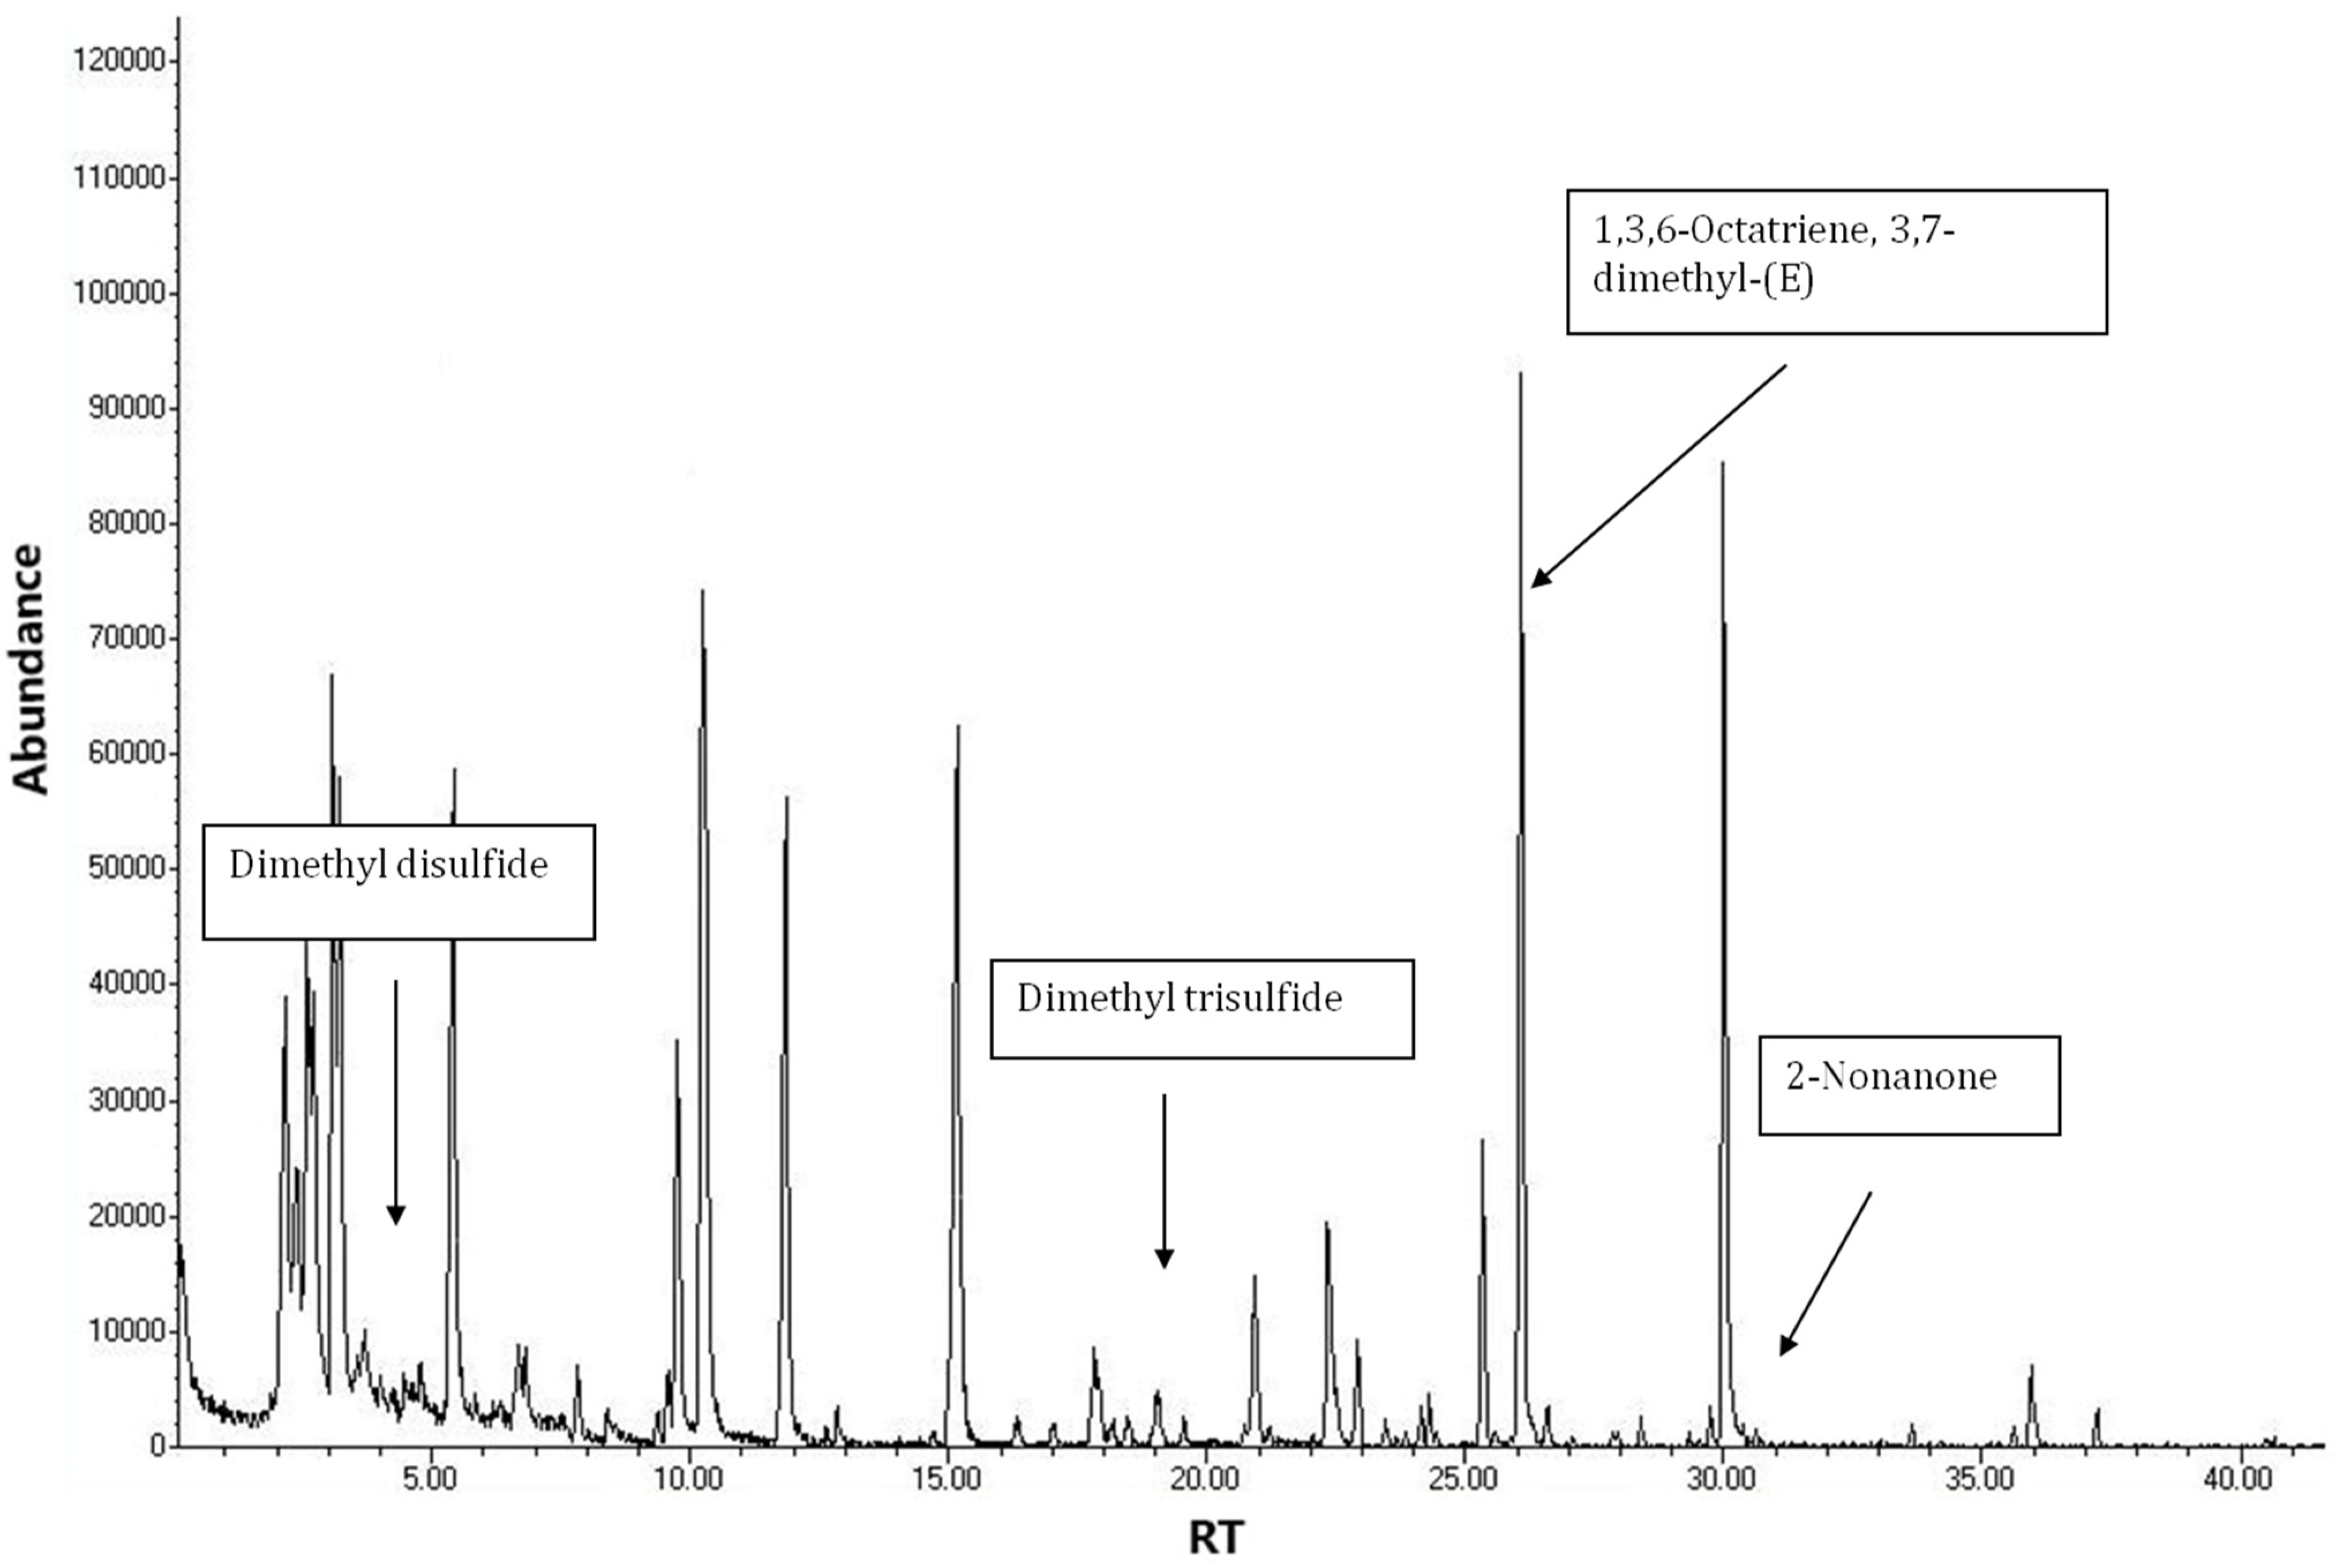
The compounds 2-nonanone (C44), dimethyl disulfide (C10), dimethyl trisulfide (C29), and 2-undecanone (C49) were absent from the healthy brood samples, with the last one being detected in the three (samples from colonies 1,2,5) of the five infected samples. The infection level is probably related to the presence of 2-undecanone, as it was detected in samples that showed the highest level (Table 1). The ketones 2-nonanone and 2-undecanone are also referred to in the literature as characteristic brood compounds of AFB [21], finding application in the food industry and in the manufacture of insect repellents [39,40]. Finally, the presence of the compounds dimethyl disulfide (C10) and dimethyl trisulfide (C29) in samples of infected brood by AFB is also pointed out by Mitroudi [30], with the former being proposed as an indicator of botanical origin for Eucalyptus honey [41]. Typical chromatograms of healthy and infected by AFB larvae samples are presented in Figure 2 and Figure 3.
Applying to the results of the non-parametric Mann–Whitney test, statistically significant differences were observed between the healthy and infected groups (chi-square: 0.011–0.75, df:1, p = 0.005–0.916), regarding the compounds C12, C21, C22, C23, C29, C39, and C44.
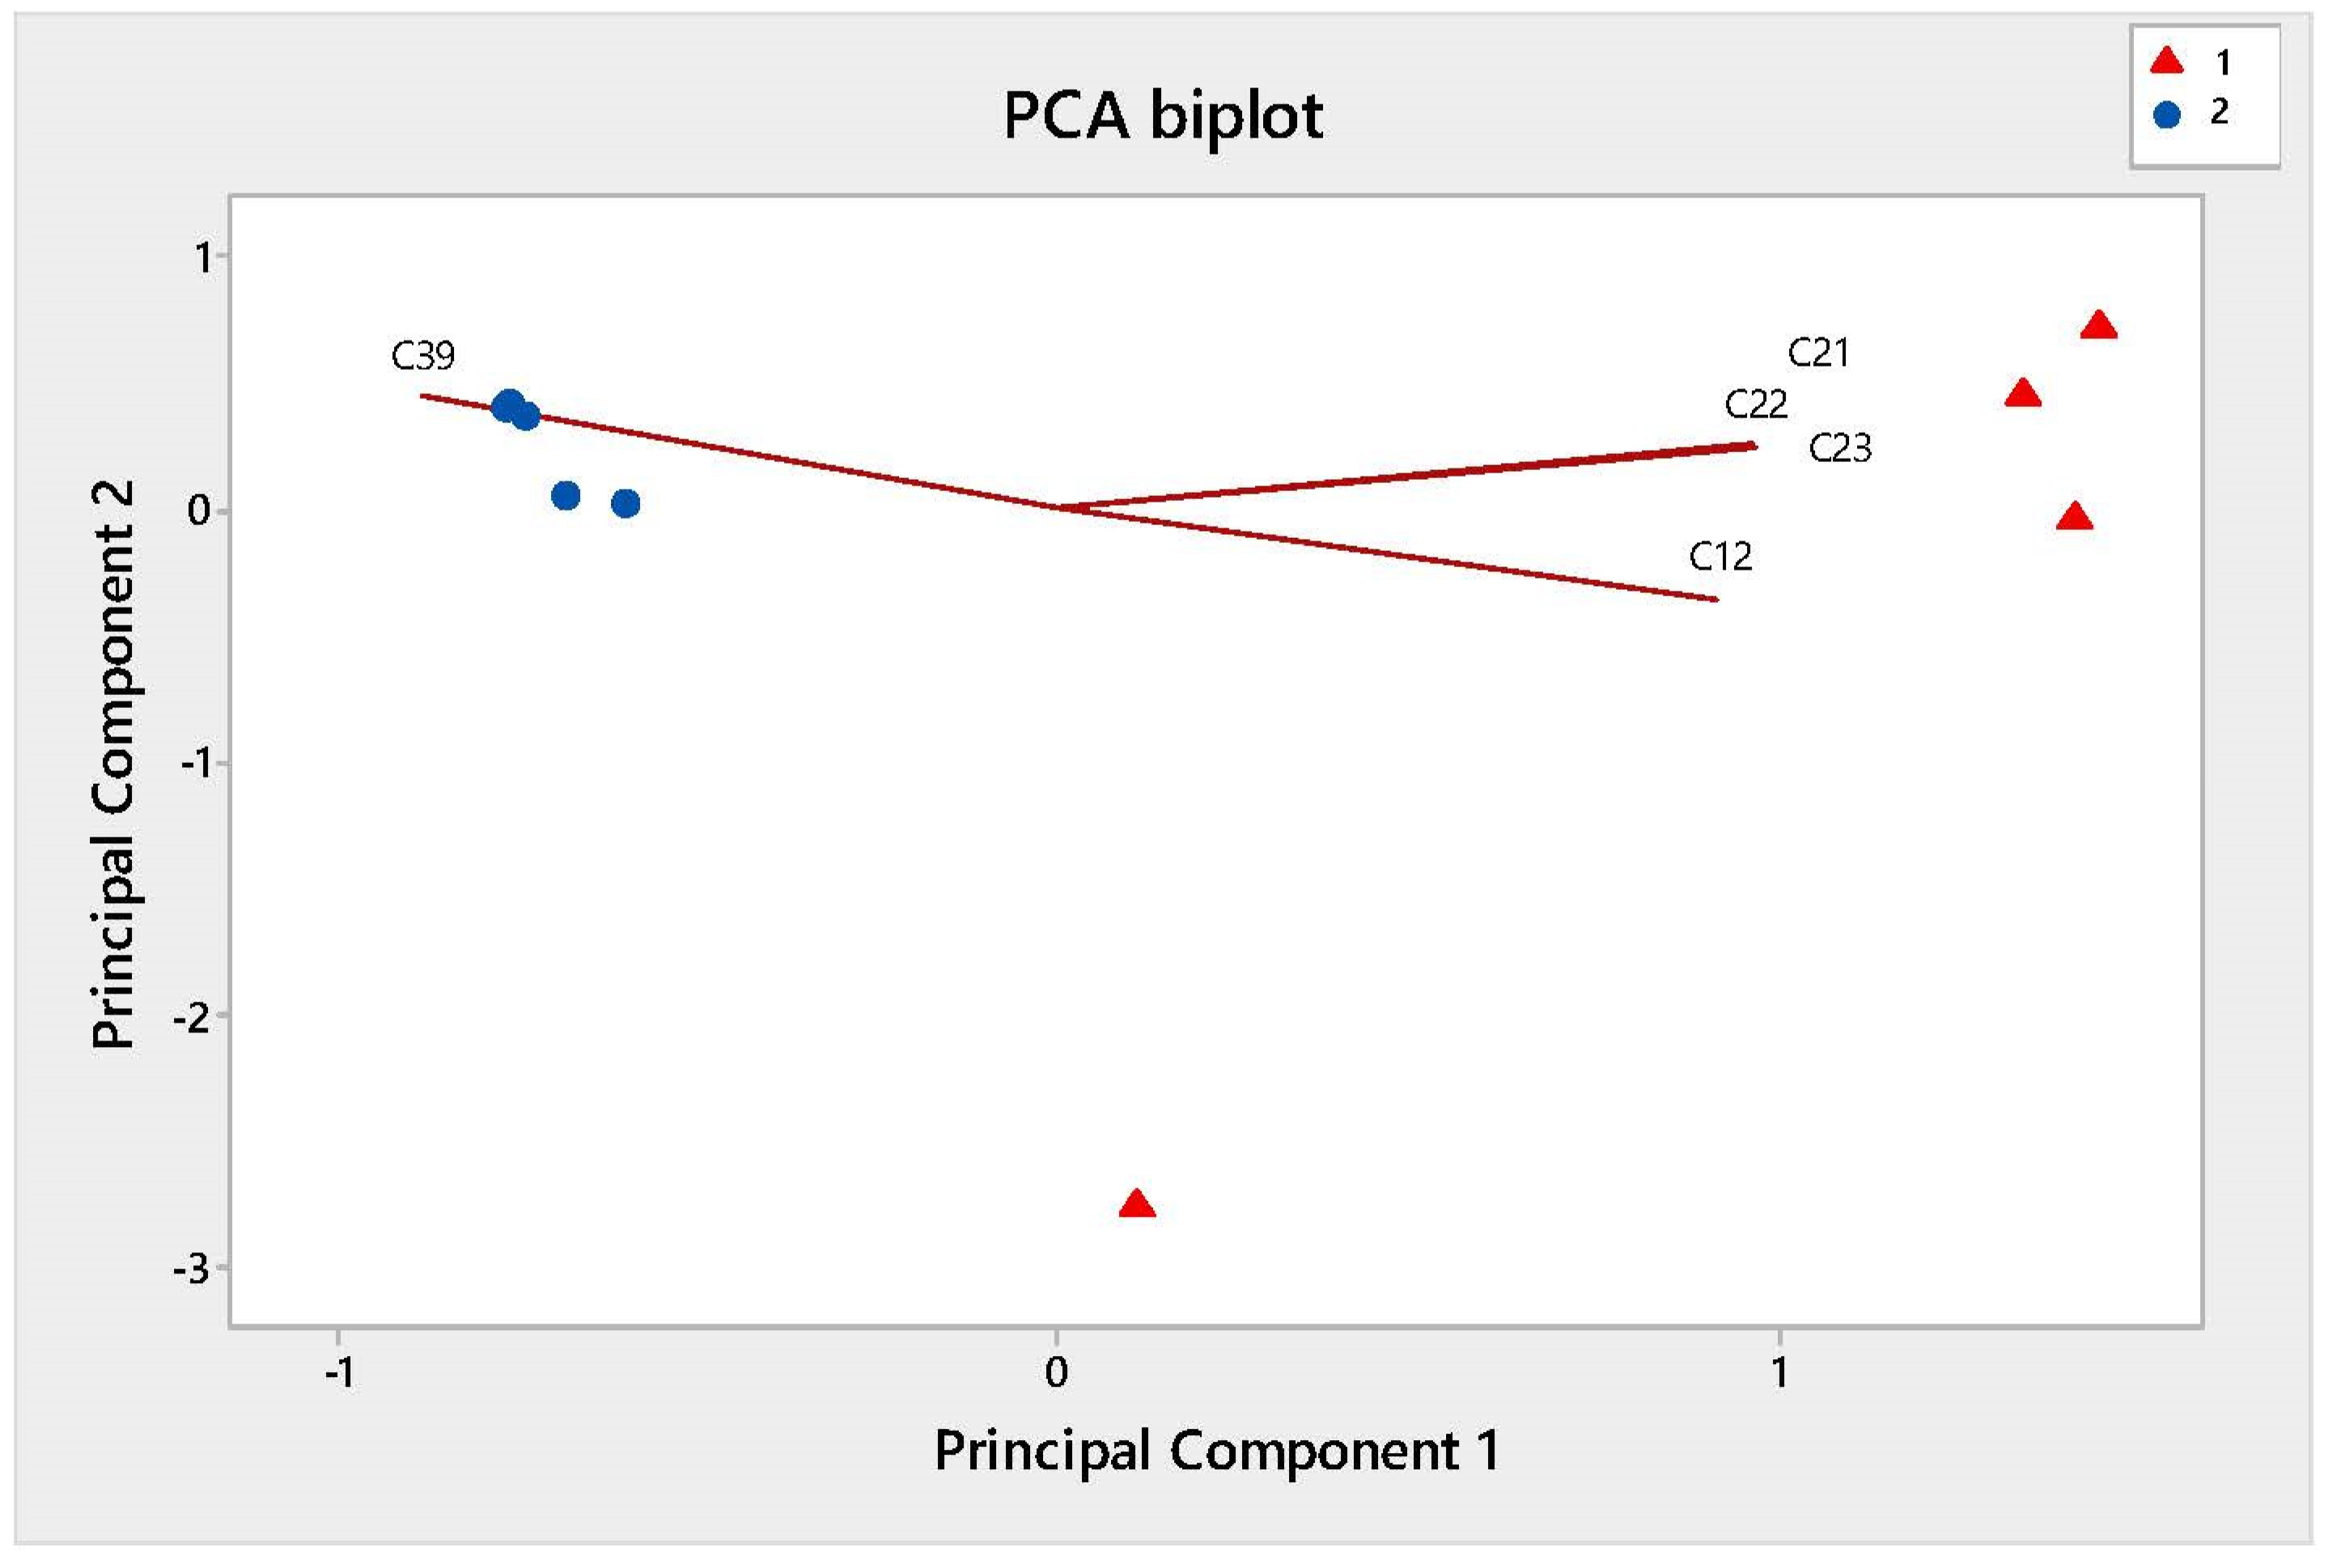
In turn, a principal component analysis (PCA) was carried out to reduce the dimensions of the data matrix, in which two components were created. Specifically, 98.54% of the total variance was explained; The first component (PC1) accounted for 52.67% and could be defined by the compounds C39 and C21 and the second (PC2) for 45.87% and it could be related to the compounds C12 and C22. The diagram obtained from PCA shows the grouping of healthy brood samples compared to that of infected samples (Figure 4).
Thus, it is likely that the detection of characteristic volatile compounds may be used to discriminate the healthy from the AFB-infected brood. The analysis of more samples infected by AFB should shed some light on the further evaluation of the already mentioned compounds that characterize the infected brood and on a future establishment of AFB marker compounds that will be used in sensors placed inside and over the colony, allowing the correct diagnosis of the disease, consisting at the same time of a useful tool for beekeeping treatments.

4. Conclusions

Through the comparative evaluation of the chromatographic profile of healthy and AFB-infected brood, their distinction was made, showing differences both quantitatively and qualitatively in their volatile characteristics. Specifically, a relatively double number of volatile compounds was found in the AFB-infected (18–25) compared to the healthy brood (9–11). Moreover, the healthy brood was characterized by the higher presence of (Ε)-β-ocimene, while the compounds 2-nonanone, dimethyl disulfide, dimethyl trisulfide, and 2-undecanone could be used as possible markers for the detection of AFB disease. The greater number of volatile compounds in diseased brood arose because of their formation during the decomposition of the dead larvae. The results of the present study may be used as a helpful additional tool, along with microscopic analysis and macroscopic symptoms, for an accurate diagnosis of the disease, the main step to successfully control the disease along with appropriate beekeeping practices. However, further analyses on samples of diseased brood are required, enriching these findings and contributing to obtain a more complete gist of the volatile profile of the AFB-infected brood. The finding of possible volatile markers may be used in the future in train sensor systems that will confirm the diagnosis of the disease, without the need for visual observation or sampling and laboratory analysis of the brood.

Author Contributions

Conceptualization, V.L., D.K. and C.T.; methodology, V.L., D.K. and C.T.; investigation, V.L., D.K. and C.T.; writing—original draft preparation V.L., D.K., C.T. and M.-A.R.; visualization, V.L., D.K., C.T. and M.-A.R.; supervision, C.T. All authors have read and agreed to the published version of the manuscript.

Funding

This research was funded from Greek national funds through the Public Investments Program (PIP) of General Secretariat for Research and Technology (GSRT), under the Emblematic Action “The bee routes” (project code: 2018ΣΕ01300000).

Institutional Review Board Statement

Not applicable.

Informed Consent Statement

Not applicable.

Data Availability Statement

Data supporting reported results are restored at Laboratory of Apiculture-Sericulture, AUTH.

Conflicts of Interest

The authors declare no conflict of interest.

References

  1. Ash, C.; Priest, F.G.; Collins, M.D. Molecular identification of rRNA group bacilli (Ash, Farrow, Wallbanks and Collins) using a PCR probe test. Antonie Van Leeuwenhoek 1993, 64, 253–260. [Google Scholar] [CrossRef]
  2. Genersch, E. American Foulbrood in honeybees and its causative agent, Paenibacillus Larvae. J. Invetebr. Pathol. 2010, 103, S10–S19. [Google Scholar] [CrossRef]
  3. Okamoto, M.; Kumagai, M.; Kanamori, H.; Takamatsu, D. Antimicrobial Resistance Genes in Bacteria Isolated From Japanese Honey, and Their Potential for Conferring Macrolide and Lincosamide Resistance in the American Foulbrood Pathogen Paenibacillus Larvae. Front. Microbiol. 2021, 12, 667096. [Google Scholar] [CrossRef]
  4. Genersch, E. Paenibacillus larvae and American foulbrood–long since known and still surprising. J. Verbr. Lebensm. 2008, 3, 429–434. [Google Scholar] [CrossRef]
  5. Shimanuki, H.; Knox, D.A.; Furgala, B.; Caron, D.M.; Williams, J.L. Diseases and pest of honeybees. In The Hive and the Honey Be, 5th ed.; Graham, M.J., Ed.; Dadant and Sons: Hamilton, IL, USA, 1992; pp. 1083–1151. [Google Scholar]
  6. Holst, E.C. A simple field test for American foulbrood. Am. Bee J. 1946, 86, 14–34. [Google Scholar]
  7. De Graaf, D.C.; Alippi, A.M.; Brown, M.; Evans, J.D.; Feldlaufer, M.; Gregorc, A.; Hornitzky, M.; Pernal, S.F.; Schuch, D.M.T.; Titĕra, D.; et al. Diagnosis of American foulbrood in honey bees: A synthesis and proposed analytical protocols. Lett. Appl. Microbiol. 2006, 43, 583–590. [Google Scholar] [CrossRef]
  8. Schuch, D.M.T.; Madden, R.H.; Sattler, A. An improved method for the detection and presumptive identification of Paenibacillus larvae subsp larvae spores in honey. J. Apic. Res. 2001, 40, 59–64. [Google Scholar] [CrossRef]
  9. Ryba, S.; Titera, D.; Haklova, M.; Stopka, P. A PCR method of detecting American Foulbrood (Paenibacillus larvae) in winter beehive wax debris. Vet. Microbiol. 2009, 139, 193–205. [Google Scholar] [CrossRef]
  10. Hoage, T.R.; Rothenbuchler, W.C. Larval Honey Bee Response to Various Doses of Bacillus larvae Spores. J. Econ. Entomol. 1966, 59, 42–45. [Google Scholar] [CrossRef]
  11. Hornitzky, M.A.Z.; Wilson, S.C. A system for the diagnosis of the major bacterial brood diseases of honeybees. J. Apic. Res. 1989, 28, 191–195. [Google Scholar] [CrossRef]
  12. Bargańska, Z.; Namiesńik, J.; Ślebioda, M. Determination of antibiotic residues in honey. Trends Analyt. Chem. 2011, 30, 1035–1041. [Google Scholar] [CrossRef]
  13. Kivrak, Í.; Kivrak, S.; Harmandar, M. Development of a rapid method for the determination of antibiotic residues in honey using UPLC-ESI-MS/MS. Food Sci. Technol. 2016, 36, 90–96. [Google Scholar] [CrossRef] [Green Version]
  14. Rothenbuhler, W.C. Behavior Genetics of Nest Cleaning in Honey Bees. IV. Responses of F1 and Backcross Generations to Disease-Killed Brood. Am. Zool. 1964, 4, 111–123. [Google Scholar] [CrossRef] [Green Version]
  15. Arathi, H.S.; Burns, I.; Spivak, M. Ethology of Hygienic Behaviour in the Honey Bee Apis mellifera L. (Hymenoptera: Apidae): Behavioural repertoire of Hygienic bees. Ethology 2000, 106, 365–379. [Google Scholar] [CrossRef] [Green Version]
  16. Wilson-Rich, N.; Spivak, M.; Fefferman, N.H.; Starks, P.T. Genetic, individual, and group facilitation of disease resistance in insect societies. Annu. Rev. Entomol. 2009, 54, 405–423. [Google Scholar] [CrossRef] [Green Version]
  17. Evans, J.D.; Spivak, M. Socialized medicine: Individual and communal disease barriers in honey bees. J. Invertebr. Pathol. 2011, 30, 1035–1041. [Google Scholar] [CrossRef]
  18. Nazzi, F.; Vedona, G.D.; D’Agaro, M. A semiochemical from brood cells infested by Varroa destructor triggers hygienic behaviour in Apis mellifera. Apidologie 2004, 35, 65–70. [Google Scholar] [CrossRef] [Green Version]
  19. Chakroborty, N.K.; Bienefeld, K.; Menzel, R. Odor learning and odor discrimination of bees selected for enhanced hygienic behavior. Apidologie 2015, 46, 499–514. [Google Scholar] [CrossRef] [Green Version]
  20. McAfee, A.; Collins, T.F.; Madilao, L.L.; Foster, L.J. Odorant cues linked to social immunity induce lateralized antenna stimulation in honey bees (Apis mellifera L.). Sci. Rep. 2017, 7, 1–12. [Google Scholar] [CrossRef] [Green Version]
  21. Lee, S.; Lim, S.; Choi, Y.S.; Lee, M.L.; Kwon, H.W. Volatile disease markers of American foulbrood-infected larvae in Apis mellifera. J. Insect Physiol. 2020, 122, 104040. [Google Scholar] [CrossRef]
  22. Mondet, F.; Kim, S.H.; de Miranda, J.R.; Beslay, D.; Le Conte, Y.; Mercer, A.R. Specific Cues Associated With Honey Bee Social Defence against Varroa destructor Infested Brood. Sci. Rep. 2016, 6, 25444. [Google Scholar] [CrossRef] [PubMed]
  23. Wagoner, K.; Spivak, M.; Hefetz, A.; Reams, T.; Rueppell, O. Stock-specific chemical brood signals are induced by Varroa and Deformed Wing Virus, and elicit hygienic response in the honey bee. Sci. Rep. 2019, 9, 8753. [Google Scholar] [CrossRef]
  24. Kathe, E.; Seidelmann, K.; Lewkowski, O.; Conte, Y.L.; Erler, S. Changes in chemical cues of Melissococcus plutonius infected honey bee larvae. Chemoecology 2021, 31, 189–200. [Google Scholar] [CrossRef]
  25. Swanson, J.A.I.; Torto, B.; Kells, S.A.; Mesce, K.A.; Tumlinson, J.H.; Spivak, M. Odorants that Induce Hygienic Behavior in Honeybees: Identification of Volatile Compounds in Chalkbrood-Infected Honeybee Larvae. J. Chem. Ecol. 2009, 35, 1108–1116. [Google Scholar] [CrossRef] [PubMed]
  26. Gochnauer, T.A.; Shearer, D.A. Volatile acids from honeybee larvae infected with Bacillus larvae and from a culture of the organism. J. Apicul. Res. 1981, 20, 104–109. [Google Scholar] [CrossRef]
  27. Mărghitaş, L.; Dezmirean, D.; Chirilă, F.; Fiţ, N.; Bobiş, O. Antibacterial activity of different plant extracts and phenolic phytochemicals tested on Paenibacillus larvae bacteria. J. Anim. Sci. Biotechnol. 2011, 44, 94–99. [Google Scholar]
  28. Pellegrini, M.C.; Alonso-Salces, R.M.; Umpierrez, M.L.; Rossini, S.; Fusseli, S.R. Chemical Composition, Antimicrobial Activity, and Mode of Action of Essential Oils against Paenibacillus larvae, Etiological Agent of American Foulbrood on Apis mellifera. Chem. Biodivers. 2017, 14, e1600382. [Google Scholar] [CrossRef] [PubMed]
  29. Ratnieks, F.L.W. American Foulbrood: The Spread and Control of an Important Disease of the Honey Bee. Bee World 1992, 73, 177–191. [Google Scholar] [CrossRef]
  30. Mitroudi, C. Detection of Infestation of Bee Brood (Apis Mellifera L.) by the Bacterium Paenibacillus larvae Using Volatile Marker Compounds. Ph.D. Thesis, Department of Agriculture, Aristotle University of Thessaloniki, Thessaloniki, Greece, 2015, unpublished work. [Google Scholar]
  31. Tananaki, C. The study of Factors Affective the Volatile Compounds from Honeydew Honeys. Ph.D. Thesis, Department of Agriculture, Aristotle University of Thessaloniki, Thessaloniki, Greece, 2006, unpublished work. [Google Scholar]
  32. Tananaki, C.; Thrasyvoulou, A.; Giraudel, J.L.; Montury, M. Determination of volatile characteristics of Greek and Turkish pine honey samples and their classification by using Kohonen self organising maps. Food Chem. 2007, 101, 1687–1693. [Google Scholar] [CrossRef]
  33. Filipiak, W.; Sponring, A.; Filipiak, A.; Baur, M.; Ager, C.; Wiesenhofer, H.; Margesin, R.; Nagl, M.; Troppmair, J.; Amann, A. Microorganisms in vitro: Potential Breath Biomarkers for Early-Stage Diagnosis of Disease. In Volatile Biomarkers Non-Invasive Diagnosis in Physiology and Medicine, 1st ed.; Amann, A., Smith, D., Eds.; The Boulevard: Kidlington, UK, 2013; pp. 463–512. [Google Scholar]
  34. Carroll, M.J.; Duehl, A.J. Collection of volatiles from honeybee larvae and adults enclosed on brood frames. Apidologie 2012, 43, 715–730. [Google Scholar] [CrossRef] [Green Version]
  35. He, X.J.; Zhang, X.C.; Jiang, W.J.; Barron, A.B.; Zhang, J.H.; Zeng, Z.J. Starving honey bee (Apis mellifera) larvae signal pheromonally to worker bees. Sci. Rep. 2016, 6, 22359. [Google Scholar] [CrossRef] [PubMed] [Green Version]
  36. Maisonnasse, A.; Lenoir, J.C.; Beslay, D.; Crauser, D.; Conte, Y. E-β-Ocimene, a Volatile Brood Pheromone Involved in Social Regulation in the Honey Bee Colony (Apis mellifera). PLoS ONE 2010, 5, e13531. [Google Scholar] [CrossRef] [PubMed] [Green Version]
  37. Karabagias, I.K.; Badeka, A.; Kontominas, M.G. A decisive strategy for monofloral honey authentication using analysis of volatile compounds and pattern recognition techniques. Microchem. J. 2020, 152, 104263. [Google Scholar] [CrossRef]
  38. McAfee, A.; Chapman, A.; Iovinella, I.; Galagher-Kurtzke, Y.; Collins, T.F.; Higo, H.; Madilao, L.L.; Pelosi, P.; Foster, L.G. A death pheromone, oleic acid, triggers hygienic behavior in honey bees (Apis mellifera L.). Sci. Rep 2018, 8, 5719. [Google Scholar] [CrossRef] [PubMed] [Green Version]
  39. Almenar, E.; Hernádez-Muñoz, P.; Gavara, R. Evolution of Selected Volatiles in Chitosan-Coated Strawberries (Fragaria × ananassa) during Refrigerated Storage. J. Agric. Food Chem. 2009, 57, 974–980. [Google Scholar] [CrossRef]
  40. Bissinger, B.W.; Apperson, C.S.; Watson, D.W.; Arellano, C.; Sonenshine, D.E.; Roe, R.M. Novel field assays and the comparative repellency of BioUD®, DEET and permethrin against Amblyomma americanum. Med. Vet. Entomol. 2011, 25, 217–226. [Google Scholar] [CrossRef]
  41. Bouseta, A.; Scheirman, V.; Collin, S. Flavor and free amino acid composition of Lavender and Eucalyptus Honeys. J. Food Sci. 1996, 61, 683–687. [Google Scholar] [CrossRef]
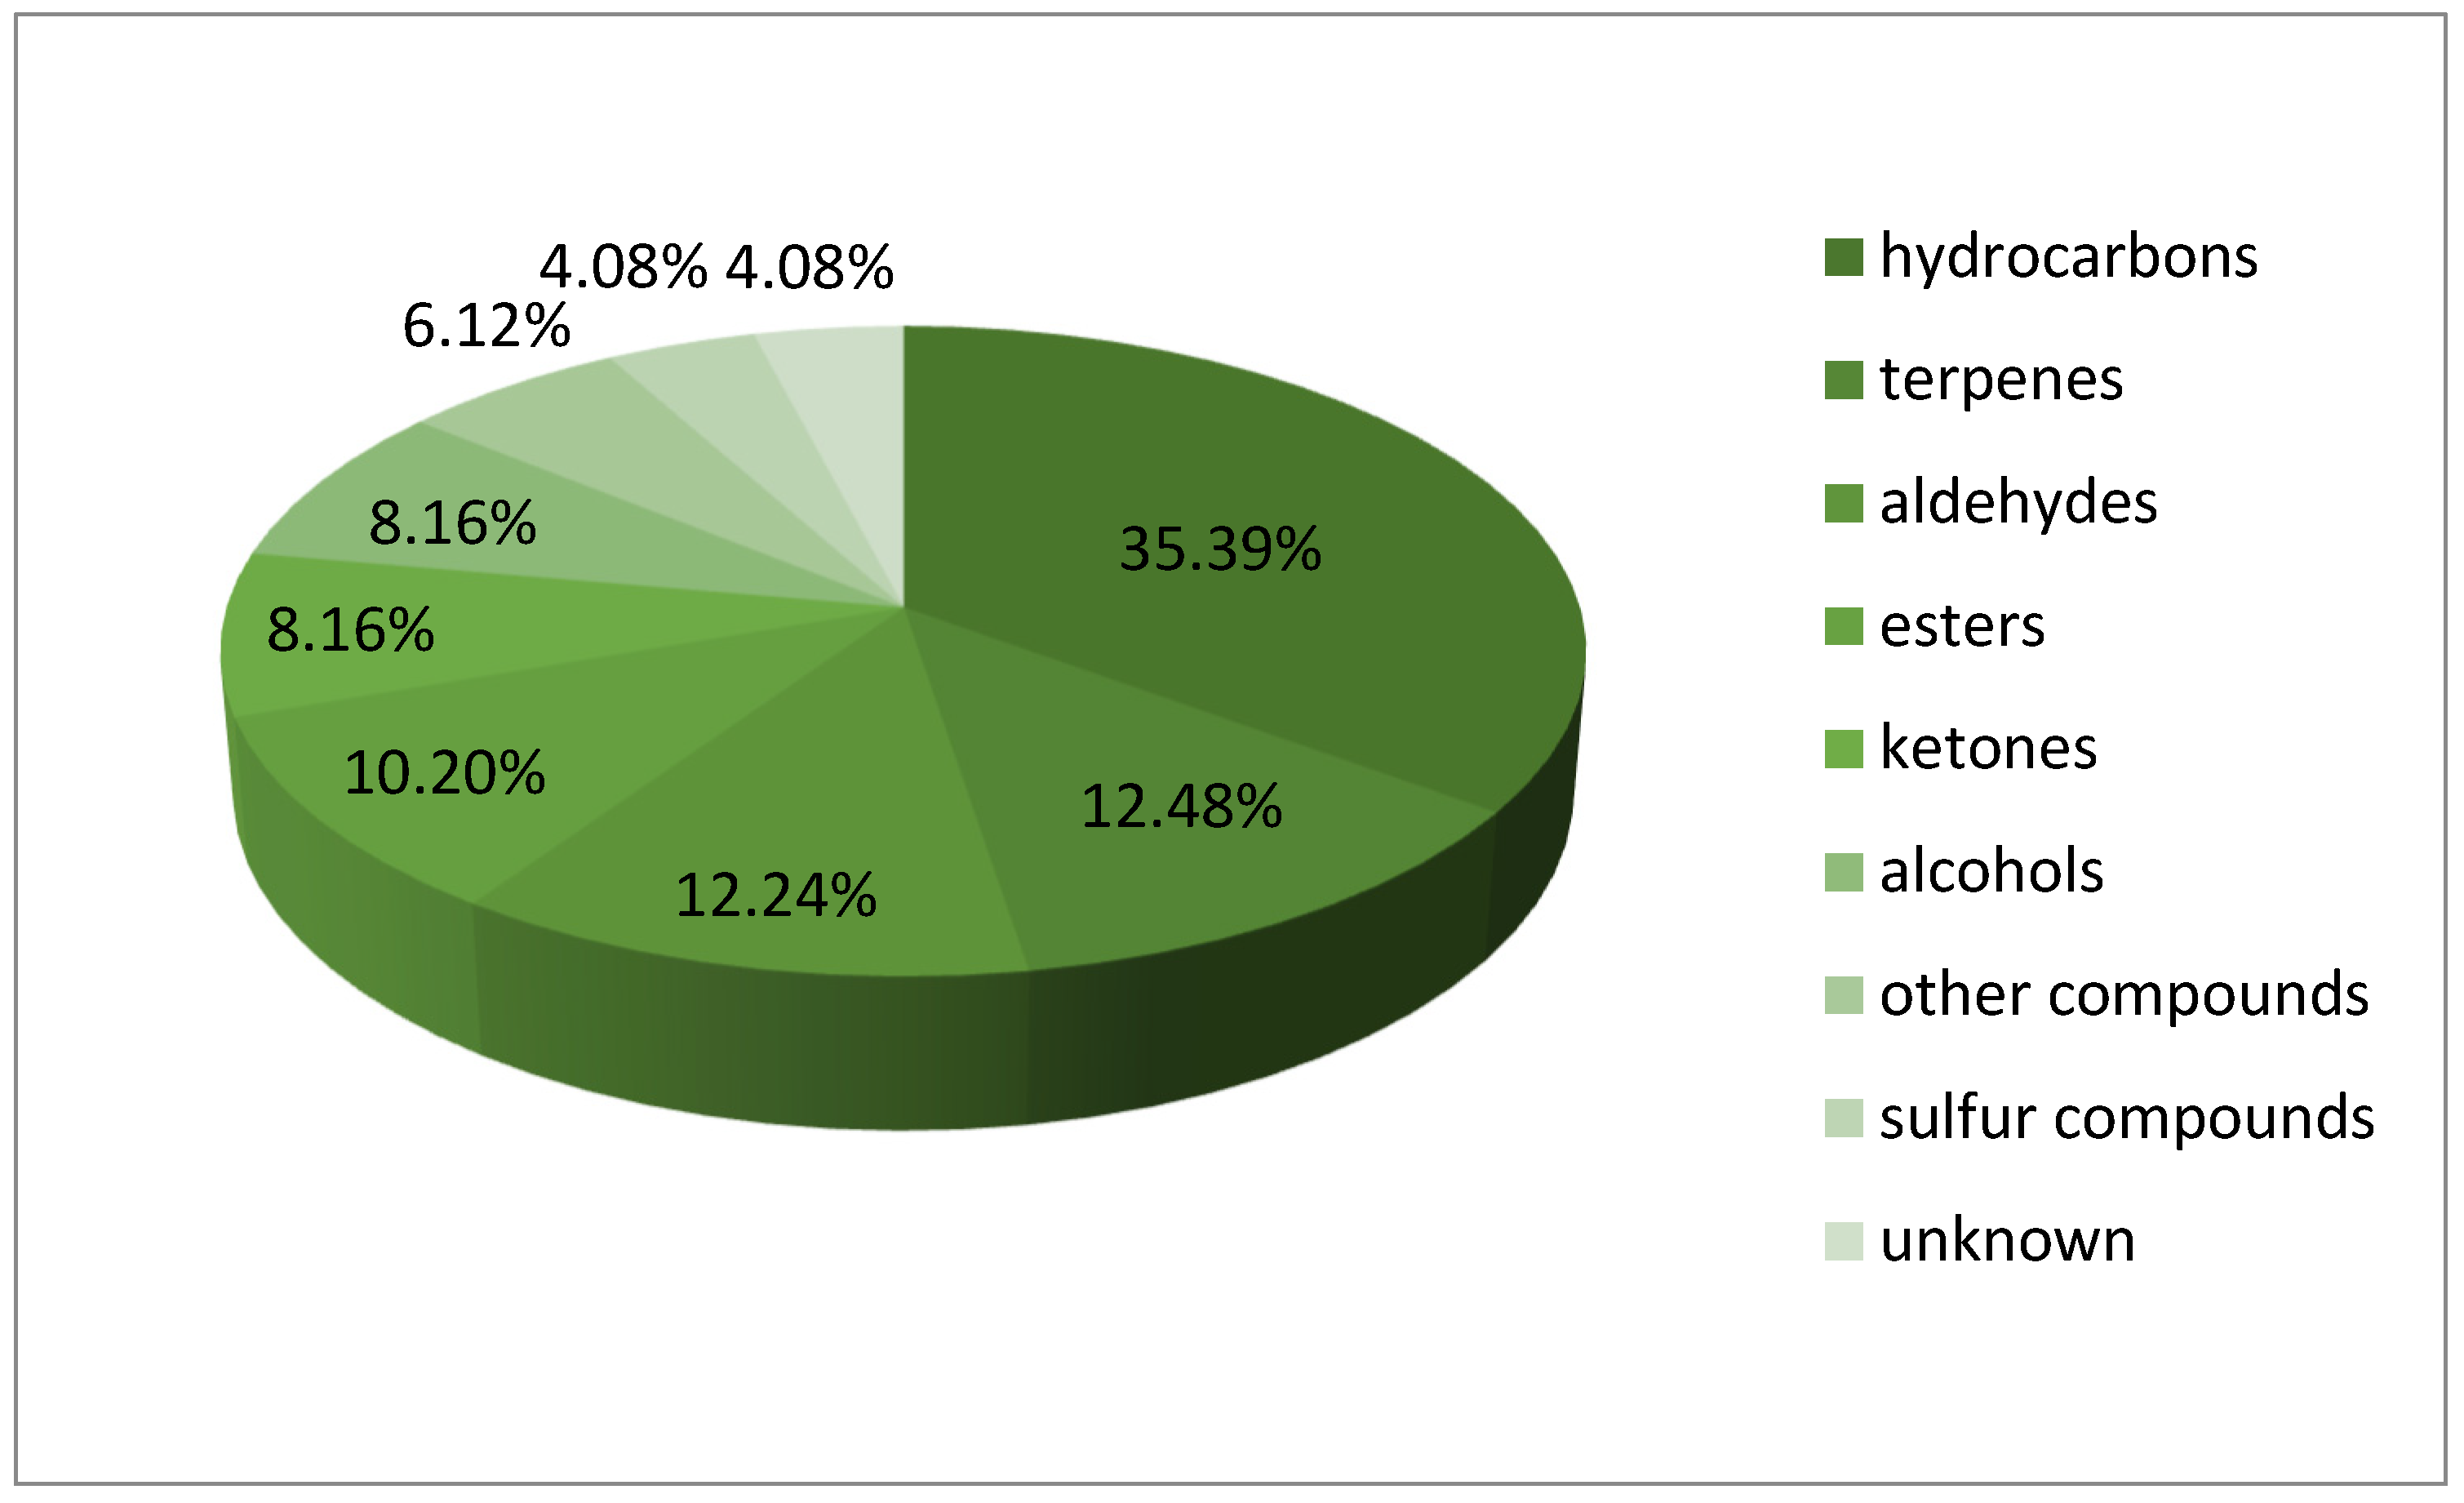
Figure 1. Grouping of the organic volatile compounds found in the examined brood samples.
Agriculture 12 00812 g001
Figure 2. Representative chromatogram of healthy brood (RT: Retention Time).
Agriculture 12 00812 g002
Figure 3. Representative chromatogram of brood infected by AFB (RT: Retention Time).
Agriculture 12 00812 g003
Figure 4. PCA plot regarding the groups of healthy and infected by AFB brood samples.
Agriculture 12 00812 g004
Table 1. Infection level (%) of bee colonies diagnosed with AFB.
Number of SamplesDegree of Infection (%)Diagnosis with Test Kit VITA
194positive
296positive
362positive
477positive
589positive
Table 2. Mean percentage of volatile compounds in healthy and unhealthy brood samples [Retention times––R.T., mass fractions (the underlined is the major fraction), average, and standard error].
CodeR.T. (min)R.I. Exp *CAS NumberVolatile Compound (Mass Fractions)Healthy Brood (%) (n = 5)Infected Brood (%) (n = 5)
C13.09624590-86-3Butanal, 3-methyl-(53, 57, 58, 60, 71, 86)n.d. **0.81 ± 0.73 (60%) ***
C23.2364096-17-3Butanal, 2-methyl-(55, 57, 60, 71, 86)n.d.0.50 ± 0.38 (60%)
C33.55679107-89-92-Pentanone (55, 58, 71, 86)n.d.0.08 ± 0.08 (60%)
C43.73700142-82-5Heptane (55, 57, 60, 71)n.d.0.48 ± 0.11 (80%)
C54.05711-unknown (55, 73, 88)n.d.4.53 ± 3.67 (60%)
C64.45725763-32-63-Buten-1-ol, 3-methyl-(56, 68, 86)n.d.0.09 ± 0.06 (60%)
C74.5372771-41-01-Pentanol (55,70)n.d.2.35 ± 2.12 (60%)
C84.61730137-32-61-Butanol,2-methyl-(55, 57,70)n.d.0.55 ± 0.15 (60%)
C94.7073396-54-81H-Pyrrole, 1-methyl-(55, 78, 80, 81)nd0.58 ± 0.38 (60%)
C104.75735624-92-0Disulfide, dimethyl (61,79, 94)nd0.58 ± 0.33 (100%)
C115.2475297-62-1Propanoic acid, 2-methyl-, ethyl ester (55, 71, 88, 116)n.d.0.04 ± 0.04 (60%)
C125.40757108-88-3Benzene, methyl-(Toluene) (65, 77, 91)0.23 ± 0.05 (100%)9.82 ± 2.31 (100%)
C135.84773556-24-1Butanoic acid, 3-methyl-, methyl ester (57, 74, 88, 101)n.d.0.08 ±0.08 (60%)
C146.25787120-92-3Cyclopentanone (55, 84)n.d.0.24 ± 0.24 (60%)
C156.63800111-65-9Octane (57, 71, 85, 114)0.19 ± 0.09 (100%)0.34 ± 0.18 (80%)
C166.79802105-54-4Butanoic acid, ethyl ester (55, 60, 71, 88)n.d.0.06 ± 0.06 (60%)
C178.3982998-01-12-Furancarboxaldehyde (Furfural) (60, 67, 96, 207)2.49 ± 2.47 (60%)0.03 ± 0.03 (60%)
C189.07840-unknown (55, 59, 73, 88)n.d.6.45 ± 6.42 (60%)
C199.358447452-79-1Butanoic acid, 2-methyl-, ethyl ester (57, 74, 85, 102)n.d.0.32 ± 0.32 (60%)
C209.57848108-64-5Butanoic acid, 3-methyl-, ethyl ester (57, 60, 70, 73, 85, 88)n.d.0.12 ± 0.10 (60%)
C219.75851100-41-4Ethylbenzene (91,106)0.02 ± 0.01 (80%)2.52 ± 0.97 (80%)
C2210.2785995-47-6Benzene, 1,2-dimethyl-(o-xylene) (91,106)0.14 ± 0.03 (100%)11.21 ± 4.35 (100%)
C2311.86885108-38-3Benzene, 1,3-dimethyl-(91,106)0.05 ± 0.02 (80%)4.43 ± 1.71 (100%)
C2412.03888110-43-02-Heptanone (58, 71, 91)n.d.0.71 ± 0.63 (80%)
C2512.64898111-84-2Nonane (57, 71, 85, 95)0.09 ± 0.03 (100%)0.68 ± 0.51 (80%)
C2615.1392580-56-8Bicyclo [3.1.1]hept-2-ene, 2,6,6-trimethyl-
(α-Pinene) (67, 79, 93, 105)
0.09 ± 0.03 (80%)8.23 ± 4.87 (80%)
C2717.71952100-52-7Benzaldehyde (51, 77, 106)0.17 ± 0.16 (60%)n.d.
C2817.81953611-14-3Benzene, 1-ethyl-2-methyl-(78, 91, 105, 120)n.d.0.39 ± 0.27 (60%)
C2918.179573658-80-8Dimethyl trisulfide (64, 79, 94, 111, 126)n.d.0.16 ± 0.02 (100%)
C3019.54972620-14-4Benzene, 1-ethyl-3-methyl- (91, 105, 120)n.d.0.04 ± 0.04 (60%)
C3120.7598513475-82-6Heptane, 2,2,4,6,6-pentamethyl-(57, 71, 85)n.d.0.08 ± 0.08 (60%)
C3220.92986622-96-8Benzene, 1-ethyl-4-methyl- (4-Ethyltoluene)(91, 105, 120)n.d.0.47 ± 0.30 (60%)
C3321.20989127-91-3Bicyclo [3.1.1]heptane, 6,6-dimethyl-2-methylene-
(beta -Pinene) (56, 69, 93, 105)
0.04 ± 0.03 (60%)0.02 ± 0.02 (60%)
C3422.331002124-13-0Octanal (56, 69, 84)n.d.0.49 ± 0.49 (60%)
C3522.501004471-84-1Bicyclo(2.2.1)heptane, 7,7-dimethyl-2-methylene-(α-Fenchene) (56, 77, 85, 93, 105, 121, 136)n.d.0.03 ± 0.03 (60%)
C3624.161026138-86-3Cyclohexene, 1-methyl-4-(1-methylethenyl)-(Limonene) (53, 67, 77, 79, 93, 107)n.d.0.08 ± 0.08 (60%)
C3724.291027470-82-61,3,3-Trimethyl-2-oxabicyclo [2.2.2]octane (Eucalyptol) (55, 69, 81, 84, 93, 96, 108, 111)n.d.0.06 ± 0.06 (60%)
C3825.3310413779-61-11,3,6-Octatriene, 3,7-dimethyl-(E) ((Ε)-β-ocimene)(53, 67, 79, 93, 105,121)0.40 ± 0.06 (100%)2.41 ± 0.88 (100%)
C3926.1010513338-55-41,3,6-Octatriene, 3,7-dimethyl-((Z)-β-ocimene) (53, 67, 79, 93, 105,121)96.03 ± 2.71 (100%)37.63 ± 12.32 (100%)
C4026.591058934-80-5Benzene, 4-ethyl-1,2-dimethyl-(91, 105, 119)n.d.0.06 ± 0.06 (60%)
C4128.3810812870-04-4Benzene, 2-ethyl-1,3-dimethyl-(91, 105, 119)n.d.0.04 ± 0.04 (60%)
C4228.6010841124-11-4Pyrazine, tetramethyl-(54, 136)n.d.0.16 ± 0.15 (60%)
C4330.071104124-19-6Nonanal (57, 70, 82, 98)0.04 ± 0.04 (60%)n.d.
C4430.081105821-55-62-Nonanone (58, 71, 124, 142)n.d.1.92 ± 1.57(100%)
C4534.16117391-20-3Naphthalene (102, 128)n.d.0.33 ± 0.33 (60%)
C4637.86124217057-82-81H-Indene, 2,3-dihydro-1,2-dimethyl-(91, 115, 131, 146)n.d.0.03 ± 0.03 (60%)
C4739.421274700-12-9Benzene, pentamethyl (115, 133, 148)n.d.0.05 ± 0.05 (60%)
C4839.971285264-09-5Benzocycloheptatriene (115, 139, 142)n.d.0.22 ± 0.22 (60%)
C4940.551297112-12-92-Undecanone (58, 71, 85, 95)n.d.0.07 ± 0.06 (60%)
* R.I.exp: Retention index values based on the calculations using the standard mixture of alkanes, using the formula Ix = 100 × n +100 × (tx − tn)/(tn+1 − tn); ** n.d.: not detected; *** Percentage (%) of analyzed samples in which each volatile compound was detected.
Publisher’s Note: MDPI stays neutral with regard to jurisdictional claims in published maps and institutional affiliations.