Article

Test and Analysis on Friction Characteristics of Major Cotton Stalk Cultivars in Xinjiang

1
College of Mechanical and Electrical Engineering, Shihezi University, Shihezi 832000, China
2
Key Laboratory of Modern Agricultural Machinery, Xinjiang Production and Construction Corps, Shihezi 832000, China
*
Author to whom correspondence should be addressed.
Agriculture 2022, 12(7), 906; https://doi.org/10.3390/agriculture12070906
Submission received: 17 May 2022 / Revised: 14 June 2022 / Accepted: 17 June 2022 / Published: 22 June 2022
(This article belongs to the Section Agricultural Technology)

Abstract

:
The friction characteristic parameters of cotton stalks are important basic physical parameters required to establish the crushing mechanics model and study the separation machinery of film residue mixtures. In this paper, the friction characteristics of cotton stalks were studied using response surface methodology, and the influence of the variation in contact materials, sampling location, and moisture content on the static sliding friction coefficient (μs) and stable static rolling angle (φs) were analyzed. The results show that the contact materials, sampling location, and moisture content significantly influence the μs and φs. When the contact material is cotton stalk bark, the μs and φs values of cotton stalks are maximum. When the sampling location of the cotton stalk changes from top to bottom, the μs increases and φs decreases, respectively, while the moisture content has an opposite influence on the μs and the φs. The model coefficient of the μs and the φs indicates that the influencing factors have a high degree of explanation for the influence on the μs and φs. This study on the friction characteristics of cotton stalks can provide theoretical references and basic parameters for the separation technology research and equipment development of film residue mixtures.

1. Introduction

In the 1970s, plastic film mulch planting techniques were introduced to China and became popularized with rapid application in Xinjiang, China. The technique greatly increased crop yield and brought greater economic benefits to farmers [1,2], rendering Xinjiang the main cotton production area in China [3,4]. The cotton planting area on which plastic mulch was used in Xinjiang was 2501.9 × 103 ha2 in 2020, accounting for about 78.9% of China’s total cotton planting area [5]. Long-term continuous film-covering planting has promoted cotton production and income in Xinjiang at the cost of farmland residual plastic mulch pollution [6,7,8]. In recent years, the mechanized recycling of plastic film has alleviated residual film pollution, but the recycled plastic film contains many cotton stalks and other impurities [9]. As shown in Figure 1, the mechanically recovered film residue mixtures are characterized by the disordered distribution of film–stalk soil, complex film–stalk winding, and strong film–soil adhesion. Thus, it becomes difficult to carry out initial cleaning and resource utilization, giving rise to random dumping, landfill, and incineration of film residue mixtures and the tendency for secondary environmental pollution and waste of resources. Cotton stalks are primary components of film residue mixtures, whose friction characteristics are significant to studying the separation mechanism of the film residue mixtures, development of the separation machinery, design and improvement of working parts [10]. The characteristic friction parameters are necessary for computer simulation of cotton stalk processing and film residue mixture separation [11].
In recent years, researchers have studied the friction characteristics of agricultural materials, achieving beneficial results. Shinners et al. [12] studied the influence of moisture content, normal pressure, velocity, and surface type on alfalfa straw and chopped forage sliding friction coefficient, obtaining the friction coefficient range under different conditions. Parde et al. [13] and Mani et al. [14] showed that the moisture content significantly affects the sliding friction coefficient of buckwheat straw and the friction coefficient of ground corn stover on a galvanized steel surface. Afzalinia et al. [15] determined the static coefficients of friction of alfalfa and wheat straw on the surface of polished steel, as affected by plant material water content. Chevanan et al. [16] studied the variation laws of friction characteristics of wheat straw and corn stalks, concluding that the size of the straw or stalk pieces had no significant effect on the friction coefficient. Li et al. [17] studied the friction characteristics between the main stalk and the lateral stalk of rape on a separation sieve surface, and found that the friction coefficient of the rape stalk increased with the moisture content. Kallan et al. [18] analyzed the effect of moisture content on the sliding friction coefficient between wheat straw and contact materials. Fang et al. [19] developed a model of the sliding friction angle between soybean stalks with different moisture content and contact materials via a single-factor friction test. Huo et al. [20] found the ranges of 0.49 to 0.55 and 0.58 to 0.60 for the maximum static friction coefficient for corn stalks on stainless steel and rubber materials, respectively, for corn stalk pieces with lengths of 0 to 10 mm. Zhang et al. [21] conducted friction tests on gorgon nuts and analyzed the variation in the relationship between the maturity, contact surface roughness, and stable static rolling angle. Lu et al. [22] measured the friction coefficient of wheat straw and corn stalks on various contact materials, and analyzed the relationship between different contact materials, straw locations, soil moisture content, contact angle, and the friction coefficient. Wang et al. [23] measured the sliding friction coefficient of rice straw on steel-roll by orthogonal test and single-factor test and analyzed the influence of moisture content of rice straw, positive compressive stress, and steel-roll linear speed on the sliding friction coefficient between rice straw and steel-roll. According to Kaliniewicz et al. [24], the sliding friction coefficient of cereal kernels on steel plates increased with roughness. In summary, researchers have studied the friction characteristics of stalks and granular agricultural materials on various materials [25,26,27,28,29]. However, few studies have been conducted concerning the friction characteristics of stalks of the major cotton cultivars in Xinjiang. Cotton stalks, as primary impurities in the film residue mixtures of mechanical harvesting, contain all parts of the cotton stalk despite their nonuniform length and poor integrity. When the film residue mixtures are broken and separated, friction contact will be produced between cotton stalks and different contact materials, and the friction characteristic parameters of the cotton stalk are important basic physical parameters required to establish the crushing mechanics model and study the separation machinery of the film residue mixture. Therefore, it is necessary to conduct further research on the cotton stalk friction characteristics.
Previous studies have mainly involved the effect of a single factor on the friction characteristics of the stalk. Only a small amount of research on the interactions between multiple factors has been conducted. In this study, the friction test was conducted on major cotton cultivar stalks in Xinjiang. The influences of different contact materials, location of the stalk sample along the length of the cotton stalk, and stalk moisture content on the friction characteristics of cotton stalks were studied using response surface methodology. How single-factor terms and their interaction terms influence the friction characteristics of cotton stalks were explored, aiming to provide theoretical references for the research and design of stalk harvesting and processing, film residue mixture crushing, and separation technology and equipment of cotton cultivars stalks, and provide basic data for computer simulation of cotton stalks processing and equipment optimization design.

2. Materials and Methods

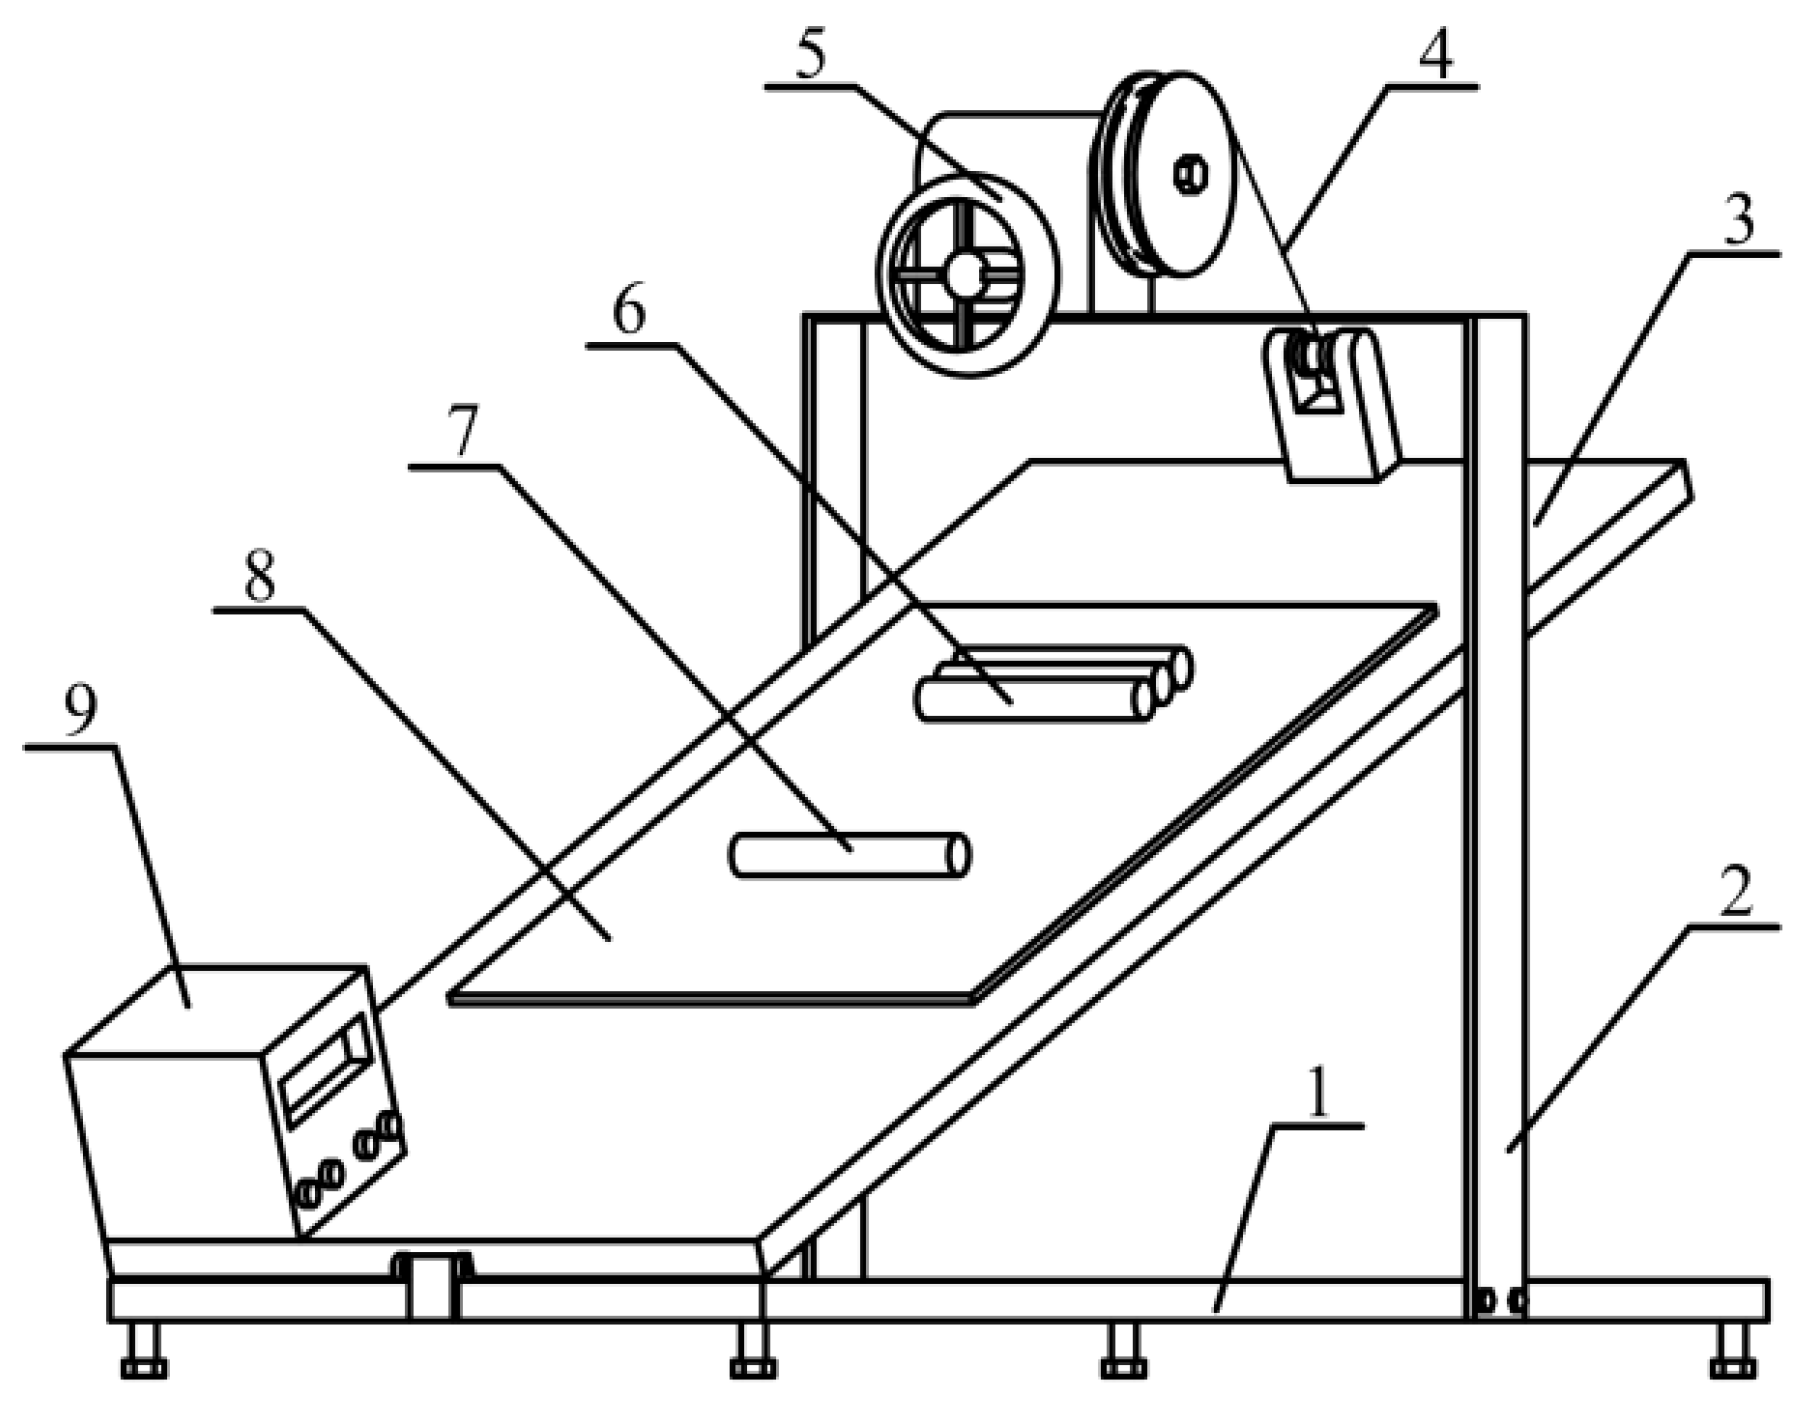
2.1. Test Materials and Instruments
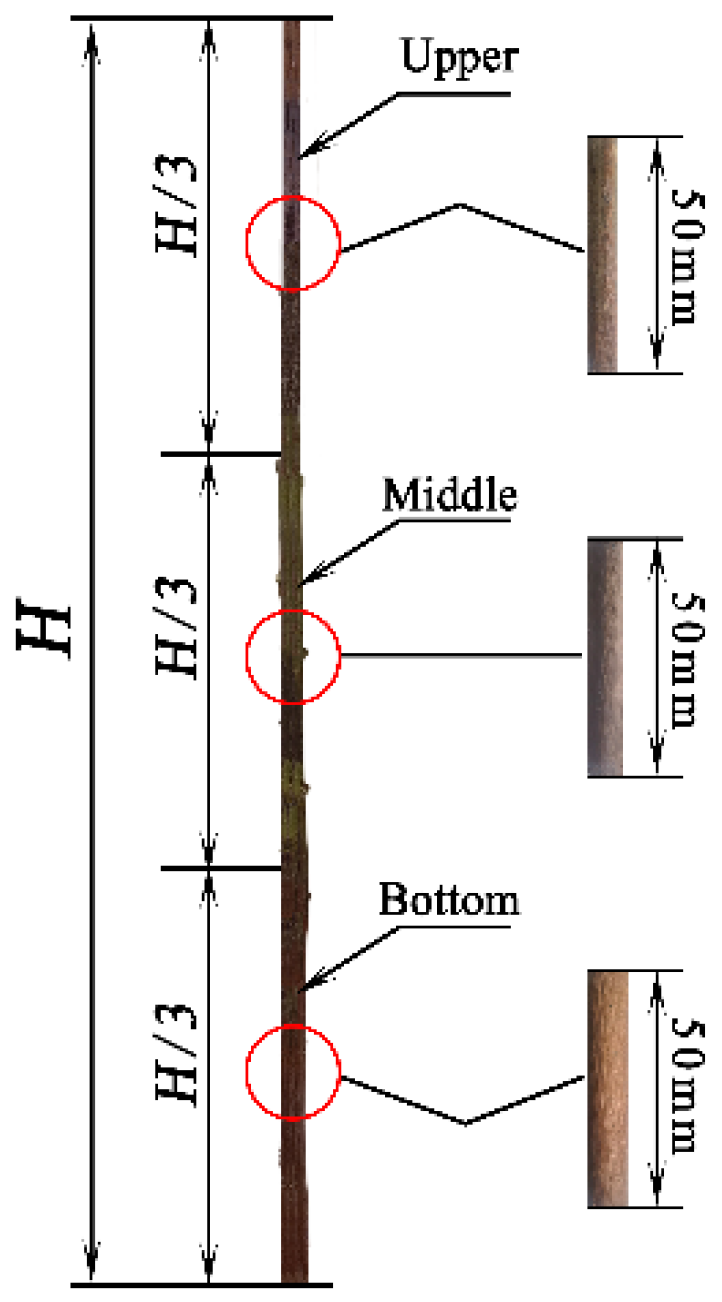
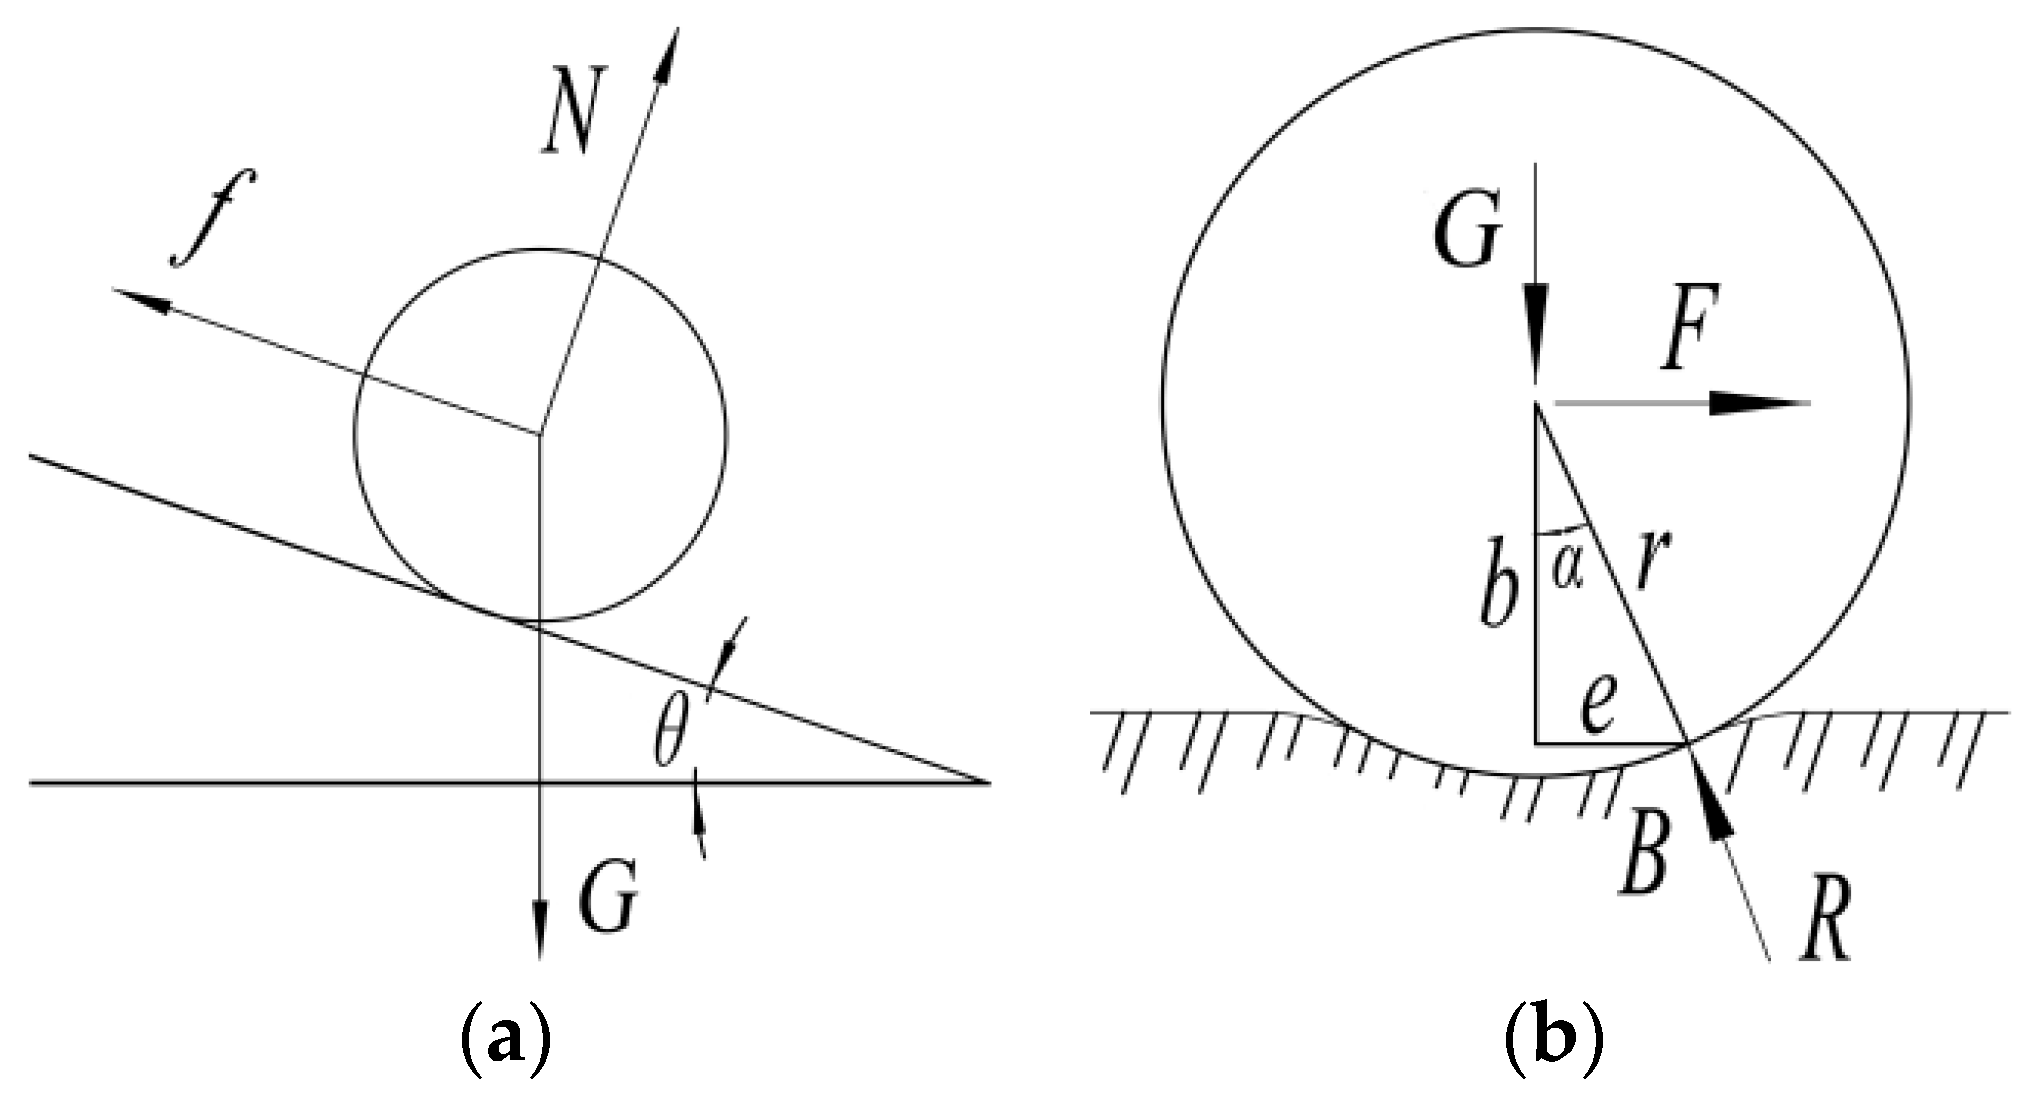
Cotton stalk samples were selected from a cotton field at Shihezi University in Shihezi, China. The chosen cotton cultivar was Xinluzao series No. 80, with a plant height of 650 to 850 mm. The moisture content of the fresh cotton stalks was 46.13% to 69.8% wet basis. During the field sampling performed on 8 October, 2021, cotton plants with few branches, no damage, good straightness, and small variation in main stem diameter were selected as test samples. The cotton plants were cut along the ground surface with trimming pliers during sampling. After removing lateral branches and leaf buds, the cotton stalks were divided into three parts according to the height of plants, being the upper, middle, and lower parts. Samples with lengths of 50 ± 0.5 mm were cut from the center of each part to both sides (Figure 2), while stalk nodes were avoided during sample preparation. There were 20 samples in each group of stalk pieces, and the average diameters of cotton stalk samples prepared in the upper, middle, and lower parts were 5.82 ± 0.11 mm, 6.57 ± 0.20 mm, and 7.53 ± 0.12 mm, respectively.
The instruments and equipment in the test were as follows: XMTA-600 electrothermal blowing dry box (Yatai Instrument Co., Ltd., Yuyao, China), JMB5003 electronic balance (measuring accuracy: 0.001 g; Jiming Weighting and Calibration Equipment Co., Ltd., Yuyao, China) for measuring the mass of cotton stalks, DP-160 electronic goniometer (measuring accuracy: 0.01°; Jining Shance Instrument Co., Ltd., Jining, China) for measuring the angle, DL-91150 electronic digital caliper (measuring accuracy: 0.01 mm; Deli Group Co., Ltd., Ningbo, China), and a FASTEC-TS4 high-speed camera capable of 510 frames per second (Fastec Imaging, San Diego, CA, USA). The measurement device for determining friction characteristics is shown in Figure 3.

2.2. Test Methods

In the test, the cotton stalk samples were adjusted to the required moisture content by rehydration method by referring to GB/T 1931-2009 and the literature [30,31]. When the moisture content of the cotton stalks was adjusted, the samples were placed in an electrothermal blowing dry box and dried at (103 ± 2) ℃ for 8 h. Then, the samples were weighed with a JMB5003 electronic balance, which was repeated after 2 h. Afterward, the two results were compared. If the relative error was no more than 0.5%, the moisture content of the sample was considered as 0. The dried samples were soaked in water for 24 h to absorb water to be in a saturated state. The moisture content of the samples was adjusted via an electrothermal blowing dry box at (45 ± 2) ℃ according to the set moisture content gradient before they were stored in an artificial climate chamber at 30 °C with a relative humidity of 95%. The moisture content of cotton stalks was calculated by Equation (1).
M w = m w m s + m w × 100 %
where Mw is the wet-basis moisture content, mw is the mass of water, and ms is the mass of oven-dried cotton stalks.
The force analysis of cotton stalk sliding on the contact material surface is shown in Figure 4a. Since the deformation of cotton stalks is very small without external force, the small deformation between cotton stalks and contact materials is ignored in this paper. To improve the accuracy of the static friction coefficient and stable static rolling angle between cotton stalks, the cotton stalk bark and film were evenly spread on the lifting plate to avoid wrinkles. Before testing the static sliding friction coefficients between cotton stalks and different contact materials, we placed the cotton stalk bark, plastic film, and stainless steel on the lifting plate. Moreover, the prepared samples were placed at a fixed position on the contact material surface. In order to avoid the rolling of a single cotton stalk, three cotton stalks adhered together. During the test, the handle was slowly rotated to raise the lifting plate at a constant speed, and a high-speed camera was used to record the images. The angle value displayed by the electronic goniometer was recorded when the sample began to slide, and the static sliding friction coefficient (μs) was calculated by Equation (2) when f1 equaled f2. Each group of tests was repeated five times, and the average value was calculated.
{ N = G c o s θ f 1 = μ s N f 2 = G s i n θ μ s = t a n θ
where N and G are the normal force and weight caused by gravity, f1 and f2 are the friction force and tangential components of the sample weight, and θ is the angle of the lifting plate relative to the horizontal plane (°).
The basic theoretical research on rolling friction characteristics showed that when the cotton stalk rolled on the contact material surface under the acting force F, if the contact surface deformed, a resultant force R would be applied on the cotton stalk [32]. Therefore, the corresponding force analysis of the cotton stalk is shown in Figure 4b. Equation (3) is the moment equation of the cotton stalk at the action spot B:
F r cos α G e = 0
With slight contact material surface deformation and α ≈ 0, the rolling resistance of the cotton stalk can be expressed as Equation (4):
F = e G r
where F is the rolling resistance (N), r is the radius of the cotton straw, α is the angle between the resultant force R and the gravity G (°), and e is the vertical distance from the action spot to gravity (mm).
According to Equation (4), the rolling resistance between the cotton stalk and contact material can be measured by the stable rolling angle. Based on the test results of the stable static rolling angle between cotton stalks and different contact materials, the operation steps and methods were the same as those of the static sliding friction coefficient test. As the cotton stalk started rolling on the contact material surface, the stable static rolling angle (φs) was the value displayed by the electronic goniometer. Each group of tests was repeated five times, and the average value was calculated.

2.3. Test Design

To study the influence laws of contact materials A, sampling location B, and moisture content C on the friction characteristics of cotton stalks, this study adopted the response surface methodology to determine the friction characteristics of cotton stalks by assuming the static sliding friction coefficient (μs) and stable static rolling angle (φs) as the test response indexes and different A, B, and C values as the test influence factors. The actual values and coded values of each test influence factor are shown in Table 1.
The Box–Behnken module of the data processing software Design-Expert, a data processing software, was used to design the response surface test with three factors and three levels. By constructing the corresponding second-order response model based on test results analysis, this study analyzed the effects of single-factor terms and their interaction terms vs. the static sliding friction coefficient and stable static rolling angle of cotton stalks. The response surface test scheme and results are shown in Table 2. The μs and φs of the cotton stalk were tested in 17 groups, and the tests for each group were repeated ten times, making a total of 340 tests.

3. Results and Discussion

The friction characteristics of cotton stalks were tested according to the test scheme, and Table 2 shows the test results. An analysis of variance (ANOVA) of the test results was performed using Design-Expert, a data processing software. Effects of single-factor terms and their interaction terms on the friction characteristics of cotton stalks were analyzed. Polynomial regression equation was established, involving primary, quadratic, and interaction terms. The analysis results are shown in Table 3.

3.1. ANOVA of Friction Characteristics

3.1.1. ANOVA of Static Sliding Friction Coefficient

As shown in Table 3, the F value of the model (119.26) and the low p-value (p < 0.0001) confirmed that the model was significant within the 95% confidence interval. The F value of the lack of fit is 1.35, which indicates that the lack of fit is not significant relative to the pure error. The p-value of the lack of fit is 0.378, greater than 0.05, indicating that the analysis model of test data is effective. The determination coefficient (R2 = 0.99) and the adjusted coefficient of determination (R2adj = 0.99) are both close to 1, suggesting that the calculated model fits well with the test data. The coefficient of variation CV = 1.20%, which indicates the high-degree explanation of the factors A, B, and C in terms of their influence on the μs.
Furthermore, the regression variance analysis of the static sliding friction coefficient under different test conditions showed that the single-factor terms A (p = 1.4 × 10⁻⁴ < 0.01), B (p < 0.01), and C (p < 0.01) were extremely significant factors affecting the μs. The interaction terms AC (0.01 < p = 2.78 × 10⁻² < 0.05), BC (0.05 < p = 3.41 × 10⁻² < 0.01), and A2 (0.01 < p = 4.77 × 10⁻² < 0.05) were significant factors affecting the μs, while the other factors (p > 0.05) were not crucial. Therefore, according to the regression analysis, the importance ranking of the single-factor terms and their interaction terms on the μs was: B = C > A > AC > BC > A2.

3.1.2. ANOVA of Stable Static Rolling Angle

As shown in Table 3, The F value of the model (41.33) and the low p-value (p < 0.0001) confirmed that the model was significant within the 95% confidence interval. The F value of the lack of fit is 3.47, which indicates that the lack of fit is not significant relative to the pure error. The p-value of the lack of fit is 0.130 is greater than 0.05, indicating that the analysis model of test data is effective. The determination coefficient (R2 = 0.98) and the adjusted coefficient of determination (R2adj = 0.96) are both close to 1, suggesting that the calculated model fits well with the test data. The coefficient of variation CV = 4.90% indicates the influencing factors A, B, and C have a high degree of explanation for the influence of the φs of cotton stalks.
The regression variance analysis of the stable static rolling angle of cotton stalks under different test conditions showed that the single-factor terms A (p = 9 × 10⁻⁴ < 0.01), B (p < 0.01), and C (p = 1.3 × 10⁻⁴ < 0.01), and the interaction terms A2 (p = 9 × 10⁻⁴ < 0.01) and C2 (p = 8.1 × 10⁻⁴ < 0.01), were extremely significant factors affecting the φs. The interaction terms AB (0.01 < p = 4.86 × 10⁻² < 0.05) and B2 (0.01 < p = 1.71 × 10⁴ < 0.05) were significant factors affecting the φs, while the other factors (p > 0.05) were insignificant factors affecting the φs. Therefore, according to the regression analysis, the influence of the single-factor terms and their interaction terms on the φs can be ranked as B > A > A2 > C > C2 > B2 > AB.

3.2. Single-Factor Effect Analysis

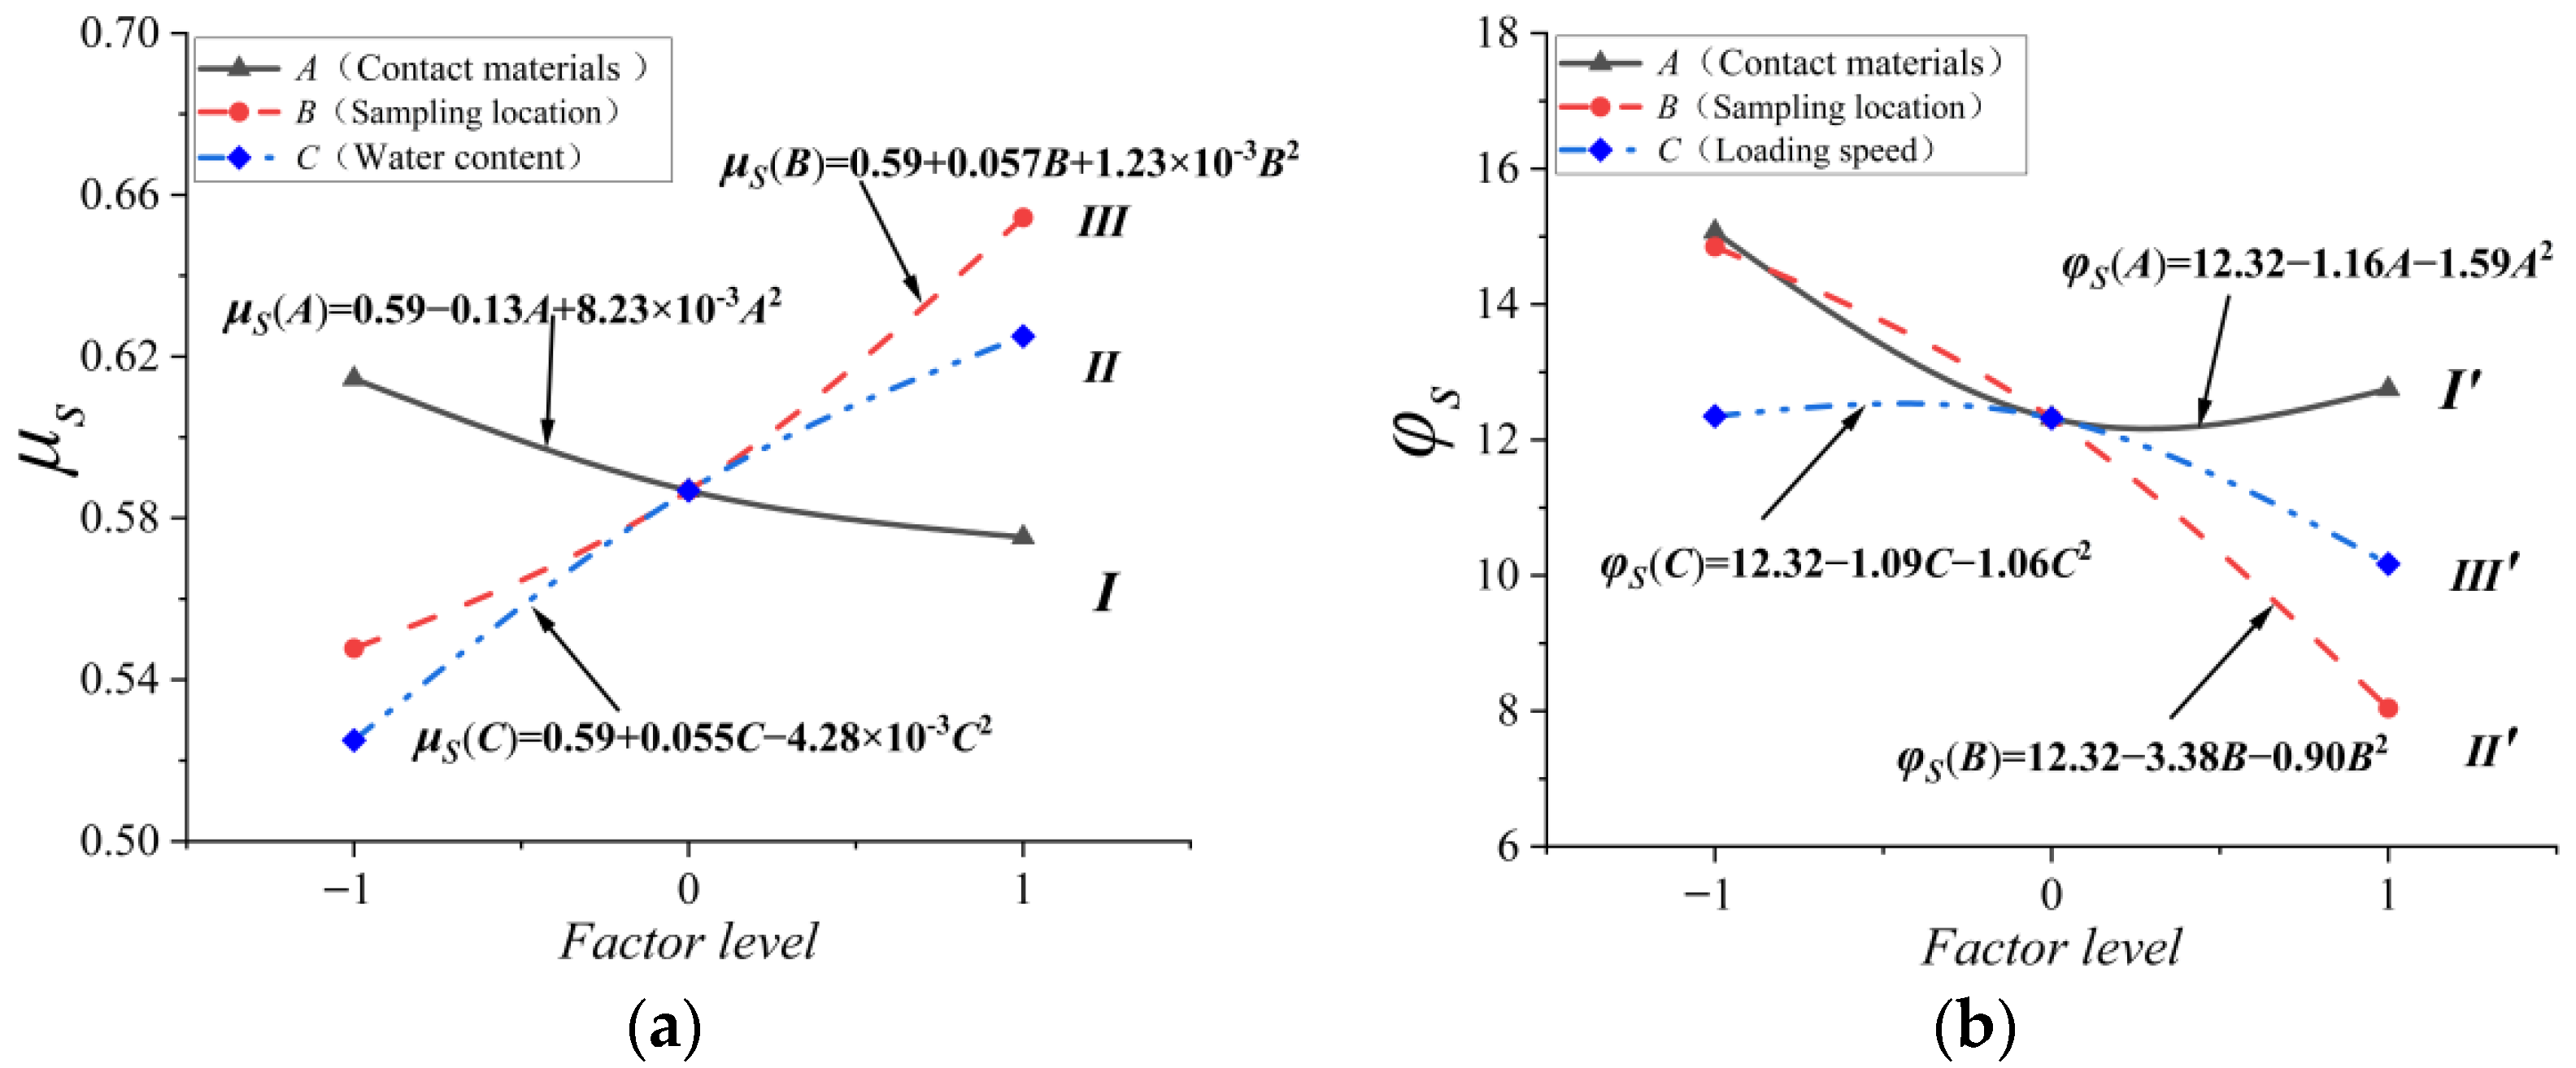
3.2.1. Influence of Single-Factor on Static Sliding Friction Coefficient

According to the above analysis, the contact materials (A), sampling locations (B), and moisture content (C) all influenced the static sliding friction coefficient and the stable static rolling angle of cotton stalks. In order to obtain the influence trend of each factor on the static sliding friction coefficient and the stable static rolling angle, any two factors were fixed at the center coding level 0 for the single-factor analysis, as shown in Figure 5.
As shown by the I curve in Figure 5a, under certain conditions of B and C, with the level value of contact material A changing from −1 to +1, the μs (A) decreased from the maximum value of 0.612 to 0.575, indicating the static sliding friction coefficient ranking between three different contact materials and cotton stalks: Cotton stalk > Plastic film > Stainless steel. When the cotton stalks contacted the bark, the static sliding friction coefficient was the maximum (0.612), probably due to the large surface texture and roughness of cotton stalks. When the coding values of contact material A were 0 and +1, the μs (A) were 0.587 and 0.575, respectively. That is, when the cotton stalk group was contacted with plastic film and stainless steel, the sliding friction coefficients between contact materials were small and very close. The joint movement tended to be hindered, resulting in a large static sliding friction coefficient value between the two materials. However, the cotton stalks in the test were prone to deformation of the plastic film while sliding on the film surface, resulting in greater sliding resistance. The surface of the plastic film is smoother than the cotton stalk bark, which could be the reason for smaller coefficient values. When the cotton stalks contacted the stainless steel surface, the static sliding friction coefficient was the minimum. Compared with the cotton stalk bark, the cotton stalks and the stainless steel surface were multi-line contacts. The surface roughness and deformation of the stainless steel and the sliding resistance of cotton stalks were all small, resulting in a small static sliding friction coefficient between the two materials. Lu et al. (2016) researched the variation law of the sliding friction coefficient between corn straw and contact materials, and the results showed that the μs between corn straw and wood, plastic, and Q235 decreased in turn [22]. The variation law of static sliding friction coefficient between cotton stalk and different contact materials obtained in this paper is the same as this conclusion.
As shown by the II curve in Figure 5a, under certain conditions of A and C, with the level value of sampling location B changing from −1 to +1, curve showed an upward trend, and the values of the μs (B) increased from the minimum value of 0.534 to 0.648, indicating that the static sliding friction coefficient between different sampling locations and cotton stalks was in the following order: Upper part > Middle part > lower part. As can be seen from the II curve, when the coding value of sampling location B changes in the range of –1 to 0, the increasing trend of curve II is slow, while in the range of 0 to +1, the increasing trend of curve II is obvious. When B was the upper and lower parts of cotton stalks, the corresponding μs were at their lowest and the highest, respectively, which strongly correlated with the biological structure characteristics. When B changed from the top to the bottom, the texture of the cotton stalk epidermis became complex, and the surface roughness gradually increased, resulting in a larger sliding resistance as the cotton stalk was sliding on the contact materials and causing the increase in μs. The law is very similar to the influence of different sampling positions on the shear and compression mechanical parameters of cotton stalks [33].
As shown by the curve in Figure 5a, the μs (C) tended to increase with the moisture content C. In particular, when the moisture content rose from 10% to 30%, the μs of cotton stalks increased more obviously. When the water content was 10% and 50%, the static sliding friction coefficient had a minimum value of 0.525 and a maximum value of 0.625. As C increased, the pressure and contact area between the cotton stalk and contact material grew, thus increasing the sliding resistance and the μs. At the same time, when the moisture content was high, the adhesion could be enhanced between the cotton stalk and the surface of the contact material, increasing the sliding resistance, which could have led to the increase in the μs. The static sliding friction coefficient was strongly correlated with the moisture content of cotton stalks, and Mani et al. presented relevant research results [14]. Afzalinia et al. analyzed the static sliding friction coefficients of alfalfa and wheat straw. With the increase in moisture content, the sliding friction coefficient between straw and contact materials gradually increased, which was the same as the research results in this paper [15]. Ma et al. researched the friction and infiltration characteristics of the desorbed materials generated during the rape harvest and also described this phenomenon [34]. Therefore, the moisture content of cotton stalks should be kept at a lower level while designing the separation device of film residue mixtures to reduce the accumulation or adhesion of cotton stalks on different contact materials and accelerate the migration velocity of separation.

3.2.2. Influence of Single-Factor on Static Rolling Angle

As shown by the I’ curve in Figure 5b, the influence trend of the cotton stalk bark on the μs and φs was slightly different. Under certain conditions of B and C, with the level value of contact material A changing from −1 to +1, curve I’ showed a trend of first decline and then rise. When the coding level values of contact material A were −1 and 0, the maximum and minimum values of the φs (A) were 15.07° and 12.32°, respectively. The influence of cotton stalks’ stable static rolling angle between three contact materials selected in the test was in the following order: Cotton stalk > Stainless steel > Plastic film. Compared with curve I, the values of the μs and φs were both the maximum when the cotton stalk bark was the contact material. When the plastic film and stainless steel were contact materials, their influence on the μs and φs of the cotton stalk was the opposite, mainly because the stable static rolling angle was related to the roughness and rigidity of the contact surface. Additionally, surface roughness of the contact materials is the main cause of a large static rolling angle. With the cotton stalk bark as the contact material, the contact surface was staggered due to its uneven structure, while the rolling resistance coefficient became larger, which hindered the rolling of the cotton stalk. Considering that the surface of plastic film is smoother than that of the stainless steel, the corresponding rolling resistance was smaller, which might have resulted in a smaller stable static rolling angle between cotton stalks and plastic film.
According to the Ⅱ’ curve in Figure 5b, under certain conditions of A and C, with the level value of sampling location B changing from −1 to +1, curve showed a trend of obvious decline. When the sampling location B was the upper part (level −1), the maximum of the φs was 14.85°. When the sampling location B was the lower part (level +1), the minimum value of the φs was 8.04°. The influence ranking of the φs between three sampling locations selected in the test was: Lower part > Middle part > Upper part. The influence of B on the φs was the opposite. When B was the upper part, the φs of cotton stalks had the maximum value, and the μs was the minimum, mainly because the surface texture in the upper part of the cotton stalk was not obvious and relatively smooth. A linear contact was formed between the cotton stalk and contact materials during the test, increasing the rolling resistance. As the sampling location changed from the top to the root, the roughness of the cotton stalk bark increased, and a multi-point contact was exerted between the cotton stalk and the contact material surface, which reduced the rolling resistance on the contact surface. In addition, the cylindricity of the cotton stalk of the upper part was poorer than that of the middle and lower parts of the cotton stalk, which probably was the reason why the φs was the maximum when the sampling location was the upper part.
According to the Ⅲ’ curve in Figure 5b, the influence of the moisture content C on the μs was largely different from that on the φs. With the continuous increase in C, the φs tended to decrease. As C gradually increased to fit within the range of 30–50%, the φs decreased significantly. With the increase in moisture content, the maximum static friction force decreased as cotton stalks rolled, so the stable static rolling angle was low. In addition, the change of moisture content improved the lubrication action between the cotton stalk bark and contact materials. When the moisture content was low, the lubrication action was low, and the static rolling angle of cotton stalks was large. With the increase in moisture content of cotton stalk, the water film formed between cotton stalk epidermis and contact materials changed, and the lubrication effect was obvious, thereby reducing the φs, which might explain why the φs decreased with the rise of moisture content.

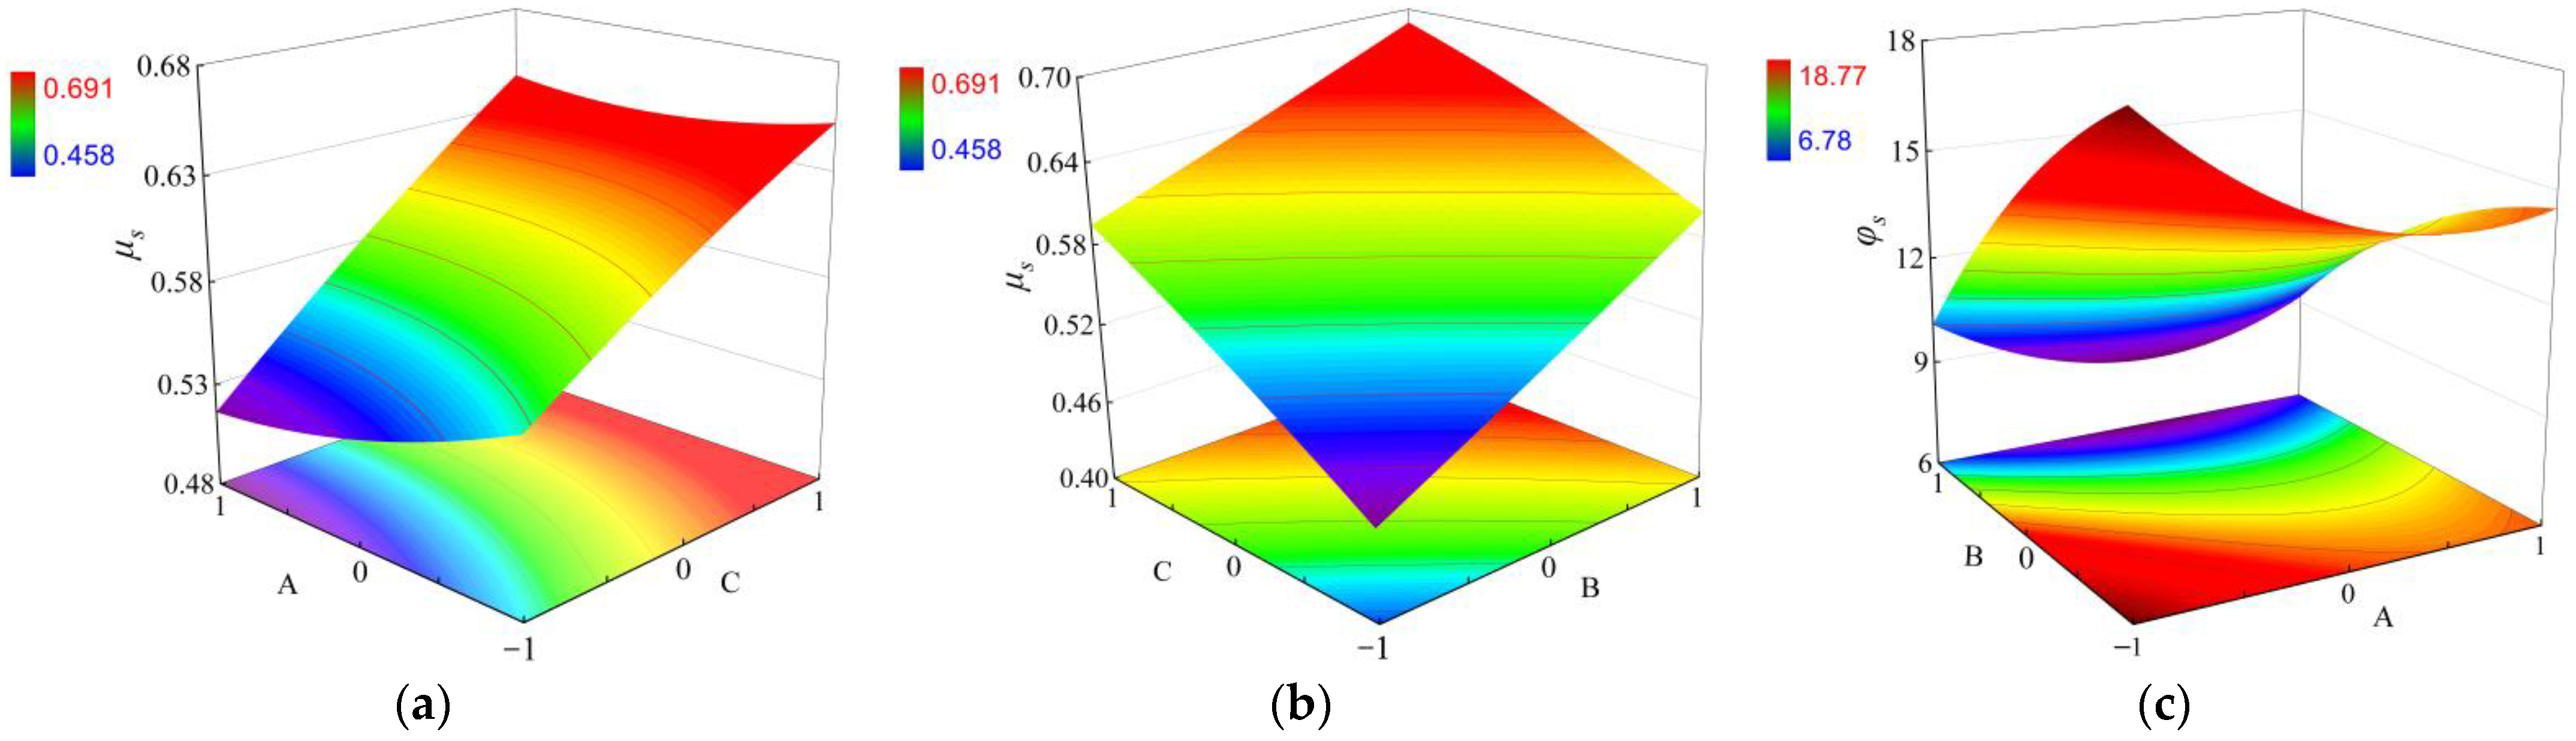
3.3. Interaction Effect Analysis

As shown in Table 3, the regression variance analysis of the static sliding friction coefficient of cotton stalks showed that the interaction terms AC and BC were significant factors affecting the μs (Figure 6a,b); the interaction term AB also was a significant factor influencing the φs (Figure 6c). This study ignored other non-significant interaction terms and only analyzed the influence of AC, BC, and AB on the friction characteristics between cotton stalks and different contact materials.

3.3.1. Influence of Interaction Terms on Static Sliding Friction Coefficient

Figure 6a shows the variation trend of interaction between contact materials A and moisture content C on the μs with the test influence factor B set at level 0. When the level of C was −1, and the level of A ranged from −1 to +1, as the contact materials changed, the μs of cotton stalks tended to decrease, the same as the influence law of single-factor A on the μs of cotton stalks. When the level of C was +1, and the contact materials were cotton stalk bark, plastic film, and stainless steel, the μs of cotton stalks first decreased and then increased, which was slightly different from the influence law of the single-factor A on the μs. When the level of A was −1 and +1, C ranged from −1 to +1, which meant that as the moisture content of cotton stalks changed within the range of 10–50%, the μs of cotton stalks would present an obvious increasing trend. As can be seen from Figure 6a, the slope of the C effect surface curve is steeper than the A direction, indicating that the effect of C on the static sliding friction coefficient is more significant than A.
Figure 6b shows the variation trend of the influence of interaction between B and C on the μs of cotton stalks when the test influence factor A was set at level 0. When C was 30% and 50%, the level of B ranged from −1 to +1, proving that when the sampling location of the cotton stalk changed from top to bottom, the μs tended to increase, consistent with the single-factor B analysis result. When the level of B was −1 and +1, the level of C ranged from −1 to +1, showing that as the moisture content of cotton stalks changed within the range of 10–50%, the μs of cotton stalks showed an increasing trend, consistent with the single-factor C analysis results. It can be seen that the test factors B and C have the same law on the μs, and the effective surface curve of B is the same as that of C, which indicates that the contribution of B to the static sliding friction coefficient is the same as that of C. Comparing Figure 6a,c, it can be concluded that the order of influence of the three factors on the static sliding friction coefficient is B = C > A, which is consistent with the ANOVA results.

3.3.2. Influence of Interaction Terms on Static Rolling Angle

As shown in Table 3, among the two-factor interaction terms, A and B interactions had a more significant influence on the φs than the other three interaction terms. Figure 6c shows the variation trend of interaction between A and B on cotton stalks when C was set at level 0 (30%). With the variation in B, the φs changed dramatically. When the level of B ranged from −1 to +1, which meant the sampling location of cotton stalks changed from top to bottom, the φs of cotton stalks tended to decrease gradually, consistent with the single-factor B analysis result. When the level of A ranged from −1 to +1, with cotton stalk bark, plastic film, and stainless steel as contact materials in turn, the φs of cotton stalks first decreased and then increased, which was the same as the influence law of single-factor A on the μs. By comparing the contour plot, when A is taken to a smaller level value, the contour density is greater than that when A is taken at a larger value, indicating that when the roughness of the contact materials is large, the static rolling angle is greatly affected. And when B is taken to a smaller level value, the effect of B on the static rolling angle is more obvious than when A is taken to a larger value.

4. Conclusions

Friction tests were conducted on cotton stalks using response surface methodology, with contact material, sampling location with the stalk, and stalk moisture content as independent variables, and the static sliding friction coefficient and the stable static rolling angle of the cotton stalks as dependent variables. According to the regression variance analysis, the model coefficient (p), the determination coefficient (R2), the corrected determination coefficient (R2adj), and the coefficient of variation (CV) effectively reflected the influence laws of the contact materials, sampling location, and moisture content on the static sliding friction coefficient and the stable static rolling angle of cotton stalks. The results of the single-factor analysis showed that the contact materials, sampling location, and moisture content are extremely significant factors affecting the static sliding friction coefficient and the stable static rolling angle. The importance ranking of the single-factor terms on the μs was B = C > A, and the importance ranking of the single-factor terms on the φs was B > A > C. The interaction effect analysis showed that the interactions between contact materials and moisture content, and between sampling location and moisture content, significantly affected the static sliding friction coefficient, while that between contact materials and sampling location has a significant impact on the stable static rolling angle. When the contact material is cotton stalk bark, the static sliding friction coefficient and the stable static rolling angle values are maximum, and when the sampling location of the cotton stalk changes from top to bottom, the static sliding friction coefficient increases, and the stable static rolling angle decreases, respectively, while the moisture content has an opposite influence on them. This study on the friction characteristics of cotton stalks can provide theoretical references and basic parameters for the separation technology research and equipment development of film residue mixtures.

Author Contributions

Conceptualization, methodology, formal analysis, writing—review and editing, writing—original draft preparation, B.Z. and Z.K.; supervision, H.M.; funding acquisition, Z.K.; investigation, J.L. and Y.L.; data curation, R.L. All authors have read and agreed to the published version of the manuscript.

Funding

This research was funded by the National Natural Science Foundation of China, Grant number: 52065058; the Graduate Education Innovation Project of Xinjiang Uygur Autonomous Region, Grant Number: XJ2022G085, XJ2021G115; and the Key Industry Innovation Development Support Plan of Southern Xinjiang, Grant Number: 2020DB008.

Institutional Review Board Statement

Not applicable.

Informed Consent Statement

Not applicable.

Data Availability Statement

The data presented in this study are available on request from the corresponding author.

Conflicts of Interest

The authors declare no conflict of interest.

References

  1. Liang, R.; Chen, X.; Zhang, B.; Meng, H.; Jiang, P.; Peng, X.; Kan, Z.; Li, W. Problems and countermeasures of recycling methods and resource reuse of residual film in cotton fields of Xinjiang. Trans. Chin. Soc. of Agric. Eng. 2019, 35, 1–13. [Google Scholar]
  2. Hu, C.; Wang, X.; Chen, X.; Tang, X.; Zhao, Y.; Yan, C. Current situation and control strategies of residual film pollution in Xinjiang. Trans. Chin. Soc. Agric. Eng. 2019, 35, 223–234. [Google Scholar]
  3. Chen, X.; Zhao, Y. Development of double-film mulch precision planter for cotton seeding. Trans. Chin. Soc. Agric. Eng. 2010, 26, 106–112. [Google Scholar]
  4. Dai, J.; Luo, Z.; Li, W.; Tang, W.; Zhang, D.; Lu, H.; Li, Z.; Xin, C.; Kong, X.; Eneji, A.E.; et al. A simplified pruning method for profitable cotton production in the Yellow River valley of China. Field Crops Res. 2014, 164, 22–29. [Google Scholar] [CrossRef]
  5. Wang, X.; Hu, C.; Lu, B.; Jiang, J.; Hou, S. Wind tunnel test on damages of plastic film under the wind-sand effect in south Xinjiang of China. Int. Agric. Eng. J. 2017, 26, 16–23. [Google Scholar]
  6. Liu, E.; He, W.; Yan, C. ‘White revolution’ to ‘white pollution’-agricultural plastic film mulch in China. Environ. Res. Lett. 2014, 9, 091001. [Google Scholar] [CrossRef] [Green Version]
  7. Wu, Q.; Wang, Z.; Zheng, X.; Zhang, J.; Li, W. Effects of biodegradation film mulching on soil temperature, moisture and yield of cotton under drip irrigation in typical oasis area. Trans. Chin. Soc. Agric. Eng. 2017, 33, 135–143. [Google Scholar]
  8. Zhang, Z.; Li, J.; Wang, X.; Zhao, Y.; Xue, S.; Su, Z. Parameters Optimization and Test of an Arc-Shaped Nail-Tooth Roller-Type Recovery Machine for Sowing Layer Residual Film. Agriculture 2022, 12, 660. [Google Scholar] [CrossRef]
  9. Liang, R.; Chen, X.; Zhang, B.; Peng, X.; Kan, Z. Tests and analyses on mechanical characteristics of dwarf-dense-early major cotton variety stalks. Int. Agrophys. 2020, 34, 333–342. [Google Scholar] [CrossRef]
  10. Puchalski, C.; Brusewitz, G.H. Coefficient of friction of watermelon. Trans. ASAE 1996, 39, 589–594. [Google Scholar] [CrossRef]
  11. Quist, J.; Evertsson, C.M. Cone crusher modelling and simulation using DEM. Miner. Eng. 2016, 85, 92–105. [Google Scholar] [CrossRef]
  12. Shinners, K.J.; Koegel, R.G.; Lehman, L.L. Friction Coeeficient Of Alfalfa. Trans. ASAE 1991, 34, 33–37. [Google Scholar] [CrossRef]
  13. Parde, S.R.; Johal, A.; Jayas, D.S.; White, N.D.G. Physical properties of buckwheat cultivars. Can. Biosyst. Eng. 2003, 45, 3.19–3.22. [Google Scholar]
  14. Mani, S.; Tabil, L.G.; Sokhansanj, S.; Roberge, M. Mechanical properties of corn stover grind. Trans. ASAE 2004, 47, 1983–1990. [Google Scholar] [CrossRef]
  15. Afzalinia, S.; Roberge, M. Physical and mechanical properties of selected forage materials. Can. Biosyst. Eng. 2007, 49, 2.23–2.27. [Google Scholar]
  16. Chevanan, N.; Womac, A.R.; Bitra, V.S.P.; Yoder, D.C.; Sokhansanj, S. Flowability parameters for chopped switchgrass, wheat straw and corn stover. Powder Technol. 2009, 193, 79–86. [Google Scholar] [CrossRef]
  17. Li, Y.; Ma, Z.; Xu, L. Tribological Characteristics of Adhesive Materials on Cleaning Sieve of Rape Combine Harvester. Trans. Chin. Soc. Agric. Mach. 2010, 41, 54–57. [Google Scholar]
  18. Kalkan, F.; Kara, M. Handling, frictional and technological properties of wheat as affected by moisture content and cultivar. Powder Technol. 2011, 213, 116–122. [Google Scholar] [CrossRef]
  19. Fang, X.; Chen, H.; Huag, Z.; Xia, L. Sliding Friction Characteristic of Different Moisture Content of Soybean Stalk with Different Materials. Soybean Sci. 2012, 31, 838–841. [Google Scholar]
  20. Huo, L.; Meng, H.; Tian, Y.; Zhao, L.; Hou, S. Experimental study on physical property of smashed crop straw. Trans. Chin. Soc. Agric. Eng. 2012, 28, 189–195. [Google Scholar]
  21. Zhang, Q.; Ding, W.; Deng, L.; Li, Y.; Zhao, Y. Experimental study on friction characteristics of gorgon nuts (Euryale ferox) in mechanical shelling. Trans. Chin. Soc. Agric. Eng. 2013, 29, 56–63. [Google Scholar]
  22. Lu, C.; Zhao, C.; Meng, Z.; Wang, X.; Wu, G.; Gao, N. Straw friction characteristic based on rotary cutting anti-blocking device with slide plate pressing straw. Trans. Chin. Soc. Agric. Eng. 2016, 32, 83–89. [Google Scholar]
  23. Wang, D.F.; Jiang, Z.G.; Li, B.; Wang, G.; Jiang, Y. Experiment on sliding friction characteristics between rice straw and baler steel-roll. Trans. Chin. Soc. Agric. Eng. 2017, 33, 44–51. [Google Scholar]
  24. Kaliniewicz, Z.; Żuk, Z.; Krzysiak, Z. Influence of steel plate roughness on the frictional properties of cereal kernels. Sustainability 2018, 10, 1003. [Google Scholar] [CrossRef] [Green Version]
  25. Wen, B.Q.; Li, Y.; Kan, Z.; Li, J.B.; Li, L.; Ge, J.; Ding, L.; Wang, K.; Zou, S.; Li, W. Experimental research on the bending characteristics of glycyrrhiza glabra stems. Trans. ASABE 2020, 63, 1499. [Google Scholar] [CrossRef]
  26. Bucklin, R.A.; Thompson, S.A.; Ross, I.J.; Biggs, R.H. Apparent coefficient of friction of wheat on bin wall material. Trans. ASAE 1989, 32, 1769–1773. [Google Scholar] [CrossRef]
  27. Kweon, G.; Grift, T.E.; Miclet, D. Dynamic friction coefficient measurement of granular fertiliser particles. Biosyst. Eng. 2006, 97, 145–152. [Google Scholar] [CrossRef]
  28. Molenda, M.; Horabik, J.; Ross, I.J.; Montross, M.D. Friction of wheat: Grain–on–grain and on corrugated steel. Trans. ASAE 2002, 45, 415–420. [Google Scholar] [CrossRef]
  29. Locurto, G.J.; Bucklin, R.A.; Thompson, S.A.; Abdel-Hadi, A.I.; Walton, O.R. Soybean coefficients of friction for aluminum, glass, and acrylic surfaces. Appl. Eng. Agric. 2014, 30, 285–289. [Google Scholar]
  30. Hirai, Y.; Inoue, E.; Mori, K.; Hashiguchi, K. Investigation of mechanical interaction between a combine harvester reel and crop stalks. Biosyst. Eng. 2002, 83, 307–317. [Google Scholar] [CrossRef]
  31. Liang, R.; Chen, X.; Zhang, B.; Li, J.; Meng, H.; Peng, X.; Jiang, P.; Zhou, P.; Kan, Z. Analysis of shear-compressive stress characteristics of Dwarf-Dense-Early cotton variety stalks in Xinjiang. Int. Agric. Eng. J. 2020, 29, 380–391. [Google Scholar]
  32. Zhou, Z.E. Agricultural Materials Science; Agricultural Press: Beijing, China, 1994; Volume 1. [Google Scholar]
  33. Aydın, I.; Arslan, S. Mechanical properties of cotton shoots for topping. Ind. Crop. Prod. 2018, 112, 396–401. [Google Scholar] [CrossRef]
  34. Ma, Z.; Li, Y.; Xu, L. Theoretical analysis of micro-vibration between a high moisture content rape stalk and a non-smooth surface of a reciprocating metal cleaning screen matrix. Biosyst. Eng. 2015, 129, 258–267. [Google Scholar] [CrossRef]
Figure 1. Film residue mixtures after harvesting with machinery.
Agriculture 12 00906 g001
Figure 2. Sampling methods of cotton stalks.
Agriculture 12 00906 g002
Figure 3. Measurement device for friction characteristic test. 1. Bedplate; 2. Bracket; 3. Lifting plate; 4. Rope; 5. Handle; 6. Cotton stalks group; 7. Single cotton stalk; 8. Contact material; 9. DP-160 electronic goniometer.
Agriculture 12 00906 g003
Figure 4. (a) Force analysis diagram of cotton stalk sliding on plane; (b) Force analysis diagram of cotton stalk rolling on plane.
Agriculture 12 00906 g004
Figure 5. (a) Trend of influence of single-factor on the static sliding friction coefficient; (b) Trend of influence of single-factor on the stable static rolling angle.
Agriculture 12 00906 g005
Figure 6. (a) Trend of influence of the interaction term AC on the μs value; (b) Trend of influence of the interaction term BC on the μs value; (c) Trend of influence of the interaction term AB on the φs value.
Agriculture 12 00906 g006
Table 1. Test factors and level code table.
LevelContact Materials ASampling Location BMoisture Content (%) C
−1Cotton stalkupper10
0Plastic filmmiddle30
+1Stainless steellower50
Table 2. Test scheme and results.
Test No.ABCμsφs (°)
1−1−100.557 ± 0.03518.77 ± 2.50
21−100.530 ± 0.04114.93 ± 2.96
3−1100.659 ± 0.0369.66 ± 1.80
41100.639 ± 0.0378.66 ± 1.76
5−10−10.558 ± 0.04815.08 ± 2.04
610−10.511 ± 0.03612.87 ± 3.59
7−1010.651 ± 0.04312.82 ± 2.08
81010.643 ± 0.02610.61 ± 2.62
90−1−10.458 ± 0.03314.69 ± 2.78
1001−10.600 ± 0.0398.11 ± 1.44
110−110.586 ± 0.02611.83 ± 2.95
120110.691 ± 0.0256.78 ± 1.02
130000.593 ± 0.02512.90 ± 2.38
140000.579 ± 0.02512.05 ± 1.44
150000.588 ± 0.0111.97 ± 1.34
160000.593 ± 0.0112.61 ± 1.44
170000.581 ± 0.01112.05 ± 1.55
Table 3. Variance analysis of the friction characteristics test results of cotton stalks.
Sourcedfμsφs
S·SM·SF Valuep-ValueS·SM·SF Valuep-Value
Model90.0535.92 × 10−3119.26<1 × 10⁻⁴ **131.9114.6641.33<1 × 10⁻⁴ **
A11.3 × 10−31.3 × 10−326.211.4 × 10−4 **10.7210.7230.239 × 10−4 **
B10.0260.026528.49<1 × 10⁻⁴ **91.1991.19257.17<1 × 10⁻⁴ **
C10.0250.025496.67<1 × 10⁻⁴ **9.489.4826.741.3 × 10−4 **
AB11.2 × 10−559.290.250.6352.022.025.690.049 *
AC13.8 × 10−43.8 × 10−47.660.028 *0001.00 NS
BC13.42 × 10−43.42 × 10−46.900.034 *0.590.591.650.24 NS
A212.85 × 10−42.85 × 10−45.740.048 *10.6510.6530.059 × 10−4 **
B216.32 × 10−66.32 × 10−60.130.7323.423.429.661.71 × 10−4 *
C217.7 × 10−57.7 × 10−51.550.2534.754.7513.398.11 × 10−4 **
Residual73.47 × 10−44.96 × 10⁻⁵ 2.480.35
Lack of Fit31.75 × 10−45.81 × 10−51.350.3782.480.603.470.130
Pure Error41.73 × 10−44.32 × 10⁻⁵ 0.690.17
Cor Total160.054 134.39
R2 = 0.99, R 2adj = 0.99, CV = 1.20%R2 = 0.98, R 2adj = 0.96, CV = 4.90%
Note: ** = extremely significant factor (p ≤ 0.01); * = significant factor (0.01 < p ≤ 0.05); NS = not significant factor (p > 0.05).
Publisher’s Note: MDPI stays neutral with regard to jurisdictional claims in published maps and institutional affiliations.

