Article

Experimental Study of the Planting Uniformity of Sugarcane Single-Bud Billet Planters

1
Department of Mechanical Engineering, Anyang Institute of Technology, Anyang 455000, China
2
College of Engineering, South China Agricultural University, Wushan Road, Tianhe District, Guangzhou 510642, China
*
Author to whom correspondence should be addressed.
Agriculture 2022, 12(7), 908; https://doi.org/10.3390/agriculture12070908
Submission received: 18 May 2022 / Revised: 17 June 2022 / Accepted: 18 June 2022 / Published: 22 June 2022
(This article belongs to the Special Issue Advances in Agricultural Engineering Technologies and Application)

Abstract

:
Planting uniformity is a key evaluation index for planters. This paper investigated the effect of rotational speed, the angle of the rake bar chain, and the number of billets on the planting uniformity of a seed-metering device in the laboratory. The experimental results showed that the optimal planting uniformity can be achieved under a rake bar chain angle of 117°, a number of billets of 500, and a rotational speed of the rake bar chain of 70 rpm. Under this condition, the quality index Zq was 97.22% and the multiple index Zm was 0%, while the miss index Ze was 2.78%. Based on the above parameters, a single-bud planter was improved with three rake bar chains per seed box. Field experiments with different operation parameters (rotational speed, forward speed) were conducted. Results indicated that when the rotational speed was 40 rpm and the forward speed was 2.26 km/h, the planting uniformity was the best and the quality index Zq was 93.38%. The research results provide a basis for the application of single-bud billet planters in the field.

1. Introduction

Planting is an important procedure in the production of sugarcane, but it is highly labor-intensive and time-intensive [1]. The sugarcane industry has been moving towards mechanized field planting to address the problems of labor shortage and high production costs [2]. Rípoli et al. [3] analyzed the cost-effectiveness of five different sugarcane planters by comparing them with the semi-mechanized system under the same field conditions and found that the mechanized system was significantly cheaper than the semi-mechanized planter. Moreover, the automatic planter has a lower operating cost than the semi-automatic one. It greatly saves manpower in the operation process, and the mechanized planter can work for long periods during the day and nighttime shifts [4]. At present, the main types of sugarcane planting machines are whole-stalk planters, real-time cutting planters, and pre-cutting planters.
However, the traditional planting method with whole-stalk planters and real-time cutting planters requires great human force and needs to store a lot of cane seeds in the planter. The large mass of planting material makes it difficult to transport, handle, and store the cane seed [5,6,7].
In comparison, billet planting is more cost-effective than whole-stalk planting. The fully automatic billet planter can solve the problems of labor shortage and planting delay [8]. Additionally, the billet planter has a high field capacity and efficiency [6]. At present, the billet planter usually adopts 2–3-bud billets and distributes them over the ground surface [9]. However, single-bud billets are less bulky, easy to transport, more economical, and can improve the quality of seed [10]. According to Gujja et al. [11], shoots of the same age contribute to the uniformity in growth and sugar accumulation in the canes, as well as a better germination percentage. Sugarcane planting by bud chip has been proven to have a higher production efficiency and a lower cost of planting material, achieving a cane yield of 106.8 t/ha, 13.86% higher than that of the conventional cane crop planting method [12].
Therefore, the sugarcane single-bud billet planter is the development trend of sugarcane planters in the future and has a good prospect. We designed a seed-metering device with a rake bar chain for a sugarcane single-bud billet planter and tested the seed-filling uniformity of the seed-metering device [13]. In sugarcane production, productivity depends on locating the billets in the furrow with uniform distribution [14]. The rate of billet dropping by the metering device is a key factor to evaluating the economic efficiency of any planter machine [15]. The major problem of the billet planter is its low consistency of discharging rates, which, in turn, results in lower sugarcane yields [6].
A plethora of research on the uniformity of sugarcane billet planters has been conducted. Razavi et al. [16] studied the effect of forwarding speed and angle of the chain conveyor on planting uniformity in a sugarcane billet planter. Taghinezhad et al. [17] investigated the effect of the angle and speed of sugarcane billet planters on discharging and precision indexes. Saengprachatanarug et al. [18] improved the discharge consistency of the sugarcane billet planter by changing the inclination of the container. Saengprachatanarug et al. [6] developed a metering device for sugarcane billet planters by modifying the arrangement of the cleats conveyor. Then, the discharge index and consistency of the developed and original metering devices were evaluated and compared. Moslem et al. [9] designed a single-cupboard metering device that could plant billets with a length of 50 cm. On a laboratory test rig, the effects of planting speed, cane variety, and angle-of-chain structure on the uniformity of the planted billets were evaluated.
Based on the results of our previous experiments, the single-bud billet seed-metering device with a rake bar chain has good seed-filling uniformity [13]. However, considering the effects of forwarding speed, seeding flap, and complex field environments, the planting uniformity is different from the seed-filling uniformity. To study the planting uniformity of the seed metering, experiments with different structural parameters were conducted in the laboratory. According to the experimental results, a new single-bud billet planter with the optimum combination of structural parameters was designed and fabricated, and the optimal operation parameters were studied by field experiments. The research of this paper are valuable for improvements in the redesigning of sugarcane single-bud billet planters.

2. Materials and Methods

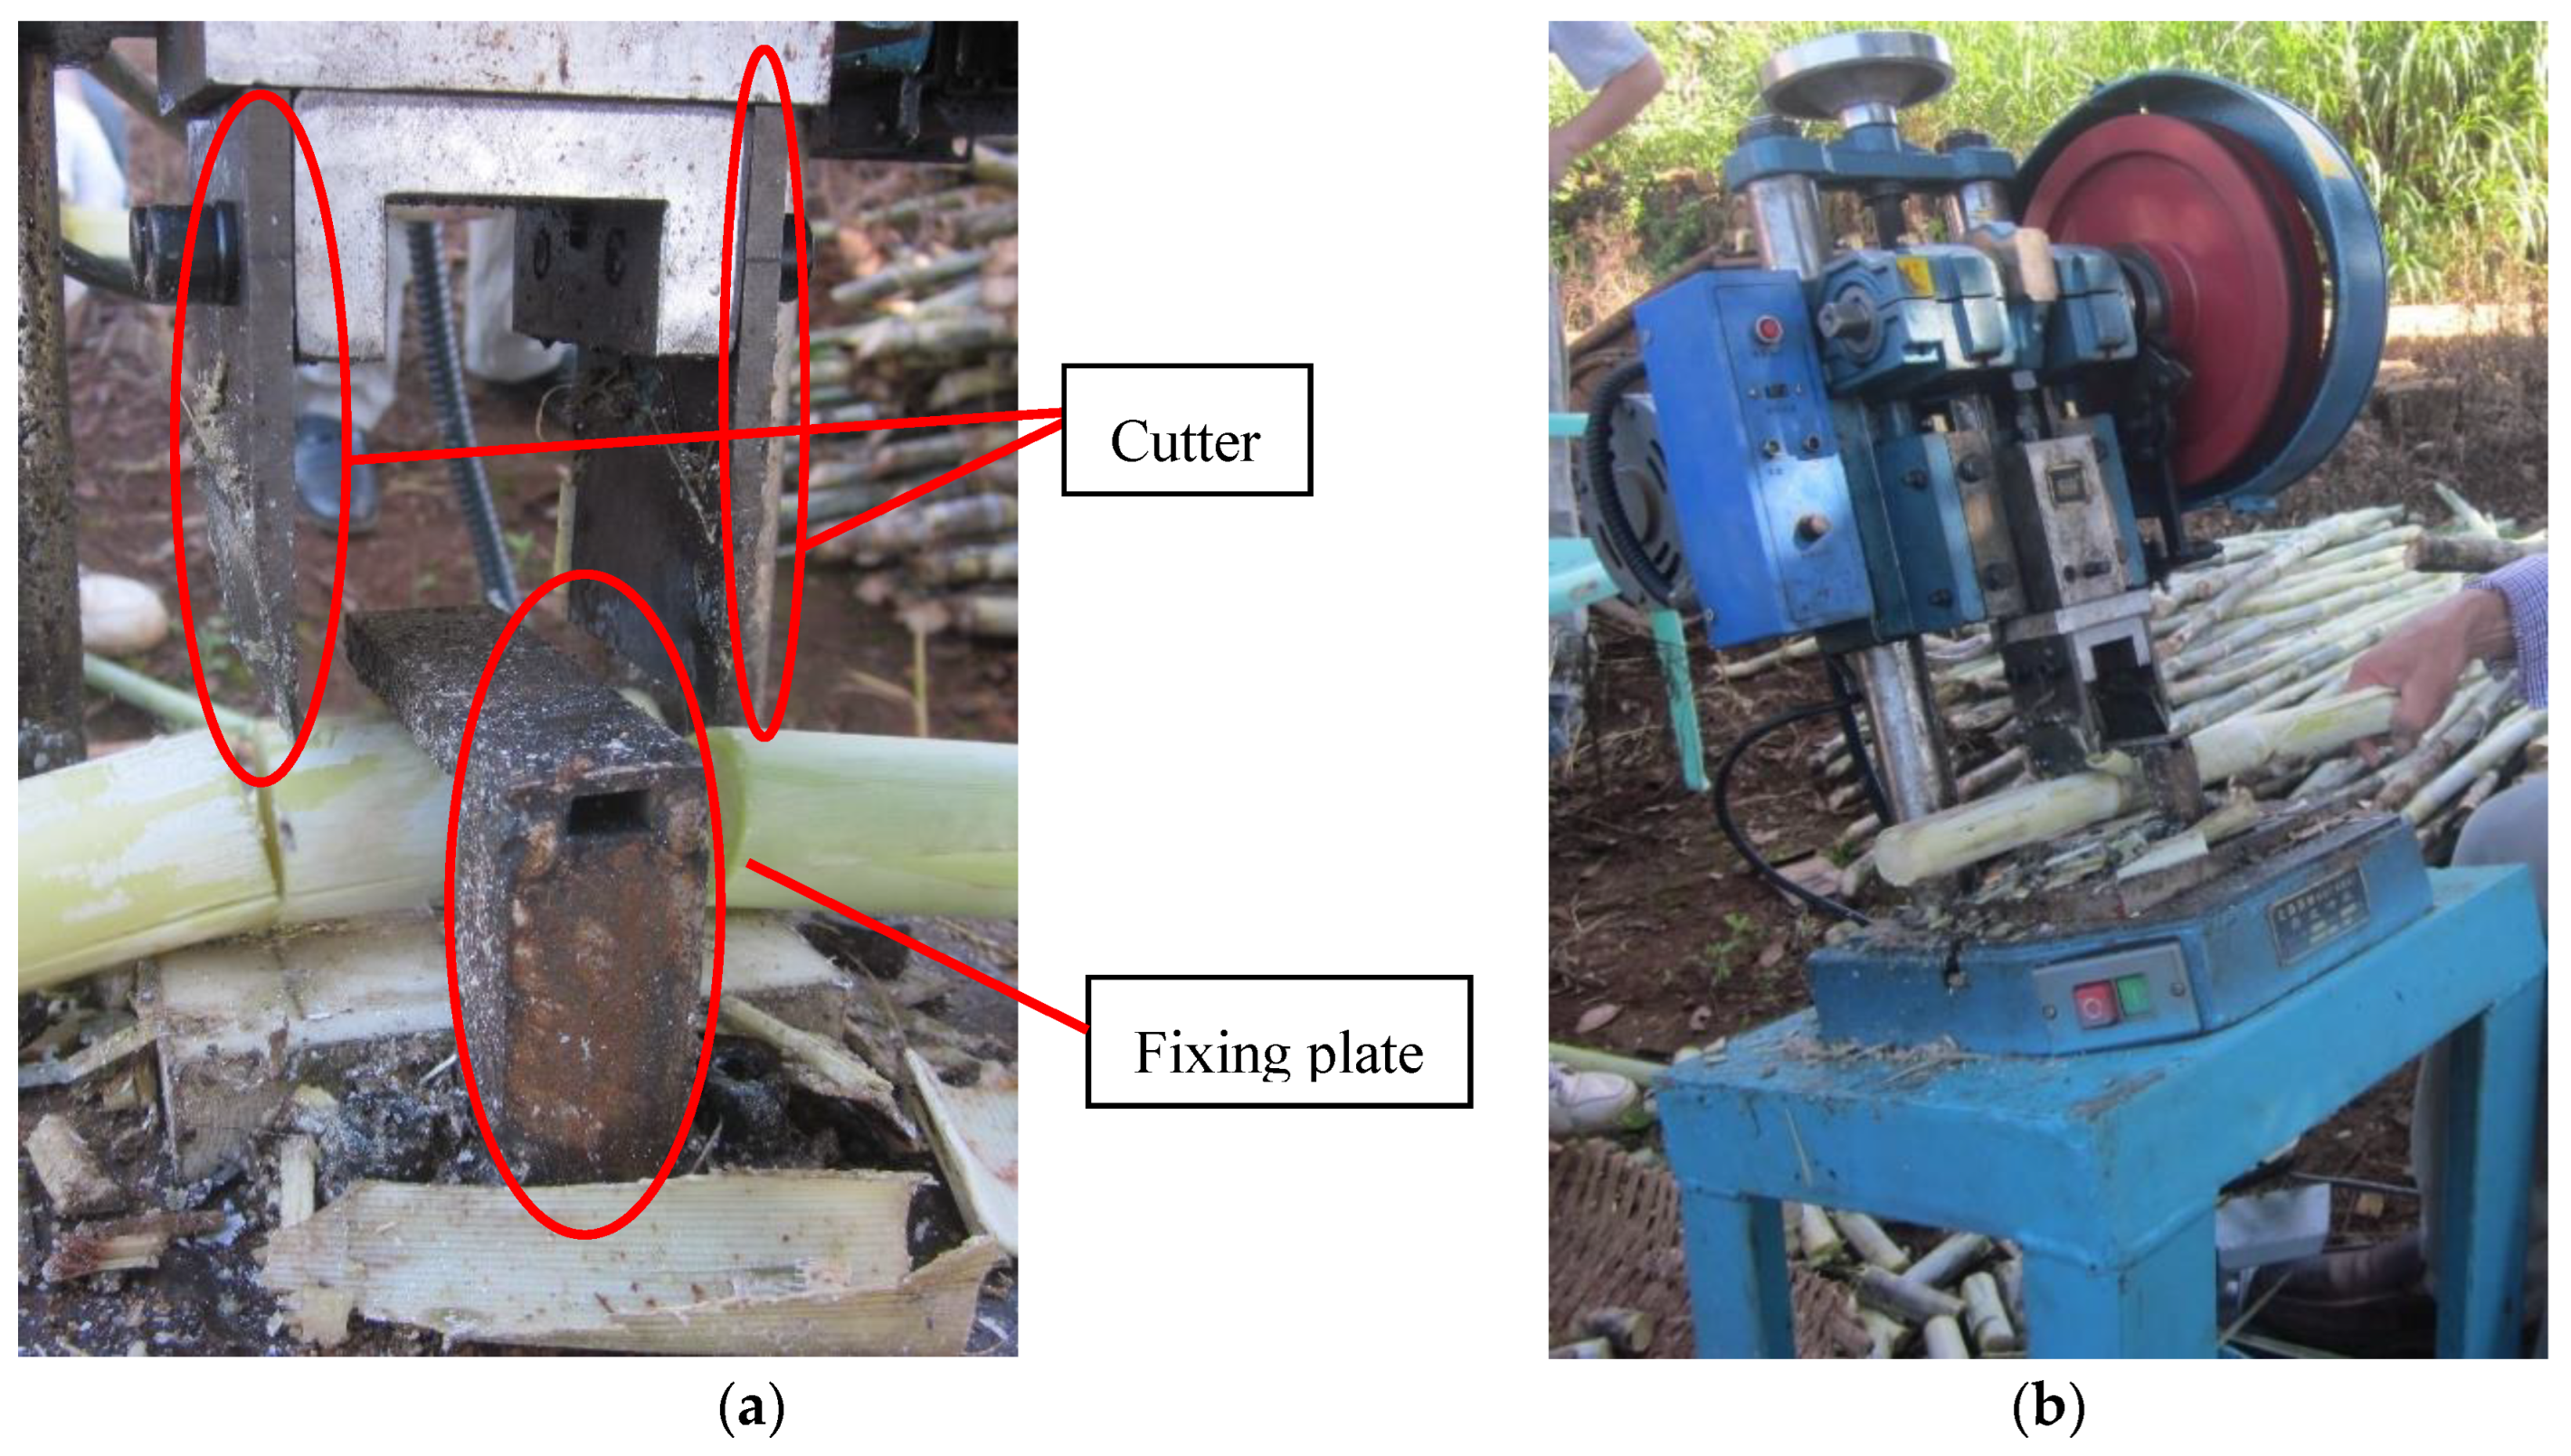
2.1. Billet Preparation

Single-bud billets are prepared by the billet-cutting machine shown in Figure 1 for both laboratory and field experiments. The billet-cutting machine consists of a JB04-1 electric punch machine with a nominal pressure of 10 kN, a slider stroke of 40 mm, a maximum closed height of 150 mm, a table size of 270 × 270 mm, and a motor power of 0.37 kW. Two cutters are fixed to the slider with inner hexagon bolts. To ensure the length of the billet, the distance between the two cutters is 60 mm. The fixing plate 40 mm above the table can hold the billet while the cutter cuts through the billet. The footswitch of the machine is turned on after the sugarcane is put on the table, and the cutter cuts the sugarcane down. The billet cutting machine is equipped with a protective cover for safety (not shown in Figure 1).

2.2. Laboratory Experiment

The seed-metering device we designed [13] was mounted on a trolley system in the soil bin laboratory (Figure 2). The driving wheel of the rake bar chain and the oil cylinder for adjusting the angle of the seed-metering device were driven by the hydraulic station on the trolley. During the experiment, the trolley could move forward along the track on both sides of the soil bin, and the driving wheel drove the rake bar to transport billets to the seeding channel and drop them into the pre-dug furrow. In this process, the distribution of billets in the furrow was evaluated.

2.2.1. Experimental Evaluation of the Planting Uniformity

Numerous studies have been conducted to evaluate the uniformity of sugarcane planting. For example, Taghinezhad et al. [14] exploited the middle band of billets to calculate the spacing between billets. The distribution of plant spacing was quantified by the multiple index, miss index, and the quality-of-feed index following the single-seed method [19]. Moslem et al. [9] considered an overlap of 12.5 cm as a normal pattern of planting; values higher and lower than 12.5 cm would result in over overlapping and under overlapping, respectively. Kumar et al. [20] used the length of 10 setts and actual length covered by 10 setts to calculate the overlap and the gap when the sugarcane planter was run in the field with a length of 12 m. In the trial of Johnson et al. [21], the number of billets planted was 109,000 per hectare, and the results showed that the effect of the position of the billets within the planting furrow on sugar yield was not economically significant. Silva et al. [22] suggested that a good stand of buds per meter should be provided since the quality of planting is the most important factor for good yield.
The single-bud billet is shorter than the multiple-bud billet and larger than the grain seed. After comprehensive consideration, the number of billets per unit length was taken as the evaluation standard. The unit length was 1 m in lab experiments and 0.5 m in field experiments in this study. Meanwhile, quality index Zq, multiple index Zm, miss index Ze, and coefficient of variation (CV) were adopted to evaluate the planting uniformity. The theoretical number of billets per unit length can be calculated according to the rotational speed and forward speed of the driving wheel of the rake bar chain. The calculation formulas of the evaluation indexes are as follows:
Z q = n 1 N × 100 % .  
Z m = n 2 N × 100 %
Z e = n 3 N × 100 % .
C V = δ X × 100 % .  
where n 1 is the number of units in which the number of billets is more than 0.5 times and less than 1.5 times the theoretical number of billets; n 2 is the number of units where the number of billets is more than 1.5 times the theoretical number of billets; n 3   is the number of units where the number of billets is less than 0.5 times the theoretical number of billets; N is the total number of units; δ is the standard deviation of the number of billets per unit; and X is the average number of billets in all units.

2.2.2. Experimental Method

Based on the results of previous experiments [13], the factors of the seed-filling uniformity of the seed-metering device were the rotational speed of the rake bar chain (A), the angle of the rake bar chain (B), and the number of billets (C). For comparison, the same factors were used in this study. A furrow with a depth of 0.2 m and a length of 11 m was opened in the soil bin beforehand. The seeding port of the seed-metering device was directly above the furrow, and there was a small gap between the seeding flap and the furrow. The trolley system discharged billets into the furrow at a constant forward speed during the experiment (Figure 3).
A single-factor experiment was conducted to study the influence of each factor on the planting uniformity, and then the effective level range of each factor was selected for the orthogonal experiment. Based on this, the influence of various factors on planting uniformity was analyzed, and the optimal combination of factors was obtained. Each treatment was repeated three times.

2.2.3. Experiment Design

As for the single-factor experiment for factor A, the value of factor B was set to 117° and the value of factor C was set to 500. The value of factor A had nine levels, including 50 rpm, 60 rpm, 70 rpm, 80 rpm, 90 rpm, 100 rpm, 110 rpm, 120 rpm, and 130 rpm.
As for the single-factor experiment for factor B, the value of factor A was set to 90 rpm and the value of factor C was set to 500. The value of factor B had four levels, including 97°, 107°, 117°, and 127°.
As for the single-factor experiment for factor C, the value of factor B was set to 117° and the value of factor A was set to 90 rpm. The value of factor C had ten levels from 100 to 1000, with an interval of 100.
According to the results of the single-factor experiments, the levels of the factors in the orthogonal experiment are listed in Table 1. The orthogonal experiment table L27 (313) was selected to arrange the experiment.

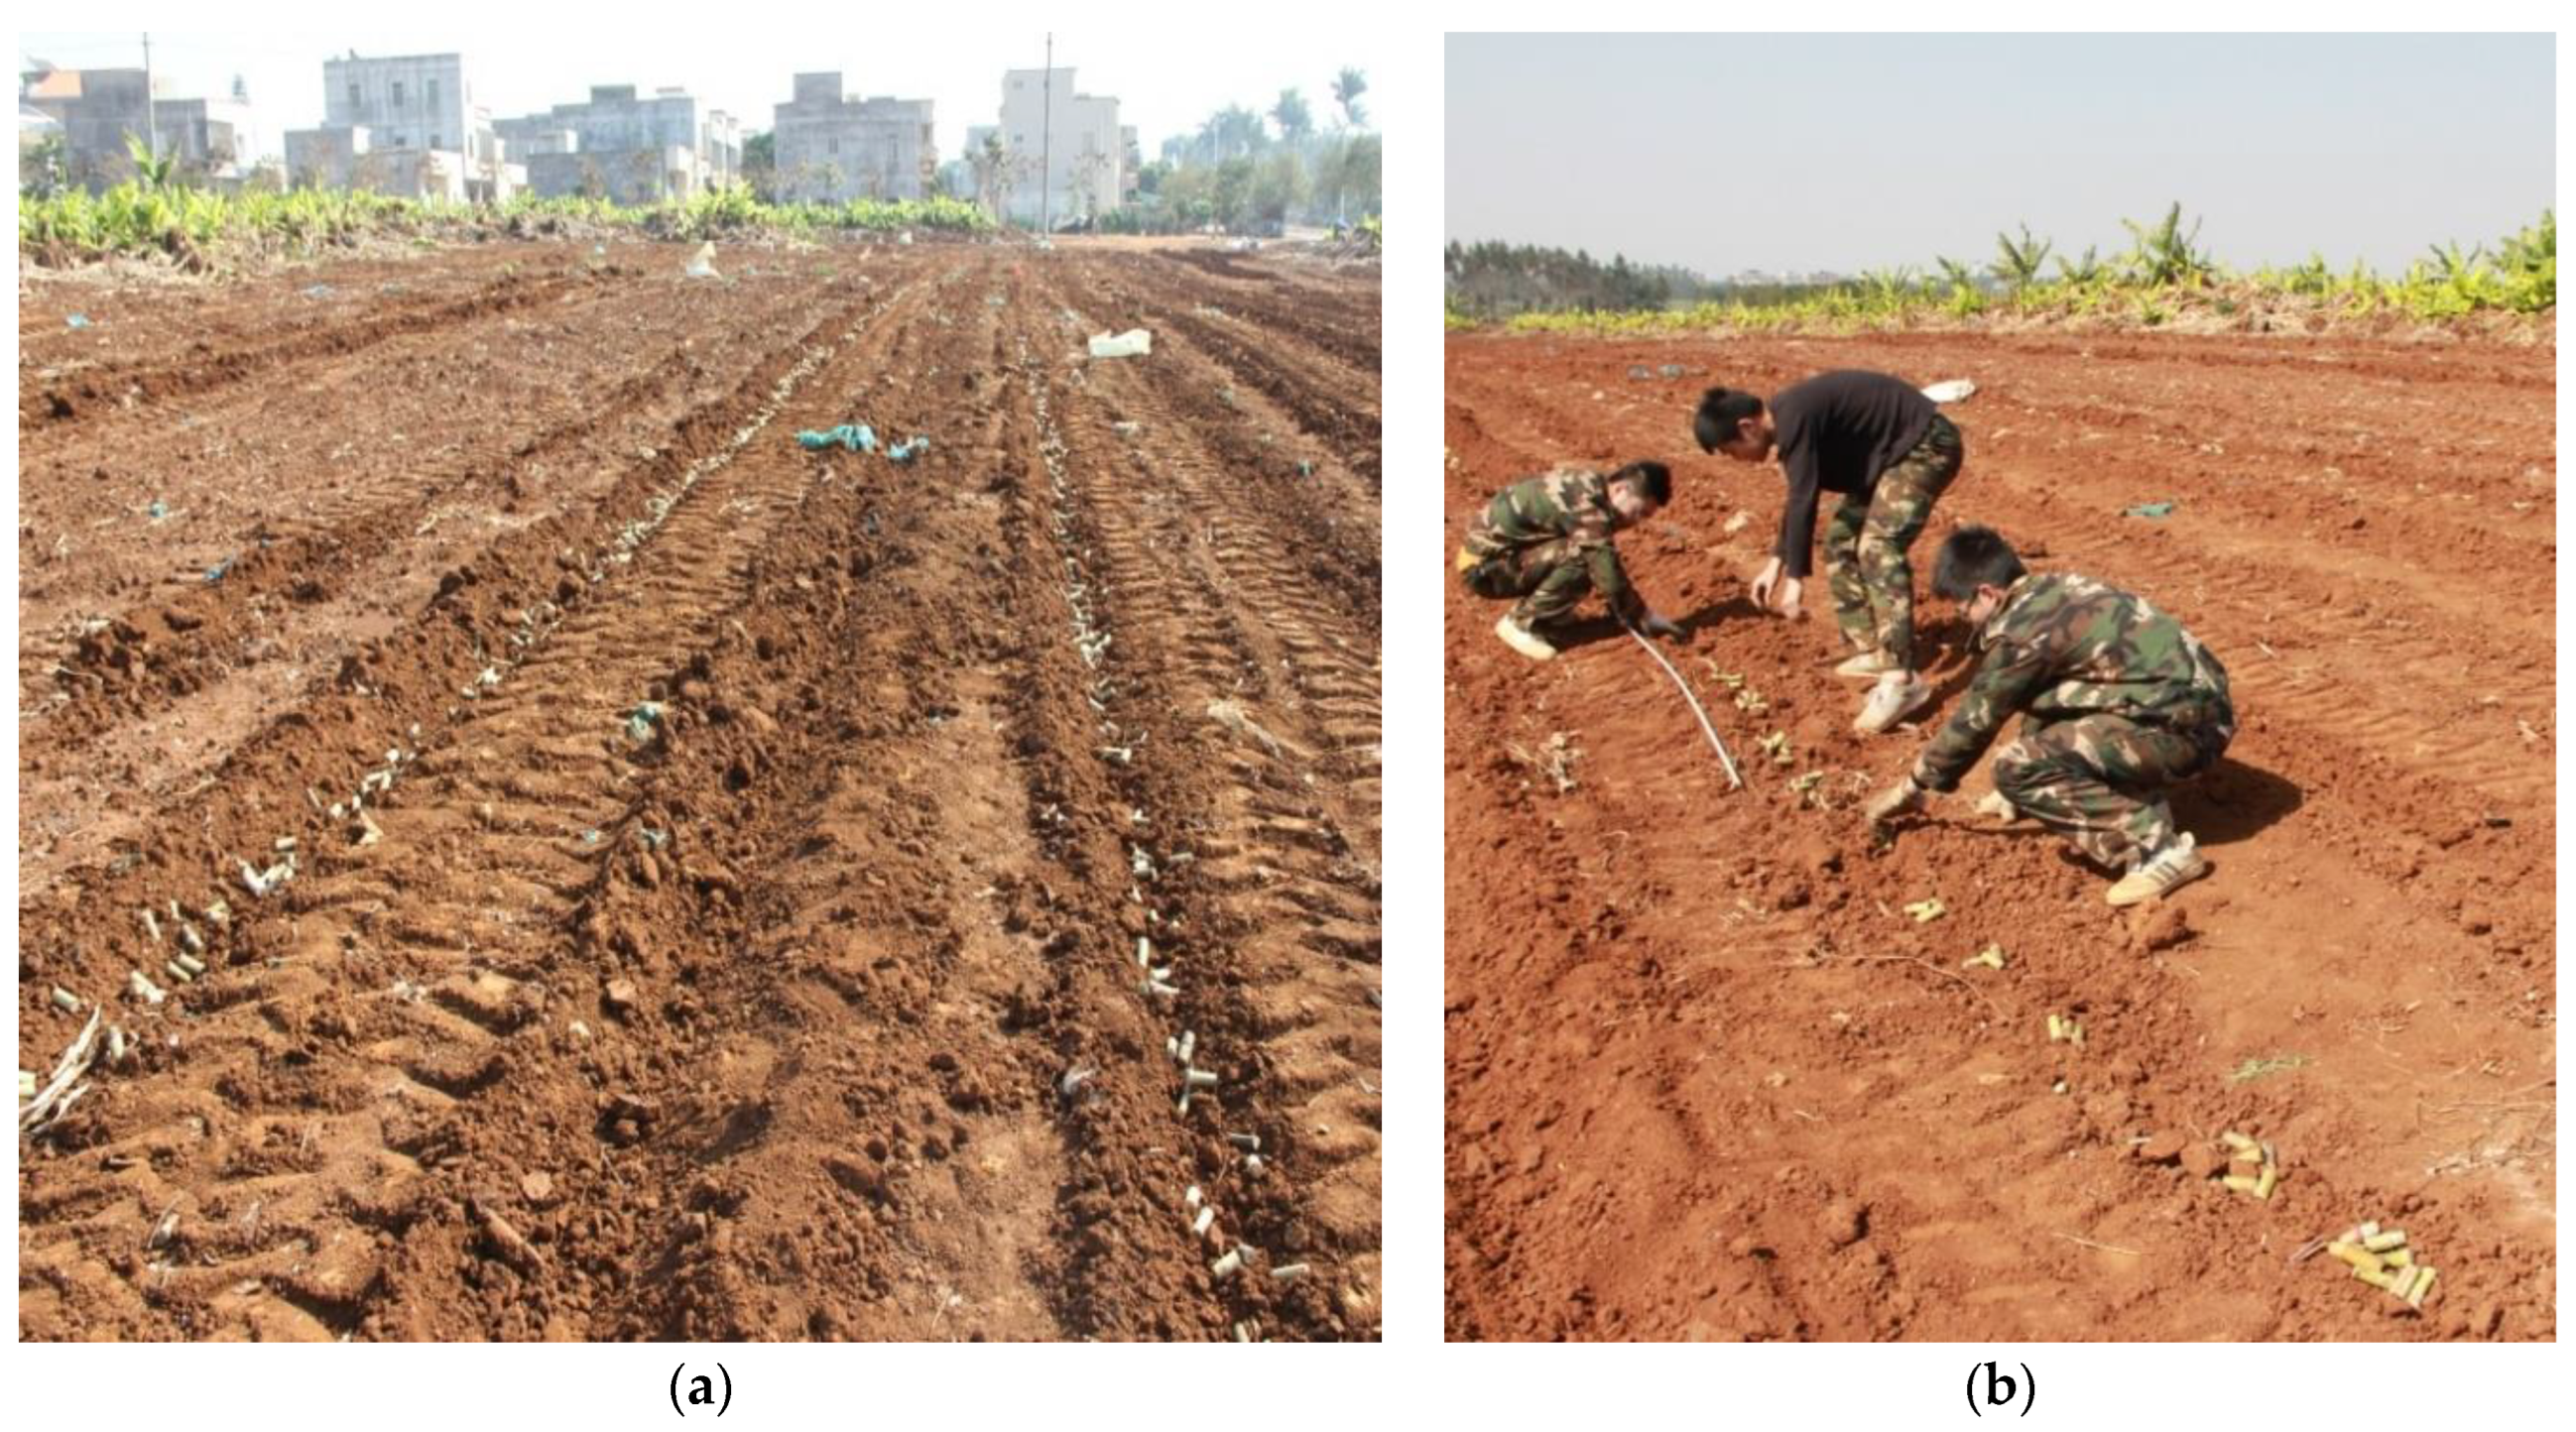
2.3. Field Experiments

According to the influence of the above factors on the planting uniformity, the single-bud billet planter was designed with the angle of the rake bar chain set to 117°, and an adjustment plate was installed in the seed box to ensure that there were 500–800 billets in the effective working area of the rake bar chain. To further improve the qualified rate of filling, the planter adopted three rake bar chains in each seed box to increase the rate of seed filling. Considering that the high rotational speed of the rake bar chain may cause damage to the billets, the use of three bar chains per seed box could adapt to the fast-speed operation at a lower rotational speed. Meanwhile, a parabolic guide plate was designed at the seeding port to make the billets fall into the furrow more smoothly. The single-bud planter was equipped with two seed boxes, two openers, two fertilizing devices, two sett-covering devices, two film-covering devices, and other devices. The whole plant system was composed of a JOHN DEERE 1204 tractor (120 kW) and an HN 2CZD-2 single-bud sugarcane planter (Figure 4). Field experiments were carried out in the farm of Guangdong Guangken Agricultural Machinery Service Co., Ltd., in the city of Zhanjiang, Guangdong Province, China. The test field was latosol, deep-soil-layer, sticky heavy texture, poor fertility, acidic soil.

2.3.1. Field Evaluation of the Planting Uniformity

According to the sugarcane planting requirements and the characteristics of single-bud billets, the number of billets in a unit length of 0.5 m was counted as shown in Figure 5. The indexes used to evaluate the field planting uniformity were the same as those used in the laboratory, i.e., the quality index Zq, multiple index Zm, and miss index Ze.

2.3.2. Experimental Method

According to the theoretical number of billets at each chain rotational speed, the matching forward speed was determined for the field planting uniformity experiment. Due to the planting requirements of 12 effective buds per meter in the furrow [23] and the stable operating speed range of the tractor in the field, three levels of the rotational speed of the rake bar chain, (30 rpm, 40 rpm, and 50 rpm), and two levels of forwarding speed, 2km/h and 3km/h, were selected to study their effects on field planting uniformity The planter worked 50 m per treatment.

2.4. Statistical Analysis

In the laboratory experiments, the factors and levels in single-factor tests were selected based on the results of previous experiments [13], The effective ranges were selected to provide optimal parameters for the orthogonal tests. Each test was repeated three times. IBM SPSS Statistics 27.0 software was used to analyze the variance of the test data. Full-factor tests of rotational speed and forward speed in field experiments were conducted’ the planter worked 50 m per treatment. The test indexes were computed using Microsoft Excel (2016).

3. Results and Discussion

3.1. Analysis of Laboratory Experiment Results

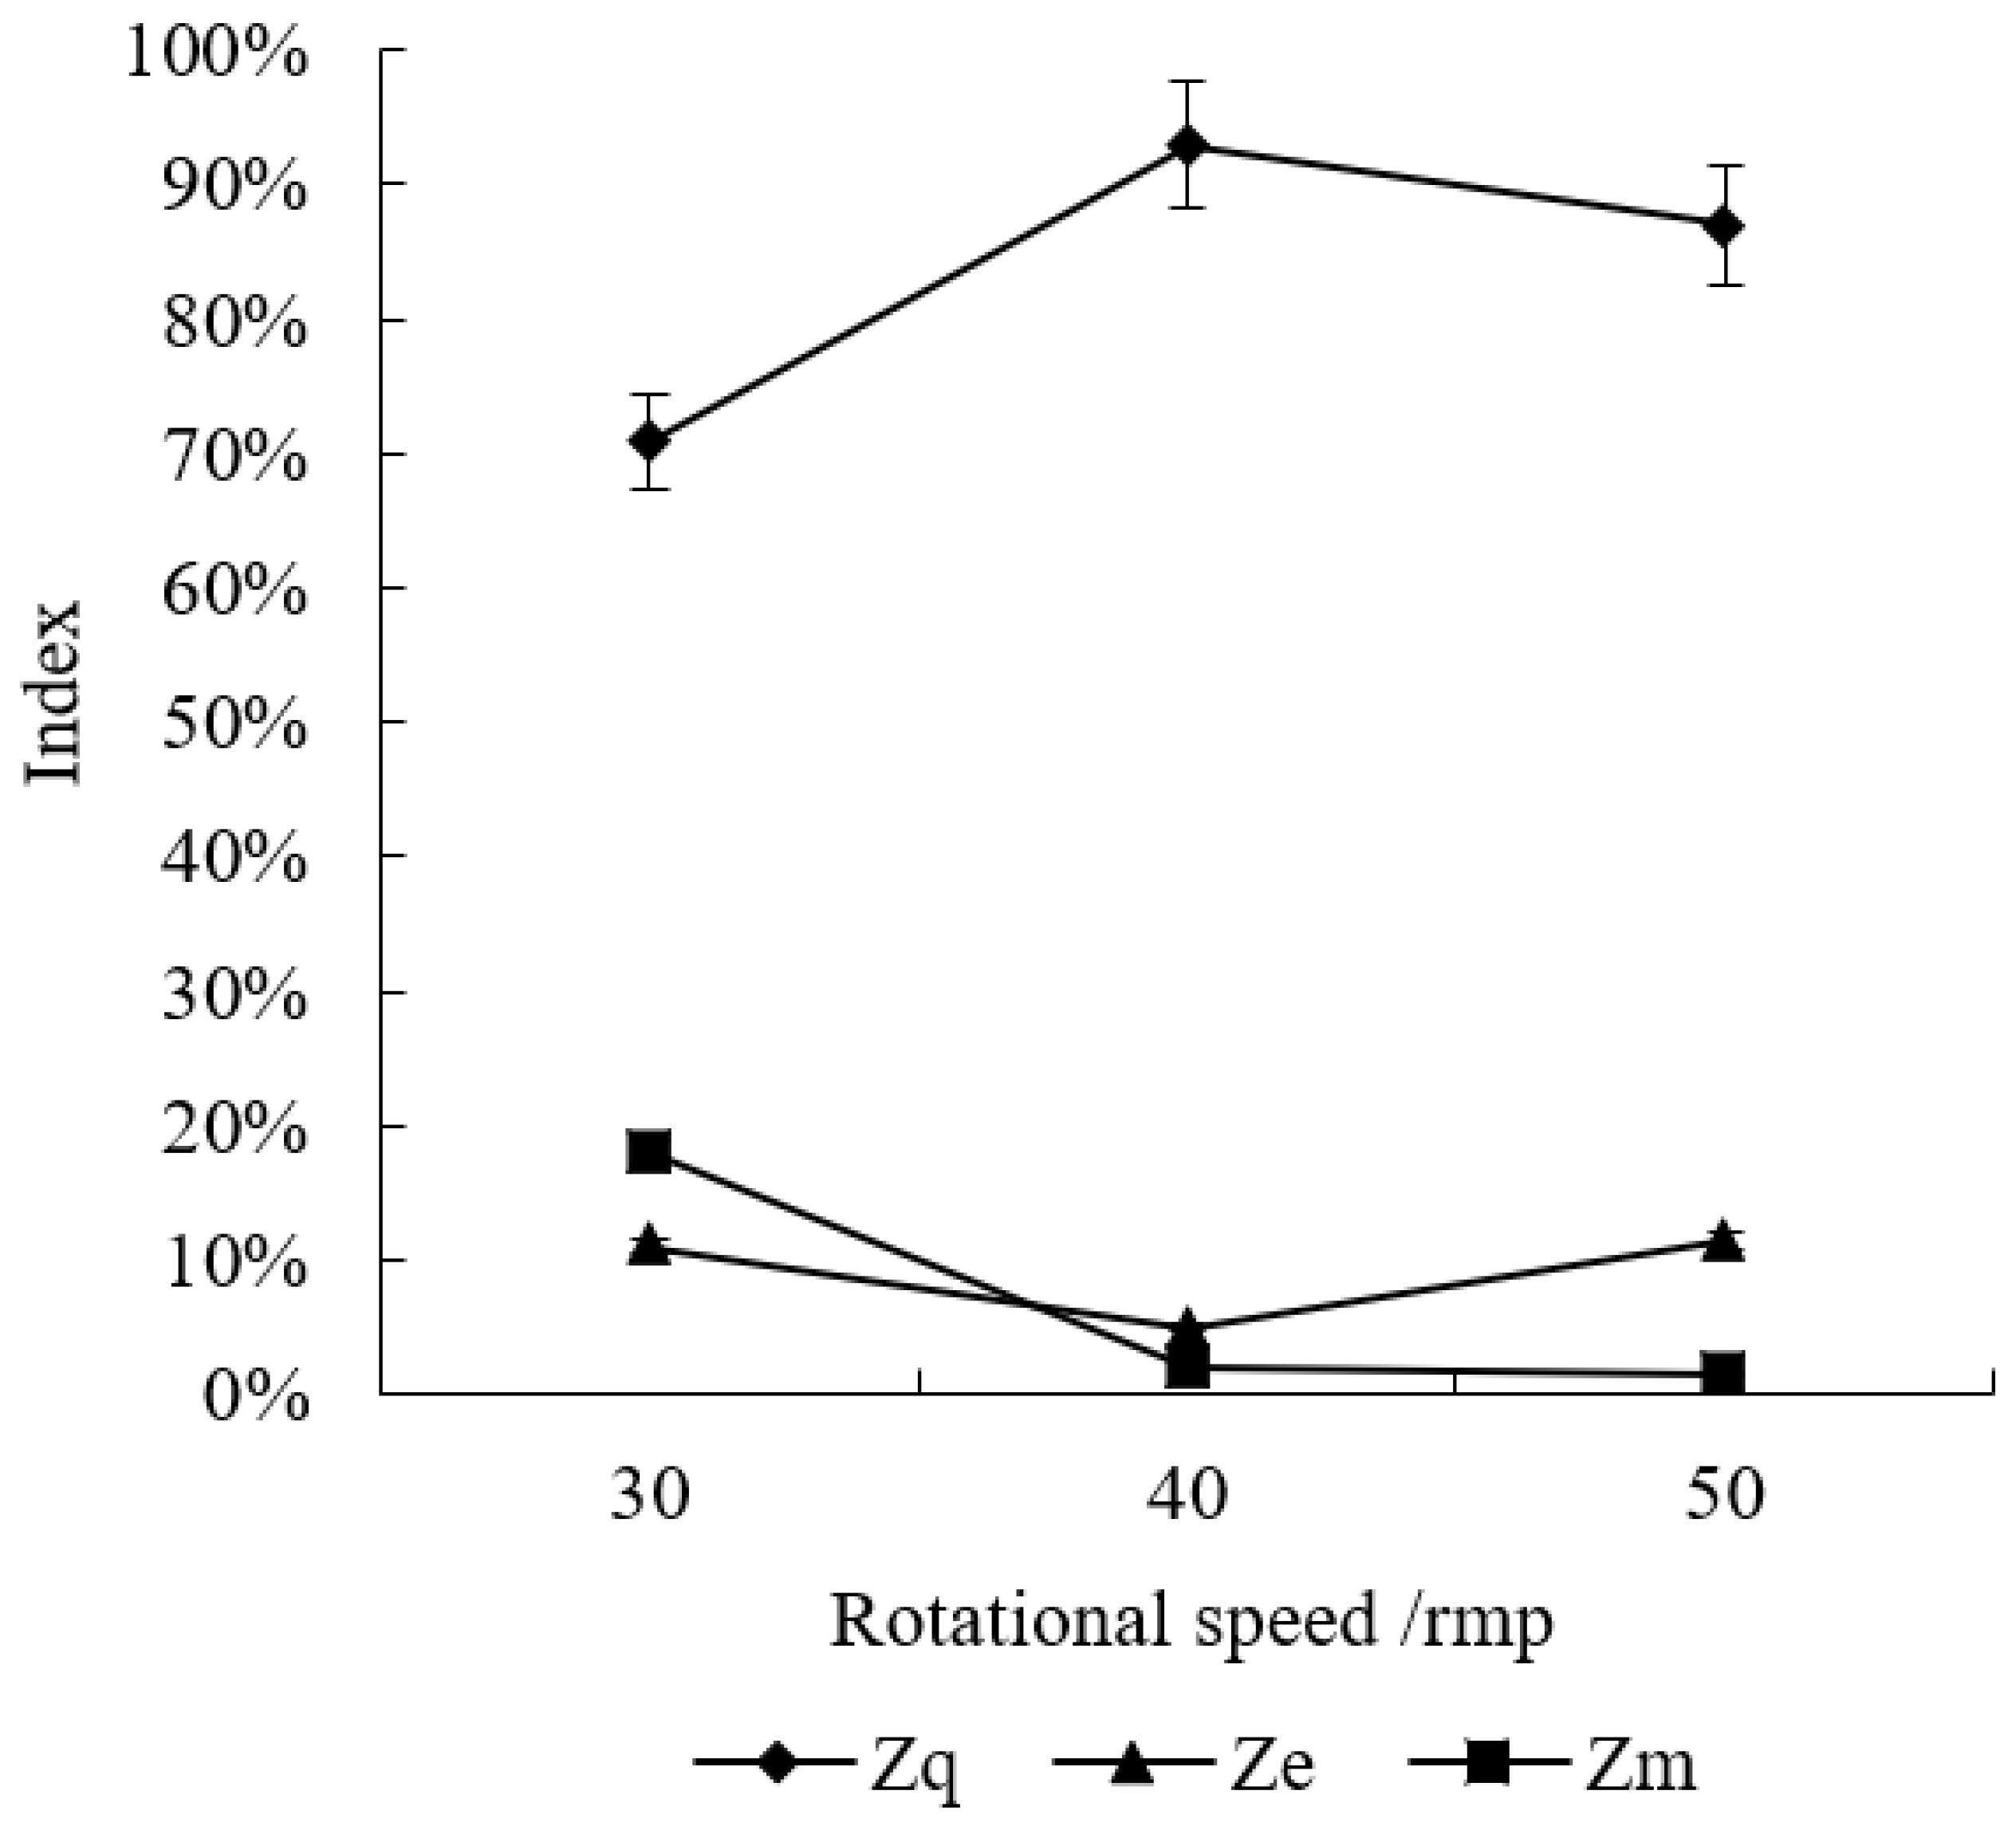
3.1.1. The Effect of the Rotational Speed of the Rake bar Chain on Planting Uniformity

According to a univariate analysis of variance, at the 95% confidence interval, the rotational speed had a significant effect on the quality index Zq (F = 2.508, p = 0.048 < 0.05) and miss index Ze (F = 2.508, p = 0.048 < 0.05). In the previous experiment [13], rotational speed had no significant effect on the uniformity of seed filling, indicating that the forward speed may promote the influence of the rotational speed on the planting uniformity. Reference [23] also mentioned the influence of forward speed on planting. The specific trends can be seen in Figure 6: when the rotational speed increased from 50 rpm to 130 rpm, the value of the quality index Zq changed little and remained above 80%; the value of the multiple index Zm was always zero; the value of the miss index Ze first decreased with the increase in rotational speed, and then was almost zero when the rotational speed was between 100 rpm and 120 rpm. Yazgi et al. [24] also found that the qualification rate of the seeding unit increased first and then decreased with the increasing sprocket speed. The value of the miss index Ze then increased slightly when the rotational speed reached 130 rpm. That indicated that increasing the rotational speed could increase the probability of acquiring billets in the rake bar and thus improve the planting uniformity, but when the rotational speed is too high, the probability decreases, and the bud may be damaged. Therefore, the rotational speed should be as low as possible when meeting planting requirements.
The statistical results of the test samples are listed in Table 2, where “Min” and “Max” indicate the minimum and the maximum number of billets per meter. As shown in Table 2, the coefficient of variation (CV) of planting uniformity decreased with the increase in the rotational speed; the lower the coefficient of variation, the better the planting uniformity. When the rotational speed was 100 rpm, the value of CV was at the minimum of 13.25%, and then increased slightly as the rotational speed increased.

3.1.2. The Effect of Angle of Rake Bar Chain on Planting Uniformity

According to the univariate analysis of variance, at the 95% confidence interval, the angle of the rake bar chain had a significant effect on the quality index Zq (F = 20.477, p = 0.001 < 0.05), the multiple index Zm (F = 50.281, p = 0.001 < 0.05), and the miss index Ze (F = 49.629, p = 0.001<0.05), which is consistent with the results of the previous seed-filling uniformity experiment [13], and the other sugarcane billet planter had the same trend [9]. As shown in Figure 7, with the increase in the angle of the rake bar chain, the quality index Zq first increased and then decreased. When the angle was 117°, the quality index Zq reached the maximum of 89.47%. When the angle continued to increase to 127°, the quality index Zq decreased and the multiple index Zm increased significantly to 53.85%, while the miss index Ze decreased to zero. It is evident that the increase in angle makes more billets enter the working area of rake bar chain, which was beneficial to improve the planting uniformity. However, if the angle was too inclined, too many billets would be taken out, resulting in the increase in the multiple index Zm; as such, the optimal angle was 117°.
As listed in Table 3, the coefficient of variation (CV) of the planting uniformity decreased gradually with the increase in angle. CV reached the minimum value of 17.2% when the angle was 127°. Considering the quality index, 117° was still the optimal option.

3.1.3. The Effect of the Number of Billets on Planting Uniformity

According to the univariate analysis of variance, at the 95% confidence interval, the rotational speed had a significant effect on the quality index Zq (F = 13.274, p = 0 < 0.05) and miss index Ze (F = 3.059, p = 0.015 < 0.05), which is consistent with the results of the previous seed-filling uniformity experiment [13]. As illustrated by Figure 8, as the number of billets increased, the quality index Zq increased, and the multiple index Zm was generally low, while the miss index Ze gradually decreased. In the literature [18], it was also found that the discharge index was high at the beginning of the test, while the container bin was fully loaded. When the number of billets was 900, the quality index Zq reached the maximum of 100%. However, when the number continued to increase to 1000, the quality index Zq decreased. Meanwhile, Table 4 reveals the CV was only 16.96% when the number was 900. It can be inferred that, in addition to increasing the angle, increasing the number of billets could also increase the qualified rate, but a number too high could also lead to an increase in the multiple index Zm. Therefore, the quantity should be kept within the appropriate range (200–900) from Figure 8.

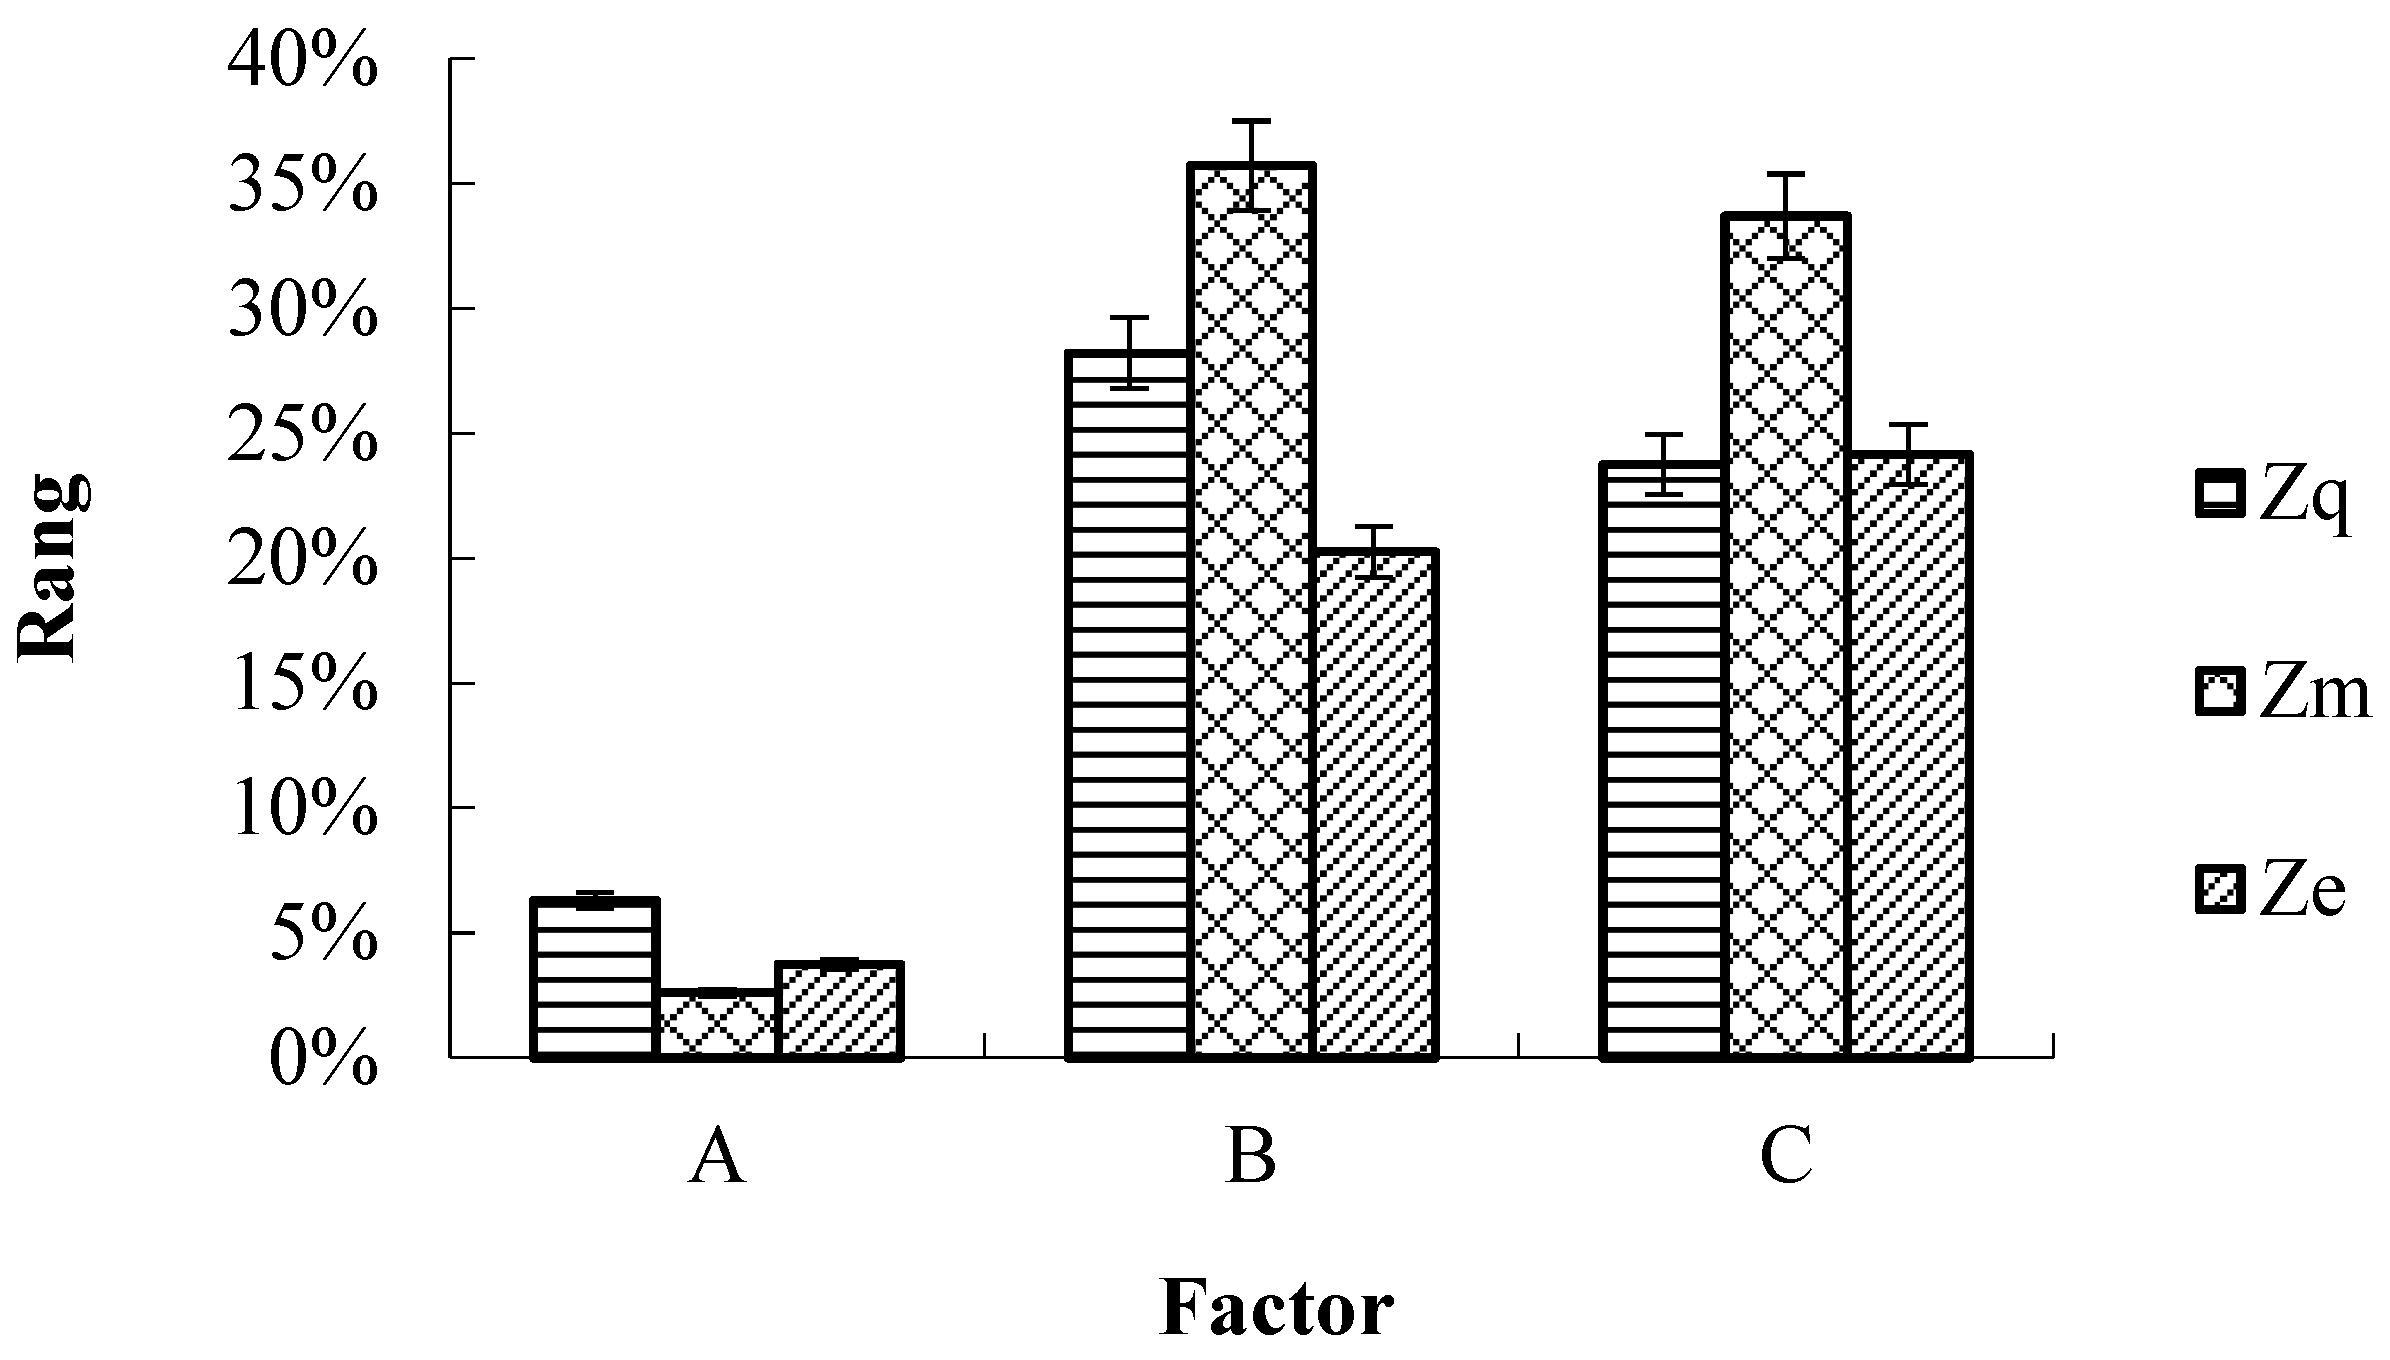
3.1.4. Analysis of Orthogonal Test Results

The results are given in Table 5, and were averaged three times.
General linear models variance analysis was conducted on the orthogonal test results, and the results are listed in Table 6. Factor A had no significant effect on the quality index Zq (p = 0.642 > 0.05), multiple index Zm (p = 0.556 > 0.05), or miss index Ze (p = 0.83 > 0.05), which is consistent with the single-factor test results in 3.1.1.
Factors B and C had significant effects on the quality index Zq (for B, p = 0.013 < 0.05; for C, p = 0.003 < 0.05), multiple index Zm (for B, p = 0 < 0.05; for C, p = 0 < 0.05), and miss index Ze (for B, p = 0.046 < 0.05; for C, p = 0.02 < 0.05); their interaction had significant effects on the quality index Zq (p = 0.001 < 0.05) and multiple index Zm (p = 0 < 0.05), while the other interactions had no significant effects on the three indexes.
According to the value of Eta2 in Table 6 and Figure 9, the greater the value of Eta2, the greater influence of the factor. The order of factors affecting the quality index Zq and multiple index Zm was B×C > B > C > A, and the order of factors affecting the miss index Ze was C > B > B×C > A.
Among the test indexes, the quality index Zq can best reflect the planting uniformity. Meanwhile, a comprehensive analysis was conducted by referring to the multiple index Zm and miss index Ze, respectively. If the interaction has a significant influence on the test index, the interaction should be given priority. The orthogonal experiment results were extracted and sorted into Figure 10 and Table 7 to illustrate more clearly the optimal level of each factor and the interaction between B and C. It can be concluded that:
  • According to Figure 10, the quality index Zq was highest at the first level of factor A and the second levels of factor B and C, respectively. Considering the interaction of B2C2, the quality index Zq was the highest in Table 7, so the optimal combination for Zq is A1B2C2;
  • The multiple index Zm reached the minimum at the first levels of factor A, B, and C, respectively, in Figure 10. Zm reached the minimum under multiple combinations of factor B and factor C, including B2C2 in Table 7;
  • The miss index Ze reached the minimum at the first level of factor A and the third levels of B and C, respectively, in Figure 10. Considering the interaction of B and C, Ze reached the minimum under multiple combinations of factor B and factor C and was only 2.78% under B2C2;
  • According to the three indexes, the optimal combination was A1B2C2. Under this combination, the quality index Zq was 97.22% and the multiple index Zm was 0%, while the miss index Ze was 2.78%.

3.2. Analysis of Field Experiment Results

The planting effect of the sugarcane planter with single-bud billets in the field is shown in Figure 11a. As detailed in Figure 11b, the number of billets in a furrow was measured in units of 0.5 m, and a total of 427 units were counted.
The results of the field planting experiments are listed in Table 8. When the rotational speed was 50 rpm, the increase in the forward speed had little effect on the quality index Zq, and the multiple index Zm increased slightly.
However, there are great differences in planting uniformity with different rotational speeds under the same forward speed. As indicated in Figure 12, the quality index Zq is the highest (93.38%) while the miss index Ze and the multiple index Zm are the lowest (4.41%, 2.21%) when the rotational speed is 40 rpm. Therefore, the field planting uniformity was the best when the rotational speed of 40 rpm was matched with the forward speed of 2.2 km/h; there were 3 to 8 sugarcane billets per 0.5 m in the furrow. Under the high quality, the forward speed is better than the sugarcane-cum-potato planter (0.5m/s) [25].

4. Conclusions

According to the single-factor and orthogonal experimental results in the laboratory, the rotational speed of the rake bar chain had no significant effect on the planting uniformity, while the angle of the rake bar chain, the number of billets, and their interaction had significant effects on the planting uniformity. Meanwhile, the quality index Zq was the highest when the angle of the rake bar chain was 117° and the number of billets was 500, but it changed little and was high when the number of billets was between 500–800. The orthogonal experiment showed that optimal planting uniformity can be achieved under a rotation speed of 70 rpm, an angle of the rake bar chain of 117°, and a number of billets of 500. Under this condition, the quality index Zq was 97.22% and the multiple index Zm was 0.00%, while the miss index Ze was 2.78%. Therefore, the single-bud planter was designed with an angle of the rake bar chain of 117°, and an adjustment plate was installed in the seed box to ensure that there were 500–800 billets in the effective working area of the rake bar chain. Three rake bar chains were adopted per seed box in the planter to increase the rate of seed filling.
Field experiments showed that when the rotation speed was 40 rpm and the forward speed was 2.26 km/h, the planting uniformity was the best and the quality index Zq was 93.38%. There were 3 to 8 sugarcane billets per 0.5 m in the furrow. Due to the limited forward speed of the tractors in field operations, the range of forwarding speed was small in the field experiment. Future work will investigate the planting uniformity under different forward speeds and matching rotational speeds. High rotational speeds can also lead to the bud damage. Therefore, the rotational speed should be as low as possible when meeting planting requirements. In addition, bud damage should be further studied in the future. These works provide great reference value for the future design, improvement, and field operation application of sugarcane single-bud billet planters.

Author Contributions

Conceptualization, Q.L. and Y.O.; methodology, M.W., X.Z., and Q.L.; data analysis, M.W.; writing—original draft preparation, M.W.; funding acquisition, Q.L. All authors have read and agreed to the published version of the manuscript.

Funding

This research was funded by National Key R&D Program of China (2020YFD1000600) and Guangdong Provincial Team of Technical System Innovation for Sugarcane Sisal Industry (2019KJ104-11).

Institutional Review Board Statement

Not applicable.

Informed Consent Statement

Not applicable.

Data Availability Statement

The data presented in this study are available on demand from the first author at ([email protected]).

Conflicts of Interest

The authors declare no conflict of interest.

References

  1. Singh, A.K.; Singh, P.R. Development of a Tractor Operated Sugarcane Cutter Planter for Mechanisation of Sugarcane Planting in Deep Furrows. Sugar Tech 2016, 19, 1–8. [Google Scholar] [CrossRef]
  2. Cebim, G.J. Plantio mecânico de cana-de-açúcar (Saccharum spp.): Desempenho operacional e econômico. Stab 2008, 31, 40–47. [Google Scholar]
  3. Rípoli, M.L.; Rípoli, T.C.; Casagrandi, D.V.; Ide, B.Y. Evaluation of five sugar cane planters. Eng. Agrículture Jaboticabal 2010, 30, 1110–1122. [Google Scholar] [CrossRef]
  4. Khedkar, M.B.; Kamble, A.K. Evaluation of mechanized planting of sugarcane. Int. J. Agric. Eng. 2008, 1, 136–139. [Google Scholar]
  5. Deshbhandari, A.; Adesh, K.S.; Karthik, K.S.; Dileep, S.L. Design and Fabrication of Sugarcane Node Cutter Machine. Ph.D. Thesis, CMR Institute of Technology, Bangalore, India, 2021. [Google Scholar]
  6. Saengprachatanarug, K.; Chaloemthoi, C.; Kamwilaisak, K.; Kasemsiri, P.; Chaun-Udom, S.; Taira, E. Effect of metering device arrangement to discharge consistency of sugarcane billet planter. Eng. Agric. Environ. Food 2018, 11, 139–144. [Google Scholar] [CrossRef]
  7. Jain, R.; Solomon, S.; Shrivastava, A.K.; Chandra, A. Sugarcane bud chips: A promising seed material. Sugar Tech 2010, 12, 67–69. [Google Scholar] [CrossRef]
  8. Salassi, M.E.; Breaux, J.B.; Hoy, J.W. Estimated cost differences between whole-stalk and billet sugarcane planting methods in Louisiana. J. Am. Soc. Sugar Cane Technol. 2004, 24, 250–257. [Google Scholar]
  9. Moslem, N.; Jalil, R.; Ali, K. Fabrication and evaluation of a metering device for a sugarcane billet planter. Yüzüncü Yıl Üniversitesi Tarım Bilimleri Derg. 2015, 25, 1–12. [Google Scholar]
  10. Galal, M.O.A. A new technique for planting sugarcane in Egypt. Inst. Integr. Omics Appl. Biotechnol. J. 2016, 7, 15–21. [Google Scholar]
  11. Gujja, B.; Loganandhan, N.; Goud, V.V.; Agarwal, M.; Dalai, S. Sustainable Sugarcane Initiative (SSI) Improving Sugarcane Cultivation. ICRISAT Prasesh India 2009, 1–36. Available online: http://www.agritech.tnau.ac.in/pdf/English%20SSI.pdf (accessed on 18 March 2022).
  12. Patnaik, J.R.; Singh, S.N.; Sarangi, D.; Nayak, P.K. Assessing potentiality of bud chip technology on sugarcane productivity, profitability and sustainability in real farming situations under south east Coastal Plain Zone of Odisha India. Sugar Tech 2017, 19, 373–377. [Google Scholar] [CrossRef]
  13. Wang, M.; Liu, Q.; Ou, Y.; Zou, X. Experimental Study of the Seed-Filling Uniformity of Sugarcane Single-Bud Billet Planter. Sugar Tech 2021, 23, 827–837. [Google Scholar] [CrossRef]
  14. Taghinezhad, J.; Alimardani, R.; Jafary, A. Design and evaluation of three metering devices for planting of sugarcane billets. J. Agric. Sci. 2014, 20, 164–174. [Google Scholar]
  15. Robotham, B.G.; Chappell, W.J. High quality planting billets-whole-stalk planter billets compared to billets from modified and unmodified harvesters. In Proceedings of the 2002 Conference of the Australian Society of Sugar Cane Technologists held at Cairns, Queensland, Australia, 29 April–2 May 2002; pp. 199–206. [Google Scholar]
  16. Razavi, J.; Namjoo, M. Determination of forward speed effect on planting uniformity in a sugarcane billet planter. In Proceedings of the XVIIth World Congress of the International Commission of Agricultural and Biosystems Engineering (CIGR), Quebec City, QC, Canada, 13–17 June 2010. Paper No. CSBE001142. [Google Scholar]
  17. Taghinezhad, J.; Alimardani, R.; Jafari, A. Optimization cane traction output from hopper in full-automatic sugarcane planters by using response surface modeling and analytical hierarchy process. Agric. Eng. Int. CIGR J. 2013, 15, 138–147. [Google Scholar]
  18. Saengprachatanarug, K.; Wongpichet, S.; Ueno, M.; Taira, E. Comparative discharge and precision index of a sugar cane billet planter. Appl. Eng. Agric. 2016, 32, 561–567. [Google Scholar]
  19. Kachman, S.D.; Smith, J.A. Alternative measures of accuracy in plant spacing for planters using single seed metering. Trans. ASAE 1995, 38, 379–387. [Google Scholar] [CrossRef]
  20. Kumar, M.; Dogra, B.; Sanghera, G.S.; Manes, G.S. Modification and evaluation of commercially available sugarcane trench planter for its application under Punjab conditions. Sugar Tech 2019, 21, 586–595. [Google Scholar] [CrossRef]
  21. Johnson, R.M.; Viator, R.P.; Richard, E.P., Jr. Effects of billet planting rate and position on sugarcane yields in Louisiana. J. Am. Soc. Sugar Cane Technol. 2011, 31, 79–90. [Google Scholar]
  22. Silva, M.D.A.; Carlin, S.D.; Perecin, D. Fatores que afetam a brotação inicial da cana-de-açúcar. Revista Ceres 2004, 51, 457–466. [Google Scholar]
  23. Compagnon, A.M.; da Silva, R.P.; Furlani, C.E.A.; Cavichioli, F.A.; Arriel, F.H. Operational uniformity for a sugarcane planter. Afr. J. Agric. Res. 2017, 12, 953–962. [Google Scholar]
  24. Yazgi, A.; Degirmencioglu, A. Measurement of seed spacing uniformity performance of a precision metering unit as function of the number of holes on vacuum plate. Measurement 2014, 56, 128–135. [Google Scholar] [CrossRef]
  25. Gupta, R.; Singh, P.R.; Singh, A.K. Development of sugarcane-cum-potato planter for mechanisation of simultaneous planting of sugarcane and potato. Sugar Tech 2017, 19, 517–525. [Google Scholar] [CrossRef]
Figure 1. Preparation of sugarcane billets: (a) billet-cutting machine; (b) cutter and fixing plate.
Agriculture 12 00908 g001
Figure 2. Laboratory experimental set-up.
Agriculture 12 00908 g002
Figure 3. Laboratory experiment on planting uniformity.
Agriculture 12 00908 g003
Figure 4. HN 2CZD-2 single-bud sugarcane planter.
Agriculture 12 00908 g004
Figure 5. Statistics of billet quantity.
Agriculture 12 00908 g005
Figure 6. The effect of the rotational speed of the rake bar chain on planting uniformity.
Agriculture 12 00908 g006
Figure 7. The effect of the angle of the rake bar chain on planting uniformity.
Agriculture 12 00908 g007
Figure 8. The effect of the angle of the rake bar chain on planting uniformity.
Agriculture 12 00908 g008
Figure 9. Range diagram.
Agriculture 12 00908 g009
Figure 10. Affecting trends of different factors.
Agriculture 12 00908 g010
Figure 11. Field planting experiment: (a) planting effect; (b) field measurement.
Agriculture 12 00908 g011
Figure 12. The effect of the rotational speed of the rake bar chain on field planting uniformity.
Agriculture 12 00908 g012
Table 1. Factors and levels of the orthogonal experiment.
LevelFactor
Rotational Speed of Rake Bar Chain
A/rpm
Angle of Rake Bar Chain
B/°
Number of Billets
C
170107200
290117500
3110127800
Table 2. Statistical data of the single-factor experiment on the rotational speed of the rake bar chain.
Rotational Speed
/Rpm
Sample Number δ CVMinMax
50322.61432.43%1.0014.00
60252.33020.22%6.0015.00
70232.65120.60%8.0018.00
80212.80419.31%10.0020.00
90193.14219.32%11.0021.00
100152.65813.25%16.0027.00
110163.63317.77%16.0028.00
120143.34214.31%18.0028.00
130174.53519.52%14.0033.00
Table 3. Statistical data of the single-factor experiment on the angle of the rake bar chain.
Angle
Sample Number δ CVMinMax
97312.69328.59%514
107223.55426.15%720
117194.22125.62%725
127135.46417.20%2238
Table 4. Statistical data of the single-factor experiment on the number of billets.
Number of BilletsSample Number δ CVMinMax
100264.30839.86%1.0019.00
200202.45817.07%10.0019.00
300194.04525.53%10.0023.00
400194.52528.56%7.0024.00
500174.10622.96%7.0024.00
600204.25628.95%8.0025.00
700192.59415.45%12.0021.00
800225.40227.96%11.0030.00
900164.33516.96%18.0033.00
1000127.29221.09%21.0045.00
Table 5. Arrangements and results of the orthogonal experiment.
NoABA×BA×BCA×CA×CB×CB×CZqZmZe
1234567811
111111111125.00%75.00%0.00%
21111222224.17%95.83%0.00%
31111333334.00%96.00%0.00%
412221112337.93%62.07%0.00%
51222222318.33%91.67%0.00%
61222333120.00%94.44%5.56%
713331113212.50%87.50%0.00%
81333222130.00%93.33%6.67%
91333333210.00%7.14%92.86%
1021231231131.82%68.18%0.00%
112123231229.09%90.91%0.00%
1221233123310.53%89.47%0.00%
1322311232325.00%75.00%0.00%
142231231310.00%100.00%0.00%
152231312120.00%81.82%18.18%
1623121233215.00%85.00%0.00%
172312231130.00%93.33%6.67%
182312312210.00%13.33%86.67%
1931321321184.62%15.38%0.00%
2031322132240.54%59.46%0.00%
213132321330.00%100.00%0.00%
223213132230.00%100.00%0.00%
233213213310.00%100.00%0.00%
243213321120.00%100.00%0.00%
253321132320.00%100.00%0.00%
263321213130.00%71.43%28.57%
273321321210.00%0.00%100.00%
Table 6. Variance analysis of the orthogonal experiment results.
ZqZmZe
SourceSigEta2SigEta2SigEta2
A0.6420.1050.5560.1360.830.046
B0.013 *0.6610.000 **0.9720.046 *0.536
C0.03 *0.5830.000 **0.9670.02 *0.625
B×C0.001 **0.8850.000 **0.9780.4650.331
A×C0.7420.1980.5660.2820.9380.086
A×B0.1690.5150.1240.5570.1610.522
** means a significant effect within a 99% confidence interval; * means a significant effect within a 95% confidence interval. Eta2 is the contribution rate of the factors to the test indicators.
Table 7. The interaction of factor B and C.
ZqZmZe
FactorC1C2C3C1C2C3C1C2C3
B152.85%82.07%95.16%0.00%0.00%0.00%47.15%17.93%4.84%
B279.02%97.22%92.09%0.00%0.00%7.91%20.98%2.78%0.00%
B390.83%86.03%6.82%0.00%13.97%93.18%9.17%0.00%0.00%
Table 8. Results of the field experiment on planting uniformity.
Rotational Speed (rmp)Forward Speed (km/h)ZqZeZm
501.6187.50%10.58%1.92%
502.2387.64%10.11%2.25%
402.2693.38%4.41%2.21%
302.2571.72%10.10%18.18%
Publisher’s Note: MDPI stays neutral with regard to jurisdictional claims in published maps and institutional affiliations.

