Article

Agroenvironmental Performances of Biochar Application in the Mineral and Organic Fertilization Strategies of a Maize–Ryegrass Forage System

1
CREA Zootecnia e Acquacoltura Consiglio per la Ricerca in Agricoltura e l’Analisi dell’Economia Agraria, I-26900 Lodi, LOM, Italy
2
UPTOFARM s.r.l., I-10095 Grugliasco, TO, Italy
3
MAC Minoprio Analisi e Certificazioni s.r.l., I-22070 Vertemate Con Minoprio, CO, Italy
4
Fondazione Minoprio, I-22070 Vertemate Con Minoprio, CO, Italy
*
Author to whom correspondence should be addressed.
Agriculture 2022, 12(7), 925; https://doi.org/10.3390/agriculture12070925
Submission received: 24 May 2022 / Revised: 15 June 2022 / Accepted: 23 June 2022 / Published: 26 June 2022

Abstract

:
Biochar, included as a soil amendment by EU Regulation 2019/1009, has been shown to increase soil organic C stock and nutrient retention. We investigated the effect of biochar incorporation alone (B) and in association with mineral (BMin), digestate (BDig) and slurry (BSlu) fertilization, compared to the respective controls without biochar (C, Min, Dig and Slu), in a silage maize–Italian ryegrass rotation, on yield, soil fertility parameters and nitrous oxide (N2O) emissions. Two types of biochar in three doses (0.2, 0.45, 0.9%) were tested in two cropping seasons. Biochar did not significantly affect maize yield; however, BDig tended to increase silage yield and the ear component compared to Dig, while BMin tended to reduce maize N uptake compared to Min. Biochar incorporation significantly increased soil organic C (+31%) and cation exchange capacity (CEC) (+13%) in all the fertilization treatments; BMin and BDig also showed an increase compared to biochar alone (B). Emission of N2O was mainly driven by fertilization, digestate exhibiting the highest emissions. Biochar addition decreased the cumulative N2O emissions consistently in all the fertilization treatments, though not significantly. The association of biochar with organic fertilizers, in particular digestate, appears promising in increasing the fertilizer efficiency and reducing N2O emissions.

1. Introduction

In intensive dairy cattle farming regions throughout the world there is an overall trend towards intensification. This results in increasing volumes of bovine effluent that needs to be efficiently utilized whilst simultaneously protecting agricultural soil fertility, the environment (emissions in the atmosphere and leaching in the water system) and, finally, the global health at the human–animal–ecosystem interface. In the Italian Po Valley, effective use of bovine effluent is a critical element in increasing the sustainability of cattle husbandry [1,2], limiting the trend in soil organic matter (SOM) depletion through intensive forage systems [3,4,5], and controlling water pollution caused by nitrogen (N) and phosphorous (P) losses. Anaerobic digestion of bovine effluent, generally mixed with other organic agricultural by-products, has become a common practice in intensive livestock husbandry, allowing the simultaneous production of effluent-derived fertilizers (digestate) and renewable energy [6]. More recently, a strategy has emerged for obtaining energy from gases produced by thermally degrading organic wastes (pyrolysis), together with the ‘biochar’ end product [7]. Biochar has been receiving more attention since Paustian et al. [8] underlined that it may be the easiest and most widely usable tool to increase soil carbon (C) stocks. The importance of sequestering C in soil is well argued in the ‘4 per 1000 Soils for Food Security and Climate’ initiative launched at COP21 [9]. The positive effect that biochar application has on soil C content depends greatly on the nature of the feedstock used in biochar production, where the woody materials and crop residues determine a higher C content than manure sources [10]. However, the effect of biochar on other soil properties, both physical (bulk density, porosity, water retention, hydraulic conductivity, aggregate stability) and chemical (pH, cation exchange capacity (CEC) and soil nutrient dynamics), which are relevant for soil fertility, is more variable as it depends on biochar characteristics, such as feedstock type, pyrolysis conditions, aging time and application rate, and on soil type and condition. Furthermore, when examining the biochar effect on crop yield, not only the biochar and soil type, but also crop choices and climatic characteristics are variables that influence the response to biochar application, especially when associated with different fertilizers [10]. Therefore, long-term field-scale experiments are likely to be the more effective way of assessing the actual impact of biochar application under specific environmental conditions and agronomic management practices.
Maize (Zea mays L.), utilized as whole-plant or whole-ear silage, and sorghum are important fodder crops in the north of Po Valley, where milk is produced for protected designation of origin (PDO) cheeses. Silage maize therefore represents the target crop of our study, in rotation with Italian ryegrass. Biochar application to C4 cereals, maize and sorghum, often has positive effects on physical and chemical soil properties, and to relative yields (i.e., percentage of yield with biochar compared to the same fertilizer and application rate without biochar) in limiting environmental conditions for crop growth [11,12,13,14]. Different mechanisms underlying these yield increases are suggested by the authors, as follows: the improvement in plant-available water, soil CEC and total saturation base (TSB) [11], the alleviation of nutrient stress [12], the prevention of severe moisture loss [13], and the reduction in cadmium (Cd) uptake by the crop in Cd-contaminated croplands [14]. In temperate agroecosystems, which are intensively managed and highly productive, the impact of biochar application on soil fertility parameters and fodder C4 cereal yield has yet to be fully investigated, and more contradictory results have been reported [15,16,17,18,19]. In these systems, the association of biochar with fertilizers is a key point in maintaining the crop yield level and coping with the high soil nitrogen (N) and phosphorus (P) agronomic status over extended areas, which provokes losses to the atmosphere and surrounding waters.
In particular, nitrous oxide (N2O) is a greenhouse gas (GHG) with a warming potential ~300-fold that of CO2. Agriculture accounts for approximately 75% of total N2O emissions, the dominant sources being the microbial processes of nitrification and denitrification occurring in agricultural soils treated with chemical or organic N fertilizers [20]. Shcherbak et al. [21], examining a series of studies with at least three N input levels, found that N2O emissions were not constant, but N application rate-dependent, as they accelerated in soils that had been fertilized more than crop requirements, irrespective of chemical or organic fertilizer origin. These nonlinear relationships between soil emission of N2O and soil N availability indicate that the N input level, soil nitrification/denitrification processes and plant N uptake are likely to have an important impact on the emission dynamics. As the incorporation of biochar into agricultural soils is expected to influence, directly or indirectly, soil microbial processes, nutrient retention and nutrient availability to crops, monitoring soil N2O emission is considered important in our experimental field.
The EU Fertilizing Product Regulation (EU 2019/1009) has recently included biochar as an agricultural soil amendment in the unified European zone. Investigating how biochar application to agricultural soils can influence the dynamics of nutrients from organic fertilizers compared to mineral fertilizers is of great interest in intensive dairy farming systems to improve the efficiency of animal effluent-derived fertilizers for forage crop production, and to preserve soil fertility.
The objectives of this research, therefore, were to investigate the effects of two biochar types at three application rates, distributed alone and in association with mineral and organic fertilization treatments, on: (a) forage yield in the intensive rotation system silage maize–Italian ryegrass, (b) soil fertility parameters and (c) N2O emissions. A five-year trial was created to identify the medium-term dynamics of crop productivity, soil fertility and losses by emission; this paper addresses the first two experimental years. The focus on how the efficiency of organic (bovine slurry and digestate) and chemical (urea) fertilizers varied in the presence of biochar, also in terms of emissions into the atmosphere, is an original feature of our study. The use of the silage maize–Italian ryegrass crop rotation system, of which only maize was fertilized, enabled highlighting the potential effect of a permanent nutrient stock on the biochar-treated soil. Moreover, the monitoring of maize growth dynamics by means of plant height recording and unmanned aerial vehicle (UAV) multispectral imaging permitted the assessment of the treatment effects across the entire cropping cycle. The final aim was to provide information on how biochar can increase sustainability and efficient fertilizer use in an intensive dairy cattle farming system in temperate agro-ecosystems.

2. Materials and Methods

2.1. Experimental Site

The field trial was established in 2018 at CREA-Cascina Baroncina (Lodi, Po Valley, Italy; 45°17′25″ N–9°29′43″ E; 81.5 m asl) on a sandy loam soil (soil texture was determined by hydrometer) with a sub-acid pH and a low level of organic carbon (Corg), potassium and phosphorus (Table 1).
The Lodi area lies in a ‘nitrate vulnerable zone’ (according to the 91/676/EEC Directive against pollution caused by nitrate from agricultural sources), in which a maximum of 170 kg ha−1 of nitrogen (N) available for plants from livestock effluent is allowed. The daily air temperature (mean, max and min values), rainfall and irrigation interventions during the two-year trial are indicated in Supplementary Figure S1.

2.2. Treatments

The treatments investigated in the trial involved the application of two types of biochar (BG from gasification and BP from pyrolysis processes), distributed alone (B) and in association with mineral fertilization (BMin), digestate from anaerobic digestion (BDig) and bovine slurry (BSlu). The same fertilization treatments without biochar (Min, Dig, Slu) were also included, and the unfertilized control (C) was added in 2019. The two types of biochar were distributed at application rates of 10 (D1), 20 (D2) and 40 (D3) t ha−1 of dry matter (DM)—corresponding to 0.2, 0.45 and 0.9% of soil weight, respectively—and incorporated into the soil by ploughing to a 30 cm depth in springtime 2018. The amount of fertilizer supplied was calculated to provide 170 kg ha−1 N available for plants, considering 100% availability of mineral fertilizer (urea) and the N–NH4 fraction of the organic fertilizers, and 50% availability of the organic N fraction. The chemical analyses of the digestate and slurry used over the two years are reported in Supplementary Table S1. In the case of mineral fertilization, 80 kg ha−1 P2O5 and 180 kg ha−1 K2O were also distributed at sowing. The organic fertilizers, digestate and slurry, were spread in springtime each year, and incorporated into the soil by ploughing within 24 h; urea distribution was split into one third at sowing, and the remaining part was used in a single in-season application. The crop rotation system was represented by a silage maize–Italian ryegrass system, which characterizes the intensive dairy cattle farming regions of the Po Valley. The Pioneer hybrid 1547 class 600 was sown at the beginning of June (12 June and 5 June in 2018 and 2019, respectively) and harvested after 98 days (18 September and 11 September in 2018 and 2019, respectively). The Italian ryegrass cultivar ‘Asso’ was sown at the beginning of October (5 October and 10 October in 2018 and 2019, respectively) and harvested in May (14 May and 8 May in 2018 and 2019, respectively). The Italian ryegrass was grown without fertilization to highlight possible residual nutrients present in the soil after the maize cropping. All other cultural practices were typical of each crop in the region.

2.3. Experiment Design and Data Recording

The experiment design was a split-split-plot arrangement, with agronomical treatments as the main plots (13.5 m × 12 m = 162 m2), biochar types as subplots (13.5 m × 6 m = 81 m2) and biochar doses as sub-subplots (4.5 m × 6 m = 27 m2). Plots were arranged in two blocks lying in field strips that have received the same agronomical treatment for 20 years.
In terms of yield data, maize growth dynamics was monitored by recording plant height at the uppermost leaf where the leaf collar was visible from 22–24 days after sowing (DAS) to tasseling/silking, every 10 days. A subsample of 5 m2 (about 30 plants) at the sub-subplot level was recorded. The same subsamples were used at harvest for assessing silage production and yield components: the subsamples were cut manually, after which a part was chopped and dried at 60 °C to measure the silage DM percentage, and a second part was separated from the plant and ear. Silage nitrogen (N) content was estimated by near-infrared spectroscopy (NIRS) on dried 1 mm ground samples using accurate and robust calibration models specifically built for silage maize at the CREA laboratory; the nitrogen data were multiplied by the coefficient 6.25 to obtain silage maize crude protein content [22]. As for Italian ryegrass, a subsample of 9 m2 (1.5 m × 6 m) at the sub-subplot level was harvested, and the DM percentage was determined from about 1 kg of fresh material by oven drying at 60 °C.

2.4. Soil Parameters

In spring 2018, before biochar application (T0), the soil of the experimental field was characterized by 24 parameters: water content at 33 (field capacity) and 1500 (wilting point) kPa (Richards apparatus) and available water content; water and saline pH (measured in 1:5 soil/water w/v); organic C and total N (Dumas method); total organic C (Springer–Klee method) and C-to-N ratio (C/N); cation exchange capacity (CEC); exchangeable Ca, Mg, K, Na (barium chloride extraction and atomic absorption spectrophotometry); total saturation base (TSB); Ca-to-Mg (Ca/Mg) and Mg-to-K (Mg/k) ratio; exchangeable sodium percentage (ESP); assimilable P (Olsen method) [23]; microbial biomass C (fumigation-incubation and extraction with chloroform) [24]; cumulative and basal respiration (CO2 evolution under standardized conditions); and the calculated indexes for the mineralization quotient (Qmin, cumulative respiration to total organic C ratio) and metabolic quotient (Qmet, basal respiration to microbial biomass C ratio) [25]. The main soil properties at T0 are indicated in Table 1. Subsequently, soil samples were taken after silage maize harvesting: in 2018, from all the treatments in block 1 only, whereas in 2019 they were taken from both blocks. The soil samples, consisting of the bulk of three subsamples, were collected at the sub-subplot level from the 0–30 cm soil layer.

2.5. Biochar Characterization

The two biochar types used in the trial were commercial products registered for agricultural use obtained by gasification (BG) (G.L.M. S.r.l., San Martino dall’Argine, Mantova, Italy) and pyrolysis (BP) (Ecco Soluzioni S.r.l., Carbonate, Como, Italy), at temperatures < 800 °C, of wood from broad-leaf autoctone species (Populus, Salix, Acacia spp.) in the case of BG and from a mix of conifer and Populus spp. in the case of BP. Biochar characterization was performed before soil application according to Italian (ICHAR, Italian Biochar Association), EU (EBC, European Biochar Certificate) and international (IBI, International Biochar Initiative) prescriptions for the ‘soil improver’ biochar (Table 2).

2.6. Multispectral Imaging

Aerial images were collected with a multirotor “STC_X8_U5” UAV (unmanned aerial vehicle). The UAV is an octocopter with eight co-axial propellers (maximum payload mass of 4 kg, maximum flight time of about 25′ per flight) equipped with a MicaSense (MicaSense, Seattle, WA, USA) RedEdge multispectral camera. The camera is a 12-bit, 1.2 megapixel camera with three visible (RGB) spectral bands and two nonvisible (red edge, near-infrared) bands. Images were acquired in TIFF format with the camera set in automatic mode; photographs were taken at noon under clear sky and calm conditions, to minimize wind and shadow effects on the photographs. The ground sample distance (GSD) was set to about 4 cm, corresponding to an altitude of about 80 m. The longitudinal and lateral image overlaps were set to 85% and 82%, respectively.
An image of a calibrated reflectance panel was acquired prior to each flight, for the conversion of digital numbers to the reflectance of image pixel values. Absolute positioning was based on a direct georeferencing approach using the position/attitude measurements acquired by the UAV-embedded GPS instrumentation. Images were then process using PIX4D software (Pix4D S.A., Prilly, Switzerland). Software processing was based on a conventional photogrammetric approach: an automated image-matching algorithm identified tie points in the images, which were used to retrieve orientation parameters of the aerial triangulation (bundle block adjustment). Once oriented, the software permits DSM extraction and the generation of an orthomosaic from the images. The software also facilitated the correction of raw digital numbers of pixel values to reflectance values, using the camera’s specific calibration factor for conversion to radiance, as well as calibrated panel reflectance values and sun irradiance data from the downwelling light sensor (DLS) for conversion to reflectance. For consistency and comparability with S2, in the present work, the NDRE (normalized difference red edge) index was calculated from the reflectance of the NIR and Red Edge (RE) bands according to the formula (NIR − RE)/(NIR + RE) [26]. This index is less sensitive to the saturation phenomenon than the NDVI index [27]. The mean NDRE was calculated at the plot scale and was used for comparison with plot-averaged canopies.

2.7. Nitrous Oxide Emissions

Throughout the maize cycle of 2019, direct N2O emissions from soil were measured in the BP-treated plots at the D2 dose, and in the corresponding fertilized controls without biochar, by means of the closed-chamber technique, as described by Moretti et al. [28]. Each chamber was composed of two pieces: one anchor and one cover. In detail, stainless steel anchors (75 × 36 cm2) were permanently inserted 15 cm into the soil. Wooden boards were appropriately placed to enable access to the anchors during sampling sessions while avoiding soil compaction and/or crop disturbance. During each measurement, a rectangular stainless steel cover (75 × 36 ×20 cm) was used to close each anchor, and a water-filled channel assured temporary sealing. Plants were not included in the chamber headspace. Gas samples of 30-mL each were collected from the internal headspace by propylene syringes at 0, 15 and 30 min after chamber closure. Samples were then transferred into 12 mL evacuated vials sealed with butyl rubber septa (Exetainer1 vial from Labco Limited, Lampeter, UK). Concentrations of N2O in the samples were determined by chromatography using a fully automated gas chromatograph (Agilent 7890A), equipped with an electron capture detector. Direct N2O emissions were calculated using the linear or nonlinear increase in concentration (selected according to the emission pattern) in the chamber headspace over time [29]. Cumulative emissions were calculated for both the whole cropping cycle and the main phenological stages (early vegetative stage (EVEG), from seeding to the beginning of stem elongation; late vegetative stage (LVEG), from the beginning of stem elongation to the beginning of flowering; reproductive stage (REP), from the beginning to the end of flowering; ripening stage (RIP), from the end of flowering to harvest) through linear interpolation across sampling days. Measured treatments were those receiving BP biochar at the D2 dose and the respective fertilized controls in both blocks, for 17 dates throughout the cropping cycle.

2.8. Statistical Analyses

For yield data, agronomical treatments—including the four biochar-treated groups (B, BDig, BMin and BSlu), the three fertilized without biochar groups (Dig, Min and Slu), and the unfertilized control I—were analyzed at plot level by means of a one-way ANOVA using the general linear model (GLM) procedure in SAS software version 8 (SAS Institute Inc., Cary, NC, USA). The significance of the treatment effect was tested using its interaction with blocks as an error term. Linear contrasts implemented in the GLM procedure were used for comparisons of specific means. The biochar-treated plots were analyzed according to the split-split-plot experimental design, with fertilization treatment as plot level (B, BDig, BMin, BSlu), biochar types (BG and BP) as the subplot level, and biochar doses (D1, D2, D3) as the sub-subplot level, using the GLM procedure. Specific means at each level were compared by linear contrasts using the error appropriate to the level.
To assess the effect of biochar incorporation into the soil, a principal component analysis based on the 24 parameters indicated in Section 2.3 was applied to the averages of treatment × biochar type using the PRINCOMP procedure in SAS software.
Cumulative N2O emissions calculated for the whole cropping cycle were analyzed by linear model only (in terms of fertilization strategy and biochar application). For cumulative emissions divided into phenological stages, a mixed model was applied, with each chamber considered as a subject, and phenological stages as repeated measures. When significant, treatment averages were separated through the Sidak post hoc test.

3. Results

3.1. Maize Yield and Growth Dynamics

Maize silage yield was stable over the two years: 18.07 t ha−1 and 17.7 t ha−1 in 2018 and 2019, respectively. The different treatments did not induce any significant differences in maize silage yield in the first year of the trial (Supplementary Figure S2 and Table 3). In the following year, 2019, a significant influence of treatments on yield emerged, driven by the fertilization effect of either the chemical (urea) or organic (digestate and slurry) treatment (Supplementary Figure S2 and Table 3). The addition of biochar did not significantly modify yield levels in either fertilized or unfertilized treatments. Some positive effects, however, consistent across both years, concerned the biochar + digestate association (BDig) compared to the corresponding fertilization without biochar (Dig): a yield increase of 17.3% and 9.7% in 2018 and 2019, respectively, and an increase in the ear component, with a reduction in the plant-to-ear ratio (Table 3). Furthermore, in 2019, the effect of digestate on silage yield was +18.4% in the presence of biochar (comparison BDig vs. B) and +1.6% the in absence of biochar (comparison Dig vs. C), whereas the effects of mineral and slurry fertilization were similar in the presence and absence of biochar. Finally, the Dig treatment produced less DM than the Min treatment in both years (−21 and −17% in 2018 and 2019, respectively). On the contrary, the difference between the two fertilization treatments when associated with biochar was ± 1% in consequence of a yield reduction in BMin and a yield increase in BDig compared to the respective controls without biochar (Table 3).
The presence of biochar reduced the protein content and the maize N uptake when associated with mineral fertilization, while the biochar + organic fertilization treatments did not significantly modify the two parameters compared to the corresponding unfertilized groups (Table 3). In the biochar-treated plots, the effects of fertilization treatments (B, BMin, BDig, BSlu), biochar type (BG and BP) and biochar dose (D1 = 10, D2 = 20, D3 = 40 t DM ha−1) were assessed. In 2018, no significant differences were present for any of the sources of variation; in 2019, all the fertilization treatments significantly outyielded the unfertilized biochar groups (B) (Table 3), whilst neither the biochar type nor the biochar dose had a significant effect on maize yield. In terms of plant nutrient adsorption, biochar treatment is considered to play a more important role than surface area and porosity; besides, these functional groups are influenced by the type of feedstock and processing conditions (temperature, oxygen presence, etc.) applied in biochar production [30]. Despite the different processing conditions and physicochemical characteristics of the two biochar types used in the trial (Table 2), no significant effect on maize yield was found for either biochar type. A similar absence of effect on the crop yield was found for the biochar rates of application into the soil: 10 (0.2%), 20 (0.45%) and 40 (0.9%) t ha−1 DM, respectively in D1, D2 and D3.
Plant height dynamics in 2019 showed a significant effect of the fertilization treatments in the presence and absence of biochar throughout the vegetative stages (Table 4).
Organic fertilization associated with biochar caused higher average increases (BDig +37.7% and BSlu +32.3% compared to biochar alone) than in the absence of biochar (Dig +28.3% and Slu +22.1% compared to the unfertilized control), while the effect of chemical fertilization was similar in the presence and absence of biochar (+17.3% and +18.1%, respectively).
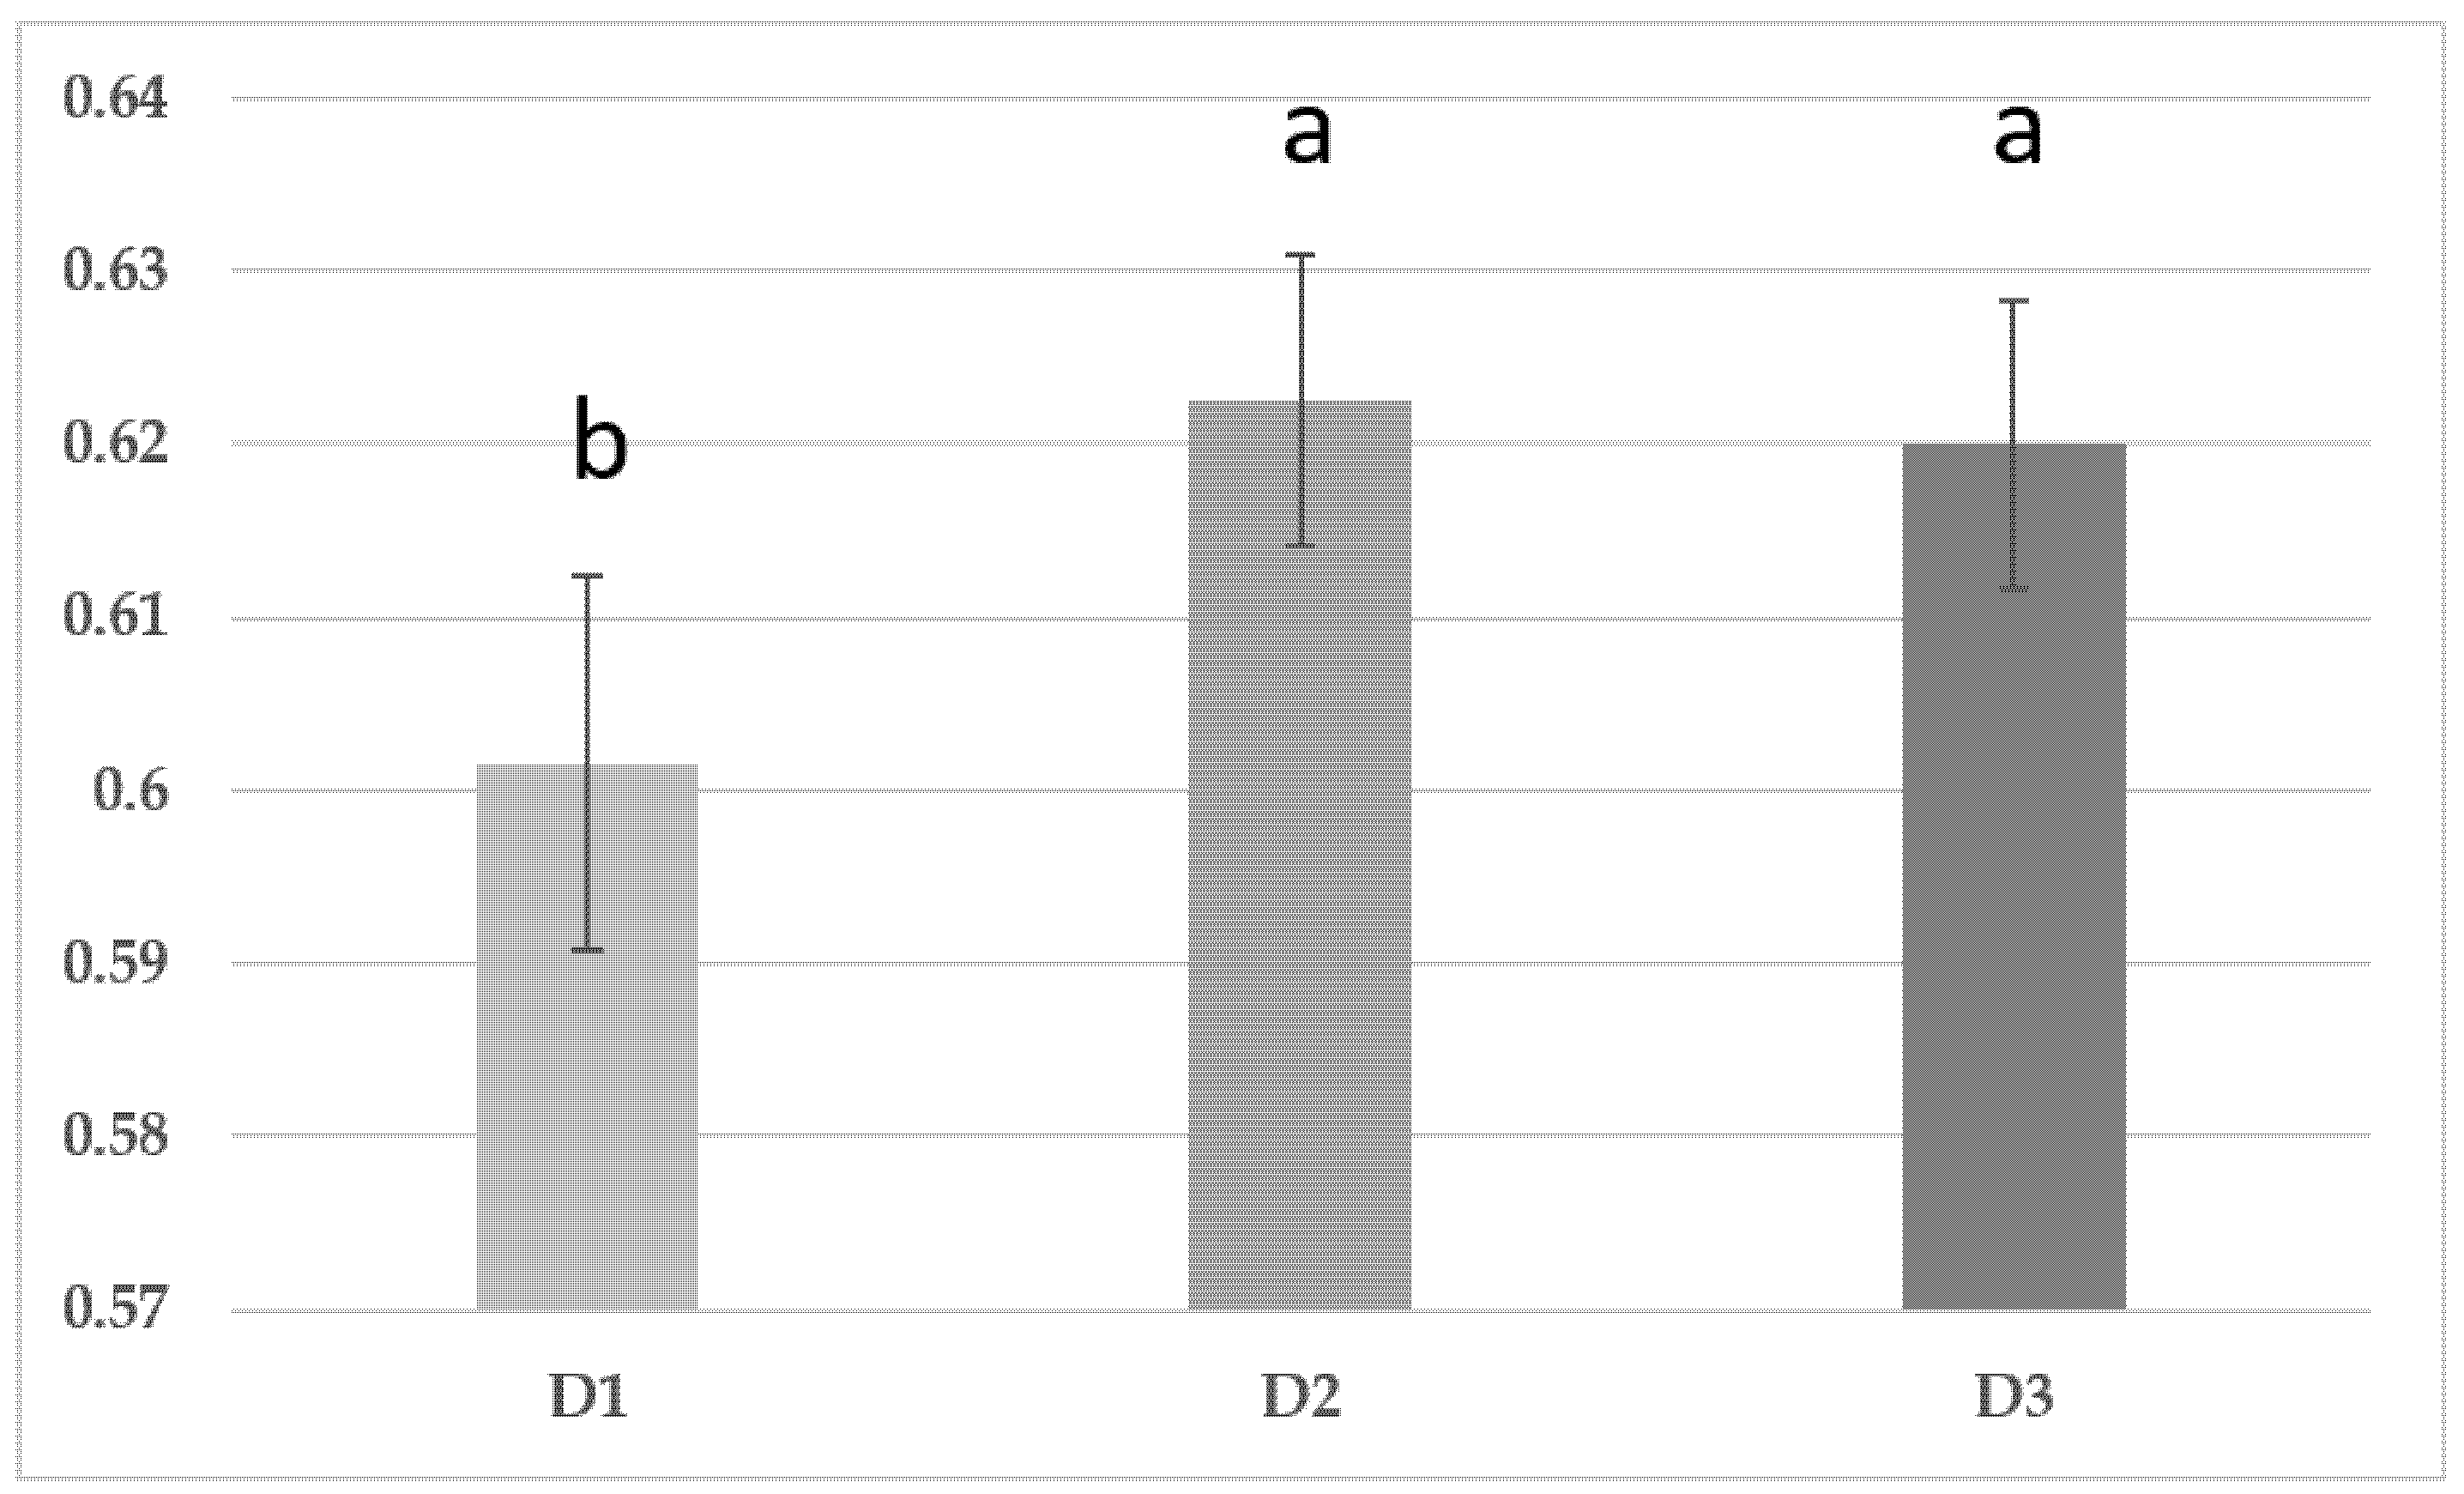
In 2019, the NDRE index, estimating canopy development and leaf chlorophyl content of the crop at 77 days after sowing (DAS) (i.e., the reproductive milk stage), showed a significant effect of fertilization (Figure 1A). In fact, the unfertilized treatment both with and without biochar showed lower NDRE values than the fertilized treatments. Interestingly, at the maize reproductive milk stage (77 DAS) 2019, the NDRE index also differentiated the D2 and D3 biochar doses, averaged over all fertilization treatments, from D1 (Figure 2). The relationship of the mean values of NDRE at 77 DAS and DMY at 98 DAS (Figure 1B) demonstrates the ability of the NDRE index to discriminate between high and low productivity areas at an early stage [31,32].

3.2. Italian Ryegrass (Lolium multiflorum) Yield

The Italian ryegrass crop was not fertilized in order to highlight possible residual nutrient availabilities present in the soil after maize cropping. In contrast to maize, the Italian ryegrass yield showed a significant decrease, −40.7%, in the second cycle (Table 5, Supplementary Figure S3); in fact, in the first year of the trial, residual fertility derived from the previous agronomic management of the field [15] was likely to be the cause of the absence of fertilization effects in silage maize production, and of the higher yield in Italian ryegrass.
In the second cycle (2019), the average N recovery efficiency (REN) of maize was 1.46, indicating that this crop removed more N from the soil than the amount supplied by fertilization (equivalent to 170 kg ha−1), thus determining nitrogen deficiency for the subsequent ryegrass crop. In both cycles, no significant differences in the ryegrass yield were highlighted by the different treatments applied to the silage maize. However, in 2020, BMin and BSlu significantly outyielded (+49 and +65%, respectively) the unfertilized biochar B group (linear contrasts) (Table 5).

3.3. Soil Fertility

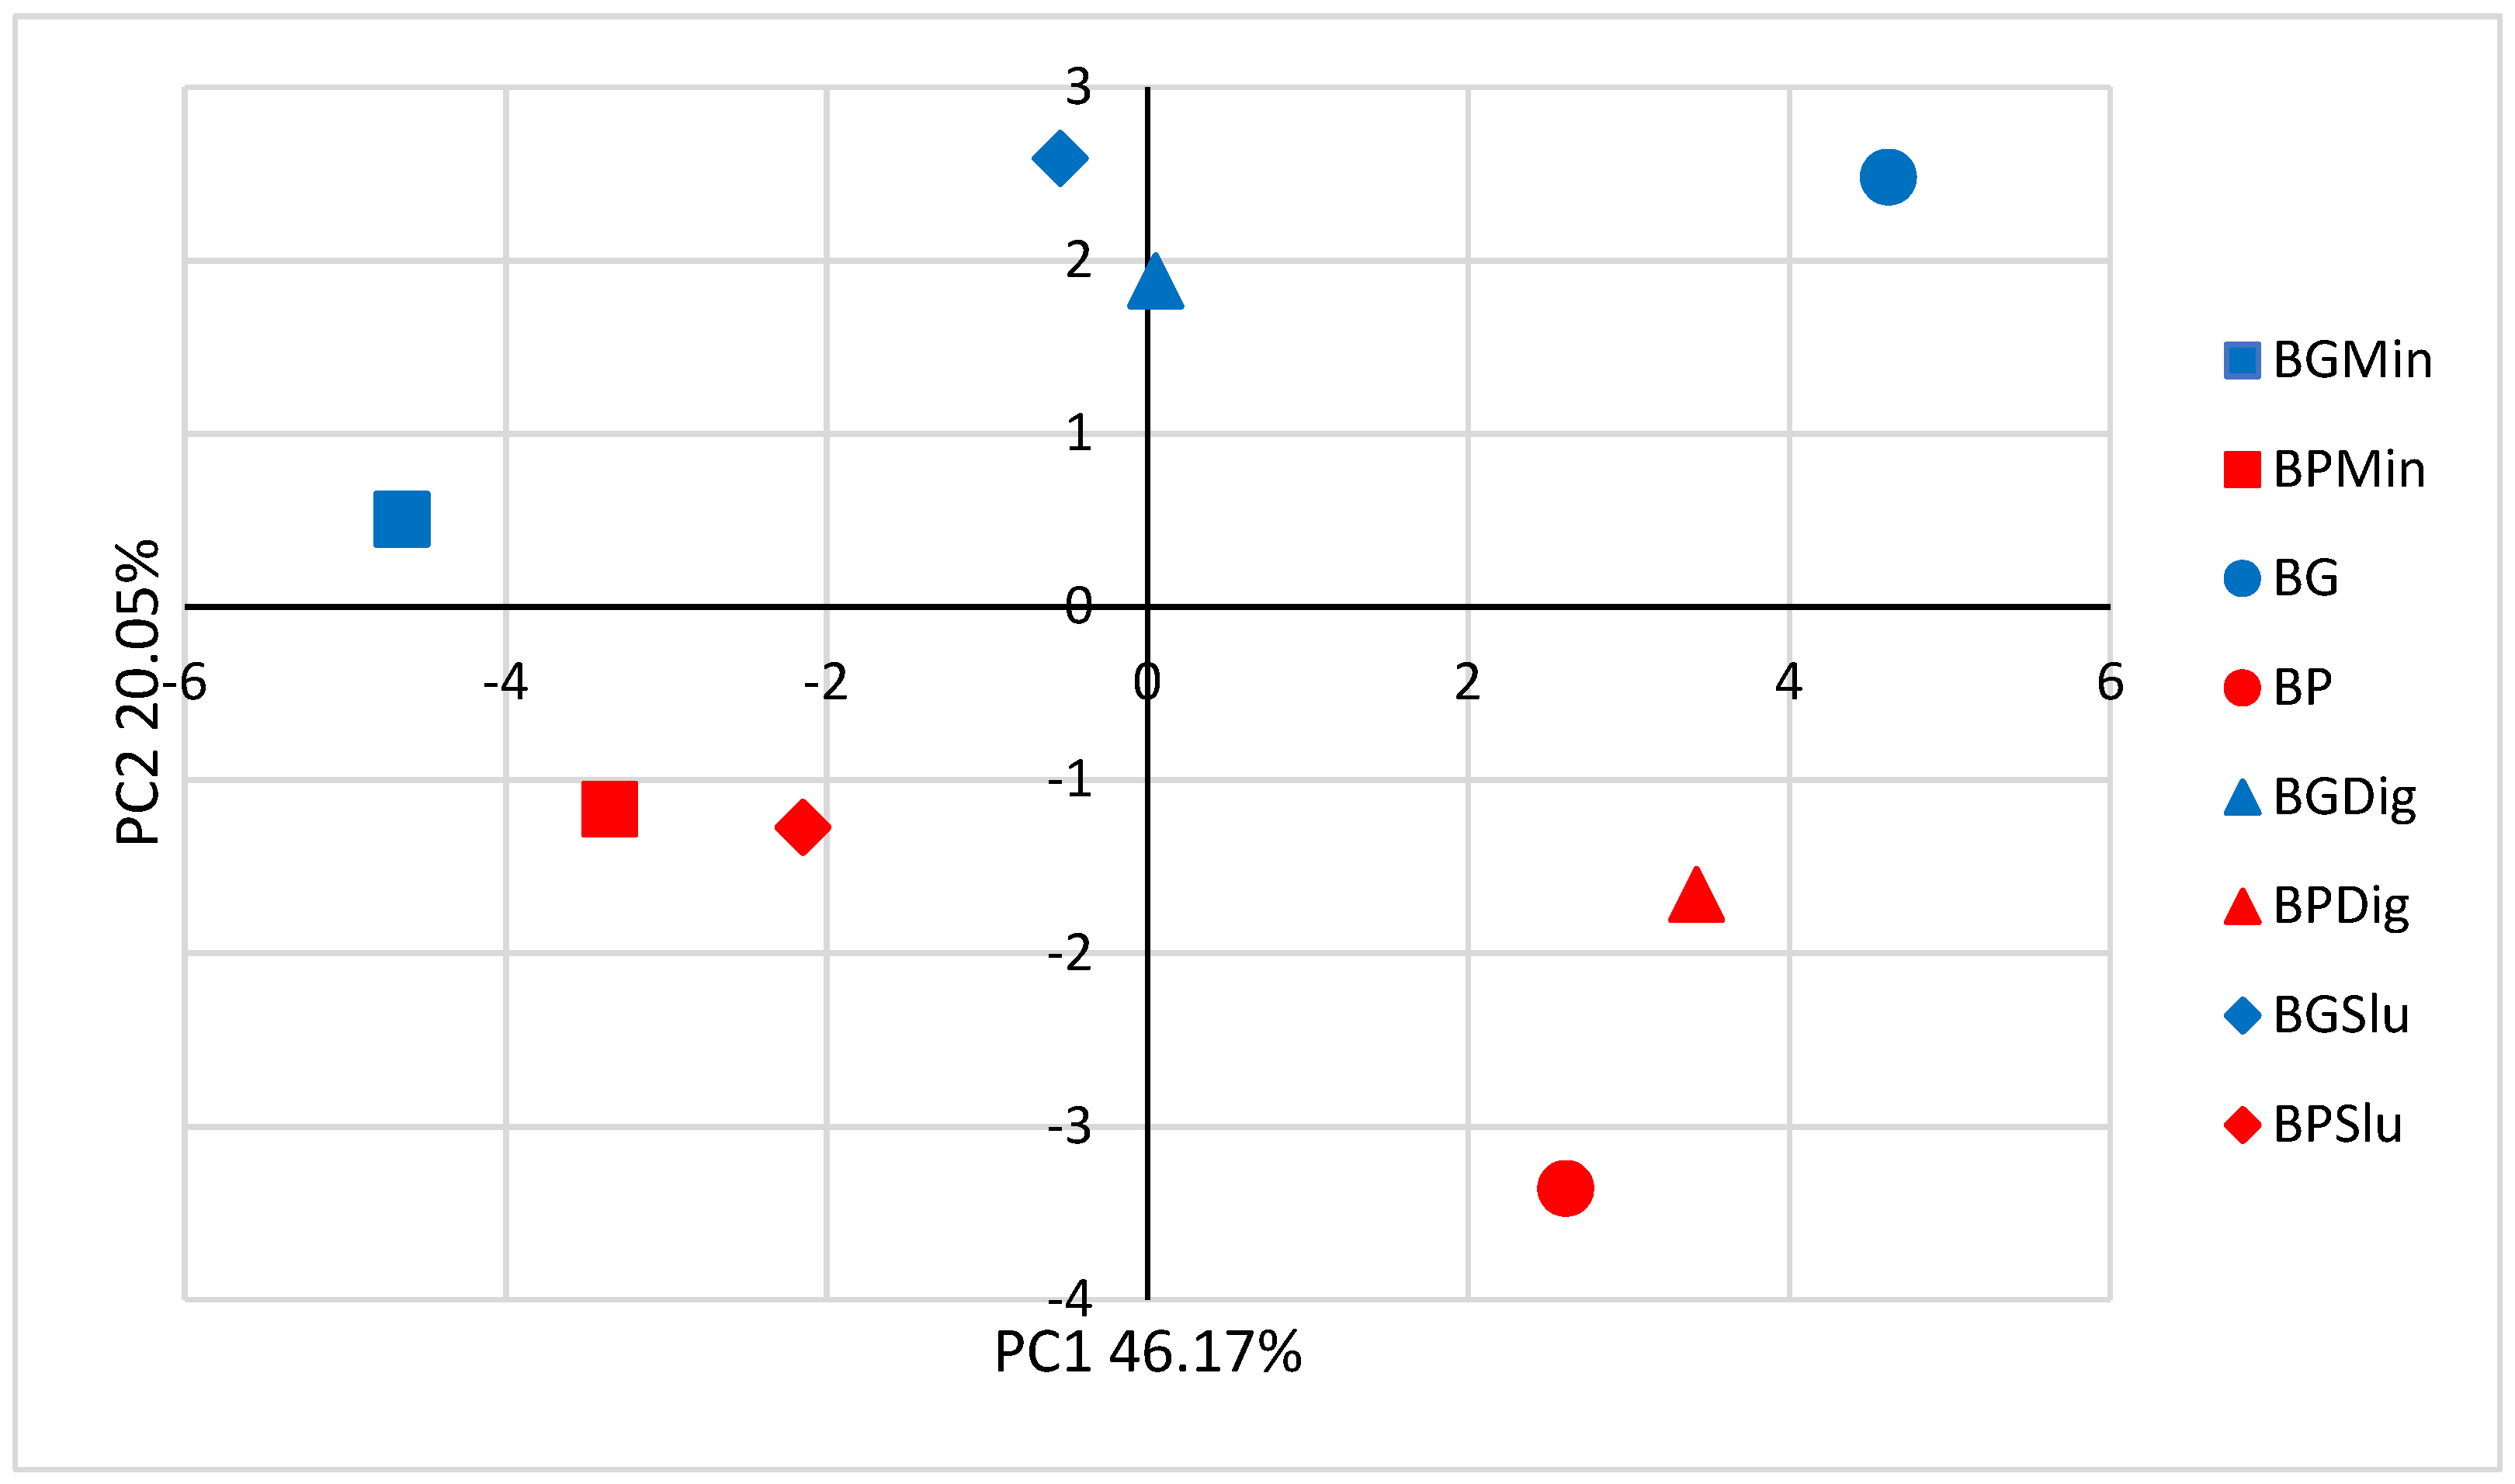
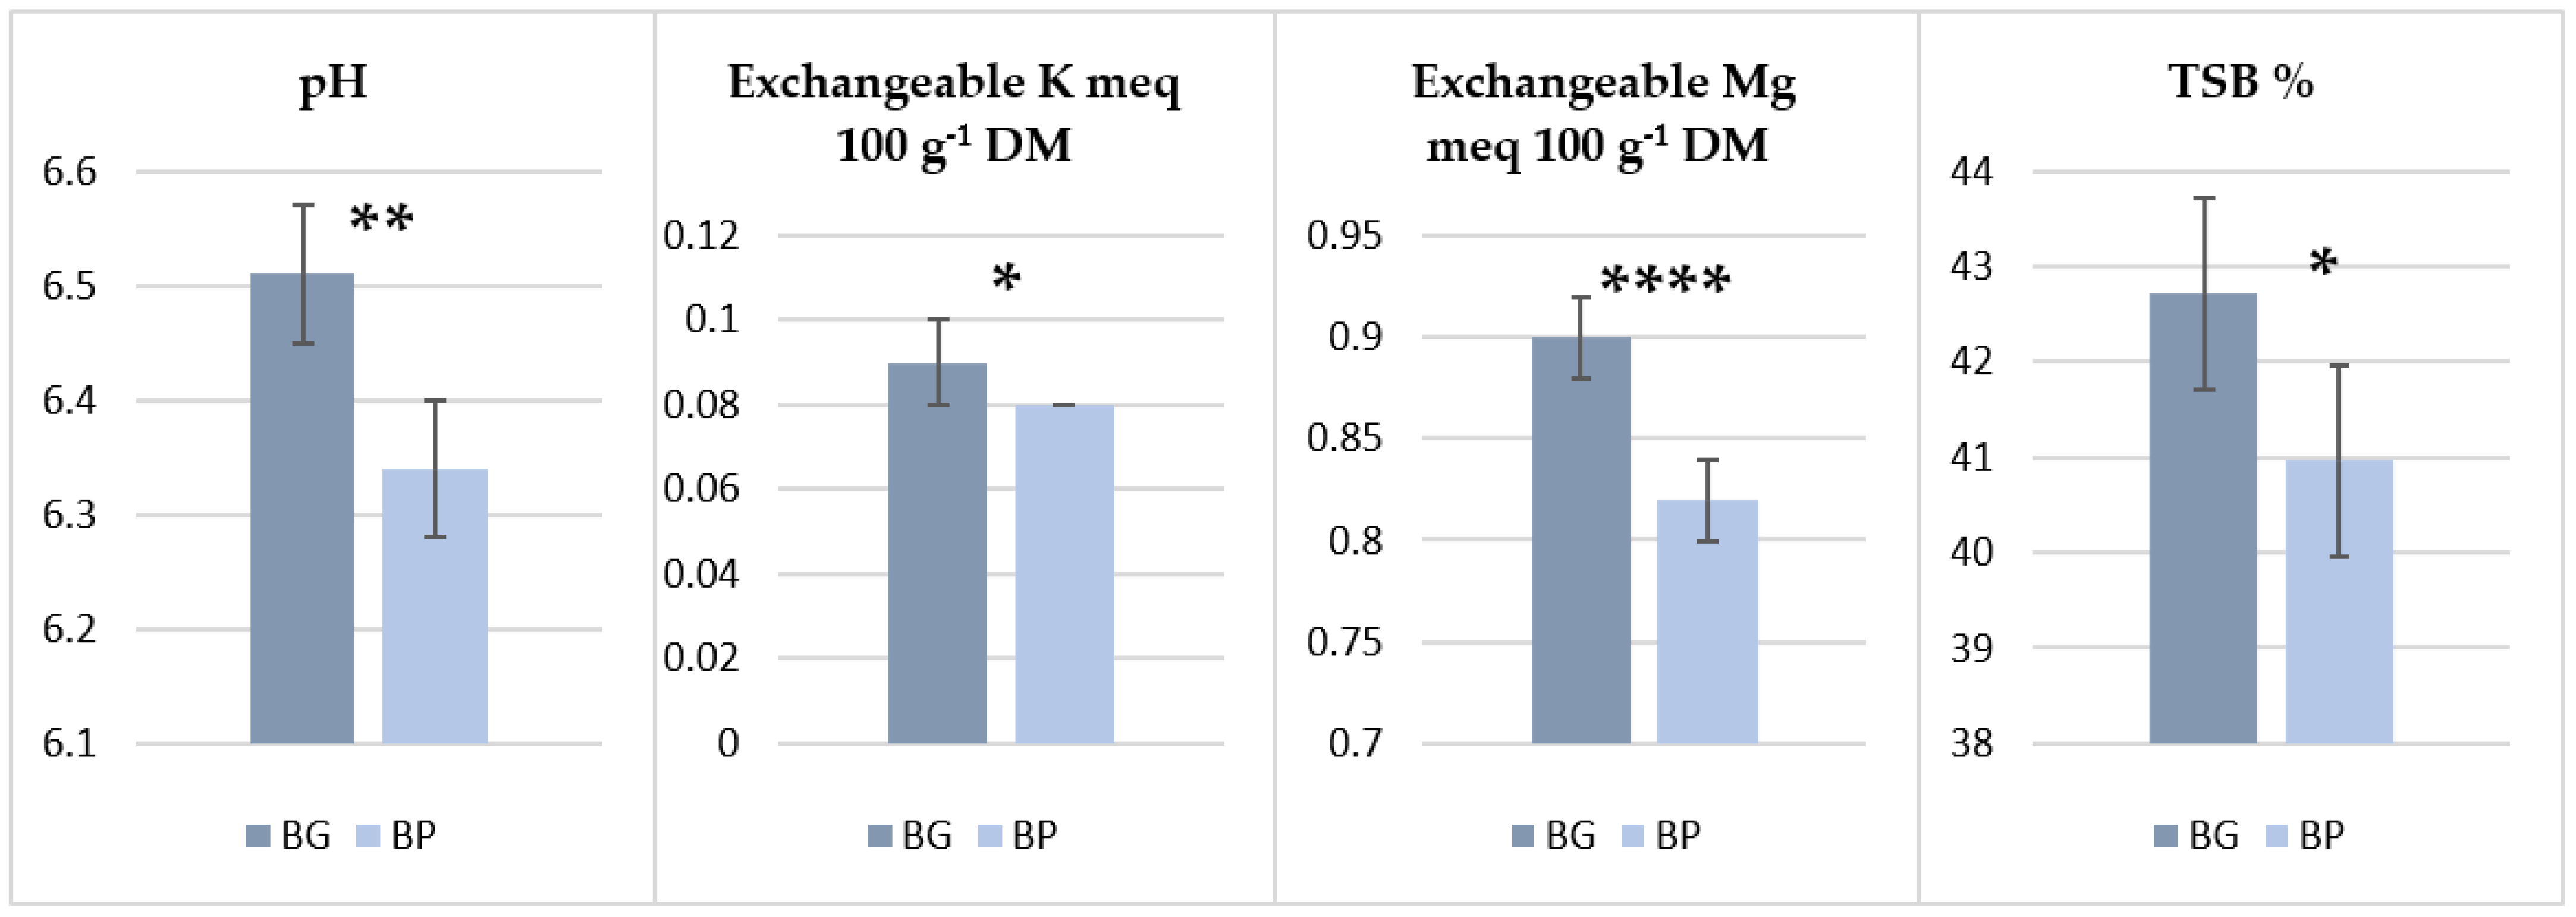
The main chemical differences between the biochar types used in the trial were found in the ash, total P2O5 and total K content (Table 2), BG having, respectively, three-, five- and fourfold higher values than BP. The soluble elements P, Mg, K and Na were also more abundant in BG, resulting in higher pH and electrical conductivity values (Table 2). After the harvest of silage maize in 2018, soil samples were taken from all the treatments of block 1 only. To assess the effect of biochar incorporation in the soil, a principal component analysis based on 24 parameters (see Section 2.3) was applied to the averages of treatment × biochar type. The first two principal components (PCs) represented 66% of the total variation of soil fertility parameters; PC2 clearly distinguished the two biochar types, BG showing positive and BP negative values consistently in all treatments (Figure 3). PC2 was mainly (r > 0.5) positively related to pH in water, exchangeable Na and Ca content, ESP and TSB (Supplementary Figure S4). After the silage maize harvest in 2019, soil samples were taken from both blocks, and all the 24 soil fertility parameters were subjected to ANOVA. A significant effect of biochar type was found for pH, exchangeable K and Mg content and TSB (Figure 4), BG showing higher average values than BP for all the parameters, although this was not always consistent across the different treatments. The difference found was consistent with the higher pH, electrical conductivity, content of ashes and soluble alkaline cations of BG compared to BP (Table 2).
Soil Corg and CEC increased significantly with the addition of biochar, particularly in association with mineral fertilization (+40.6 and +16.4%, respectively) and the digestate (+31.8% and 14.3%, respectively); in these last treatments, the C-to-N ratio was also significantly raised (Table 6). Interestingly, BMin and BDig also showed higher Corg (+16 and + 17.4%, respectively) and CEC (+7.5 and +8%, respectively) values than the treatment with biochar alone (B), indicating a synergic positive effect of biochar associated with these fertilization treatments on the fertility indicators (Table 6). As expected, significant effects of the biochar dose for the parameters Corg, CEC and C-to-N ratio were found (Figure 5); these parameters, averaged over the biochar doses, also showed a significant increase compared to T0.

3.4. Nitrous Oxide Emissions

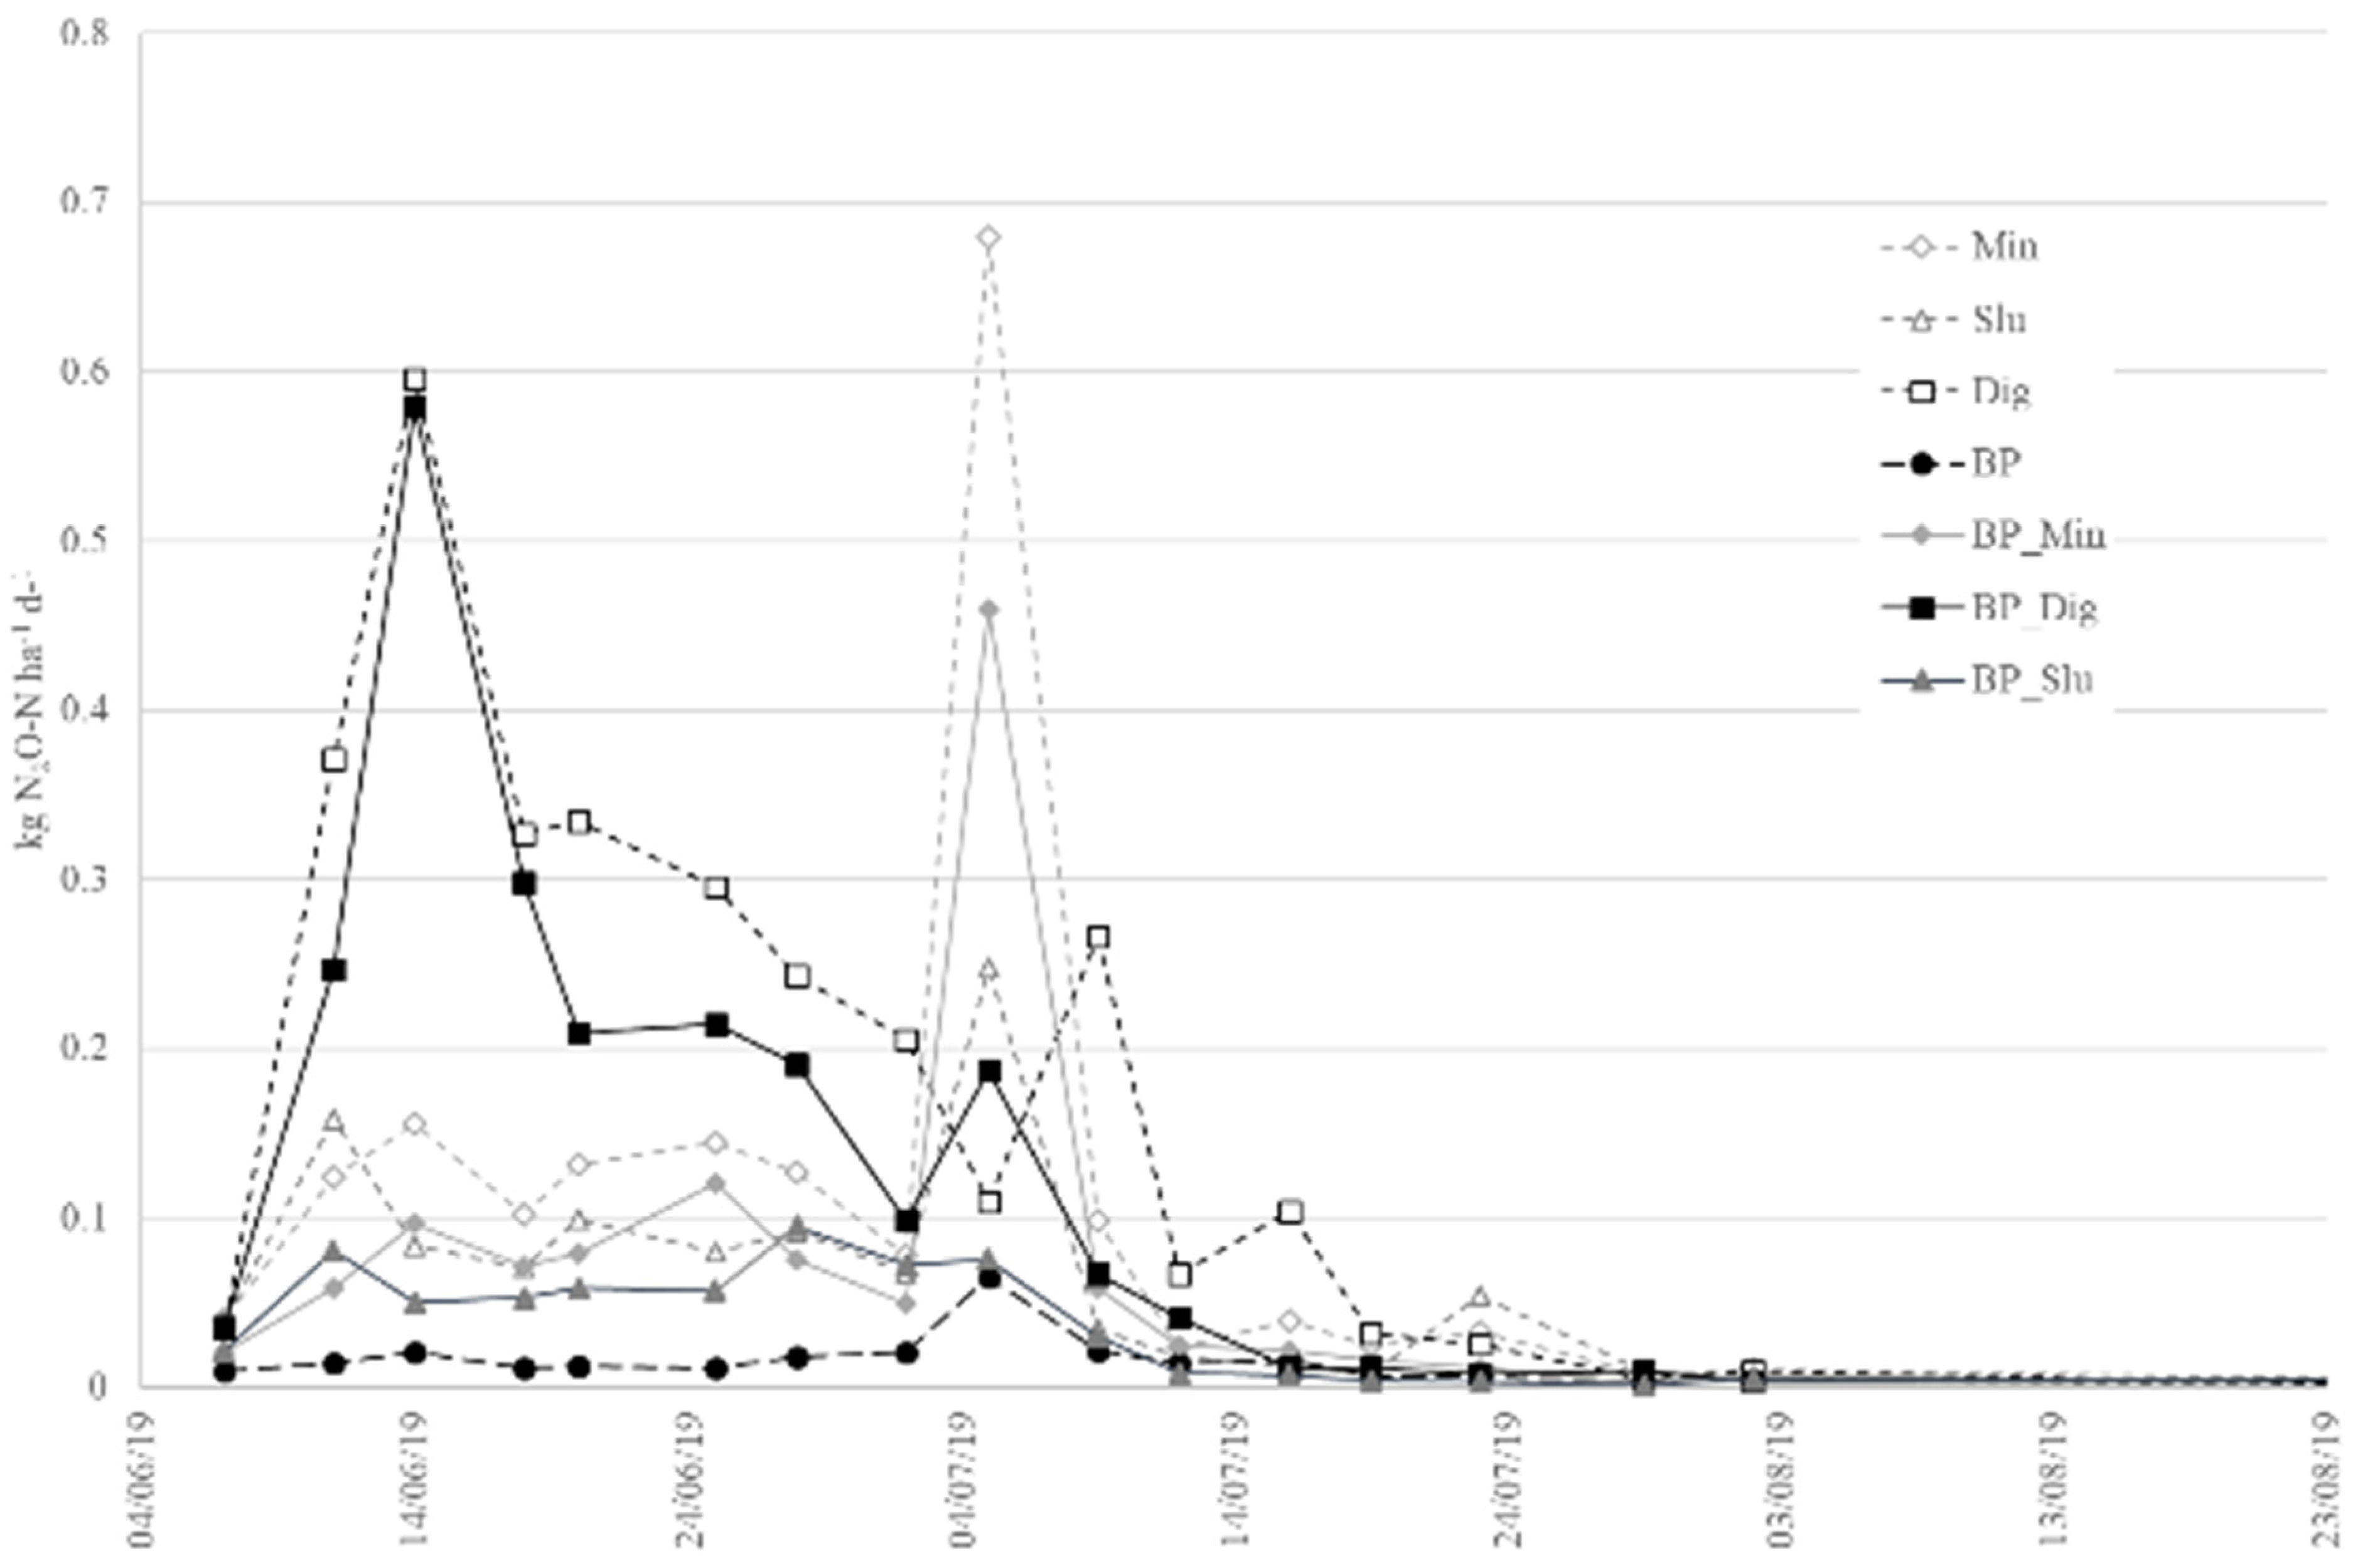
Seasonal variation of daily N2O emissions from maize-cropped soil is shown in Figure 6. The first significant peaks were observed after seeding, with higher intensity for treatments receiving digestate, either in combination or without biochar. Treatments Dig and BP_Dig showed the highest emissions and similar dynamics for the first month of cultivation, with BP_Dig having lower values than Dig. A second phase of significant peaks occurred after the topdressing fertilization event (24 June 2019), with the highest values produced by treatments receiving mineral fertilizers (with Min > BP_Min). Two minor emission periods were recorded around irrigation events in the second half of July. Soil receiving BP only had the lowest emissions throughout the whole maize cycle.
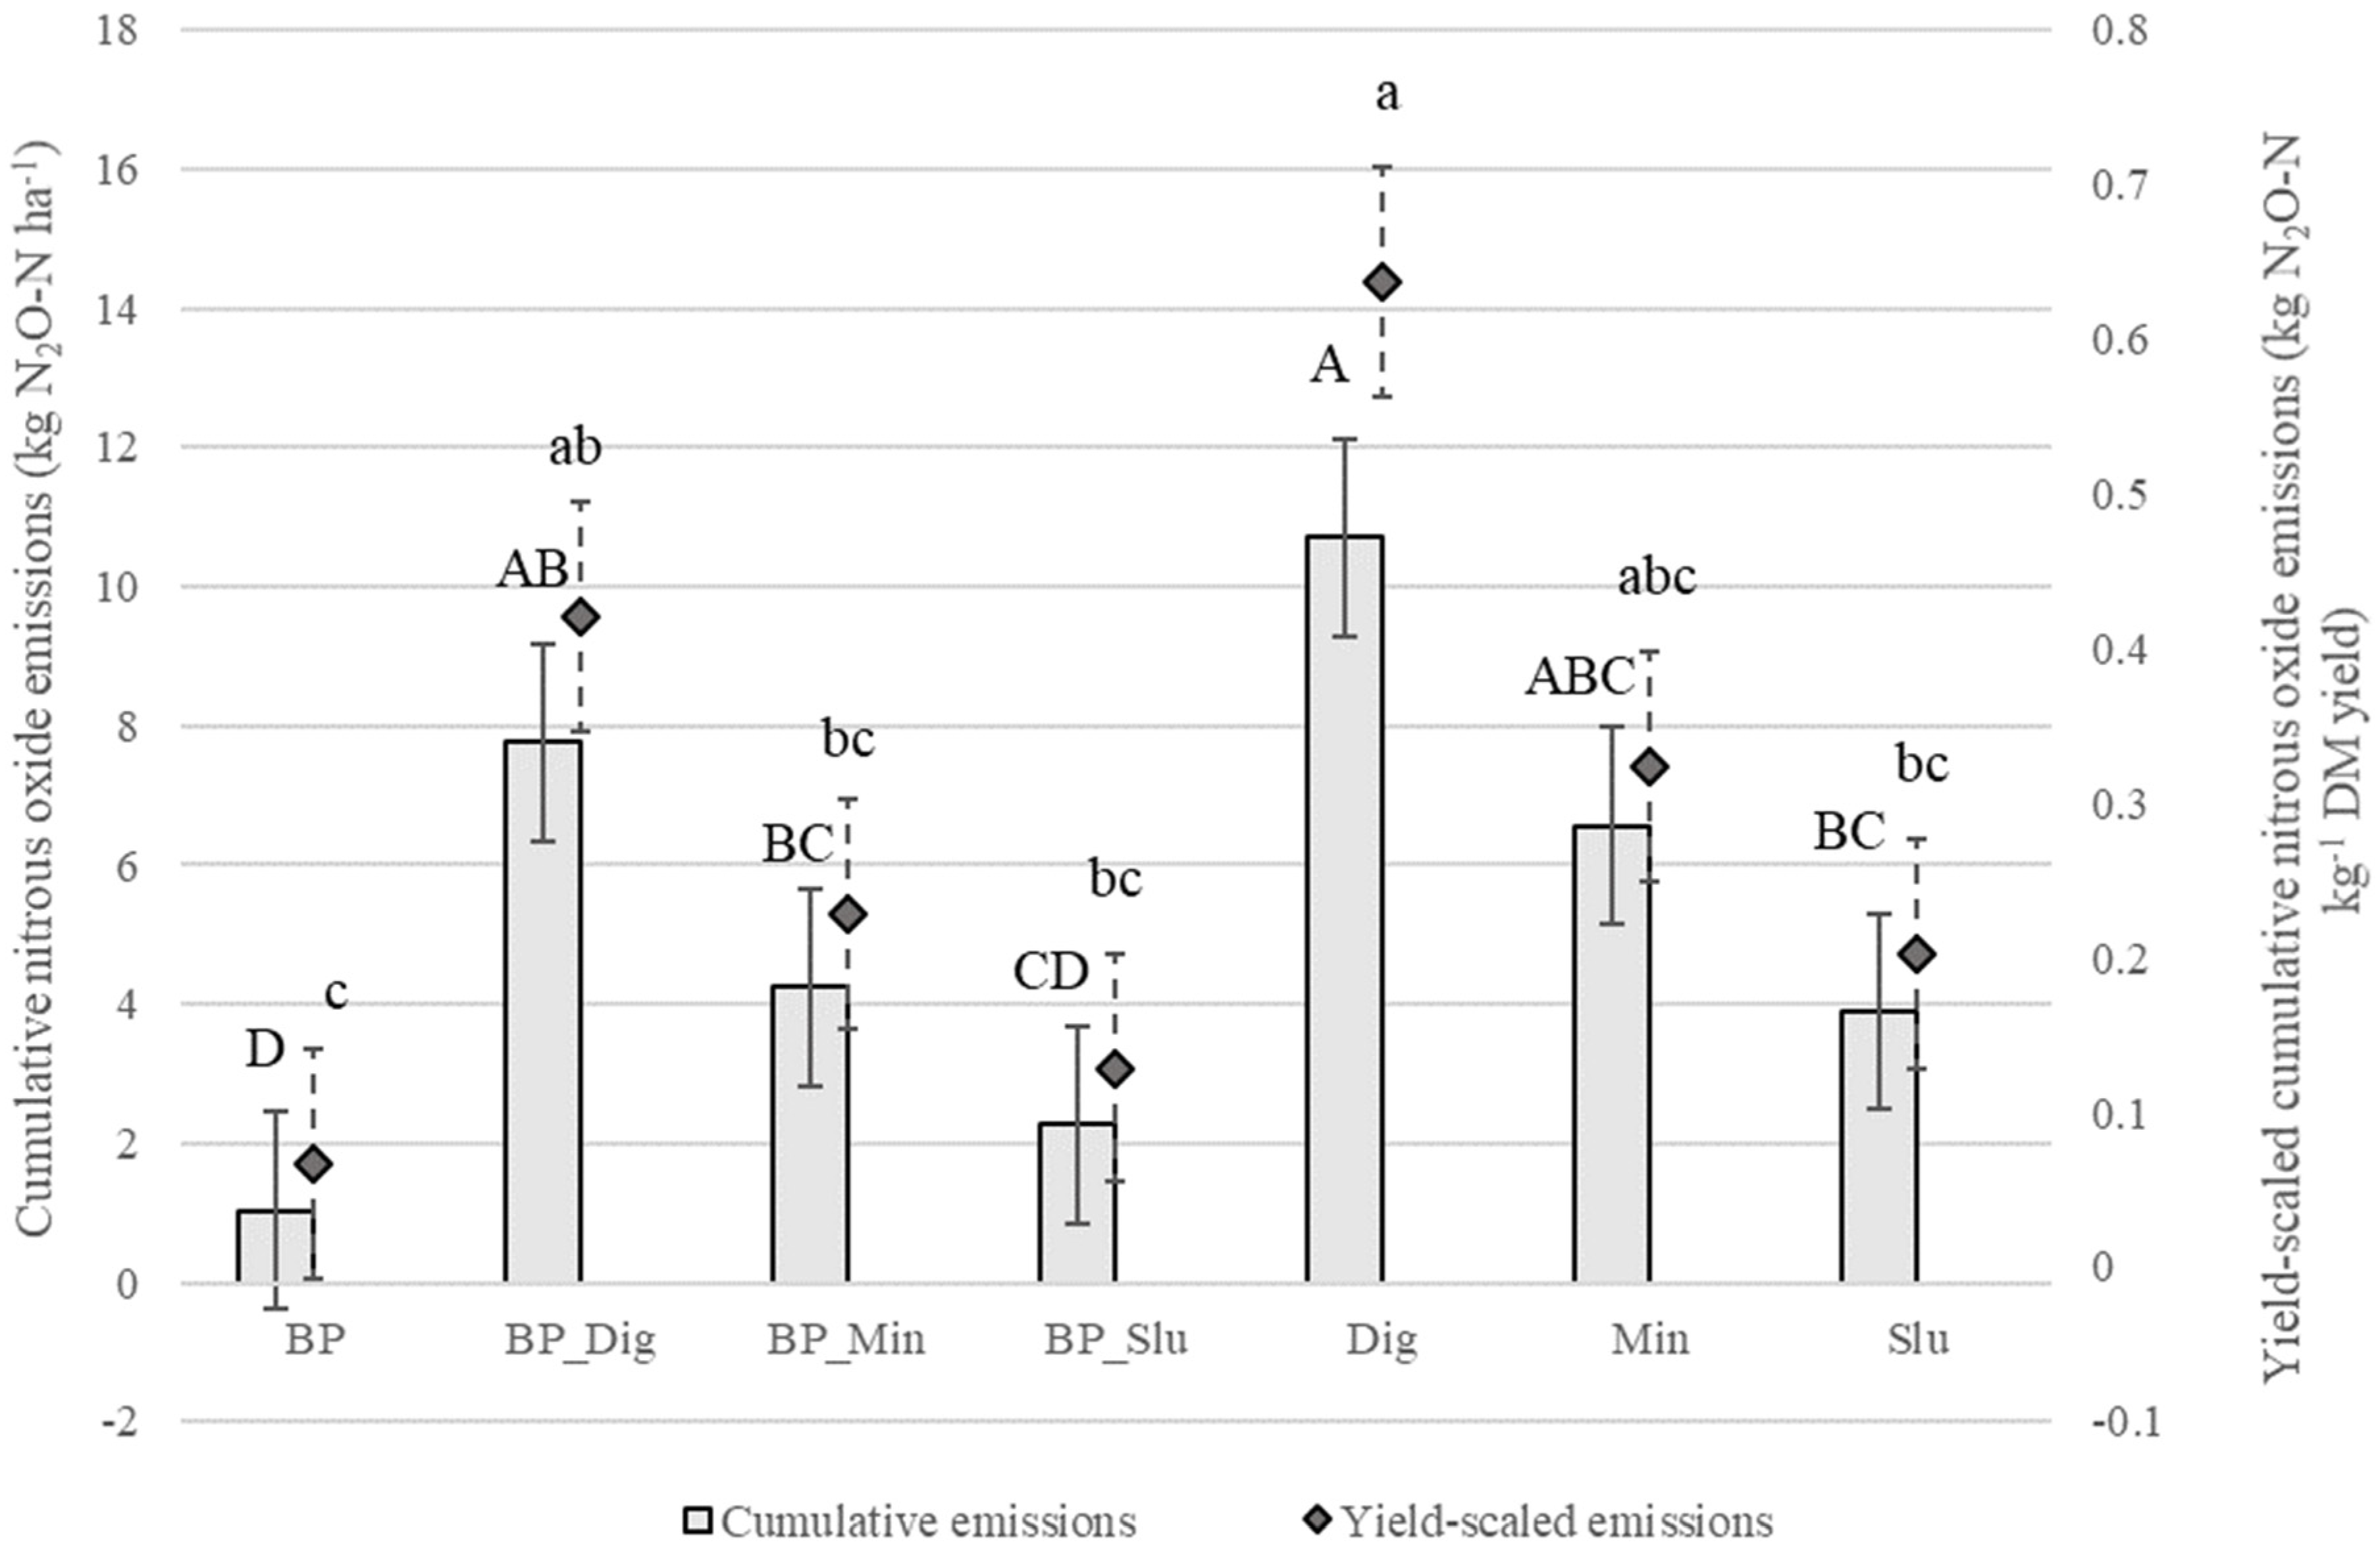
The emission values were subsequently combined into cumulative values, the results of which are reported in Figure 7, and both cumulative and yield-scaled N2O emissions were calculated for the whole maize cycle. When referring to both a specific area and yield, indicators revealed significant differences between treatments; in detail, the treatment with the highest emissions was Dig, which was significantly higher than Slu, followed by all the treatments receiving BP. The addition of biochar was not effective in determining statistically lower emissions when treated with digestate, even though there was a numerical tendency for mitigation. Slurry always produced lower emissions than digestate, with and without the addition of BP.
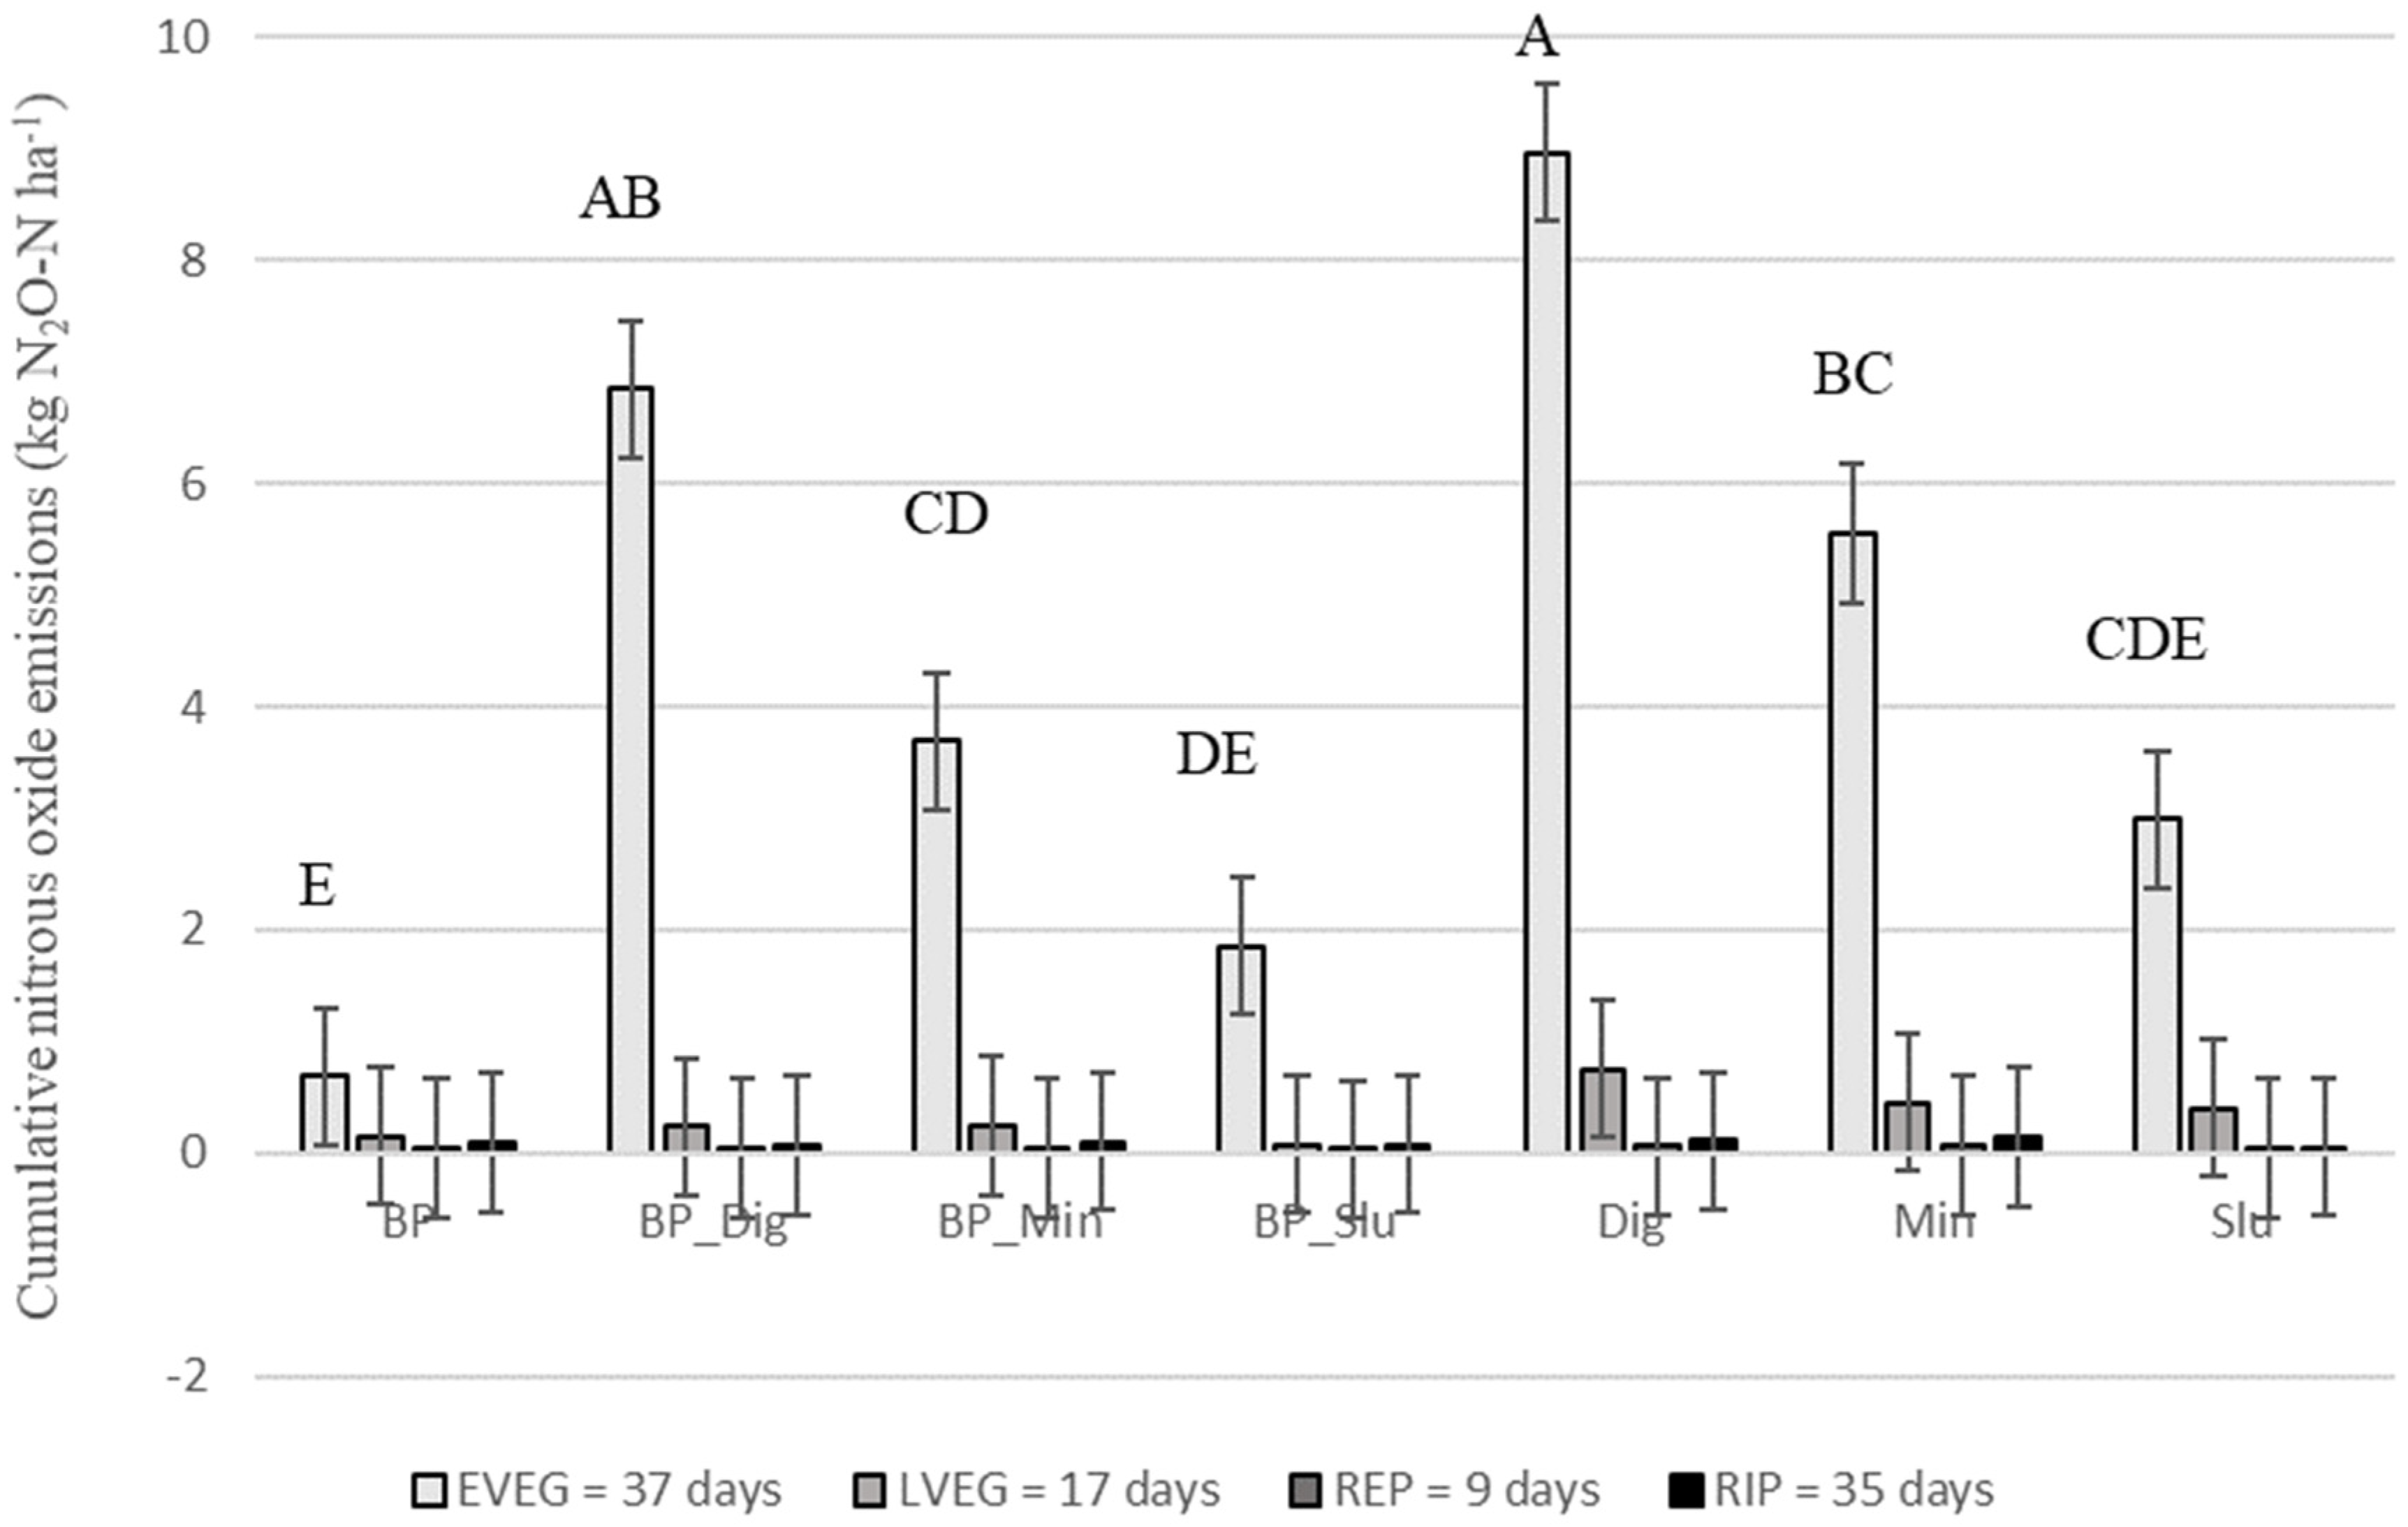
Cumulative emissions split into phenological stages (Figure 8) revealed that emissions mostly occurred during the early vegetative stage, producing the differences described for the whole cropping cycle, while from the late stem elongation phase onward, no statistically significant differences were observed.

4. Discussion

4.1. Effect of Biochar Introduction on Growth Dynamics and Yield of Maize and Italian Ryegrass

In the first year of the trial, residual fertility, which derived from long-term application of organic fertilizers to the experimental field [33], leveled the effect of fertilization treatments—equivalent to 170 kg ha−1 of plant-available N applied to maize—for both maize and Italian ryegrass. On the contrary, in the second year, the fertilization treatments increased silage maize yield, protein content and N uptake, both in the presence and absence of biochar (Table 3). Organic fertilization (digestate and slurry) had a higher effect on the presence of biochar than in its absence on plant growth rate (Table 4), and on silage yield in the case of digestate (Table 3). In contrast, the effect of mineral fertilization (urea) on crop development and yield was not influenced by the association with biochar, whereas crop N content was negatively affected (Table 3). In a greenhouse experiment with maize in pots, Kizito et al. [17] found a higher percent increase in above-ground biomass (AGB) for biochar associated with mineral NPK fertilizer compared to digestate-enriched biochar. One reason for this discrepancy with our results could be the short-term plant availability of the (NH4)2SO4 source present in the NPK fertilizer in comparison with urea. It is worth noting that only one third of urea underwent the same application procedures as those used for organic fertilizers, namely distribution immediately before sowing and incorporation into the soil by ploughing. The remaining two thirds, distributed by topdressing at the V4 growth stage, were translocated by rainfall/irrigation water into the biochar-amended soil layer, and subjected to ammonium transformation by the soil microbial ureases. The sorption capacity of biochar for NH4+, NO3 and PO43− through ion exchange mechanisms and/or interactions with oxygen-containing functional groups have been extensively studied [34,35,36]. It is therefore likely that biochar could have adsorbed a part of the ammonium resulting from the activity of the soil microbial ureases, thus limiting its availability to the maize crop. Such dynamics could account for the similar biomass, but lower N content and N uptake, in BMin- compared to Min-treated maize in 2019 (Table 3), and for the higher yield of the subsequent Italian ryegrass in the BMin group (Table 5). The sorption capacity of biochar could also account for the effects association with digestate: in fact, the digestate NH4–N share is considered the N source available for short-term uptake by crops compared to the organic N fraction [6,30]. Under agronomical and geographical conditions such as ours, Cavalli et al. [1] found similar values of NH4–N apparent recovery—i.e., the fraction of applied NH4–N available for crops in addition to that provided by an unfertilized control—in digestate and in the mineral fertilizer ammonium sulphate. The ratio of NH4–N/TN in the digestate used in the trial, varied from 0.40 in 2018—a value close to the 0.43 found for the undigested slurry—to 0.82 in 2019. It is likely that, in the initial vegetative growth phases, biochar sorption capacity can increase the availability of the NH4–N fraction of digestate to the plant, thus reducing N losses—via volatilization/emission and leaching—occurring in the digestate-treated maize because of the impairment between high plant-available N and low N demand of the plant. This hypothesis is consistent with the pattern of cumulative N2O emissions at different phenological stages, showing that emissions mostly occurred during the early vegetative stage (Figure 8).
Biochar application rates had no significant effect on the yield of either crop in the two years. Similar results—significant main effect of fertilizer type, i.e., mineral > digestate, and no significant effect of biochar at low (2 t ha−1) and high (40 t ha−1) rates—were reported by Greenberg et al. [18] in winter rye after silage maize in field conditions. On the contrary, Videgain-Marco et al. [19] found an additional effect of unfertilized biochar rates, from 0 to 3% wt, on total plant biomass, but not on grain, in a greenhouse experiment with sorghum in pots. In our field trial, the only effect of biochar application rates was displayed by NDRE index in 2019 at the reproductive milk stage (Figure 2), with D2 and D3 doses showing higher values than D1. This trend was driven mainly by the B treatment, unfertilized with biochar incorporation alone, and BMin. Post-silking maize N uptake accounts for about one third of the total crop N uptake; under N stress conditions in the vegetative phase, maize plants were found to partition most of the post-silking N to grain rather than to stalk [37]. Therefore, D2 and D3 doses would provide the crop a higher N available supply than D1, particularly in the N stress condition of the B treatment, resulting in a lower senescence rate of leaves and higher stalk stay-green. In the absence of fertilization, plant-available N depends mainly on the organic matter mineralization activity of the soil microflora. According to Quilliam et al. [38], changes in soil physicochemical properties and the release of metabolically available labile compounds into the soil surrounding the biochar (the ‘charosphere’) are, in the short-term biochar amendment, the main effects influencing soil microbial activity and structure, and ultimately, soil–plant–microbe interactions. It is worth noting that in the B treatment, higher NDRE values and DM yield were found in BG, richer in soluble elements (Table 2), than in BP-treated groups.

4.2. Effect of Biochar Incorporation on Soil Fertility Parameters

The application of BG biochar resulted in modified soil parameters compared to BP, persistent over two maize cropping seasons (Figure 3 and Figure 4). The enhanced soil CEC resulting from the biochar incorporation (Table 6) is likely to be responsible for the increased retention of the alkali/alkaline cations and the P anions present in BG. Soil pH significantly differed between the biochar type (Figure 3), but not among the biochar application rates. In an incubation experiment with an acidic soil, biochar was reported to increase soil pH by 0.34 to 1.51 units by amendment rates 0%, 2.5%, 5%, 7.5%, and 10% soil weight [39], that is, with rates more than tenfold greater than in our trial.
The biochar incorporation significantly increased soil organic C by 31%, averaged over the three fertilization treatments, and the application rates compared to the corresponding treatments without biochar. Both the significant effect of biochar, alone and associated to the fertilization treatments, compared to the corresponding treatments without biochar (Table 6), and the significant effect of the biochar dose (Figure 5), indicate that part of the increased Corg found in the biochar-treated groups originated from the biochar itself. However, the association of biochar with mineral fertilization (BMin) and digestate (BDig) showed a significantly higher Corg content than the biochar alone (B) (Table 6). This indicates that the combined effects of biochar, fertilizers and soil-native Corg are complex, and that altered Corg mineralization (priming effect) due to biochar incorporation must be taken into account. Plaza et al. [40], in an eight-month experiment using biochar alone and associated with organic fertilizers in a winter barley crop, found that only in the biochar-treated soil alone did the organic fertilizers significantly increase Corg in the fine-sized mineral-associated soil fraction compared to the respective controls without biochar. They suggest that biochar stimulates the microbial transformation of the more labile organic fractions present in organic fertilizers, and the sorption of the microbial by-products on soil mineral surfaces. After maize harvesting in 2019, BMin and BDig showed a soil C labile content (% of Corg DM) of 57.48 and 59.02, respectively, compared to 70.92 of BSlu and 70.19% of B treatments (significance of the ‘Treatment’ source of variation p = 0.06%). This suggests that, in BMin and BDig, a greater part of the labile C from fertilizers could have been used by soil microflora and sequestered by sorption onto soil mineral surfaces. The distribution of biochar Corg, mainly in the free soil organic matter (SOM) macroaggregates, while its proportion decreased with decreasing soil particle size, where instead, there is an increase in native SOM or OM supplied by organic fertilizers, is assessed by a number of authors [40,41,42]. In the hypothesis of a similar distribution of the Corg increase found in the BMin and BDig treatments, it will be interesting to monitor the long-term fate of this C stock in the following years of the trial.

4.3. Effect of Biochar Introduction on N2O Emissions from Maize

Generally, biochar addition results in the mitigation of N2O from soils, although there are exceptions, mainly depending on type of feedstock and operative conditions of pyrolysis [43,44]. In this study, direct N2O emissions from soils were evaluated in the second cropping season after biochar application, observing only one maize cropping cycle. These limited operative conditions, together with high spatial variability typically linked with N2O emissions from agricultural soils [45], prevented the observation of statistically significant effects of biochar addition. In fact, statistically, the major effect was that of fertilization, since, as seen, cumulative emissions were significantly higher for digestate than for slurry, irrespective of the addition of biochar, with mineral fertilization always in an intermediate situation. Although not statistically based, worthy of mention is the effect of biochar, whose addition to the soil led to a numerical decline of N2O emissions. The prevalence of the effect of the fertilizer on N2O emissions compared to that of the biochar can be attributed to the timing of the supply of the products, which took place in spring 2018 for biochar and spring 2018 and 2019 for fertilizers. It is also possible, however, to hypothesize other reasons, mainly linked to the supply of N mineral forms (through all tested fertilizers) and labile C forms (mainly associated to animal manure, and, in particular, to digestate), which are known to boost N2O emissions in the short-term [46]. On the contrary, expected effects of biochar for N2O mitigation are often associated with improved soil aeration due to an increase in porosity, and to a shift of concentration of mineral N forms in soil [47], which could need more application in time to fully manifest the mitigation potential of biochar [48,49].

5. Conclusions

In the first two years following biochar incorporation into the sandy loam soil of our experimental field, some indications of its effects have been highlighted: (a) the increased soil cation exchange capacity (CEC), mainly due to biochar Corg; this enhanced CEC is likely to lie at the basis of a greater retention of nutrients, both native and supplied, by fertilizers, modifying the dynamics of their availability, for maize and ryegrass crop growth. (b) The fertilization efficiency of digestate was improved in the biochar-treated groups, albeit not significantly, both on maize yield and quality; this effect could be, in part, ascribed to retention of the NH4–N fraction of digestate better matching the crop N demand, especially in the early vegetative stage. (c) Cumulative N2O emissions were significantly higher for digestate than for slurry, both in the presence and absence of biochar, with mineral fertilization in an intermediate position. The early vegetative stage in maize was mainly responsible for these differences. These results indicate that the impairment between soil content of N forms available to the crop and the crop’s actual needs is likely to be a major factor responsible for N2O emissions in agricultural soils.

Supplementary Materials

The following supporting information can be downloaded at: https://www.mdpi.com/article/10.3390/agriculture12070925/s1. Figure S1. Temperatures (average, max and min values in °C), rainfall (mm) and irrigation interventions (mm) in the growing seasons 2018–2020. Figure S2. Silage maize yield in the two years 2018 and 2019 for each agronomical treatment: mean values and SE. The biochar-treated groups are indicated for the two biochar types (BG and BP) and the three biochar application rates (D1, D2 and D3). Full column: year 2018; crossed column: year 2019. Figure S3. Italian ryegrass yield in the two productive cycles 2018–2019 and 2019–2020; mean values and SE. The crop was not fertilized; the treatments applied to the previous silage maize culture are indicated. Full column: year 2018; crossed column: year 2019. Figure S4. Soil fertility parameters 2018: eigenvector of PC1 (A) and PC2 (B) of the principal component analysis. Table S1. Chemical analyses of the digestate and slurry used in 2018 and 2019.

Author Contributions

Conceptualization, L.B., M.V., G.C., C.S. and A.T.; data curation, G.C.; formal analysis, C.S. and C.B.; funding acquisition, A.T., M.V. and C.S.; investigation, L.B., M.V., C.S. and A.T.; methodology, L.B., M.V., G.C. and C.S.; project administration, A.T. and C.S.; resources, L.B., M.V., C.S. and A.T.; supervision, A.T. and C.S.; validation, L.B., M.V., G.C. and C.S.; visualization, L.B., G.C. and A.T.; writing-original draft, C.S. and C.B.; writing—review & editing, A.T., L.B., M.V. and G.C. All authors have read and agreed to the published version of the manuscript.

Funding

This research activity has been funded by Regione Lombardia with PSR 2014–2020, Operazione 1.2.01 of FEASR (Fondo europeo per l’agricoltura e lo sviluppo rurale), Projects INFOCHAR (2018–2019) and N-CONTROL (2020–2022), and with POR FESR 2014–2020, Azione I.1.b.1.3, Project AGRI HUB (2020–2022).

Institutional Review Board Statement

Not applicable.

Data Availability Statement

The data presented in this study are available on request from the corresponding author.

Acknowledgments

Technical support from Angelo Passerini and Paolo Broglia (experimental field management) is gratefully acknowledged. We would like to thank Daniele Cavalli from CREA-ZA for his valuable advice and suggestions for the result and discussion sections.

Conflicts of Interest

The authors declare no conflict of interest.

References

  1. Cavalli, D.; Cabassi, G.; Borrelli, L.; Geromel, G.; Bechini, L.; Degano, L.; Marino Gallina, P. Nitrogen fertilizer replacement of undigested liquid cattle manure and digestates. Eur. J. Agron. 2016, 73, 34–41. [Google Scholar] [CrossRef]
  2. Tabacco, E.; Comino, L.; Borreani, G. Production efficiency, costs and environmental impacts of conventional and dynamic forage systems for dairy farms in Italy. Eur. J. Agron. 2018, 99, 1–12. [Google Scholar] [CrossRef]
  3. Bertora, C.; Zavattaro, L.; Sacco, D.; Monaco, S.; Grignani, C. Soil organic matter dynamics and losses in manure maized-based forage systems. Eur. J. Agron. 2009, 30, 77–186. [Google Scholar] [CrossRef]
  4. Tomasoni, C.; Borrelli, L.; Ceotto, E. Effect of integrated forage rotation and manure management on yield, nutrient balance and soil organic matter. Ital. J. Agron. 2011, 6, e10. [Google Scholar] [CrossRef]
  5. Herrmann, A.; Kage, H.; Taube, F.; Sieling, K. Effect of biogas digestate, animal manure and mineral fertilizer application on nitrogen flows in biogas feedstock production. Eur. J. Agron. 2017, 91, 36–73. [Google Scholar] [CrossRef]
  6. Reuland, G.; Sigurnjak, I.; Dekker, H.; Michels, E.; Meers, E. The potential of digestate and the liquid fraction of digestate as chemical fertilizer substitutes under the RENURE criteria. Agronomy 2021, 11, 1374. [Google Scholar] [CrossRef]
  7. Lehman, J. Bio-energy in the black. Front. Ecol. Environ. 2007, 5, 381–387. [Google Scholar] [CrossRef] [Green Version]
  8. Paustian, K.; Lehmann, J.; Ogle, S.; Reay, D.; Robertson, G.P.; Pete Smith, P. Climate-smart soils. Nature 2016, 532, 49–57. [Google Scholar] [CrossRef] [Green Version]
  9. Minasny, B.; Malone, B.P.; McBratney, A.B.; Angers, D.A.; Arrouays, D.; Chambers, A.; Chaplot, V.; Chen, Z.S.; Cheng, K.; Das, B.S.; et al. Soil carbon 4 per mille. Geoderma 2017, 292, 59–86. [Google Scholar] [CrossRef]
  10. Purakayastha, T.J.; Bera, T.; Bhaduri, D.; Sarkar, B.; Mandal, S.; Wade, P.; Kumari, S.; Biswas, S.; Menon, M.; Pathak, H.; et al. A review on biochar modulated soil condition improvements and nutrient dynamics concerning crop yields: Pathways to climate change mitigation and global food security. Chemosphere 2019, 227, 345–365. [Google Scholar] [CrossRef]
  11. Martinsen, V.; Mulder, J.; Shitumbanuma, V.; Sparrevik, M.; Børresen, T.; Cornelissen, G. Farmer-led maize biochar trials: Effect on crop yield and soil nutrients under conservation farming. J. Plant Nutr. Soil Sci. 2014, 177, 681–695. [Google Scholar] [CrossRef]
  12. Pandit, N.R.; Mulder, J.; Hale, S.E.; Martinsen, V.; Schimdt, H.P.; Cornelissen, G. Biochar improves maize growth by alleviation of nutrient stress in a moderately acidic low-input Nepalese soil. Sci. Total Environ. 2018, 625, 1380–1389. [Google Scholar] [CrossRef] [PubMed]
  13. Aghajani, S.D.; Alavifazel, M.; Nurmohammadi, G.; Ardakani, M.R.; Sarajughi, M. Soil respiration, root traits and dry matter yield of sorghum (Sorghum bicolor L.) as affected by biochar application under different cropping patterns and irrigation method. Int. Agrophys. 2020, 34, 495–502. [Google Scholar] [CrossRef]
  14. Haider, F.U.; Virk, A.L.; Rehmani, M.I.A.; Skalicky, M.; Ata-ul-Karim, S.T.; Ahmad, N.; Soufan, W.; Brestic, M.; Sabagh, A.E.L.; Liqun, C. Integrated Application of Thiourea and Biochar Improves Maize Growth, Antioxidant Activity and Reduces Cadmium Bioavailability in Cadmium-Contaminated Soil. Front. Plant Sci. 2022, 12, 809322. [Google Scholar] [CrossRef] [PubMed]
  15. Butnan, S.; Deenik, J.L.; Toomsan, B.; Antal, M.J.; Vityakon, P. Biochar characteristics and application rates affecting corn growth and properties of soils contrasting in texture and mineralogy. Geoderma 2015, 237–238, 105–116. [Google Scholar] [CrossRef]
  16. De Sousa Lima, J.R.; de Moraes Silva, W.; de Medeiros, E.V.; Duda, G.P.; Corrêa, M.M.; Martins Filho, A.P.; Clermont-Dauphin, C.; Antonino, A.C.; Hammecker, C. Effect of biochar on physicochemical properties of a sandy soil and maize growth in a greenhouse experiment. Geoderma 2018, 319, 14–23. [Google Scholar] [CrossRef]
  17. Kizito, S.; Luo, H.; Lu, J.; Bah, H.; Dong, R.; Wu, S. Role of Nutrient-Enriched Biochar as a Soil Amendment during Maize Growth: Exploring Practical Alternatives to Recycle Agricultural Residuals and to Reduce Chemical Fertilizer Demand. Sustainability 2019, 11, 3211. [Google Scholar] [CrossRef] [Green Version]
  18. Greenberg, I.; Kaiser, M.; Gunina, A.; Ledesma, P.; Polifka, S.; Wiedner, K.; Mueller, C.W.; Glaser, B.; Ludwig, B. Substitution of mineral fertilizers with biogas digestate plus biochar increases physically stabilized soil carbon but not crop biomass in a field trial. Sci. Total Environ. 2019, 680, 181–189. [Google Scholar] [CrossRef]
  19. Videgain-Marco, M.; Marco-Montori, P.; Martí-Dalmau, C.; Jaizme-Vega, M.C.; Manyà-Cervelló, J.J.; García-Ramos, F.J. Effects of Biochar Application in a Sorghum Crop under Greenhouse Conditions: Growth Parameters and Physicochemical Fertility. Agronomy 2020, 10, 104. [Google Scholar] [CrossRef] [Green Version]
  20. Velthof, G.L.; Rietra, R.P.J.J. Nitrous Oxide Emission from Agricultural Soils; Report 2921; Wageningen Environmental Research: Wageningen, The Netherlands, 2018; ISSN 1566-7197. [Google Scholar]
  21. Shcherbak, I.; Millar, N.; Robertson, G.P. Global metaanalysis of the nonlinear response of soil nitrous oxide (NO2) emissions to fertilizer nitrogen. Proc. Natl. Acad. Sci. USA 2014, 111, 9199–9204. [Google Scholar] [CrossRef] [Green Version]
  22. FAO. Food Energy-Methods of Analysis and Conversion Factors; FAO Food and Nutrition Paper 77; FAO: Rome, Italy, 2003; pp. 7–17. ISSN 0254-4725. [Google Scholar]
  23. Olsen, S.R.; Cole, C.V.; Watanabe, F.S.; Dean, L.A. Estimation of Available Phosphorus in Soils by Extraction with Sodium Bicarbonate; U.S. Department of Agriculture: Washington, DC, USA, 1954.
  24. Schinner, F.; Öhlinger, R.; Kandeler, E.; Margesin, R. Methods in Soil Biology; Springer: Berlin/Heidelberg, Germany, 1996; pp. 1–426. [Google Scholar]
  25. Isermeyer, H. Eine einfache Methode sur Bestimmung der Bodenatmung und der Karbonate im Boden. Z. Pflanzanernah. Bodenk. 1952, 56, 6–38. [Google Scholar]
  26. Barnes, E.M.; Clarke, T.R.; Richards, S.E.; Colaizzi, P.D.; Haberland, J.; Kostrzewski, M.; Waller, P.; Choi, C.; Riley, E.; Thompson, T.; et al. Coincident detection of crop water stress, nitrogen status and canopy density using ground based multispectral data. In Proceedings of the Fifth International Conference on Precision Agriculture, Bloomington, MN, USA, 16–19 July 2000; ASA-CSSA-SSSA: Madison, WI, USA, 2000. [Google Scholar]
  27. Boiarskii, B.; Hasegawa, H. Comparison of NDVI and NDRE Indices to Detect Differences in Vegetation and Chlorophyll Content. J. Mech. Cont. Math. Sci. 2019, 4, 20–29. [Google Scholar] [CrossRef]
  28. Moretti, B.; Bertora, C.; Grignani, C.; Lerda, C.; Celi, L.; Sacco, D. Conversion from Mineral Fertilisation to MSW Compost Use: Nitrogen Fertiliser Value in Continuous Maize and Test on Crop Rotation. J. Plant Nutr. Soil Sci. 2020, 705, 135308. [Google Scholar] [CrossRef] [PubMed]
  29. Bertora, C.; Peyron, M.; Pelissetti, S.; Grignani, C.; Sacco, D. Assessment of methane and nitrous oxide fluxes from paddy field by means of static closed chambers maintaining plants within headspace. J. Vis. Exp. 2018, 139. [Google Scholar] [CrossRef] [PubMed] [Green Version]
  30. Möller, K.; Müller, T. Effects of anaerobic digestion on digestate nutrient availability and crop growth: A review. Eng. Life Sci. 2012, 12, 242–257. [Google Scholar] [CrossRef]
  31. Han, L.; Yang, G.; Dai, H. Modeling maize above-ground biomass based on machine learning approaches using UAV remote-sensing data. Plant Methods 2019, 15, 10. [Google Scholar] [CrossRef] [Green Version]
  32. Gilliot, J.M.; Michelin, J.; Hadjard, D.; Houot, S. An accurate method for predicting special variability of maize yield from UAV-BASED plant height estimation: A tool for monitoring agronomic field experiments. Precis. Agric. 2021, 22, 897–921. [Google Scholar] [CrossRef]
  33. Borrelli, L.; Pecetti, L. Wheat yield as a measure of the residual fertility after 20 years of forage cropping systems with different manure management in Northern Italy. Ital. J. Agron. 2019, 14, 1359. [Google Scholar] [CrossRef]
  34. Fidel, R.B.; Laird, D.A.; Spokas, K.A. Sorption of ammonium and nitrate to biochars is electrostatic and pH-dependent. Sci. Rep. 2018, 8, 17627. [Google Scholar] [CrossRef]
  35. Zhang, M.; Song, G.; Gelardi, D.L.; Huang, L.; Khan, E.; Mašek, O.; Parik, S.J.; Ok, Y.S. Evaluating biochar and its modifications for the removal of ammonium, nitrate, and phosphate in water. Water Res. 2020, 186, 116303. [Google Scholar] [CrossRef]
  36. Takaya, C.A.; Fletcher, L.A.; Singh, S.; Anyikude, K.U.; Ross, A.B. Phosphate and ammonium sorption capacity of biochar and hydrochar from different wastes. Chemosphere 2016, 145, 518–527. [Google Scholar] [CrossRef]
  37. Nasielski, J.; Earl, H.; Deen, B. Luxury vegetative nitrogen uptake in maize buffers grain yield under post-silking water and nitrogen stress: A mechanistic understanding. Front. Plant Sci. 2019, 10, 318. [Google Scholar] [CrossRef] [PubMed]
  38. Quilliam, R.S.; Glanville, H.C.; Wade, S.C.; Jones, D.L. Life in the ‘charosphere’—Does biochar in agricultural soil provide a significant habitat for microorganisms ? Soil Biol. Biochem. 2013, 65, 287–293. [Google Scholar] [CrossRef]
  39. Nyambo, P.; Taeni, T.; Chiduza, C.; Araya, T. Effects of Maize Residue Biochar Amendments on Soil Properties and Soil Loss on Acidic Hutton Soil. Agronomy 2018, 8, 256. [Google Scholar] [CrossRef] [Green Version]
  40. Plaza, C.; Giannetta, B.; Fernández, J.M.; López-de-Sá, E.G.; Polo, A.; Gascó, G.; Méndez, A.; Zaccone, C. Response of different soil organic matter pools to biochar and organic fertilizers. Agric. Ecosyst. Environ. 2016, 225, 150–159. [Google Scholar] [CrossRef]
  41. Zhang, Q.; Du, Z.; Lou, Y.; He, X. A one-year short-term biochar application improved carbon accumulation in large macroaggregate farctions. Catena 2015, 127, 26–31. [Google Scholar] [CrossRef]
  42. Paetsch, L.; Mueller, C.W.; Rumpel, C.; Angst, Š.; Wiesheu, A.C.; Girardin, C.; Ivleva, N.P.; Niessner, R.; Kögel-Knabner, I. A multi-technique approach to assess the fate of biochar in soil and to quantify its effect on soil organic matter composition Organic. Geochemistry 2017, 112, 177–186. [Google Scholar] [CrossRef]
  43. Subedi, R.; Taupe, N.; Pelissetti, S.; Petruzzelli, L.; Bertora, C.; Leahy, J.; Grignani, C. Greenhouse gas emissions and soil properties following amendment with manure-derived biochars: Influence of pyrolysis temperature and feedstock type. J. Environ. Manag. 2016, 16, 73–83. [Google Scholar] [CrossRef]
  44. Zhang, Q.; Xiao, J.; Xue, J.; Zhang, L. Quantifying the effects of biochar application on greenhouse gas emissions from agricultural soils: A global meta-analysis. Sustainability 2020, 12, 3436. [Google Scholar] [CrossRef] [Green Version]
  45. Yanai, J.; Sawamoto, T.; Oe, T.; Kusa, K.; Yamakawa, K.; Sakamoto, K.; Naganawa, T.; Inubushi, K.; Hatano, R.; Kosaki, T. Spatial variability of nitrous oxide emissions and their soil-related determining factors in an agricultural field. J. Environ. Qual. 2003, 32, 1965–1977. [Google Scholar] [CrossRef]
  46. Bertora, C.; Alluvione, F.; Zavattaro, L.; van Groenigen, J.W.; Velthof, G.; Grignani, C. Pig slurry treatment modifies slurry composition, N2O, and CO2 emissions after soil incorporation. Soil Biol. Biochem. 2008, 40, 1999–2006. [Google Scholar] [CrossRef]
  47. Clough, T.J.; Condron, L.M. Biochar and the Nitrogen cycle: Introduction. J. Environ. Qual. 2010, 39, 1218–1223. [Google Scholar] [CrossRef] [PubMed]
  48. Horák, J.; Kotuš, T.; Toková, L.; Aydın, E.; Igaz, D.; Šimanský, V. A Sustainable Approach for Improving Soil Properties and Reducing N2O Emissions Is Possible through Initial and Repeated Biochar Application. Agronomy 2021, 11, 582. [Google Scholar] [CrossRef]
  49. Verhoeven, E.; Pereira, E.; Decock, C.; Suddick, E.; Angst, T.; Six, J. Toward a better assessment of biochar–nitrous oxide mitigation potential at the field scale. J. Environ. Qual. 2017, 46, 237–246. [Google Scholar] [CrossRef]
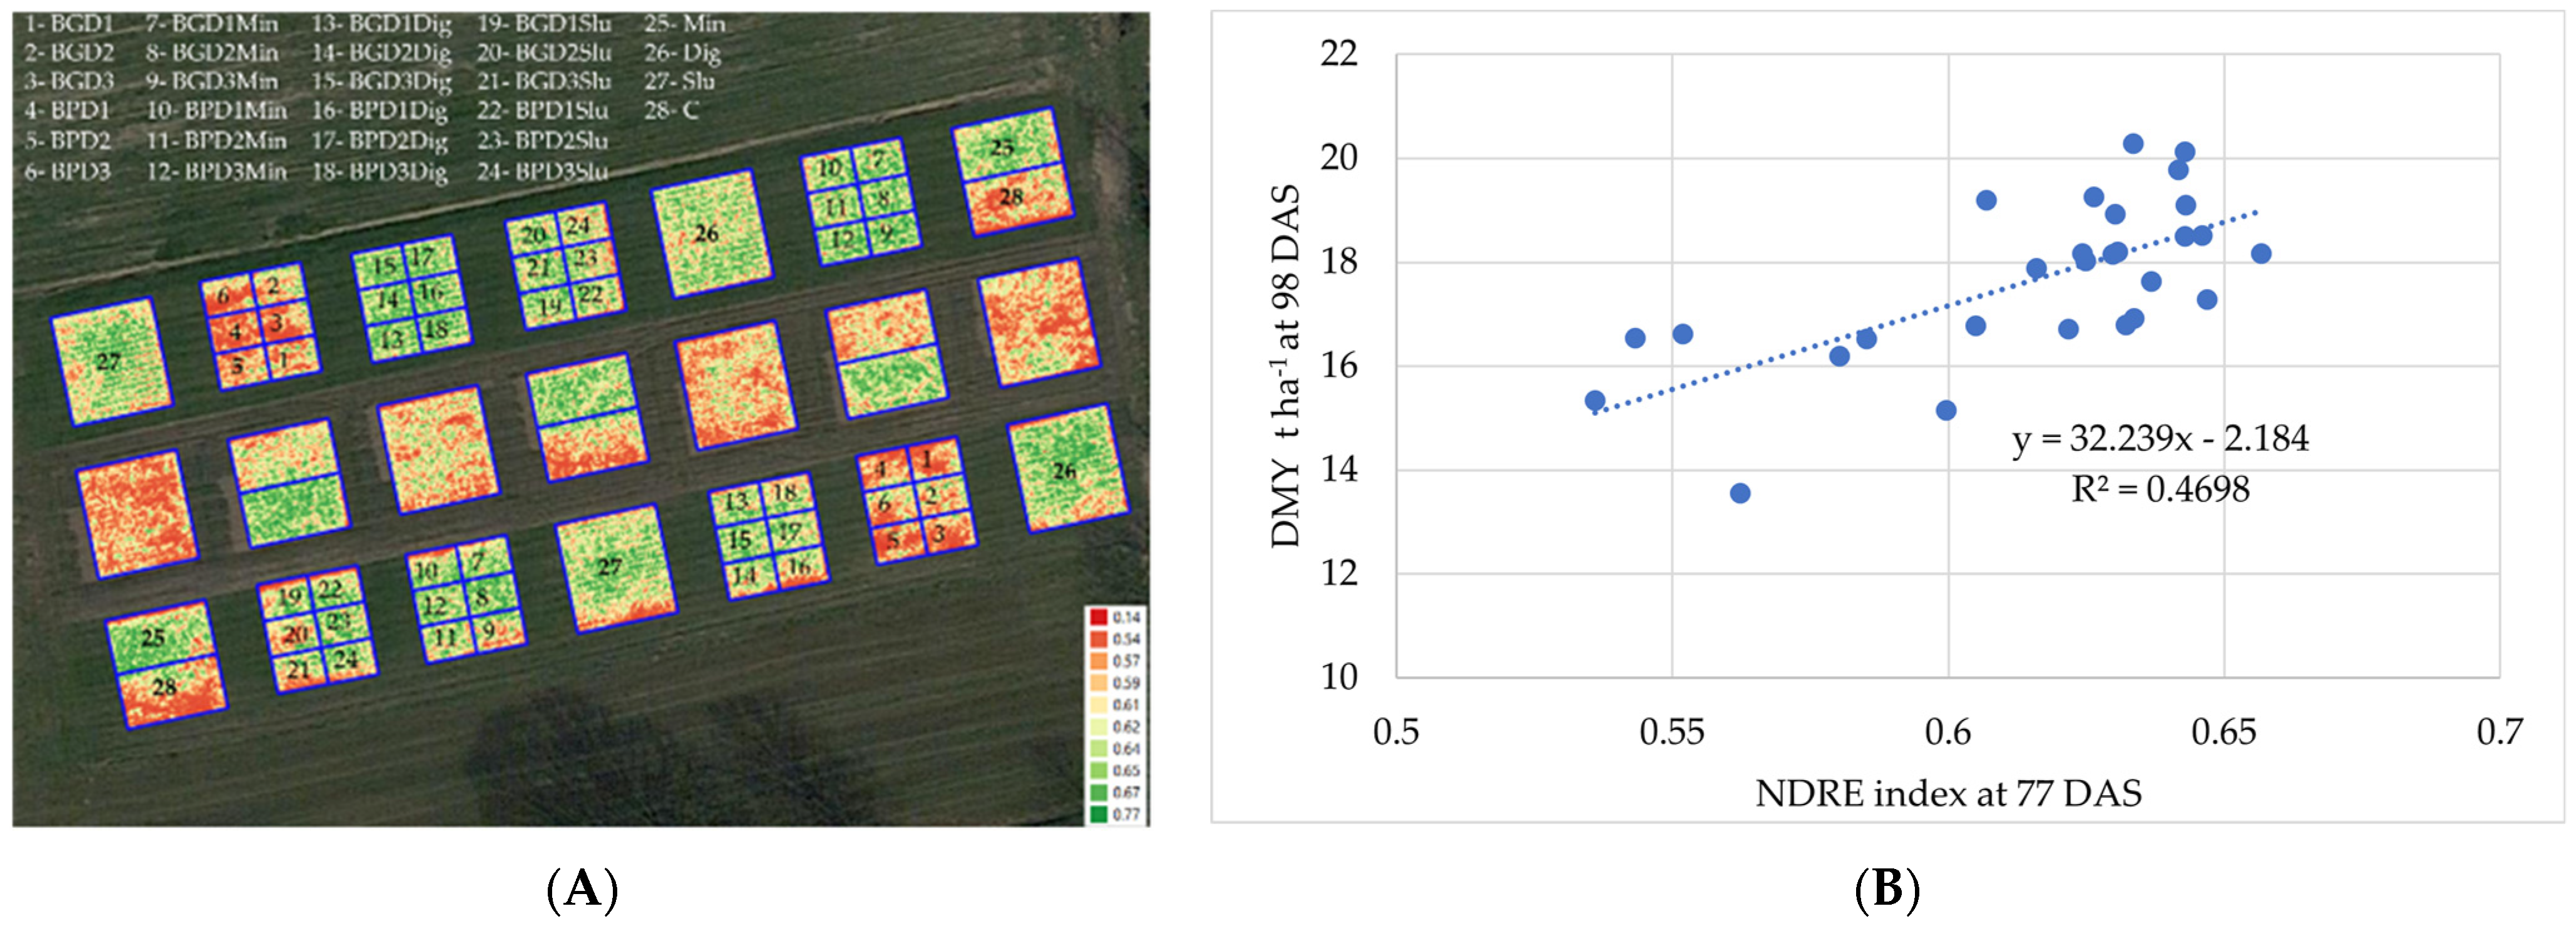
Figure 1. (A) NDRE index estimation obtained in 2019 at 77 days after sowing (DAS) by UAV-mounted multispectral camera monitoring. (B) Plot-averaged correlation between NDRE at 77 DAS and DMY at 98 DAS.
Agriculture 12 00925 g001
Figure 2. Effect of biochar application rates (D1 = 10, D2 = 20, D3 = 40 t ha−1 DM) on the 2019 NDRE index at 77 DAS. a,b Values with different letters are significantly different at the 0.05 level of probability by Stu-dent–Newman–Keuls test.
Agriculture 12 00925 g002
Figure 3. Principal component analysis (PCA) based one 24 soil fertility parameters (year 2018).
Agriculture 12 00925 g003
Figure 4. Effect of the biochar type on soil chemical parameters pH, exchangeable K and Mg and TSB after maize harvesting 2019. significant at: * 0.05 level; ** 0.01 level; **** 0.001 level.
Agriculture 12 00925 g004
Figure 5. Effect of biochar application rates (D1 = 10, D2 = 20, D3 = 40 t ha−1 DM) on the soil chemical parameters Corg, CEC and C-to-N ratio after maize harvesting in 2019; the T0 value for the same parameters is also indicated. Biochar dose source of variation; *** significant at 0.005 level, **** significant at 0.001 level. a,b,c Mean comparison by linear contrasts.
Agriculture 12 00925 g005
Figure 6. Daily N2O emissions (kg N2O–N ha−1 d−1) for BP-treated plots at the D2 dose, and the corresponding fertilized controls.
Agriculture 12 00925 g006
Figure 7. Cumulative (kg N2O–N ha−1) and yield-scaled (kg N2O–N Mg−1 of DM yield) nitrous oxide emissions of a complete maize cropping cycle (2019) for BP-treated plots at the D2 dose, and the corresponding fertilized controls. Different letters refer to significantly different mean values. Capital letters are used for cumulative emissions, while lowercase letters for yield-scaled emissions.
Agriculture 12 00925 g007
Figure 8. Cumulative nitrous oxide emissions (kg N2O–N ha−1) over the cropping season at different phenological stages for the BP-treated plots at the D2 dose, and the corresponding fertilized controls. Different letters refer to significantly different mean values.
Agriculture 12 00925 g008
Table 1. Soil properties of the experimental field at the beginning of the trial (T0).
Soil ParameterUnit
Total sand%53.90
Silt%34.40
Clay%11.70
Water content at field capacity%13.10
Water content at wilting point%7.10
pH in H2O 6.35
Corgg kg−111.25
Total Ng kg−11.35
C/N 8.30
CECmeq 100 g−111.25
Exchangeable Cameq 100 g−14.24
Exchangeable Mgmeq 100 g−10.97
Exchangeable Kmeq 100 g−10.09
Exchangeable Nameq 100 g−10.09
Assimilable P2O5mg kg−118.00
Table 2. Physical and chemical analyses of the two biochar types distributed in 2018.
Biochar ParameterUnitBGBP
Moisture%67.668.3
pH 9.99.2
Electrical conductivity10−1 S m−1736
Total C% DM77.977.9
Total organic C% DM76.877.6
H: Corg Molar ratio <0.10.1
Stable C% Corg87.191.9
Ashes at 550 °C% DM17.066.26
Total N% DM0.160.20
Total P2O5% DM0.260.05
Total K% DM1.030.27
Maximum water retention%80.277.01
Particle size fraction > 5 mm%>20>48
Particle size fraction > 2 mm%>53>77
PAHs amg kg−1<1<1
Heavy metals b <permitted limits<permitted limits
SOLUBLE ELEMENTS (per liter of wet biochar)
NH4–Nmg L−117.2411.69
NO3–Nmg L−1<5<5
Nmg L−117.2411.69
Pmg L−18.430.95
Camg L−118.7716.5
Mgmg L−18.891.79
Kmg L−11362.8618.97
Namg L−146.456.69
a Polycyclic aromatic hydrocarbons; b Pb, Cd, Cu, Zn, Ni, Hg, Cr(VI).
Table 3. Silage maize yield and components of the production (plant-to-ear ratio) in the two years, 2018 and 2019; silage maize protein content and N uptake in 2019; mean values and SE; analysis of variance (ANOVA) results.
TreatmentYield t ha−1 DMPlant-To-Ear RatioProtein Content % DMN Uptake kg ha−1
201820192018201920192019
B17.21 ± 0.4115.57 ± 0.32 b2.41 ± 0.081.96 ± 0.05 b6.93 ± 0.18 c173.5 ± 5.9 b
BMin18.33 ± 0.3318.64 ± 0.34 ab2.26 ± 0.091.85 ± 0.06 b8.58 ± 0.18 ab256.8 ± 7.3 ab
BDig18.47 ± 0.3318.44 ± 0.29 ab2.45 ± 0.092.24 ± 0.06 ab8.62 ± 0.17 ab254.5 ± 5.6 ab
BSlu18.59 ± 0.4517.59 ± 0.34 ab2.29 ± 0.072.13 ± 0.06 ab7.82 ± 0.20 b220.5 ± 6.3 ab
Min20.05 ± 1.3420.29 ± 0.79 a2.62 ± 0.411.87 ± 0.15 b9.42 ± 0.61 a306.9 ± 23.2 a
Dig15.77 ± 0.2216.80 ± 0.47 ab2.73 ± 0.232.48 ± 0.05 a8.34 ± 0.13 ab224.3 ± 7.9 ab
Slu16.35 ± 0.9019.25 ± 1.21 ab2.22 ± 0.252.17 ± 0.50 ab8.40 ± 0.37 ab259.8 ± 21.8 ab
Cnd16.53 ± 0.72 abnd1.98 ± 0.10 b6.68 ± 0.31 c176.8 ± 10.7 b
Block1.44 ns0.18 ns0.05 ns0.04 ns1.63 ns1.91 ns
Treatment1.73 ns6.04 *1.81 ns7.20 **18.8 ****10.6 ***
Biochar effectBMin vs. Min 11.35 ns2.09 ns1.24 ns0.03 ns5.1 ǂ4.3 ns
BDig vs. Dig 13.29 ns2.07 ns0.80 ns3.20 ns0.6 ns1.6 ns
BSlu vs. Slu 12.29 ns2.11 ns0.04 ns0.09 ns2.5 ns2.6 ns
B vs. C 1nd0.71 nsnd0.01 ns0.5 ns0.0 ns
Fertilization effect BMin vs. B 11.97 ns29.39 ***0.74 ns2.33 ns69.8 ****41.6 ****
BDig vs. B 12.50 ns22.22 ***0.06 ns15.38 **72.2 ****39.3 ****
BSlu vs. B 13.03 ns11.05 *0.49 ns3.45 ns20.1 ***13.2 **
Treatment*bl.2.36 *1.87 ns2.53 *0.90 ns0.62 ns2.36 *
a,b,c Values with different letters are significantly different at the 0.05 level of probability by Student–Newman–Keuls test. ANOVA results presented as F values; ǂ significant at 0.05 < p < 0.06; * significant at 0.05 level; ** significant at 0.01 level; *** significant at 0.005 level; **** significant at 0.001 level; ns, not significant; nd, not determined. 1 Comparisons within treatments by linear contrasts.
Table 4. Silage maize growth dynamics in 2019 in terms of plant height (cm) at the uppermost leaf collar stage at the day after sowing (DAS) indicated; mean values and SE; analysis of variance (ANOVA) comparisons of fertilization effects in presence and absence of biochar.
TreatmentVegetative StagesTasseling
H1 (22–23 DAS)H2 (33–34 DAS)H3 (43–44 DAS)H4 (54–55 DAS)H5 (62–63 DAS)
B12.99 ± 0.61 d34.38 ± 1.62 d81.86 ± 3.12 c182.27 ± 5.89 b249.82 ± 2.29 a
BMin14.37 ± 0.58 c41.58 ± 2.27 bc101.60 ± 3.38 b206.61 ± 5.30 a258.69 ± 8.88 a
BDig17.36 ± 0.62 ab52.15 ± 1.76 a118.51 ± 2.14 a220.15 ± 4.13 a263.80 ± 2.36 a
BSlu16.85 ± 0.61 ab49.74 ± 2.16 a112.46 ± 2.44 ab214.09 ± 4.89 a258.63 ± 3.23 a
Min16.21 ± 0.84 b45.28 ± 3.09 ab107.63 ± 2.71 ab217.33 ± 3.00 a261.17 ± 1.13 a
Dig17.98 ± 0.75 a52.31 ± 2.81 a115.23 ± 3.19 a218.94 ± 5.41 a261.96 ± 1.94 a
Slu17.16 ± 0.89 ab49.14 ± 3.00 a110.03 ± 4.91 ab210.16 ± 11.30 a255.06 ± 6.77 a
C13.63 ± 0.84 cd37.64 ± 3.09 cd89.16 ± 4.59 c193.28 ± 7.67 b259.59 ± 2.85 a
Block137.0 ****117.2 ****30.3 ****20.3 ****1.6 ns
Treatment61.1 ****36.4 ****36.9 ****22.3 ****3.0 ns
Biochar effectBMin vs. Min 119.7 ***3.5 ns2.5 ns4.4 ns0.3 ns
BDig vs. Dig 12.9 ns0.01 ns1.0 ns0.1 ns0.2 ns
BSlu vs. Slu 10.7 ns0.1 ns0.5 ns1.0 ns0.8 ns
B vs. C 12.4 ns2.7 ns3.7 ns4.7 ns4.3 ns
Fertilization effectBMin vs. B 122.2 ***26.2 ***53.8 ****45.8 ****7.1 *
BDig vs. B 1222.9 ****160.2 ****185.4 ****110.8 ****17.6 ***
BSlu vs. B 1173.4 ****119.6 ****129.2 ****78.2 ****7.0 *
Treatment*bl0.49 ns0.90 ns0.78 ns0.33 ns0.76 ns
a,b,c,d Values with different letters are significantly different at the 0.05 level of probability by Student–Newman–Keuls test. ANOVA results presented as F values; * significant at 0.05 level; *** significant at 0.005 level; **** significant at 0.001 level; ns, not significant; nd, not determined. 1 Comparisons within treatments by linear contrasts.
Table 5. Italian ryegrass yield in the two productive cycles 2018–2019 and 2019–2020; mean values and SE; ANOVA results. The crop was not fertilized; the treatments applied to the previous silage maize culture are indicated.
TreatmentYield t ha−1 DM
20192020
B7.52 ± 0.513.35 ± 0.22
BMin8.04 ± 0.464.98 ± 0.26
BDig7.83 ± 0.344.89 ± 0.25
BSlu7.79 ± 0.415.51 ± 0.22
Min7.57 ± 0.993.03 ± 0.50
Dig5.61 ± 0.493.70 ± 0.98
Slu7.25 ± 0.054.08 ± 0.01
C5.73 ± 0.512.89 ± 0.45
Treatment1.25 ns2.24 ns
Biochar effectBMin vs. Min 10.25 ns2.33 ns
BDig vs. Dig 15.60 ǂ0.86 ns
BSlu vs. Slu 10.33 ns1.25 ns
B vs. C 1nd0.13 ns
Fertilization eff.BMin vs. B 11.08 ns5.72 *
BDig vs. B 10.37 ns5.08 ǂ
BSlu vs. B 10.29 ns10.02 *
ANOVA results presented as F values; ǂ significant at 0.05 < p < 0.10 level; * significant at 0.05 level; ns, not significant. 1 Comparisons within treatments by linear contrasts.
Table 6. Effect of biochar and fertilization on soil Corg, C-to-N ratio and CEC; mean values and SE; ANOVA results.
TreatmentCorg
g kg−1 DM
C/N RatioCEC
meq 100 g−1 DM
B12.18 ± 0.36 abc8.72 ± 0.29 a12.18 ± 0.17 ab
BMin14.13 ± 0.88 a9.57 ± 0.52 a13.09 ± 0.41 a
BDig14.30 ± 1.08 a10.08 ± 0.60 a13.15 ± 0.47 a
BSlu12.73 ± 0.54 ab8.89 ± 0.37 a12.43 ± 0.27 ab
Min10.05 ± 0.25 c7.45 ± 0.45 a11.25 ± 0.15 b
Dig10.85 ± 0.35 bc7.50 ± 0.0 a11.50 ± 0.10 b
Slu10.45 ± 0.35 bc7.45 ± 0.25 a11.35 ± 0.25 b
C9.85 ± 0.45 c7.30 ± 0.10 a11.35 ± 0.05 b
Block0.21 ns0.13 ns0.31 ns
Treatment16.31 ****3.89 *18.05 ****
Biochar effect BMin vs. Min 131.42 ****5.56 *35.09 ****
BDig vs. Dig 122.52 ***7.96 *28.17 ***
BSlu vs. Slu 19.79 *2.59 ns11.96 *
B vs. C 110.23 *2.49 ns7.19 *
Fert. effectBMin vs. B 125.18 ***3.14 ns29.88 ****
BDig vs. B 129.90 ****7.53 *33.84 ****
BSlu vs. B 12.00 ns0.13 ns2.11 ns
Treatment*bl.0.13 ns0.56 ns0.11 ns
a,b,c Values with different letters are significantly different at the 0.05 level of probability by Student–Newman–Keuls test. ANOVA results presented as F values; * significant at 0.05 level; *** significant at 0.005 level; **** significant at 0.001 level; ns, not significant. 1 Comparisons within treatments by linear contrasts.
Publisher’s Note: MDPI stays neutral with regard to jurisdictional claims in published maps and institutional affiliations.