Article

Numerical Simulation and Verification of Seed-Filling Performance of Single-Bud Billet Sugarcane Seed-Metering Device Based on EDEM

1
School of Mechanical Engineering, Anyang Institute of Technology, Anyang 455000, China
2
Key Laboratory of Key Technology on Agricultural Machine and Equipment, Ministry of Education, South China Agricultural University, Guangzhou 510642, China
*
Author to whom correspondence should be addressed.
Agriculture 2022, 12(7), 983; https://doi.org/10.3390/agriculture12070983
Submission received: 2 June 2022 / Revised: 25 June 2022 / Accepted: 29 June 2022 / Published: 7 July 2022
(This article belongs to the Special Issue Advances in Agricultural Engineering Technologies and Application)

Abstract

:
The seed filling of a seed-metering device is a critical process in sugarcane cultivation operations. To analyze the contact between billets, the related mechanical components, and the law of billets movement in the seed-metering device, a simulation of the seed-filling process based on EDEM was proposed, and a geometric model of the seed-metering device, a particle model, and a contact model were established by EDEM software. The physical experimental results and simulation results of the angle of repose were compared. The experimental results showed that the relative error of the angle of repose experiment was 6.67%, which verified the effectiveness of the material parameters of single-bud billet; the linear correlation coefficient of the seed-filling experiment was 0.762 for Sq and 0.869 for Se, which demonstrated the validity of using EDEM software to simulate the seed-filling process. Finally, the velocity and force of the particles in the seed-filling process were analyzed in EDEM. The analysis results indicated that there are two circulation circles in the seed box, and the larger the circulation circle, the easier the billets enter the rake bar. The EDEM simulation provides a basis for optimizing the structure and parameters of the sugarcane billet planter in future work.

1. Introduction

Sugarcane planting is one of the most labor-intensive and time-intensive procedures in sugarcane production. Traditional planting method of whole-stalk planters and real-time cutting planters requires great human force and large number of seed stalks. Therefore, billet planter is increasingly popular in sugarcane cultivation because of its high efficiency and low labor intensity. [1]. The single-bud billet planter discharges single-bud billets from a seed box using rake bars [2]. Seed-filling is critical in the entire seed metering process, whereas the seed-filling uniformity has a direct impact on the seed metering quality of the planter. The seed-filling process is as follows: the billets in the seed box fill the rake bar when the rake bar chain moves, and then the billets move toward the seeding channel inlet because of the gravity, the rake bar driving force, and the billet interaction. The mechanical structure parameters, physical and mechanical properties of billets, and their mutual movement all affect the seed-filling process. The interaction force between billets and the mechanical structure, billet displacement, and velocity are important for designing and optimizing sugarcane billet planter machinery components. The discrete element method (DEM) proposed by P.A. Cundall [3] has become a general method for analyzing the contact between particles and the related mechanical components [4], and the law of seed movement in measurements [5].
Most of the traditional agricultural machinery research methods are based on theoretical analysis and experimental research [6], but the traditional test method is time-consuming, laborious, and subject to seasonal constraints. With the rapid development of computer technology, DEM and its numerical simulation software, EDEM, have been extensively used in the field of agricultural engineering [7,8].
The EDEM simulation software is often adopted to analyze the velocity, force, and other important information about seeds in the working process. Sun et al. [9] obtained the maximum discharging velocity and force of the particles at different helix angles in the drilling process. Yudao et al. [10] used EDEM to simulate the working process of a cottonseed-metering device at various speeds and tilt angles. The trajectories of individual seeds in the seed-metering device were obtained, and the stress variation trend in the grain group was determined as a function of time. Based on the EDEM theory, Miao et al. [11] studied the vibration and seed population distribution of Pinus sylvestris var. Mongolica. Ghodki et al. [12] simulated the motion of black pepper seeds in a cryo-grinding system in all directions and studied their flow characteristics. Horabik et al. [13] investigated the variation trends of stress radial distribution during seed movement by simulating the distribution of stress components within the bulk of pea seeds in a shallow model silo.
Meanwhile, a plethora of studies conducted EDEM simulation tests to optimize machinery structures. Li et al. [14] simulated the sowing process, established the regression equation for sowing depth, and determined the structural size of the telescopic pipe. Lu et al. [15] studied the movement principles of rice seeds on the vibration plate and optimized the parameters of a vibratory even-seeding device for hybrid rice by using the Hertz-Mindlin non-sliding contact model to simulate the working process of a V-T type vibrating plate. Xu et al. [6] used EDEM to simulate the crushing process of cucumber straw and investigate the optimal crushing process parameters to improve the crushing efficiency and reduce power consumption. He et al. [16] designed a centralized fertilizer ejecting device and analyzed the fertilizer ejecting performance using EDEM to optimize the structural parameters of the fertilizer ejecting wheel. Liu et al. [17] established the simulation model of the fertilizer shunt plate and an evaluation model of the fertilization effect to optimize the structural parameters of the fertilizer shunt plate through EDEM simulation. Liu et al. [18] used EDEM to simulate the nest hole wheel with three different hole structures and then conducted experiments to validate the simulation results.
Based on the previous research on the seed-filling uniformity of sugarcane single-bud billet planter and the physical and mechanical properties of single-bud billets, this study established the particle model of a single-bud billet, the geometric model of a sugarcane seed-metering device, the contact model between the billet and the boundary, and the contact model between billets. With EDEM, the seed-filling process of single-bud billets in the seed-metering device was simulated, and the angle of repose physical experimental result and simulation result were compared to validate the input parameters. Meanwhile, the seed-filling physical experimental result and the simulation result were compared to validate the feasibility of the simulation experiment using EDEM. Finally, the interaction between the billet and rake bar and the movement law of billets in the seed box were investigated in the EDEM software, providing a theoretical basis for future digital planter design.

2. Materials and Methods

2.1. Particle Model of Single-Bud BILLET

The particle model of a single-bud billet in the building module of the EDEM particle model was established as follows. First, the particle model of a single-bud billet is approximated to a cylindrical shape, and the material particle is assembled by three filling spheres according to the radius and length of the billet, as shown in Figure 1. Then, the radius and position coordinates of the filling spheres are calculated based on the billet size. Finally, the particle models of the same shapes with different sizes are randomly generated within a diameter range of 25–30 mm based on the size distribution of single-bud billets.
The particles were dynamically generated under a normal distribution in the particle plant at a rate of 60 particles per second, with 800 particles for the simulation experiments of the angle of repose and 200 particles for the seed-filling simulation experiment, and the same number of billets was used in physical experiments. It took 4 s for the 200 particles produced to drop completely, and then the rake bar began to move at a uniform linear speed of 0.848 m/s. The total simulation time was 57.6 s. The time step was set to 20% of the Rayleigh time step to ensure the simulation accuracy, and the simulation grid was set to two times of the particle radius to reduce the calculation time.

2.2. Geometric Model of Single-Bud Billet Seed-Metering Device

The three-dimensional model of the single-bud billet seed-metering device was created using the PorE software and then imported into the EDEM software, as shown in Figure 2. Because only the seed-filling process was studied in the simulation experiments, the geometric model was simplified to include only the seed box, rake bar chain, and rake bar in the simulation environment, thus reducing the calculation amount in the simulation process. The rake bar chain in the seed box drives the rake bar to expel the single-bud billet from the billet population in the seed box. The material of seed-metering device is steel.
The linear speed of the rake bar moving in a straight line along the seed box can be calculated with the rotational speed n and radius R of the driving wheel of the rake bar chain. The calculation formula is as follows:
V = 2 π · R · n
In the simulation and physical experiment of the seed-filling process, the rotational speed of the driving wheel of the rake bar chain was set to 90 rpm, and the corresponding linear speed of the rake bar is 0.848 m/s.

2.3. Contact Model and Parameters Setting

In EDEM, the Hertz-Mindlin (no-slip) contact model was adopted for particle-particle and particle-boundary (including the rake bar and seed box) to achieve accurate and efficient seed-filling simulation results, and there is no binding effect between billet particles.
The parameter setting of the global variable significantly affects the simulation accuracy of EDEM preprocessing [9]. According to Liu et al. [19], the sugarcane billet particles were set with a Poisson’s ratio of 0.344 and a shear modulus of 1.08 × 10⁷ Pa. All the steel geometries in the model were set with a Poisson’s ratio of 0.3, a shear modulus of 7.9 × 10¹⁰ Pa, and a density of 7850 kg/m3 [20]. The setting of other physical and contact mechanical property parameters is shown in Table 1. The average values of these parameters were selected based on the test measurement results of the previous study [21].

2.4. Angle of Repose Experiment

The angle of repose is the maximum angle between the surface of the bulk material pile naturally formed on the plane and the horizontal plane [22]. It reflects the macroscopic flow characteristics of the particulate system and is strongly related to inter-particle friction properties [23,24].
The hollow cylinder method was used to determine the static angle of repose of a cohesionless material [25]. The method is convenient and simple, and it has been widely used [26,27,28,29]. The variety of sugarcane billet used in this paper was Tai Tang F66. The selected billets were poured into the bottomless stainless-steel cylinder with a diameter of 40 cm and a length of 120 cm on the horizontal plane, and the billet surface was kept flat. Then, the cylinder was lifted to a certain distance at a speed of 33 mm/s, and the billets in the cylinder would completely overflow under gravity until a static condition was reached. The angle of repose was calculated by measuring the radius and height of the pile. In the experiment, each group of tests was repeated three times.
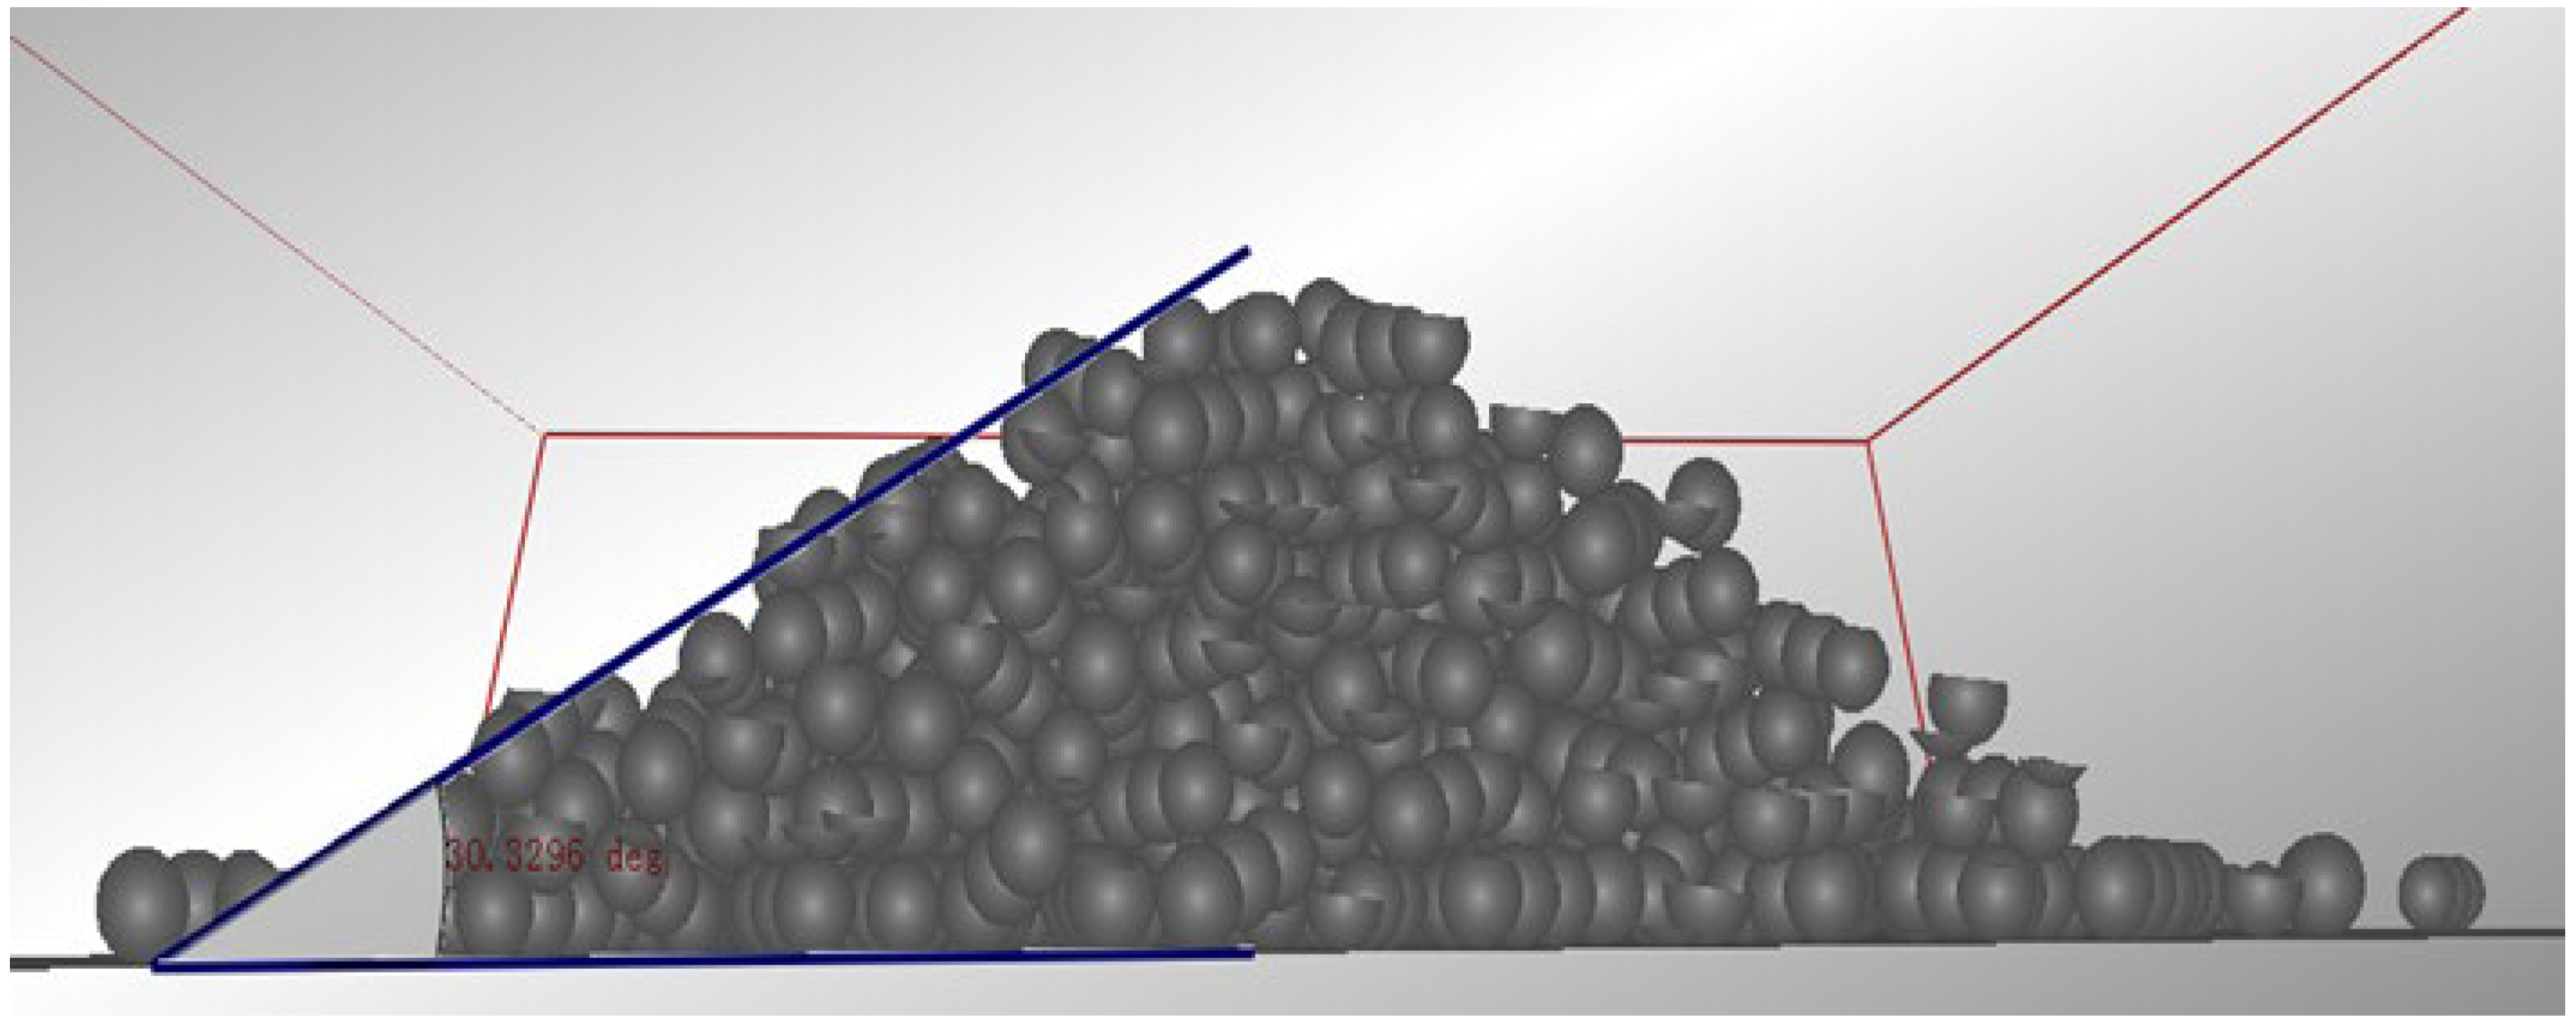
The simulation test procedure was similar to the physical test procedure. The factory was located at the top of the cylinder, and the generated particles fell under gravity. The cylinder was raised at a speed of 33 mm/s, and then the billet particles began to flow, forming a static billet pile. The angle measurement tool “protractor” and the slicing tool in the EDEM software were used to measure the angle of repose, and the slice orientation was set in the X-direction with a slice depth of 50 mm and close to the center, as shown in Figure 3.

2.5. Seed-Filling Experiment

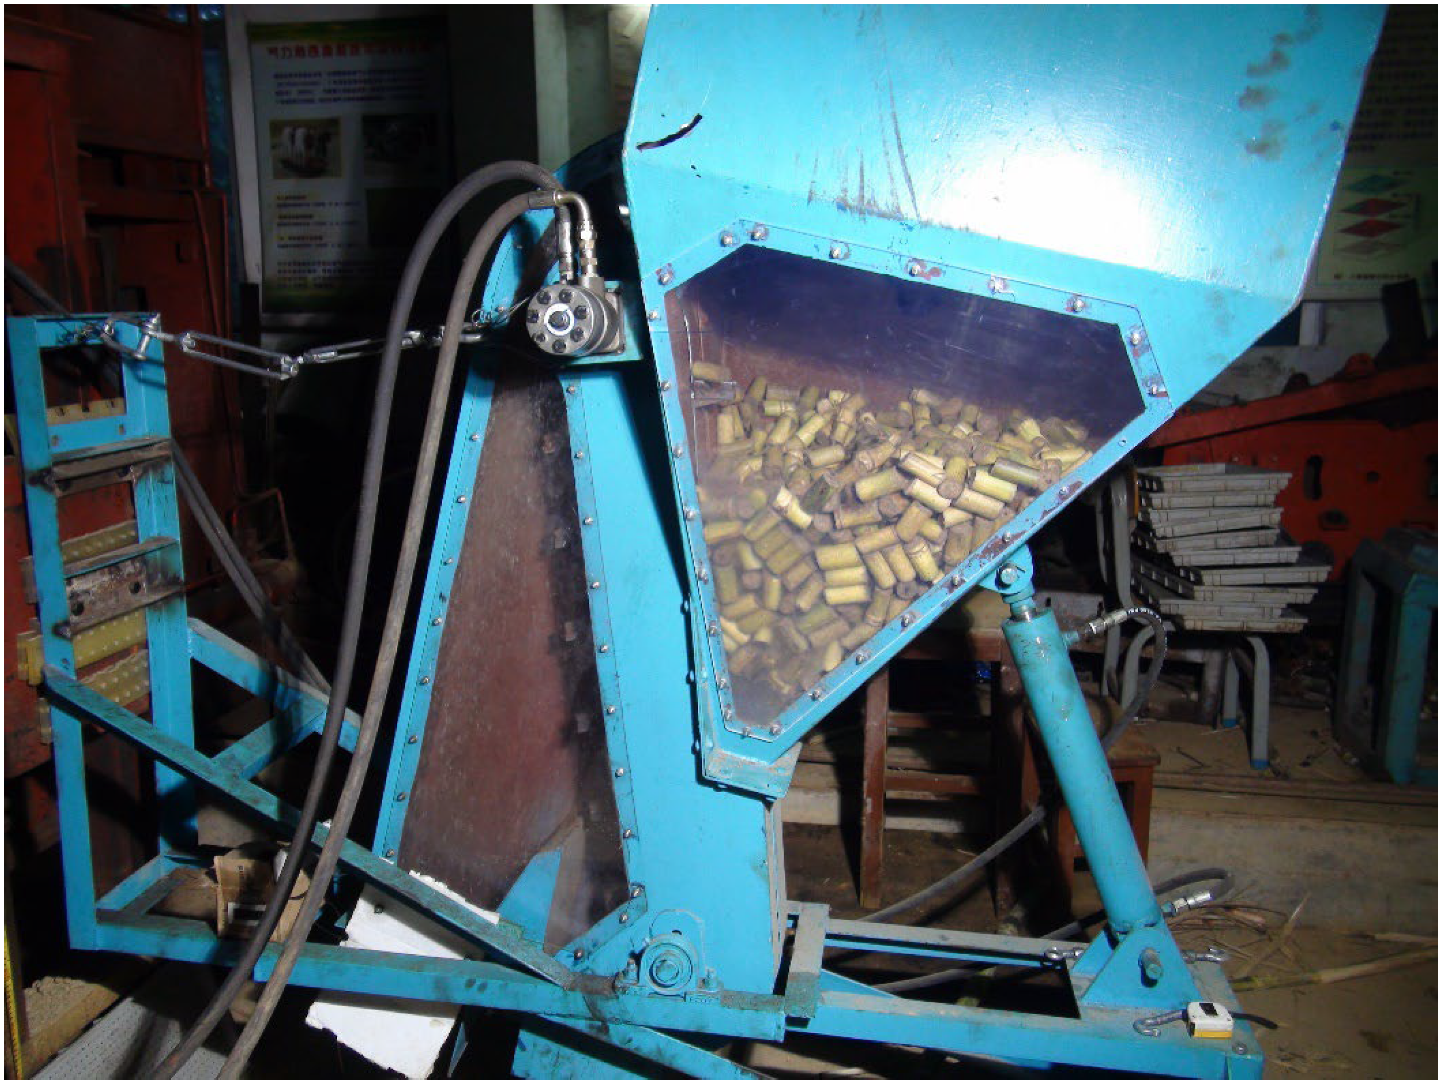
Figure 4 shows the physical seed-filling experiment setup for seed-metering device. The details of seed-metering device design in the reference [2]. During the experiments, a hydraulic motor drove the rake bar chain using the driving wheels, and the billets were driven by the rake bar to move along the wall of the seed box. The sugarcane billets filled the rake bar and moved toward the inlet of the seeding channel. The lateral plate of the seed box was removed to better observe the seed-filling process. A hall sensor was used to measure the rotational speed of the rake bar chain wheel. Meanwhile, a hydraulic cylinder was adopted to adjust the angle of the rake bar chain, and a digital camcorder was used to record the seed-filling process. The ratio between the number of rake bars with 1–2 billets and the total number of rake bars is called the qualification filling rate Sq. The ratio between the number of rake bars with no billets and the total number of rake bars is called the miss out filling rate Se. In this study, the two indexes were used to evaluate the seed-filling uniformity. According to previous work [2], the rotation speed of the rake bar chain wheel was set to 90 rpm, the number of billets was set to 200, and the angle of the rake bar chain was set to four levels (97°, 107°, 117°, and 127°) with each treatment being repeated three times.
The simulation experiment was conducted as follows: First, the 3D model of the single-bud billet seed-metering device was imported into the EDEM software. The material was configured using the parameters listed in Table 1, and the movement parameters are introduced in Section 2.2. After 200 billet particles were generated, the rake bar chain began to move, and the total simulation time was 53.6 s. The simulation experiment was repeated three times for each rake bar chain angle.

3. Results and Discussion

3.1. Analysis of the Angle of Repose Results

Under the condition of a bottomless stainless-steel cylinder, the angles of repose of the physical experiment are 27.57°, 28.63°, and 29.41°, with an average of 28.54°. Meanwhile, the simulation angles of repose are 30.85°, 30.36°, and 30.33°, with an average of 30.51°. Compared to the physical angle of repose of single-bud billet, the relative error of the simulation experiment is 6.67%, which is within a reasonable range. It verifies the feasibility of the material parameter setting of the single-bud billet. A parameter calibration study can be conducted in the future to improve the accuracy of the simulation results. These parameters were used in the seed-filling simulation and compared to the physical results to further validate the feasibility of the EDEM simulation experiments.

3.2. Analysis of the Seed-Filling Experiment Results

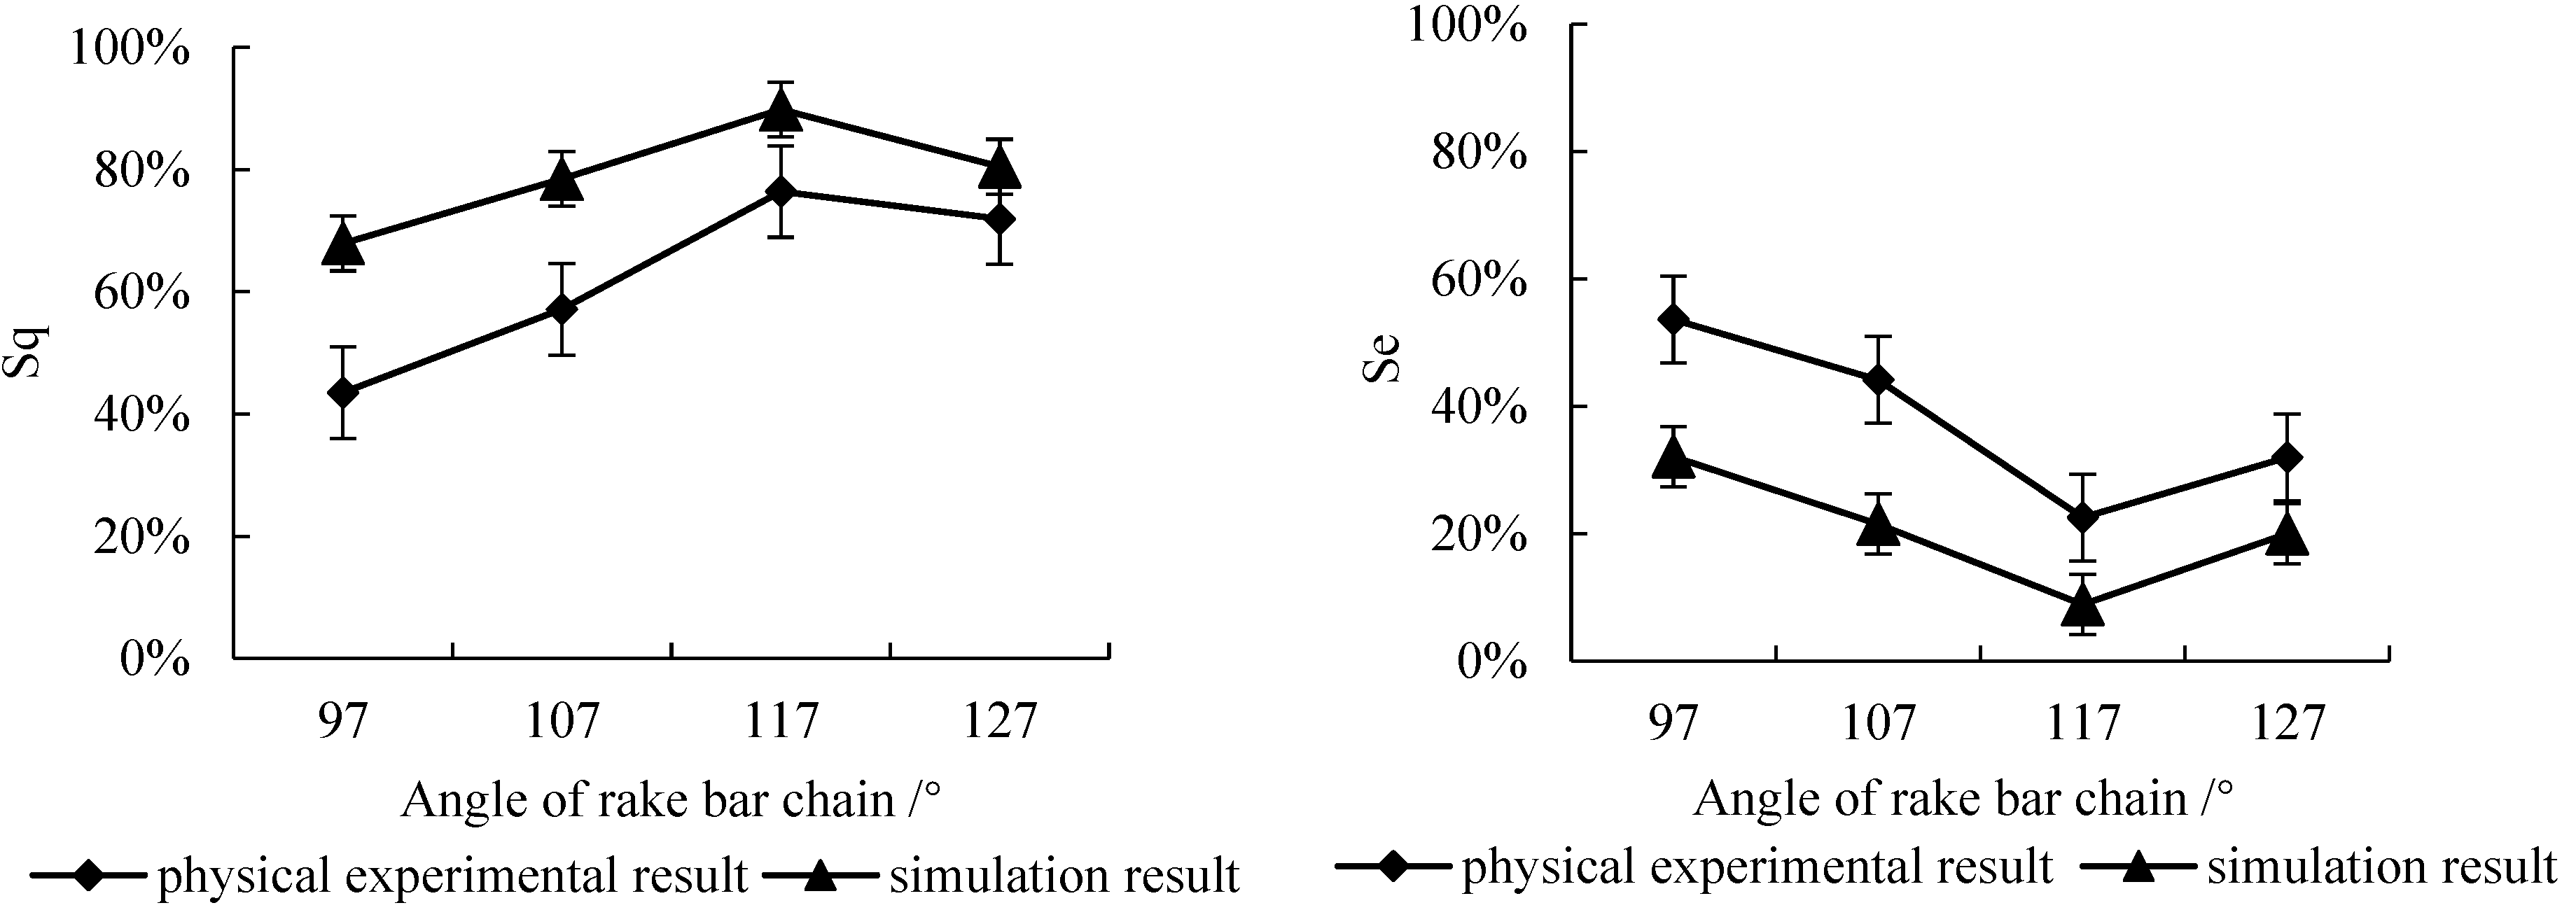
As illustrated in Figure 5, the qualification filling rate Sq and the miss out filling rate Se under different angles of the rake bar chain in the physical and simulation experiments have the same variation trend. With the increase in the angle of the rake bar chain, the Sq increases first from 43.52% to 76.4% and then decreases to 71.96% in the physical experiments, whereas it increases first from 67.92% to 89.84% and then decreases to 80.46% in the simulation experiments. The variation trend of Se is the opposite to that of Sq. Because there were only 200 billets in the seed box, the Sq in both physical and simulation experiments is low. The increase in billets improves the Sq, which has been demonstrated in the previous study [2], but it also increases the simulation time. The Sq in the simulation experiments is generally higher than that in the physical experiments, which may be related to the individual difference in the billets of the physical experiments. The parameters are also variable, and the vibration of the rake bar chain and seed box may affect the physical experimental results. According to the linear regression analysis of the simulation and physical experimental results, the linear correlation coefficient was 0.762 for Sq and 0.869 for Se. The simulation result is consistent with the physical experiment result, demonstrating the validity of using the EDEM software to simulate the seed-filling of billets. The single-bud billet seed-metering device has been applied in HN 2CZD-2 single-bud sugarcane planter. The planter did a good job in the farm of Guangdong Guangken Agricultural Machinery Service Co., Ltd., Guangzhou, China.

3.3. Motion of Single-Bud Billet in Seed-Metering Device Analysis

Figure 6 shows the motion of the single-bud billet in the rake bar of the seed-metering device. According to physical experimental results, the rake bar chain speed was set to 90 rpm, the billet number was set to 200, and the initial velocity of the billet in the seed box was set to 0 m/s. When the rake bar chain began to move, the billets were lifted into the rake bar, moved to the highest point in the seeding channel, and finally thrown out. Figure 5. shows a cross-sectional view of the middle of the seed box to illustrate the movement of billets in the rake bar and seed box. In this figure, the particle velocity is represented by red, green, and blue from high to low. The particle velocity in the seed-metering device varies with color. Under the action of the rake bar, the billets in the rake bar moved at a relatively high speed. The surrounding billets followed the movement trend of the rake bar due to the friction among the billets and moved lower, whereas other billets that were not affected by the movement remained stationary.
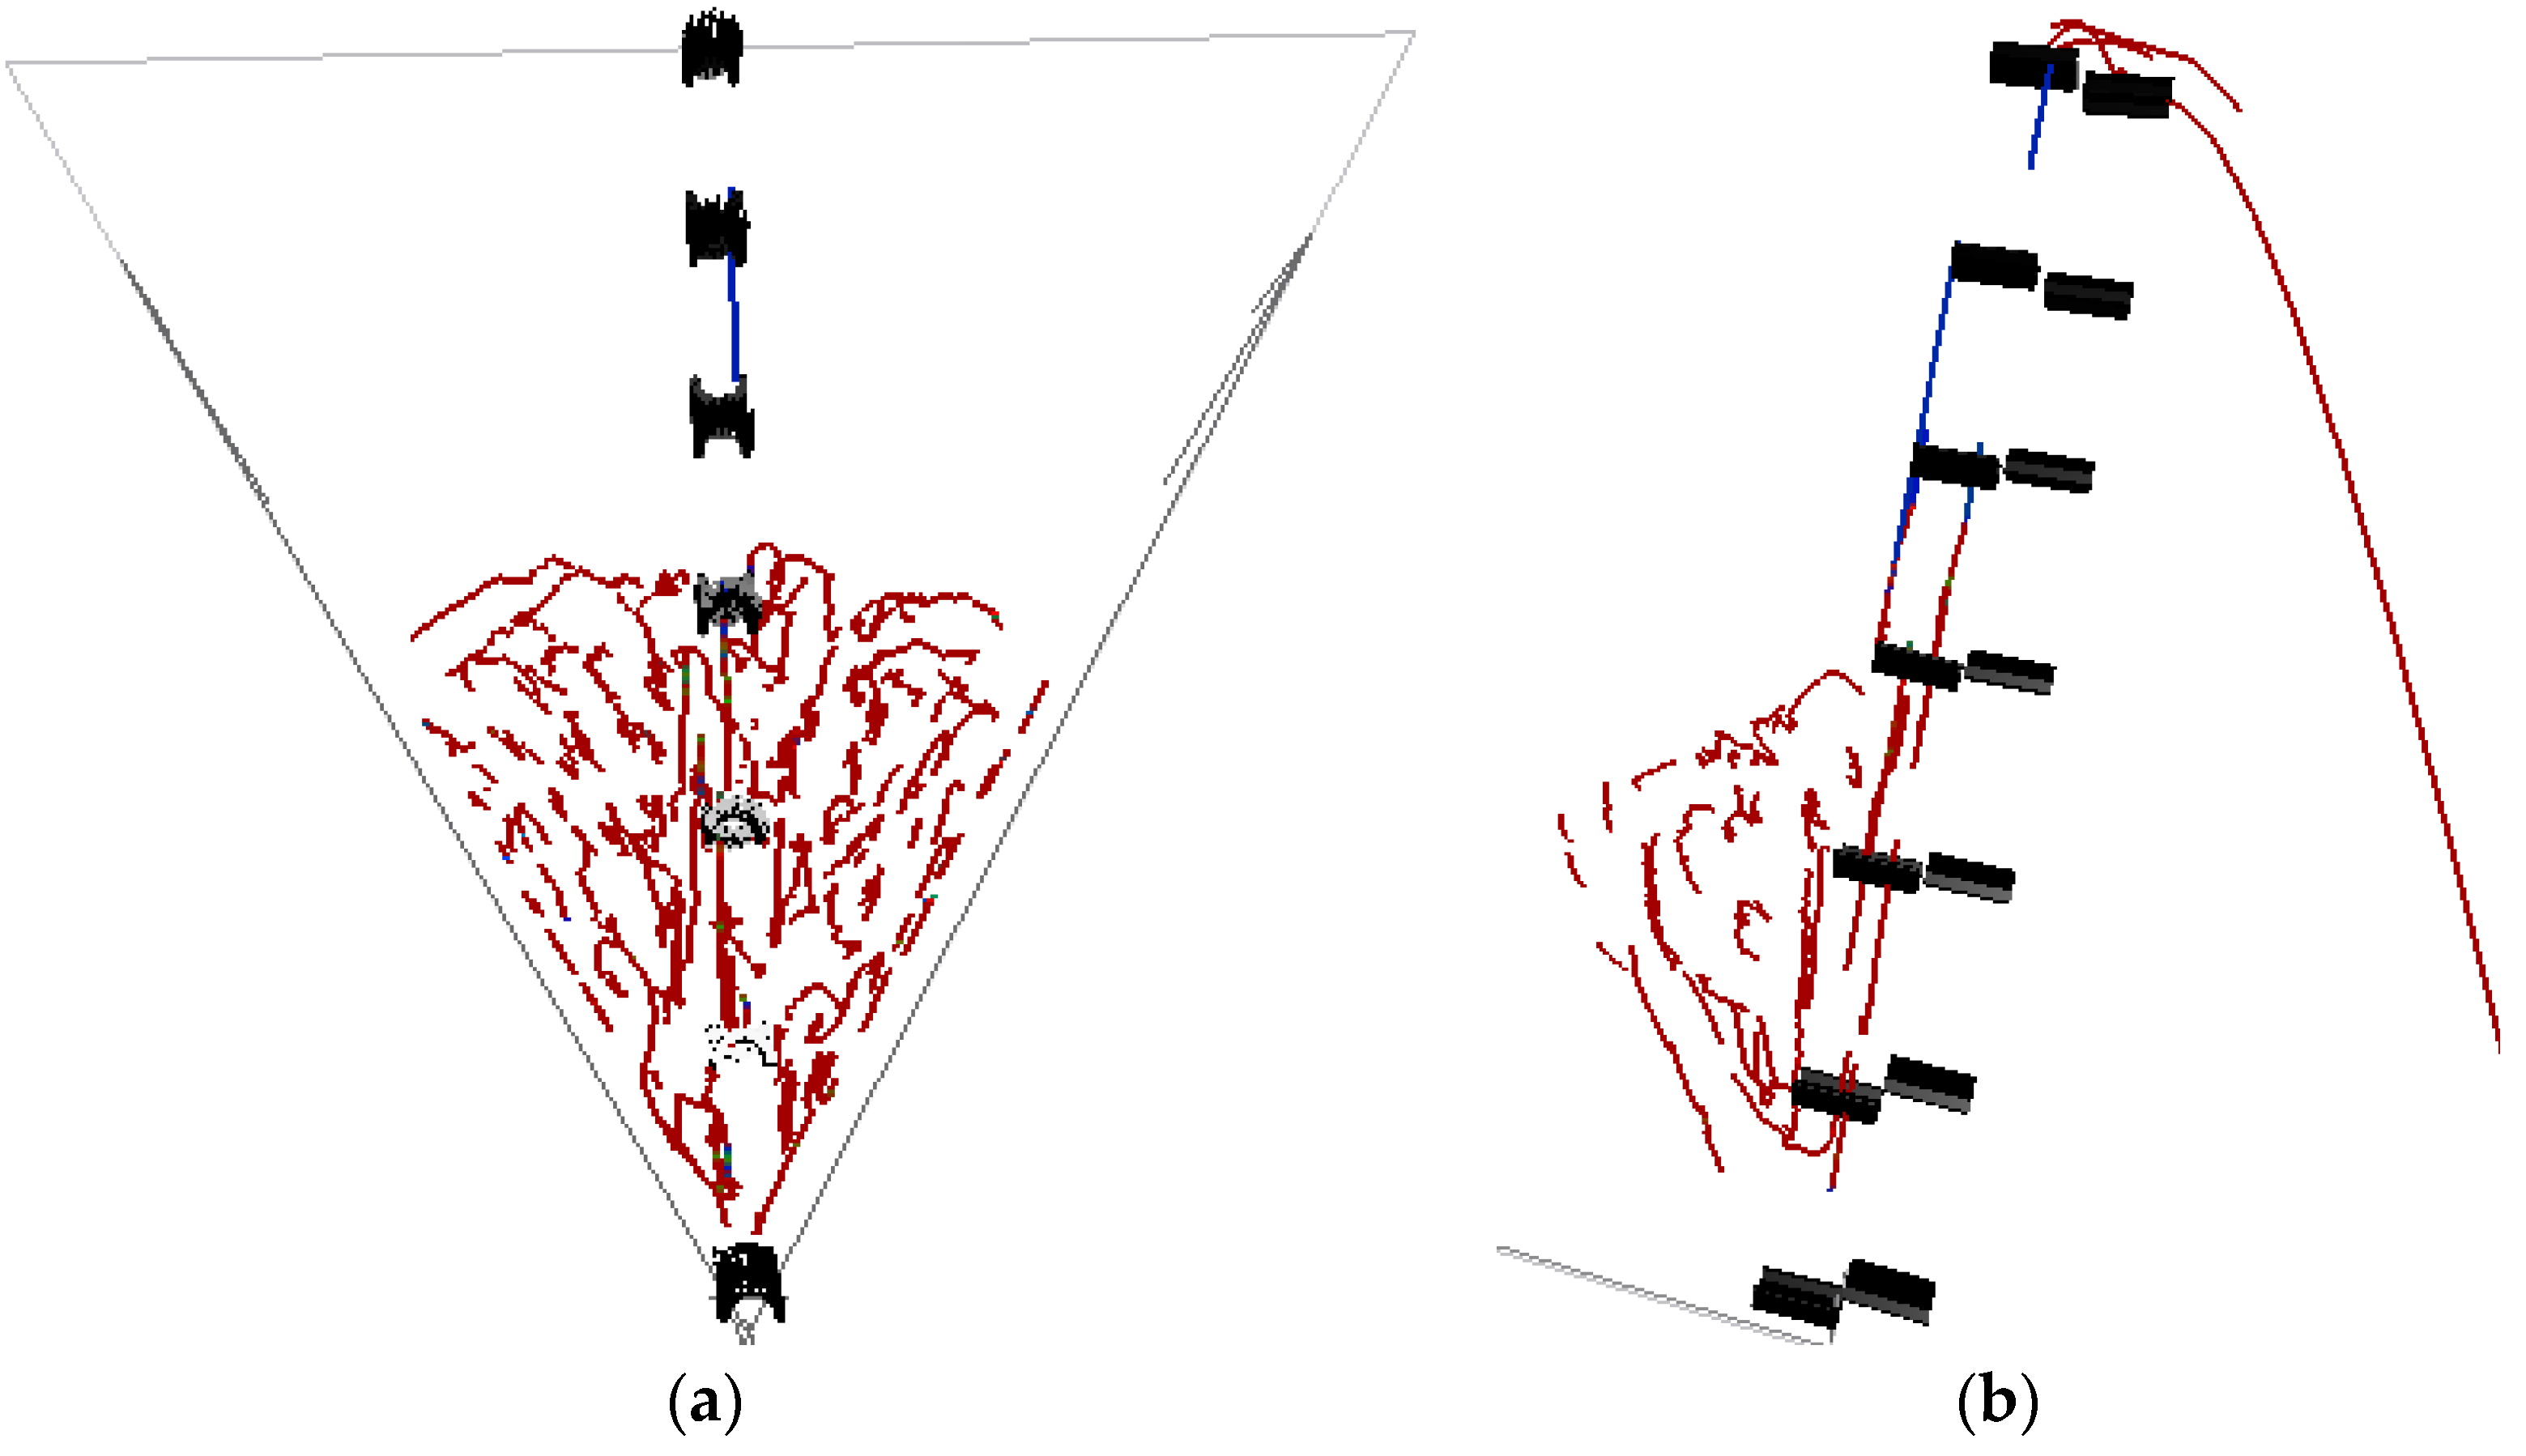
To clearly illustrate the movement trajectory of billets, the seed box was sliced from the middle with a slice depth of 100 mm, and the movement of each billet is shown as a stream type in Figure 7. As shown in Figure 7a, the billets close to the rake bar moved upward with the rake bar, whereas those not filling the rake bar moved to both sides when the rake bar left the billet population. Other billets gradually moved along the inclined plane of the seed box towards the rake bar chain, forming two small circulation circles on both sides of the rake bar chain. An obvious circulation circle can be observed on the side view of the seed box (Figure 7b). When the rake bar left the billet population, the billets moved counterclockwise to return around the rake bar chain. It can be inferred that the more inclined the rake bar, the larger the circle, and the greater the probability of billets entering the rake bar. However, the high probability of multiple billets entering one rake bar will affect the seed-filling uniformity, which explains why there is an optimal value of the rake bar angle. In both physical and simulation experiments, the optimal angle of the rake bar was 117°.
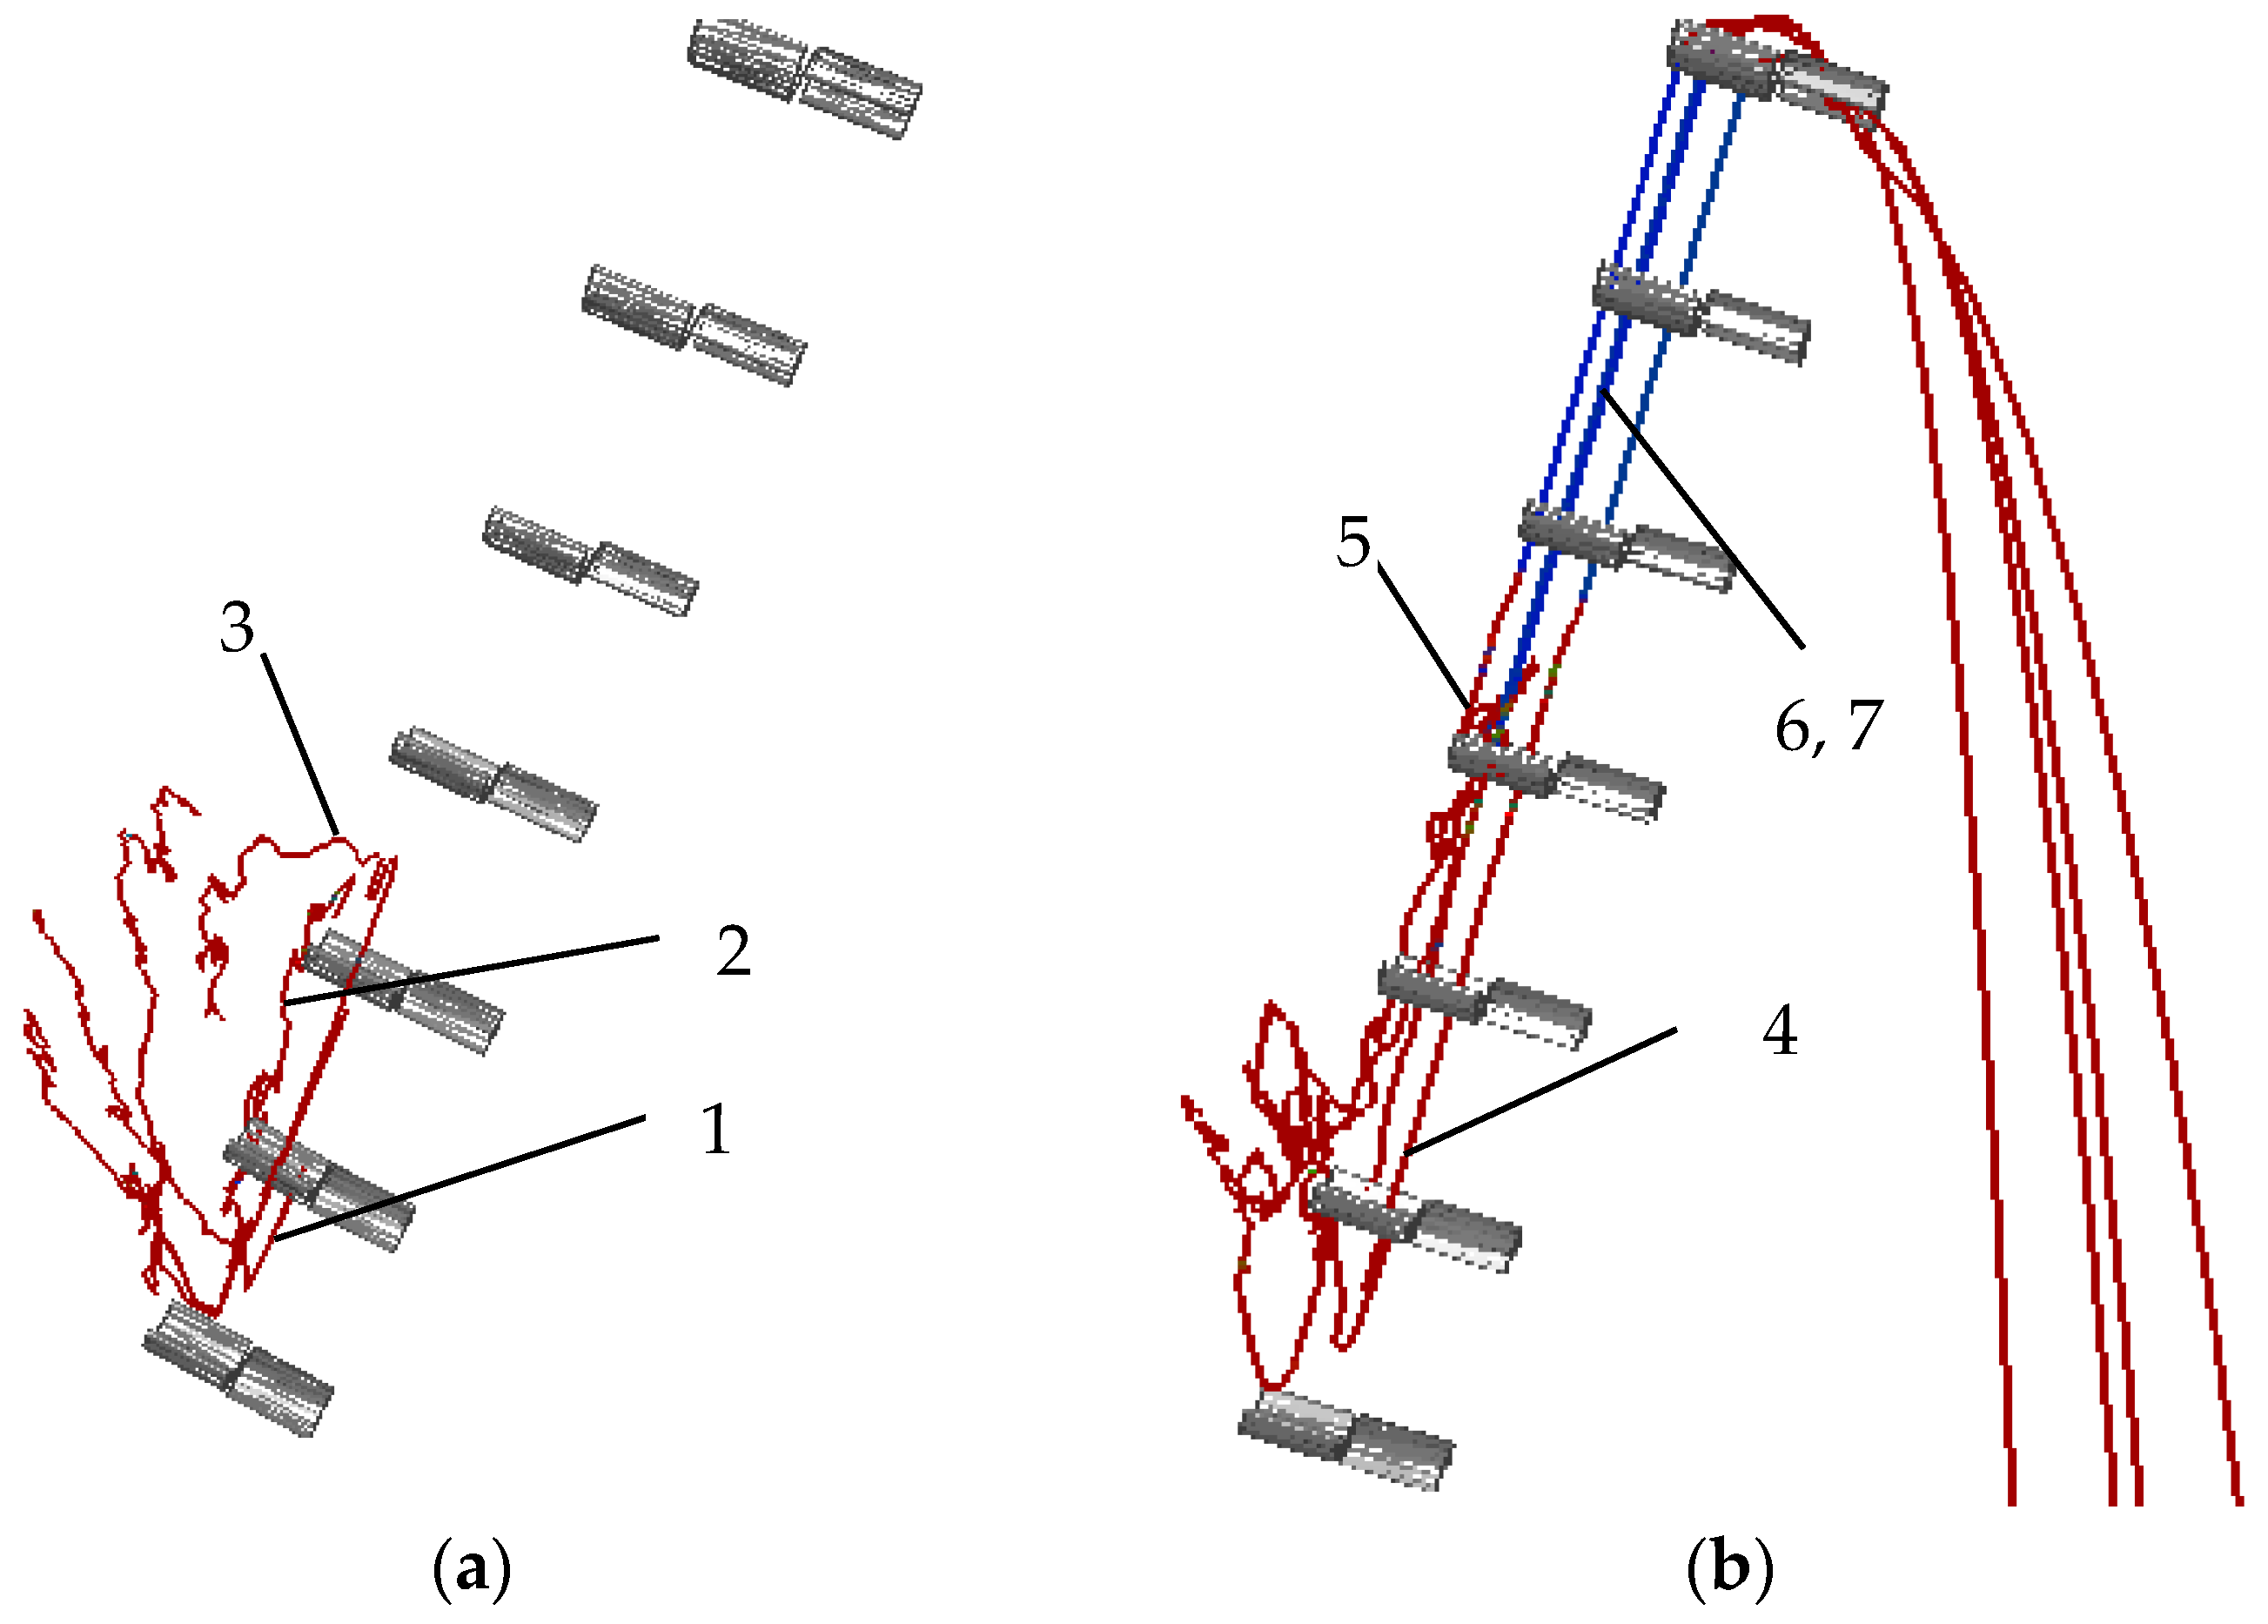
As shown in Figure 8, the single particle trajectory in the EDEM simulation was extracted by selecting the moving particle in the seed box. The trajectories of three billets that failed to enter the rake bar are shown in Figure 8a. Due to population friction, the three billets in the upper population gradually moved down close to the rake bar and then began to move upward following the rake bar. More specifically, billet 1 was far from the rake bar and quickly stopped moving; billet 2 did not enter the rake bar and remained in the upper population when the rake bar left the population; billet 3 entered the rake bar but quickly dropped back into the population.
Figure 8b shows the trajectory of four billets that successfully entered the rake bar. Billet 4 entered the rake bar while it was still inside the population; billet 5 entered the rake bar before it left the population; billets 6 and 7 entered the same rake bar at the same time, and their trajectories intersected until they fell. The color of the trajectory indicates the magnitude of acceleration, with the brown line indicating a greater acceleration magnitude than the blue line. When the four billets moved at a uniform speed with the rake bar, the acceleration was zero, and the trajectory was colored in blue. The comparison of Figure 6 and Figure 7 indicate that the trajectory of the billets entering or exiting the rake bar is included in the circulation. The larger the circulation circle, the easier it is for billets to enter the rake bar. Therefore, the seed-metering device can be improved to bring more billets close to the rake bar while covering the rake bar more to expand the circulation circle.
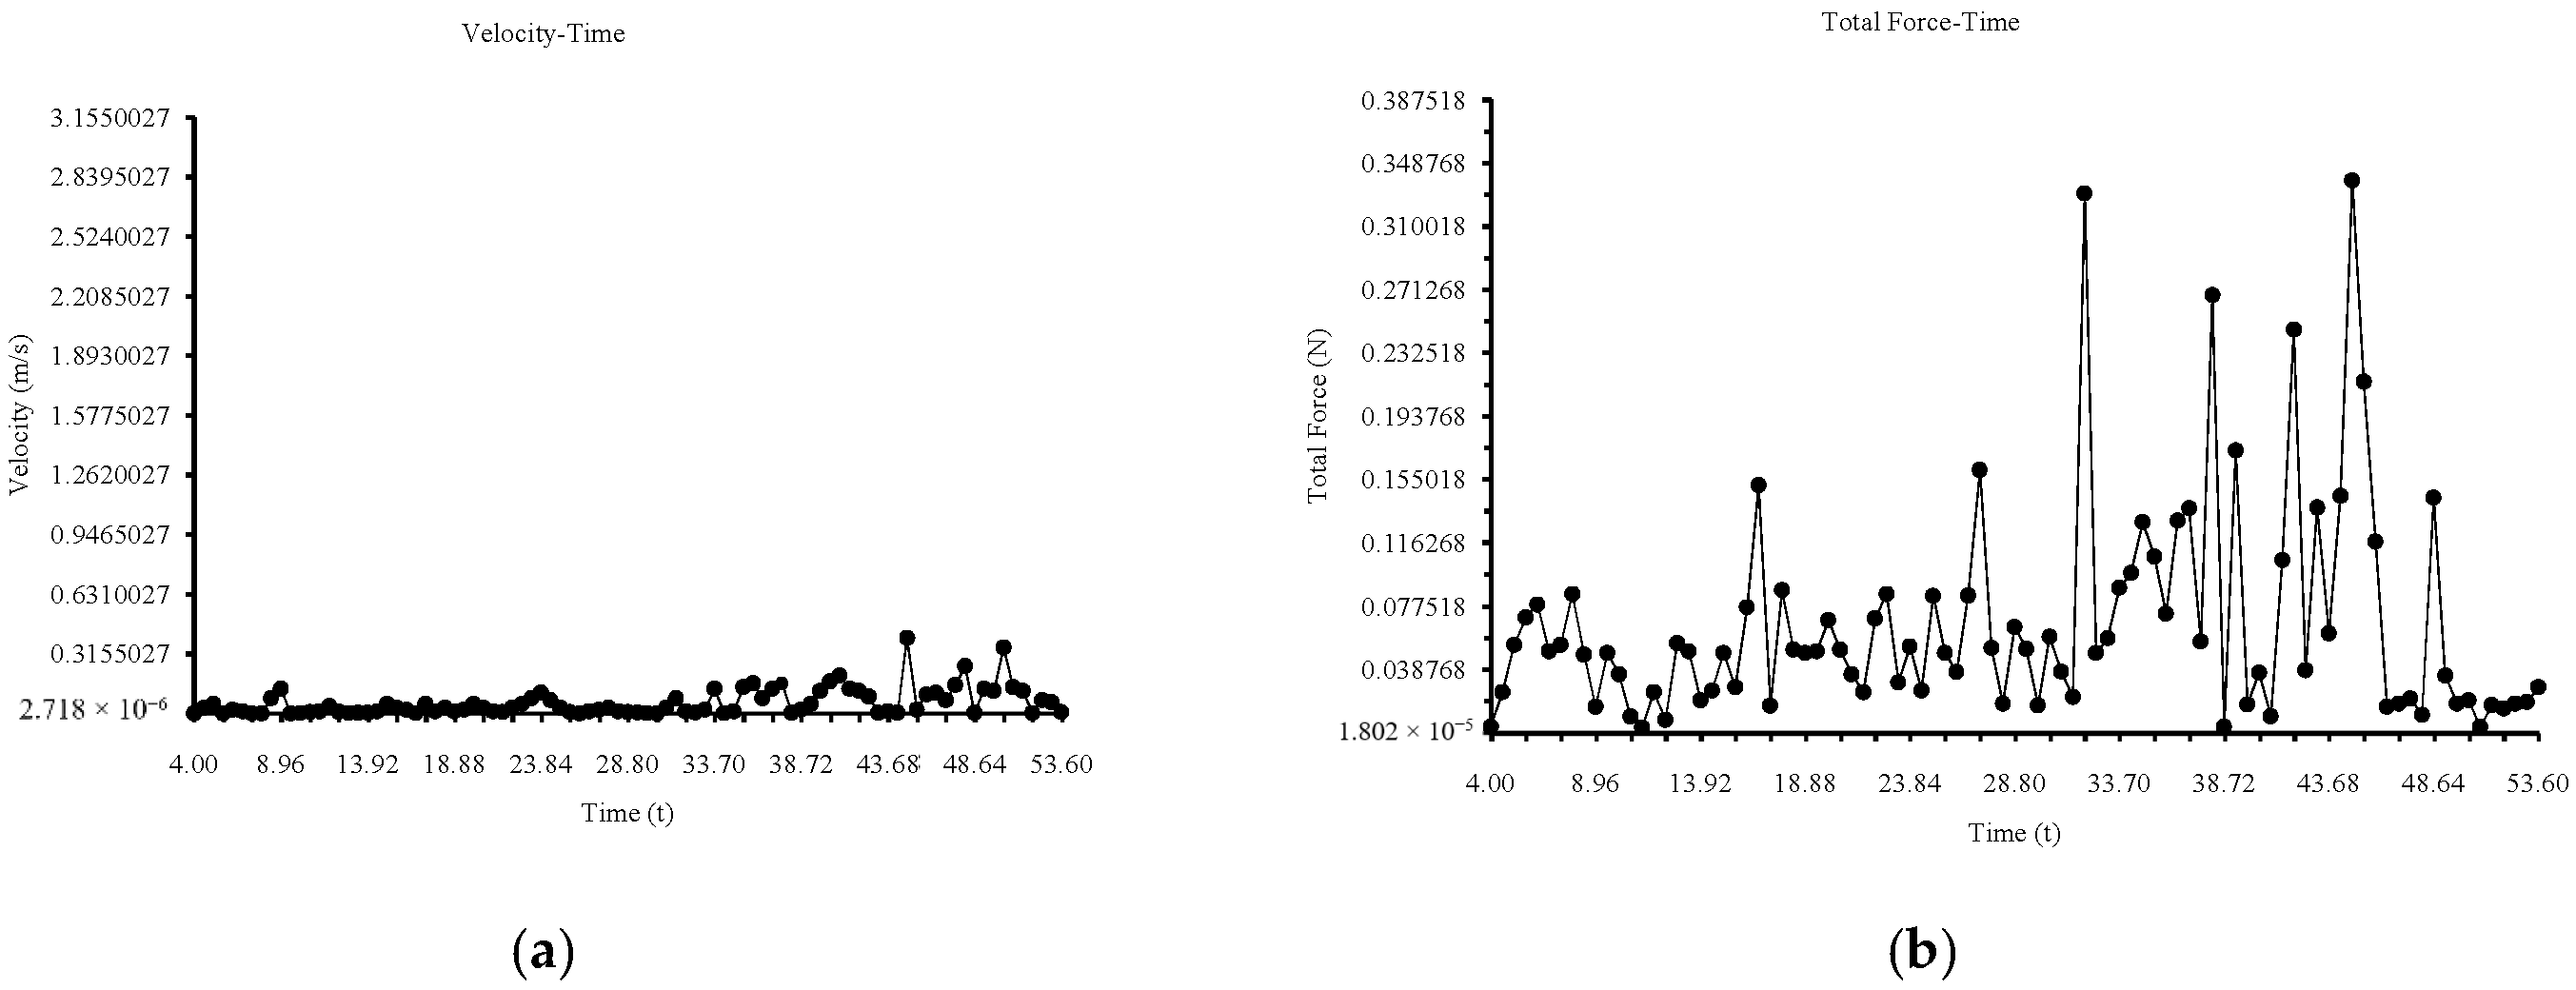
The velocity and total force of a random particle at a certain time can also be obtained in EDEM. Figure 9 shows the motion parameters of billet 3 in Figure 7a. After 4 s of particle generation, the rake bar began to move. Meanwhile, billet 3 moved downward at a slow speed due to population friction. The billet encountered the rake bar at the time of 30 s but did not enter it. The total force and velocity fluctuated several times due to the action of other rake bars.
Figure 10 shows the motion parameters of billet 4 in Figure 8b. Billet 4 was generated in the lower part of the population and subjected to the population friction from 4 s to 9 s, but the velocity was low, and the total force fluctuated slightly. The total force changed dramatically as billet 4 entered the rake bar at 9 s and followed the rake bar through the population at a uniform speed. Then, billet 4 and the rake bar left the population at 14 s. The velocity was constant, and the force was zero. At 19 s, billet 4 reached the highest point and began to fall, and its velocity rose rapidly until landing. By comparing Figure 8 and Figure 9, the billets that did not successfully enter the rake bar were affected more by forces, and whether this will cause damage to the billets needs further investigation.

4. Conclusions

In this paper, the seed-filling process of single-bud billets in the seed-metering device was simulated in EDEM. The single-bud billet particle model was established based on three filling spheres, the contact model was the Hertz-Mindlin (no slip), and there was no binding effect between billet particles. The physical and simulation experiments of the billet angle of repose were conducted, and the relative error of the physical and simulation results was 6.67%, indicating that the material parameters of single-bud billet are effective. Meanwhile, the seed-filling physical and simulation experiments were carried out, and the results showed that the linear correlation coefficient between the physical and simulation results was 0.762 for Sq and 0.869 for Se, which demonstrates the validity of using the EDEM software to simulate the seed-filling process of billets. Moreover, the motion information of the seed-filling process was analyzed in EDEM. The analysis results show that the seed box has two small circulation circles on both sides of the rake bar chain, and the larger the circulation circle, the easier it is for billets to enter the rake bar. Additionally, the seed-metering device can be improved to bring more billets close to the rake bar while covering the rake bar more to expand the circulation circle. The analysis of the total force simulation of billets in EDEM reveals that the billets that did not successfully enter the rake bar were affected more by forces; the damage to billets during the seed-filling process needs to be investigated in the future. This EDEM simulation method provides a basis for optimizing the structures and parameters of the sugarcane billet planter in future work.

Author Contributions

Conceptualization, Q.L. and Y.O.; methodology, M.W., X.Z. and Q.L.; data analysis, M.W.; writing—original draft preparation, M.W.; funding acquisition, Q.L. All authors have read and agreed to the published version of the manuscript.

Funding

This research was funded by National Key R&D Program of China (2020YFD1000600) and Guangdong Provincial Team of Technical System Innovation for Sugarcane Sisal Industry (2019KJ104-11).

Institutional Review Board Statement

Not applicable.

Informed Consent Statement

Not applicable.

Data Availability Statement

The data presented in this study are available on demand from the first author at ([email protected]).

Conflicts of Interest

The authors declare no conflict of interest.

References

  1. Saengprachatanarug, K.; Wongpichet, S.; Ueno, M.; Taira, E. Comparative discharge and precision index of a sugar cane billet planter. Appl. Eng. Agric. 2016, 32, 561–567. [Google Scholar] [CrossRef]
  2. Wang, M.; Liu, Q.; Ou, Y.; Zou, X. Experimental Study of the Seed-Filling Uniformity of Sugarcane Single-Bud Billet Planter. Sugar Tech. 2021, 23, 827–837. [Google Scholar] [CrossRef]
  3. Cundall, P.A.; Strack, O.D. A discrete numerical model for granular assemblies. Geotechnique 1979, 29, 47–65. [Google Scholar] [CrossRef]
  4. Zhou, L.; Yu, J.; Wang, Y.; Yan, D.; Yu, Y. A study on the modelling method of maize-seed particles based on the discrete element method. Powder Technol. 2020, 374, 353–376. [Google Scholar] [CrossRef]
  5. Owen, P.J.; Cleary, P.W. Prediction of screw conveyor performance using the Discrete Element Method (DEM). Powder Technol. 2009, 193, 274–288. [Google Scholar] [CrossRef]
  6. Xu, Y.; Zhang, X.; Wu, S.; Chen, C.; Wang, J.; Yuan, S.; Chen, B.; Li, P.; Xu, R. Numerical simulation of particle motion at cucumber straw grinding process based on EDEM. Int. J. Agric. Biol. Eng. 2020, 13, 227–235. [Google Scholar] [CrossRef]
  7. Shi, L.; Zhao, W.; Sun, B.; Sun, W. Determination of the coefficient of rolling friction of irregularly shaped maize particles by using discrete element method. Int. J. Agric. Biol. Eng. 2020, 13, 15–25. [Google Scholar] [CrossRef]
  8. Wang, Y.; Liang, Z.; Zhang, D.; Cui, T.; Shi, S.; Li, K.; Yang, L. Calibration method of contact characteristic parameters for corn seeds based on EDEM. Trans. Chin. Soc. Agric. Eng. 2016, 32, 36–42. [Google Scholar]
  9. Sun, J.; Chen, H.; Duan, J.; Liu, Z.; Zhu, Q. Mechanical properties of the grooved-wheel drilling particles under multivariate interaction influenced based on 3D printing and EDEM simulation. Comput. Electron. Agric. 2020, 172, 105329. [Google Scholar] [CrossRef]
  10. Yudao, L.I.; Shulun, X.I.N.G.; Shasha, L.I.; Liu, L.; Zhang, X.; Zhanhua, S.O.N.G.; Fade, L.I. Seeding performance simulations and experiments for a spoon-wheel type precision cottonseed-metering device based on EDEM. Mech. Eng. Sci. 2020, 2, 1–8. [Google Scholar] [CrossRef]
  11. Miao, Z.; Li, Z.; Xu, K.; Wu, L.; Su, N.; Song, G.; Liu, Y. The Numerical Simulation Analysis of Pinus sylvestris var. Mongolica seeds Vibration Situation Based on EDEM. Iop Conf. Ser. Earth Environ. Sci. 2019, 252, 052111. [Google Scholar] [CrossRef]
  12. Ghodki, B.M.; Goswami, T.K. DEM simulation of flow of black pepper seeds in cryogenic grinding system. J. Food Eng. 2017, 196, 36–51. [Google Scholar] [CrossRef]
  13. Horabik, J.; Parafiniuk, P.; Molenda, M. Stress profile in bulk of seeds in a shallow model silo as influenced by mobilisation of particle-particle and particle-wall friction: Experiments and DEM simulations. Powder Technol. 2018, 327, 320–334. [Google Scholar] [CrossRef]
  14. Li, H.; Zeng, S.; Luo, X.; Fang, L.; Liang, Z.; Yang, W. Design, DEM simulation, and field experiments of a novel precision seeder for dry direct-seeded rice with film mulching. Agriculture 2021, 11, 378. [Google Scholar] [CrossRef]
  15. Lu, F.; Ma, X.; Qi, L.; Tan, S.; Tan, Y.; Jiang, L.; Sun, G. Parameter optimization and experiment of vibration seed-uniforming device for hybrid rice based on discrete element method. Trans. Chin. Soc. Agric. Eng. 2016, 32, 17–25. [Google Scholar]
  16. He, Y.; Li, C.; Zhao, X.; Gao, Y.; Li, S.; Wang, X. Simulation analysis of the fertilizer ejecting device of corn fertilizer applicator based on EDEM. J. Phys. Conf. Ser. 2020, 1633, 012061. [Google Scholar] [CrossRef]
  17. Liu, J.S.; Gao, C.Q.; Nie, Y.J.; Yang, B.; Ge, R.Y.; Xu, Z.H. Numerical simulation of Fertilizer Shunt-Plate with uniformity based on EDEM software. Comput. Electron. Agric. 2020, 178, 105737. [Google Scholar] [CrossRef]
  18. Liu, T.; He, R.; Lu, J.; Zou, Y.; Zhao, M. Simulation and verification on seeding performance of nest hole wheel seed-metering device based on EDEM. J. South China Agric. Univ. 2016, 37, 126–132. [Google Scholar]
  19. Liu, Q.T.; Ou, Y.G.; Qing, S.L.; Chen, H.B. Failure tests of sugarcane stalks under torsion, compression and tension load. Trans. CSAE 2006, 6, 201–204. [Google Scholar]
  20. Fengwei, G.; Youqun, Z.; Feng, W.; Zhichao, H.; Lili, S. Simulation analysis and experimental validation of conveying device in uniform rrushed straw throwing and seed-sowing Machines using CFD-DEM coupled approach. Comput. Electron. Agric. 2022, 193, 106720. [Google Scholar] [CrossRef]
  21. Wang, M.; Liu, Q.; Ou, Y.; Zou, X. Determination of physical and mechanical properties of sugarcane single-bud billet. arXiv 2022, arXiv:2203.16916. Available online: https://arxiv.org/abs/2203.16916 (accessed on 31 March 2022).
  22. Chen, S.; Cao, S.; Gao, K.; Cao, W.; Cui, S.; Ma, J. Research on Wheat Modeling Method Based on EDEM. In Proceedings of the Journal of Physics. Conference Series (Online), Wetherby, UK, 6 February 2021; Volume 1798, p. 012048. [Google Scholar] [CrossRef]
  23. Guo, Z.; Chen, X.; Liu, H.; Guo, Q.; Guo, X.; Lu, H. Theoretical and experimental investigation on angle of repose of biomass–coal blends. Fuel 2014, 15, 131–139. [Google Scholar] [CrossRef]
  24. Matuttis, H.G.; Luding, S.; Herrmann, H.J. Discrete element simulations of dense packings and heaps made of spherical and non-spherical particles. Powder Technol. 2000, 109, 278–292. [Google Scholar] [CrossRef]
  25. Al-Hashemi, H.M.; Al-Amoudi, O.S. A review on the angle of repose of granular materials. Powder Technol. 2018, 1, 397–417. [Google Scholar] [CrossRef]
  26. Tan, Y.; Yu, Y.; Fottner, J.; Kessler, S. Automated measurement of the numerical angle of repose (aMAoR) of biomass particles in EDEM with a novel algorithm. Powder Technol. 2021, 388, 462–473. [Google Scholar] [CrossRef]
  27. Zhou, L.; Yu, J.; Liang, L.; Wang, Y.; Yu, Y.; Yan, D.; Sun, K.; Liang, P. DEM Parameter Calibration of Maize Seeds and the Effect of Rolling Friction. Processes 2021, 9, 914. [Google Scholar] [CrossRef]
  28. Wenzheng, L.; Jin, H.; Hongwen, L.; Xueqiang, L.I.; Kan, Z.H.; Zhongcai, W.E. Calibration of simulation parameters for potato minituber based on EDEM. Trans. Chin. Soc. Agric. Mach. 2018, 49, 125–135. [Google Scholar]
  29. Du, Y.; Cui, T.; Zhang, D.; Wei, Y.; Yang, R.; Wu, H. Establishment and Parameter Calibration of Broad Bean Seeds Simulation Particles in EDEM. In 2019 ASABE Annual International Meeting; American Society of Agricultural and Biological Engineers: St. Joseph, MI, USA, 2019; Volume 1. [Google Scholar] [CrossRef]
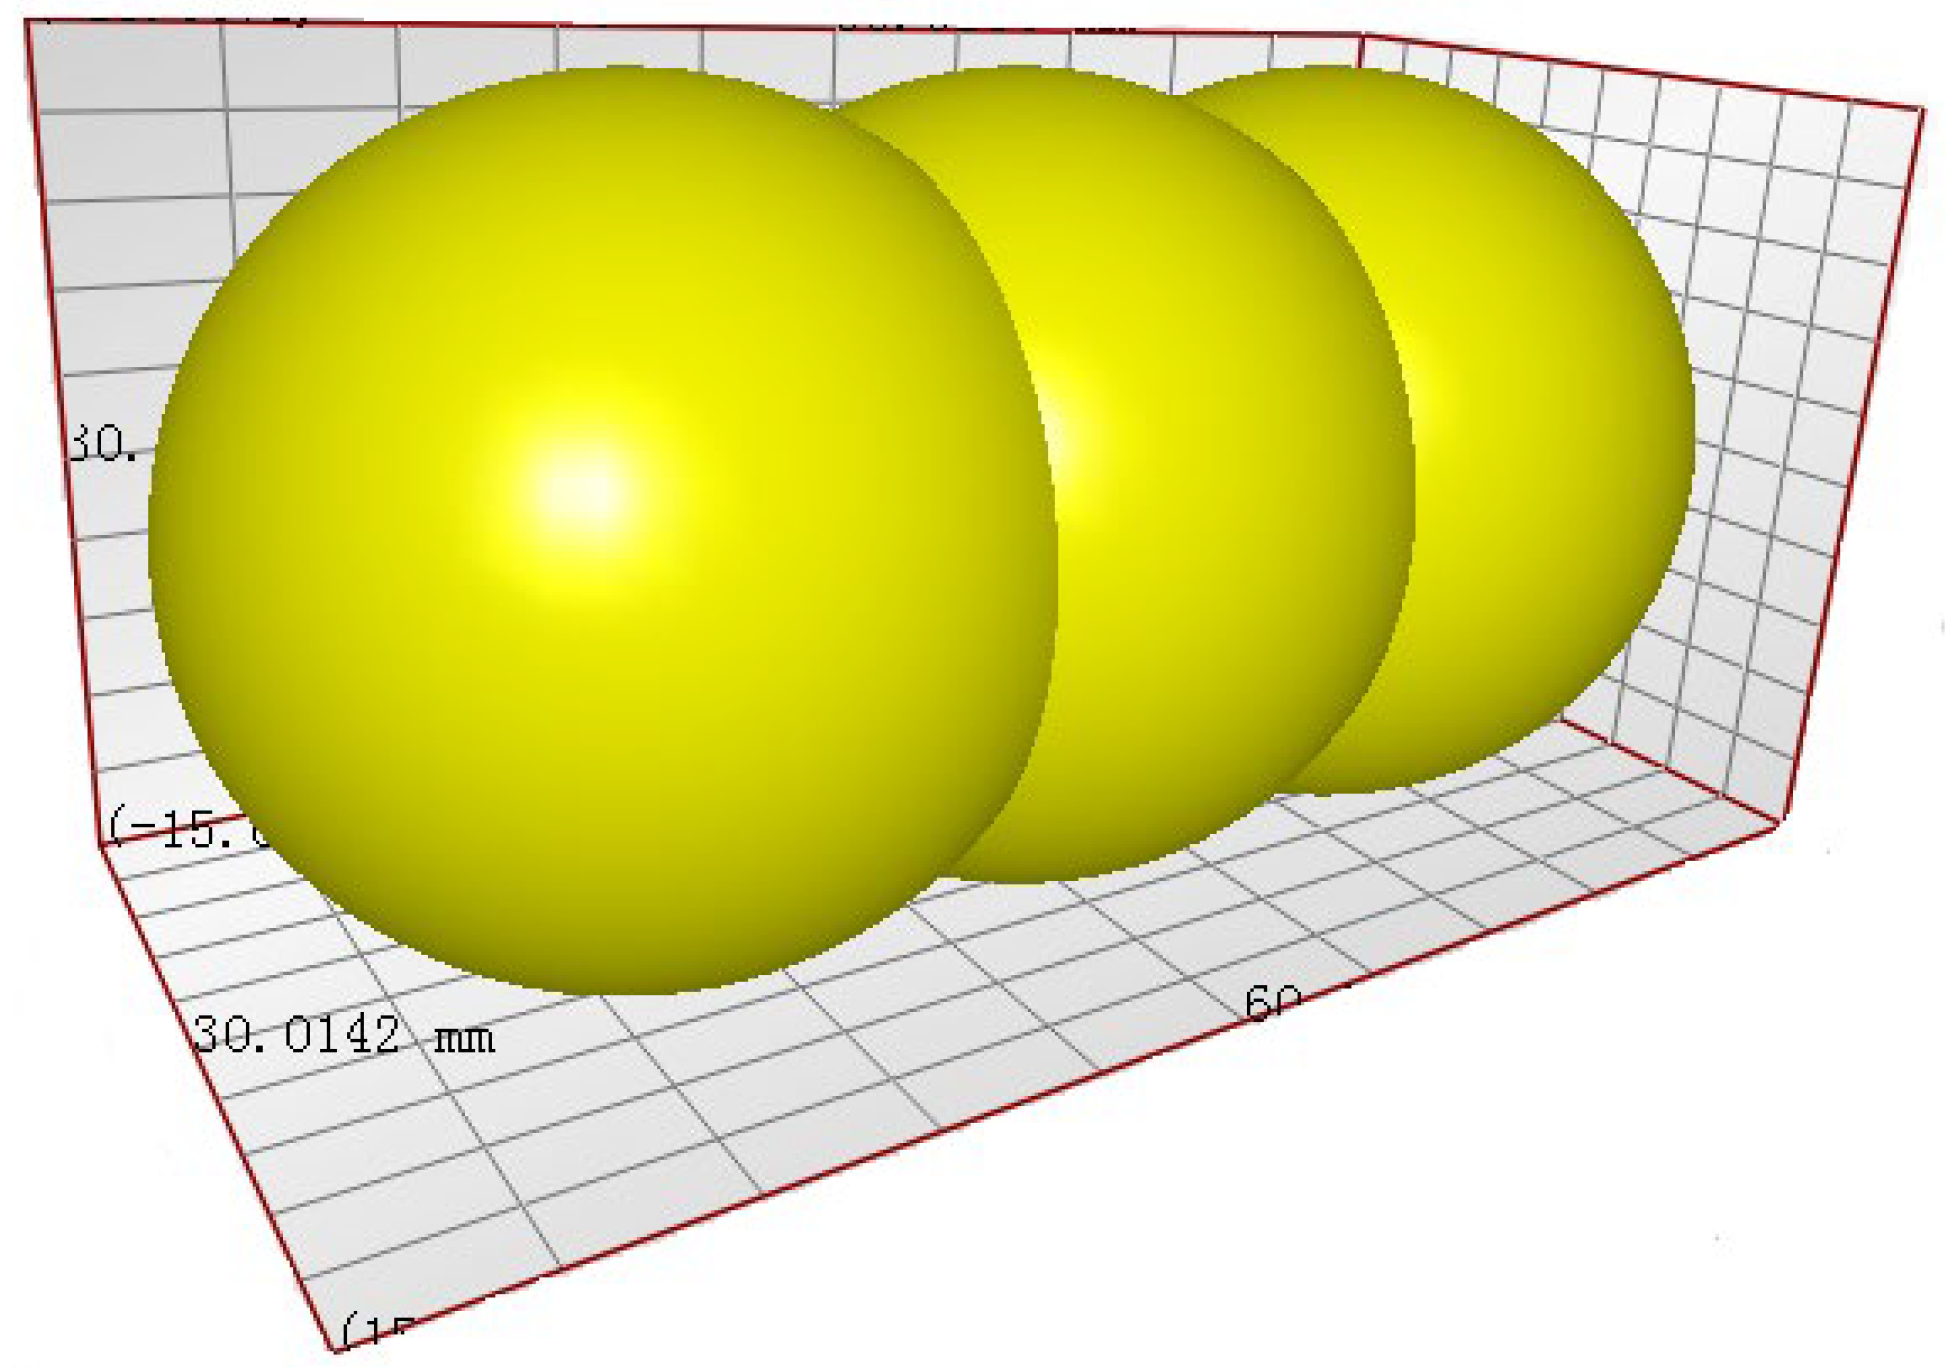
Figure 1. Model diagram of single-bud billet.
Agriculture 12 00983 g001
Figure 2. Model diagram of seed-metering device.
Agriculture 12 00983 g002
Figure 3. Generation of single-bud billets model’s pile for simulation.
Agriculture 12 00983 g003
Figure 4. The physical seed-filling experiment setup.
Agriculture 12 00983 g004
Figure 5. The relationship between the angle of the rake bar chain and the qualification filling rate Sq and the miss out filling rate Se.
Agriculture 12 00983 g005
Figure 6. Motion simulation results.
Agriculture 12 00983 g006
Figure 7. The simulated motion of billets in the seed-filling process. (a) Front view of the seed box; (b) side view of the seed box.
Agriculture 12 00983 g007
Figure 8. The trajectory of the selected billets in the seed-filling process. (a) The trajectory of the billet that did not enter the rake bar; 1: billet 1; 2: billet 2; 3: billet 3; (b) the side view of the trajectory of the billet that entered the rake bar; 5: billet 5; 6: billet 6; 7: billet 7.
Agriculture 12 00983 g008
Figure 9. The motion of billet 3 with time (a) the velocity of billet 3; (b) the total force of billet 3.
Agriculture 12 00983 g009
Figure 10. The motion of billet 4 with time (a) the velocity of billet 4; (b) the total force of billet 4.
Agriculture 12 00983 g010
Table 1. The setting of the material physical and contact mechanical property parameters.
MaterialsParameterValue
BilletPoisson’s ratio0.344
Shear modulus (Pa)1.08 × 10⁷
Density (kg/m3)244.67
SteelPoisson’s ratio0.3
Shear modulus (Pa)7.9 × 10¹⁰
Density (kg/m3)7850
Billet–billetCoefficient of restitution0.668
Static friction coefficient0.352
Rolling friction coefficient0.026
Billet–steelCoefficient of restitution0.572
Static friction coefficient0.377
Rolling friction coefficient0.039
Publisher’s Note: MDPI stays neutral with regard to jurisdictional claims in published maps and institutional affiliations.