Article

Impact of Climate Change on Food Security in Kazakhstan

1
College of Agronomy, Northwest A&F University, Xianyang 712100, China
2
Shaanxi Engineering Research Center of Circular Agriculture, Xianyang 712100, China
3
College of Pharmacy, Astana Medical University, Nur-Sultan 010000, Kazakhstan
4
College of Agronomy, S. Seifullin Kazakh Agro-Technical University, Nur-Sultan 010000, Kazakhstan
*
Author to whom correspondence should be addressed.
Agriculture 2022, 12(8), 1087; https://doi.org/10.3390/agriculture12081087
Submission received: 14 June 2022 / Revised: 19 July 2022 / Accepted: 22 July 2022 / Published: 23 July 2022
(This article belongs to the Section Agricultural Product Quality and Safety)

Abstract

:
Global food production faces immense pressure, much of which can be attributed to climate change. A detailed evaluation of the impact of climate change on the yield of staple crops in Kazakhstan, a major food exporter, is required for more scientific planting management. In this study, the Mann–Kendall test and Theil–Sen Median slope were used to determine climate trends and staple food yields over the past 30 years; random forest was used to analyze the importance of monthly climatic factors; states were classified according to climatic factors through systematic clustering method; and lastly, the influence of climate on yield was analyzed using panel regression models. The upward trend in wind speed and potato yield throughout Kazakhstan was apparent. Furthermore, barley and wheat yields had increased in the southeast. We determined that for wheat, frostbite should be prevented after the warmer winters in the high-latitude areas. Except for July–August in the low-latitude areas, irrigation water should be provided in the other growth periods and regions. As similar effects were reported for barley, the same preventive measures would apply. For potatoes, tuber rot, caused by frost or excessive precipitation in May, should be prevented in high-latitude areas; soil dryness should be alleviated during the germination and seedling stages in low-latitude areas; and irrigation and cooling should be maintained during tuber formation and maturation. Furthermore, hot dry air in March and April could damage the crops.

1. Introduction

Food security is essential for world peace and development and is the cornerstone of a community with a shared future for mankind [1]. In 2015, following the end of the Millennium Development Goals (MDGs), the United Nations (UN) established the Sustainable Development Goals (SDGs) to guide global development until 2030. The follow-up goal of SDGs is “Zero Hunger” and the objective is to eradicate hunger, achieve food security, improve nutrition, and promote sustainable agricultural development [2]. The production performance of major food exporters has attracted widespread attention owing to the importance of food security to the international community [3]. Climate change is closely associated to food security, and several attempts have been made to avoid the potential risks of climate change on crop production to maintain a stable food supply [4]. A study on the vulnerability of global crop yields to climate change shows that climate change could reduce global crop yields by 3–12% by mid-century and 11–25% by century’s end [5]. Climate change was found to negatively impact household food security in the regions of Africa where crop production is heavily dependent on environmental factors [6]. Further, extreme temperatures can have an impact on food availability and prices [7]. Accurately assessing and predicting the impact of climate change on food production is crucial to reducing food security risks [8].
Kazakhstan, known as the breadbasket of Central Asia and Eastern Europe, is a major food producer [9]. According to the Food and Agriculture Organization (FAO) database [10], in 2020, Kazakhstan produced 14.26 × 10⁶ t of wheat and 3.66 × 10⁶ t of barley and exported 5.2 × 10⁶ t of wheat, 1.75 × 10⁶ t of flour, and 0.98 × 10⁶ t of barley, contributing substantially to world food security. Meanwhile, climate change and its impact on food production in Kazakhstan have also attracted the attention of a few scholars. A 70-year climate change analysis in Kazakhstan revealed that the average annual temperature increased by 0.28 °C year−1, maximum warming occurred in winter, annual precipitation showed a weak downward trend, and high and low temperatures increased catastrophically between 2000 and 2011 [11]. Pavlova et al. [12] simulated the effects of climate change on spring wheat yields in Russia and the Kazakh steppe regions (mainly in the north), whereas Marat et al. [13] analyzed the effects of drought caused by climate change in Eurasia on wheat production in Kazakhstan. Moreover, Florian [14] quantified the effects of climate change on the wheat and barley yields of four states in northern Kazakhstan using panel regressions.
Although the impact of climate change on food production in Kazakhstan has garnered immense attention, ongoing research on this subject remains insufficient. Moreover, these studies are focused on a few regions of Kazakhstan or on a limited number of crop varieties, and thus lack integrity. In order to determine the impact of climate change on a variety of major food crops in Kazakhstan, we identified the staple crops in Kazakhstan; examined the variations in climatic factors and staple crop yields in the past 30 years using the Mann–Kendall test (MK) and Theil–Sen Median slope (Sen); used random forest (RF) to rank the monthly climate impact on staple crops; classified regions based on the climatic factors during important growth months using systematic clustering method; and finally, assessed the impact of climatic factors on staple crops during important months using panel regression models (fixed or random model were selected by referring to the climate change trend). In this study, we gave full consideration to the background of climate change and systematically analyzed its impact on the yield of staple crops in Kazakhstan. Our findings provide a reference for practical agricultural production management and method reference for simplifying climate data, while bridging the gaps in academic knowledge.

2. Materials and Methods

2.1. Overview of the Study Area

Kazakhstan, located in the center of Eurasia, and covering an area of 2.72 × 10⁶ km2. Currently, Kazakhstan has 14 states and 3 cities (Figure 1). Kazakhstan implements extensive agricultural production management (Table 1). Chemical fertilizers and pesticides are rarely used; however, the country’s irrigation facilities are imperfect.
Wheat, barley, and potatoes are staple crops in Kazakhstan. Wheat and barley are mainly produced in Akmola, North Kazakhstan, and Kostanay. Additionally, barley is grown intensively in Almaty and Zambyl. Potato production mainly occurred in East Kazakhstan, Pavlodar, Almaty, North Kazakhstan, and Karagandy [16].

2.2. Data Sources

The food crops data for 2003–2020 was obtained from Agriculture, Forestry, and Fisheries in the Republic of Kazakhstan [16], and the precipitation data were obtained from Environmental Protection in the Republic of Kazakhstan [17]. The temperature and wind speed data for 1990–2020 were obtained from the National Center for Environmental Information (NCEI) website of the National Oceanic and Atmospheric Administration (NOAA) [18]. All the data were averaged by state, and a total of 36 climatic factors were identified as independent variables (12-month temperature, precipitation and wind speed: T1–T12, P1–P12, and W1–W12,) and 3 staple food yield factors (wheat, barley, and potato yields as WY, BY, and PY, respectively, Figure 2). This study involves 18 years (2003–2020) of data from 17 regions (14 states and 3 cities Figure 1), with a total of 281 available samples.

2.3. Method Processing

Step 1: Mann–Kendall Test (MK) and Theil–Sen Median Slope (Sen)
Trend testing and regression analysis form a classical combination of climate and yield issues. Frank et al. [19] used the MK trend test and multiple linear regression analysis to study the effect of climate variability on the yield of staple crops in northern Ghana. In a study on agrometeorological changes in Scandinavia, the MK test was used to analyze changes in the monthly cloudiness, precipitation, and solar radiation [20]. Although MK has high sensitivity toward the detection of changes in the indicators, the f trend is not descriptive; thus, the Sen slope can be used as a supplement [21].
In this study, MK test and Sen slope were used to analyze the changes in climate and yields of the staple crops. The index data is considered in sequence by time X = {x1, x2, …, xn}(ni > j ≥ 1), and the MK test was calculated as follows [22]:
MK = i = 1 n 1 j = i + 1 n f x i x j ,  
where, f x i x j = 1 , when x i x j > 0 ; f x i x j = 0 , when x i x j = 0 ; and f x i x j = −1, when x i x j < 0 . The indicator follows an upward trend when MK > 0, a downward trend when MK < 0, and no change in trend when MK = 0; the larger the absolute value of MK, the more severe the trend.
The formula for the Sen slope was as follows [23]:
Sen = Median x i x j i j ,  
where the indicator followed an upward trend when Sen > 0, a downward trend when Sen < 0, and no change in trend when Sen = 0.
Step 2: Random Forest (RF) Importance Ranking
RF is a machine learning algorithm based on a set of decision trees that randomly select samples according to a certain proportion (generally 7:3) to form a training set and a test set [24]. The decision tree is generated through a recurring binary partitioning of the dataset, with each partition based on a different subset of features (part of prediction variables). At each tree node, a partitioning of the dataset is performed based on a feature. Whenever nodes reach a pre-defined class purity level (there exists a single class of output in the node) it is terminated and the test ceases [25].
An important advantage of using RF is that it can calculate the relative importance of variables. Change the value of one predictor (independent variable) at a time. When the training set generates trees, the test set categories can be estimated and compared with the real test set categories to obtain the out-of-bag prediction (OOB) errors. The importance of each variable is determined using the following formula [26]:
Ij = a(OOBj) − a(OOBj’),
where Ij is the drop in model accuracy after the j index is permuted, a(OOBj) is the model accuracy in the normal state of j, and a(OOBj’) is the model accuracy after j is permuted. In this study, two important indicators, %IncMSE (increase in mean squared error) and IncNodePurity (increase in node purity, measured using the residual sum of squares), were selected as reference. The importance of the indicators increased with %IncMSE and IncNodePurity.
The above-mentioned steps were completed using RStudio (Desktop, Open-source edition, https://www.rstudio.com/products/rstudio/download/(accessed on 20 June 2021)).
Step 3: Squared Euclidean Distance (ED2) and Ward Linkage (WL)
Thereafter, SPSS (SPSS26, IBM, Armonk, NY, USA) was used to systematically cluster the 14 states according to important climatic factors.
ED 2 = m = 1 k x 1 m x 2 m 2 ,  
where k is the number of important climatic factors and x1 and x2 are two different regions. Regions with extremely similar climatic characteristics were first grouped into clusters which were subsequently calculated as:
WL = z = 1 p c z 2 1 p z = 1 p c z 2 ,  
where p is the number of clusters and the mid-point of each cluster (the mean values of climate indicators of all states in this cluster) was used for calculation.
Step 4: Panel Regression Models
Lastly, panel regression models were used to study the impact of climatic factors on the productivity of staple crops in different regions.
The panel data integrates both time and individual dimensions, which can solve the problem of missing variables by observing and controlling the “heterogeneity” of individuals [27,28]. The panel model has been used repeatedly in macroscopic fields such as economy, industry, policy, and market, leading to the gradual maturity of its theory and application. Common panel regression models are divided into pooled model (POOL), fixed effect model (FE), and random effect model (RE). The Hansman test was used to determine whether to choose FE or RE [29,30].
This study selected RE and FE and referred to the Hansman test and the change trends (MK and Sen) to determine the appropriate regression models. FE assumes that the explanatory variables are related to individual differences and excludes the influence by setting a dummy variable for the intercept of different sections.
y it λ y ¯ i = β 0 1 λ + β 1 + + β k x kit λ x ¯ ki + u it λ u ¯ i ,  
u it = v i + ε it
where k is the number of important climatic factors, λ = 1 in FE, vi is individual characteristics of each state, and ɛit is random error.
RE considers error term to be uncorrelated with the explanatory variable. The dummy variable contains the average effect of section random error term and time error term:
λ = 1 σ ε σ ε 2 + T σ υ 2 ,  
u it = a i + ε it ,  
where ai is time error term and has nothing to do with individual differences among states, ɛit is random error.

3. Results

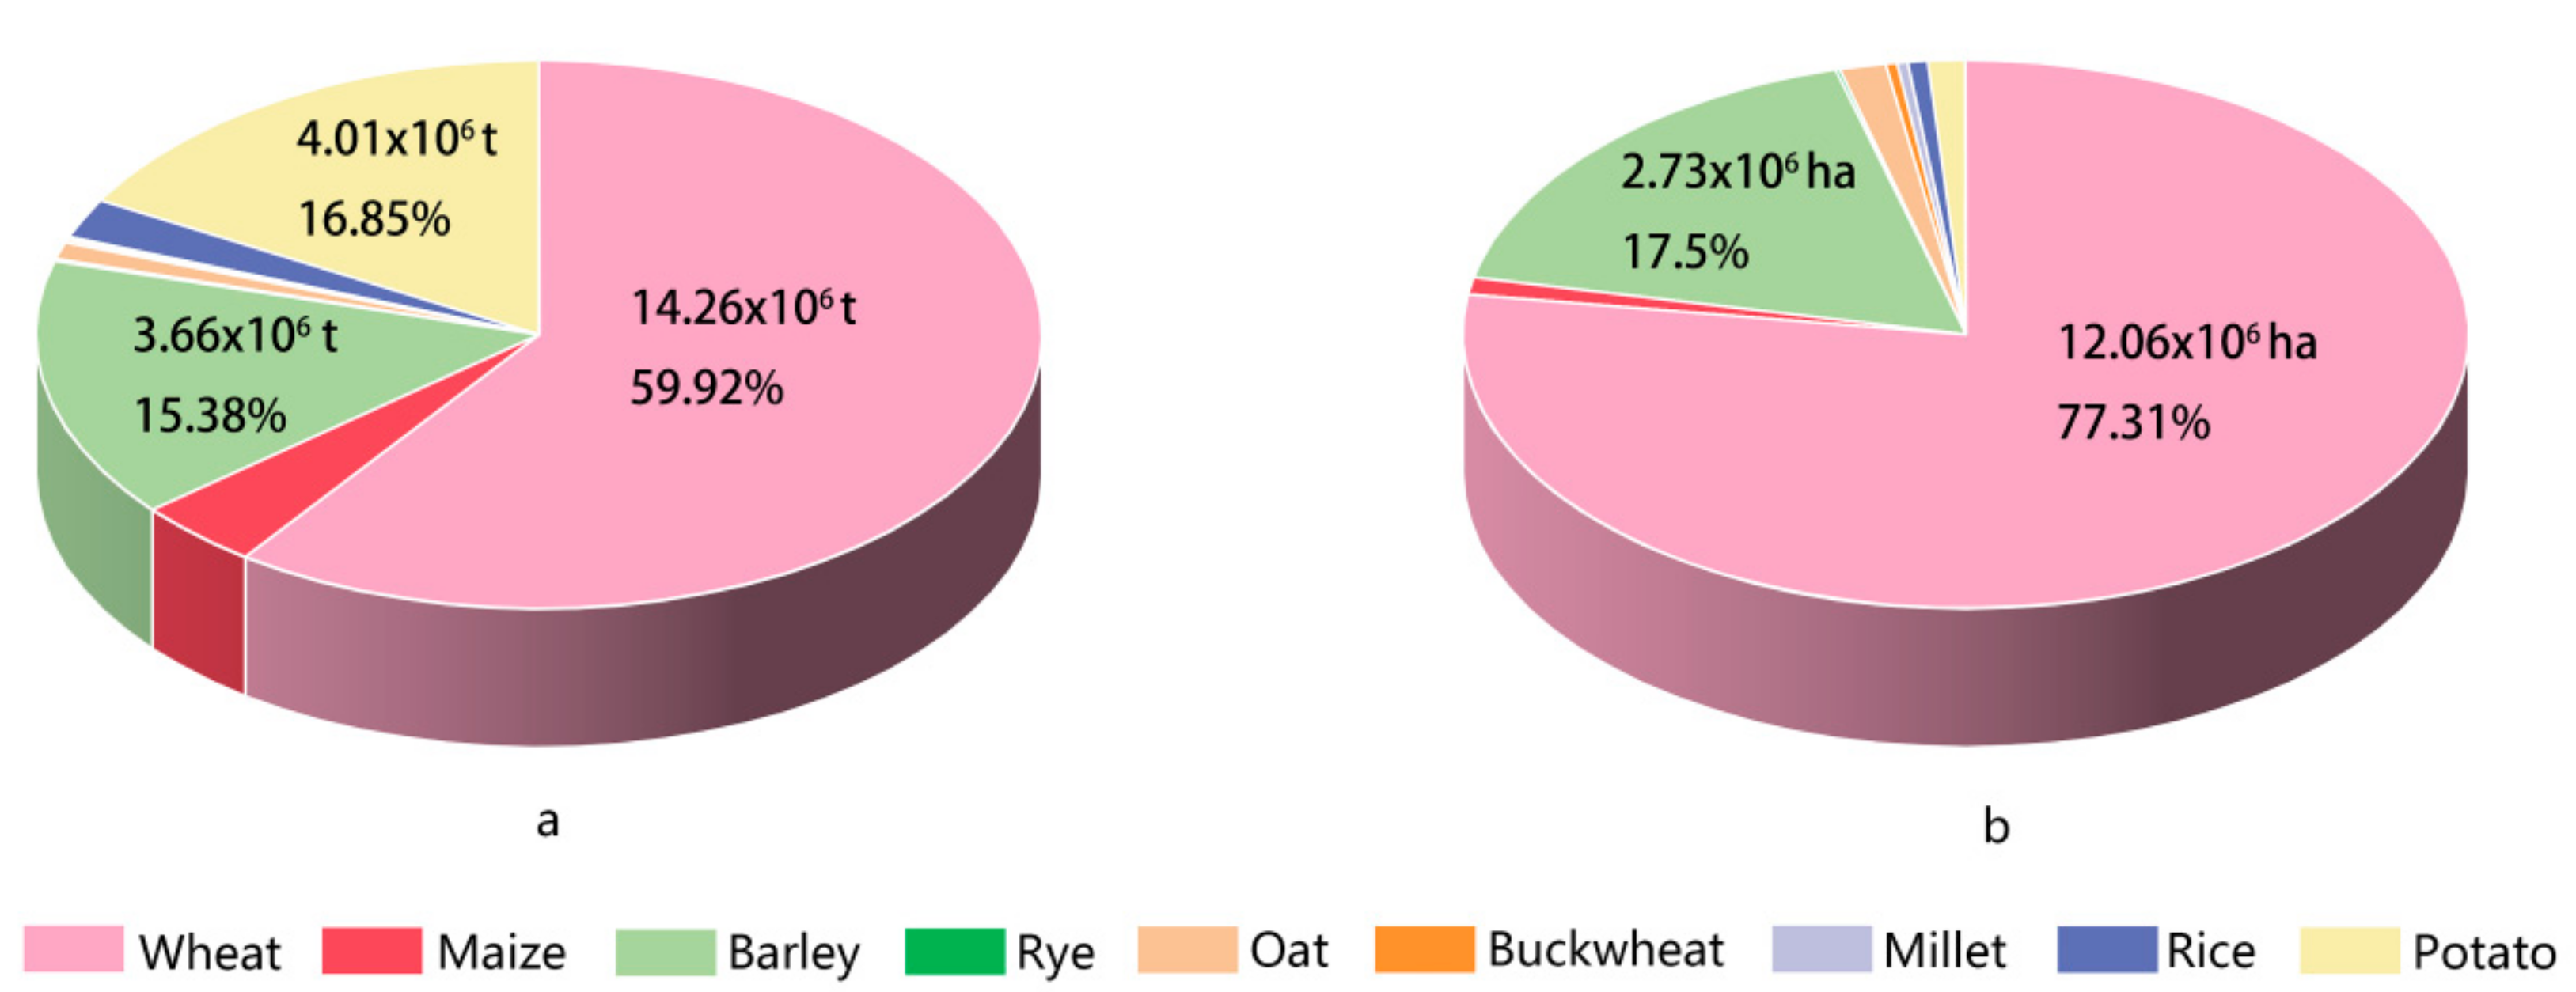
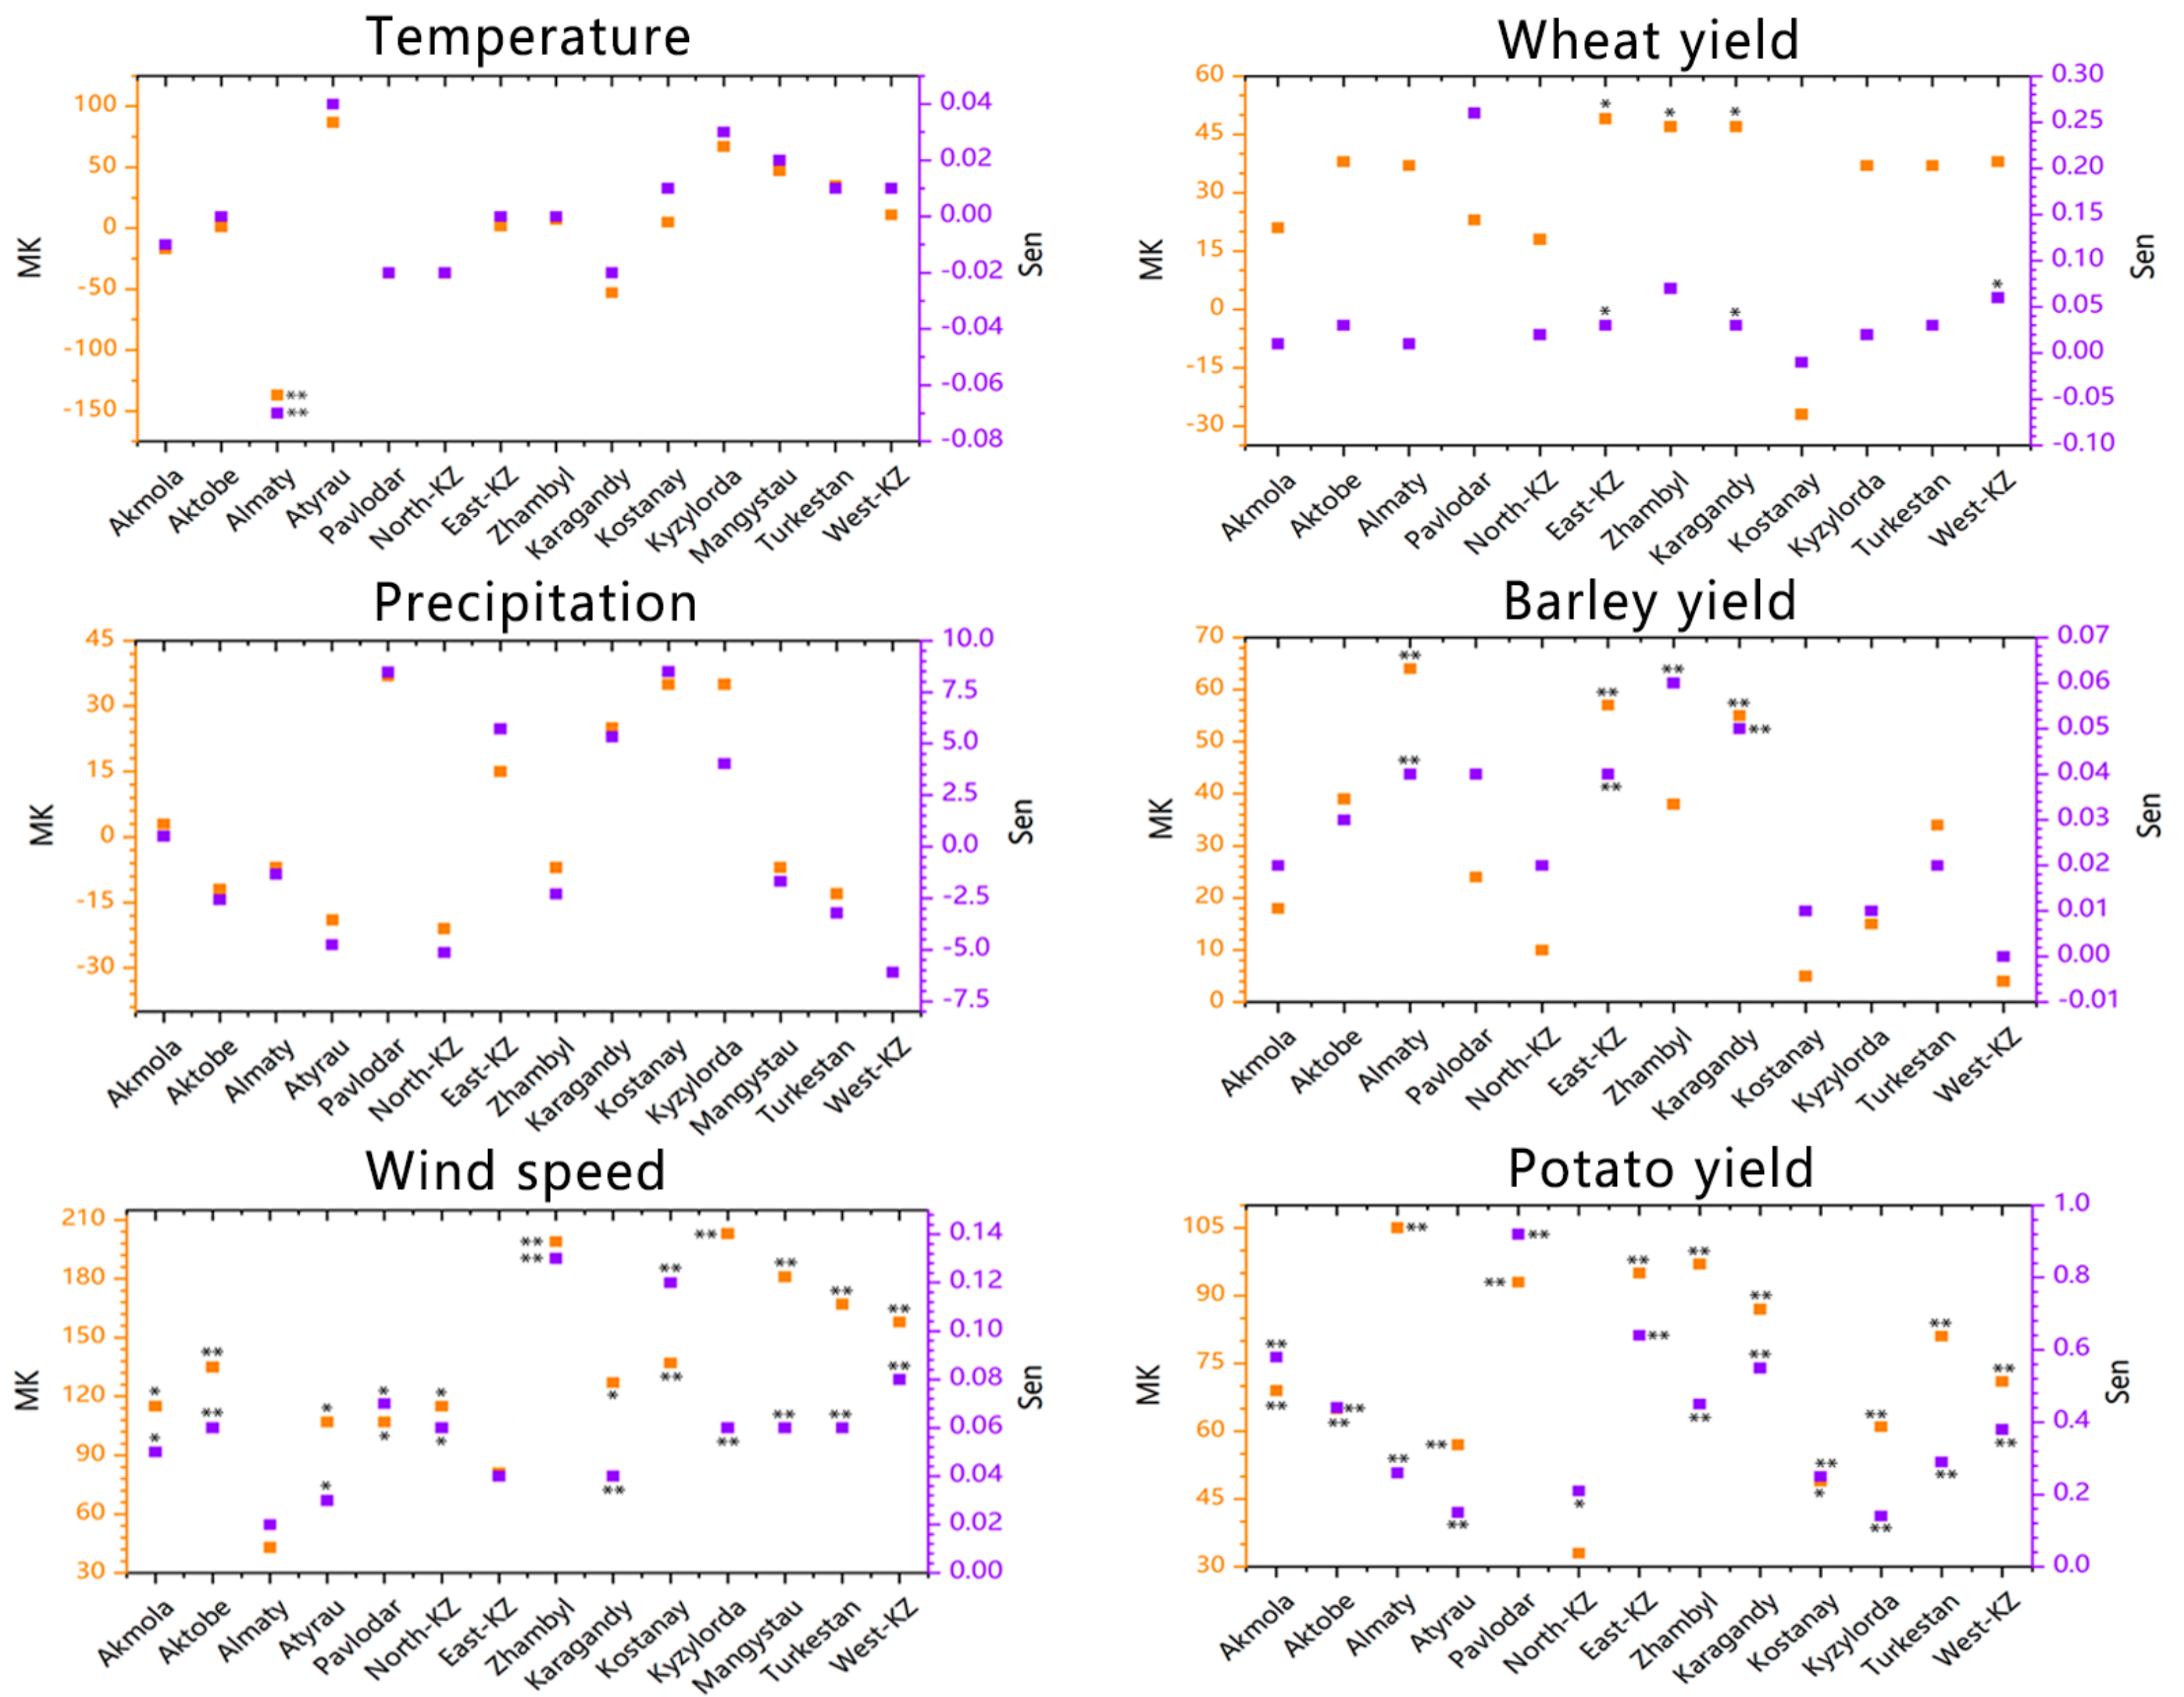
3.1. Climate and Changes in Staple Food Yields

The MK was in good agreement with Sen (Figure 3): (1) temperature in Almaty showed an obvious downward trend; (2) there was no significant trend for precipitation in each state; (3) only Almaty and East Kazakhstan showed no significant trend for wind speed; (5) the productivity of barley in Almaty (0.04 t ha−1 year−1), East Kazakhstan (0.04 t ha−1 year−1), and Karaganda (0.05 t ha−1 year−1) increased significantly; additionally, the Sen in Zhanbyl was highly significant (p = 0.01), but MK (p = 0.06) was not; (6) except for Mangystau, North-Kazakhstan (where Sen was significant) and Kostanay (where MK was significant and Sen was highly significant), there was a highly significant upward trend in potato productivity in other states.
In summary, barring a few eastern states, the entire territory of Kazakhstan displayed an upward trend in wind speed. Therefore, arable land could face heavier damage from wind erosion in the future. Although there are mountains in the east, the central, northern, and southern regions are plains, while the west is lowland and is thus characterized with weak wind erosion resistance. Wheat and barley productivity increased in the south-eastern regions, whereas potato productivity increased throughout the country.

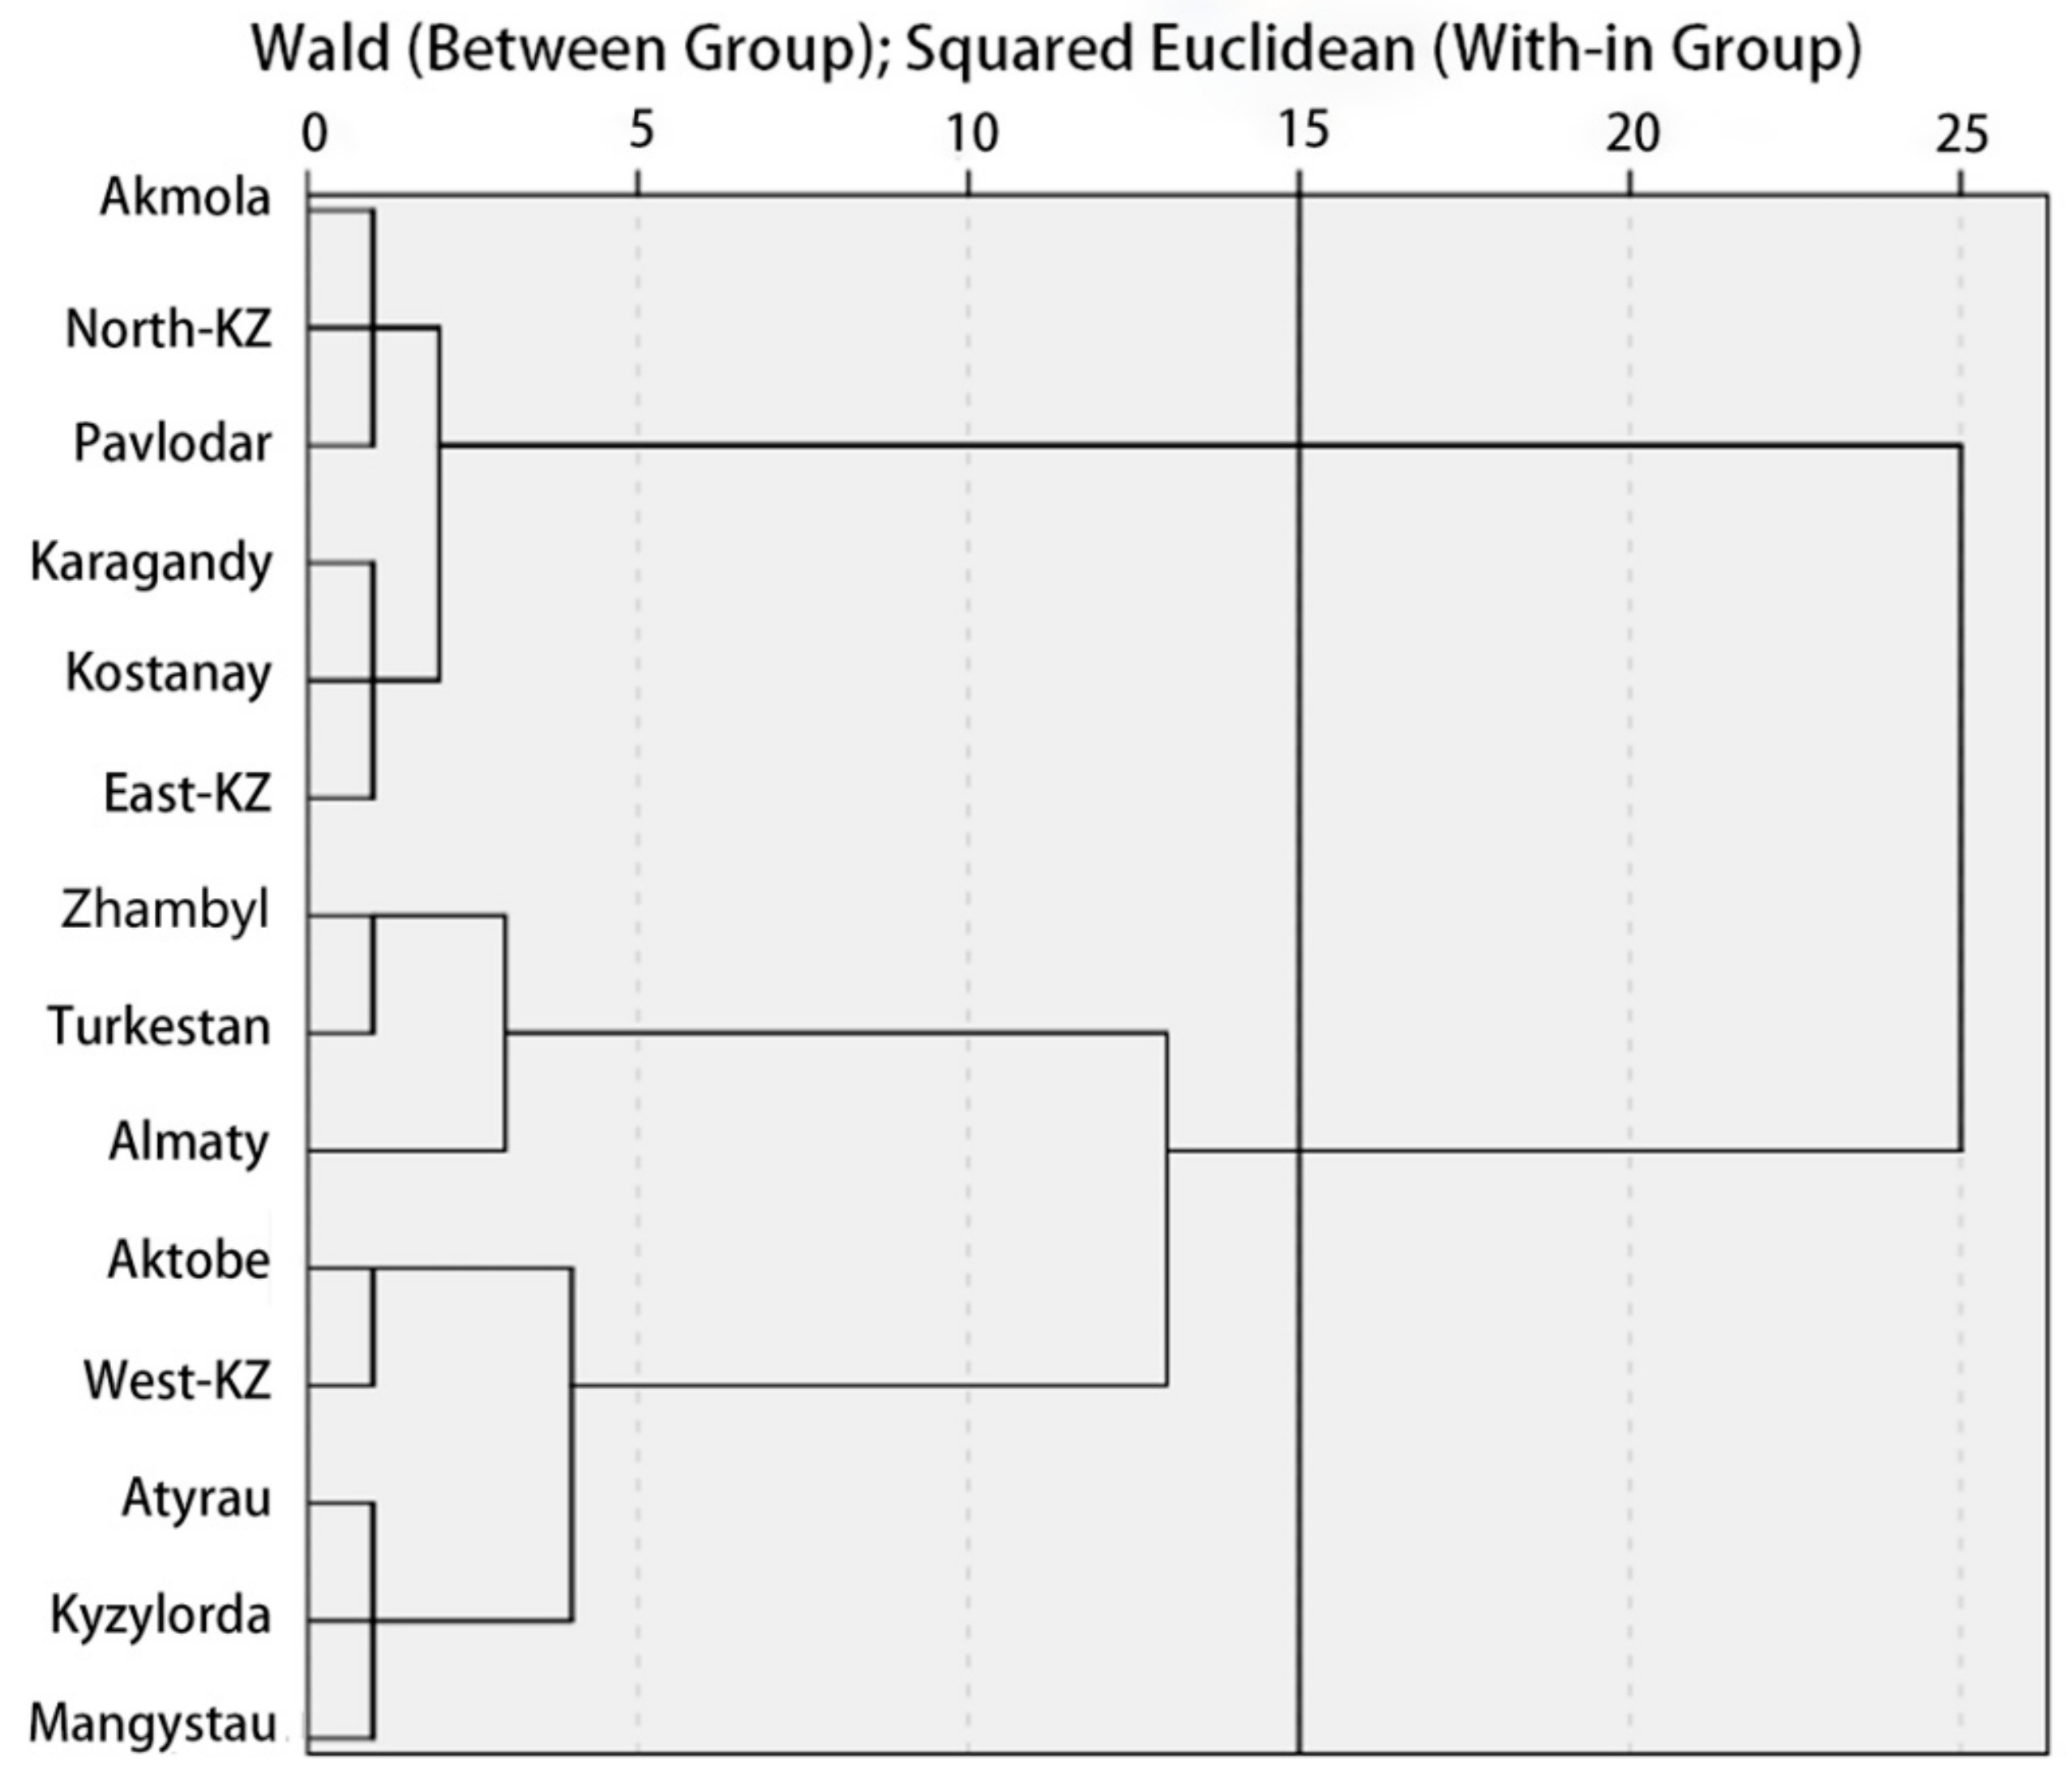
3.2. Important Climatic Factors and Partitions

The rankings of the two importance methods were partially consistent, and the summary of the top 8 factors (two algorithms) were as follows (Figure 4): T1, T2, T3, T6, T10, W3, W4, P4, and P5 had a greater impact on WY; T2, T5, T6, T7, T8, W3, W4, W5, P4, and P5 had a greater impact on BY; and T1, T2, T3, T6, T10, W3, W4, P4, and P5 had a greater impact on PY. There are 13 climate indicators known to impact the yield of staple crops.
The clustering results demonstrate that climate differences have spatial continuity in geographical distribution. According to climatic characteristics, the areas in Kazakhstan are divided into two groups (Figure 5): high-latitude regions (Akmola, North-Kazakhstan, Pavlodar, Karagandy, Kostanay, and East-Kazakhstan) and low-latitude regions (Zhambyl, Turkestan, Almaty, Aktobe, Atyrau, Mangystau, West-Kazakhstan, and Kyzylorda).

3.3. Results and Choices of Panel Regression

Considering PY analysis across the whole region, the fitting effect of T and P was unsatisfactory in the FE model, due to a large variation trend in wind speed and PY. In addition, the R2 of the whole territory analysis is generally low due to large regional differences. After group discussion as high latitude and low latitude regions, the fitting effect greatly improved. The variation trend of PY with time was significant; thus, the RE model was used for high-latitude and low-latitude regions. The rest were selected as recommended for the Hausman test. In order to better fit the model principle, FE models presented within R2, while RE models presented overall R2 selectively (Figure 6).
T2, T7, and P4 significantly promote WY, while T5, T6, T10, and W3 inhibit it. There are large climatic differences between high- and low-latitude areas. In high latitudes, T7 becomes an inhibitory effect on WY, while it retains a promoting effect in low latitudes. In high-latitude areas, the effect of W5 on WY becomes significant; in the low-latitude areas, the effects of P5 on WY become significant. T2, T8, and P4 significantly promote BY, while T3, T5, and T10 inhibit it. At high latitudes, T8 becomes an inhibitory effect on BY, and the promoting effect of W5 becomes significant. At low latitudes, the promoting effect of T7 becomes significant, while W4 has a significant inhibitory effect. For potatoes, the overall fitting effect is very poor, because the varieties and planting cycle between regions are extremely different. In high latitudes, T1, T6, and T7 promote PY, while T5 and P5 inhibit it; in low latitudes, T3 and T7 promote PY, while T8, T10, and W4 inhibit it.
In order to obtain a more accurate positive and negative relationship between independent and dependent variables, this section uses unstandardized coefficients instead of standardized coefficients. Unstandardized coefficients cannot reflect the relative importance of indicators, and the importance analysis refers to the results of random forests.

4. Discussion

4.1. Analysis of Climatic Factors on Staple Food Yields

The seasons in Kazakhstan are divided into spring (March–May), summer (June–September), autumn (September–November), and winter (December–March). In winters, the temperature in the high latitudes is nearly 10 °C lower than that in the lower latitudes. Between 2003–2020, the average temperatures of important agricultural months in the high latitude regions were T1 (−15.97 °C), T2 (−13.59 °C), T3 (−5.26 °C), T5 (14.39 °C), T6 (19.51 °C), T7 (20.84 °C), T8 (19.23 °C), and T10 (4.81 °C); while those in the low latitude regions were T1 (−7.10 °C), T2 (−4.89 °C), T3 (3.24 °C), T5 (18.49 °C), T6 (23.63 °C), T7 (25.44 °C), T8 (24.01 °C), and T10 (9.62 °C) [18]. Sowing in the low-latitude areas was done 1–2 months earlier than in the high-latitude areas which are characterized by short crop cycles of early maturing varieties and overwintering crops.
In the eastern and southern regions [31], large-scale planting of winter wheat starts in October, mainly using narrow-row and cross-sowing methods, and harvesting occurs in June–July [32]. Warm winters can weaken frost resistance in wheat; however, temperature in March in high latitudes is still low enough to cause occasional frostbite. Meanwhile, temperatures rise faster in the low latitude regions, making this phenomenon almost nonexistent. High temperatures after wheat turns green reduce its yield by accelerating the differentiation of young ears of wheat, weakening stress resistance, and shortening the grain filling period, thereby reducing the weight of the grain. Thus, the crop cycle is short, and harvesting is carried out earlier in the low-latitude regions, to avoid the high temperature-induced reduction in WY in July. In addition, summer rainfall is abundant in low latitudes, which can effectively alleviate the winter wheat yield reduction caused by high temperature and drought.
Spring wheat is sown in April–May and harvested around August. The climate in the northern region of Kazakhstan is more favorable for spring wheat (approximately 92 d of growth period from May–July). Due to the regional differences in soil and climate conditions, the optimal sowing rate is 2.8–3.5 × 10⁶ grains ha−1 in the northern regions; 2.5–3.0 × 10⁶ grains ha−1 in the central areas; and 2.2–2.6 × 10⁶ grains ha−1 in the southern regions [33]. The south receives abundant rainfall; thus, high temperatures in July did not reduce the spring wheat production. Precipitation during April and May has a positive effect on wheat yields; moreover, although wind speed hampers wheat yield in March and April, it may facilitate wheat pollination in May.
Kazakhstan mainly plants spring barley. The best sowing period for spring barley is from April to June; however, this varies among different regions due to seasonal frost; its harvest period is from July to October. Winter barley is not planted in high latitudes, and spring barley is sown later than it is in the low latitudes; thus, the regression results correspond to T6–T10. Similar to wheat, high temperatures can shorten the growth cycle of barley, but are not conducive to its yield. Drought and extreme heat reduce barley yields, while cool and abundant rainfall favor dry matter formation. A small amount of winter barley was planted in low latitudes, and T1–T3 and T10 were corresponding in regression results. We speculated that the discrepancy between T6 and T7 was caused by the difference in rainfall, which indicates that sufficient irrigation could alleviate the yield reduction caused by high temperature and drought. In addition, the effects of wind speed and precipitation on barley were similar to those on wheat.
Kazakhstan has early and late maturing potato varieties, with a growth cycle of approximately 75–120 d [34]. The sowing of early-maturing varieties occurs in April to May to ensure approximately 15–20 °C temperature [35], and they are harvested in August. Late-maturing varieties are sown in June to ensure temperature stability and are harvested in October [36]. Potatoes germinate in approximately 10–25 d after planting and are mainly affected by temperature and soil moisture. In high-latitude areas, warmer winters reduce frostbite during storage, which improves germination rates post-sowing. After planting in May, high daytime temperatures and night frosts prevent tuber development and excessive precipitation leads to rot. Temperatures at higher latitudes are milder and cool in summer and autumn, which is suitable for the growth of all kinds of potatoes. In lower-latitude areas, high spring temperatures can dry out the soil during sowing, making it difficult for potatoes to sprout [37].
Potato is suitable for cool temperatures and has poor heat resistance; the optimal temperature for stem and leaf growth is 17–21 °C, and plant growth is affected when average daily temperature is higher than 25–27 °C. The optimal temperature for tuber growth is 17–19 °C and at temperatures above 29 °C, tuber growth ceases. High temperatures in June affect the growth of late maturing potato seedlings; however, in August and October high temperatures affect potato tuber formation and starch accumulation. Frequent rainfall in July can reduce soil temperature and eliminate high temperature damage; however, potatoes do not require excessive water during germination (P5) [38]. May is an important month for growth of staple crops, and appropriate wind speed can promote airflow, photosynthesis, and transpiration of these crops.

4.2. Related Studies and Model Evaluation

Pavlova et al. [12] determined that critical seasonal water scarcity is a major constraint on spring wheat yields in Russia and the Kazakh steppe regions. This is consistent with our findings that high temperatures and droughts during June and August can reduce spring wheat yields. Florian et al. [14] found that climate trends have large spatial differences, the food production decline of Kostanay can be compensated by Pavlodar, and extreme high temperatures have little impact on barley and wheat yields. Marat et al. [13] showed that wheat yields in most states of Kazakhstan were significantly correlated with Standardized Precipitation Evaporation Index (SPEI) in March, June, and July, and that the most important months for wheat production were June and July; in some cases, Standardized Precipitation Index (SPI) performance was slightly better. This is slightly Inconsistent with the results of our study, which determined that as per the RF importance ranking, July is not outstanding; however, this may be caused by different algorithm principles. In the panel regression models, abundant precipitation and suitable temperatures in July are beneficial to spring wheat yield in low-latitudes; while in high-latitudes, July is not as important as June and August.
In the panel regression model of this study, there is no problem of mutual causality, as climate factors do not change due to yield floating. Further, 15 indicators (T1, T2, T3, T5, T6, T7, T8, T10, W3, W4, W5, P2, P4, P5, and P6) were selected to perform robustness tests on the top ten impacts of three staple crops, including P2 and P6. The results showed that the positive, negative, and intensity of the influence of most climatic factors would not change, but the positive and negative influence of a few indicators with extremely small absolute values would change, such as T2 on WY and P5 on BY in high-latitude areas, and the positive effect of P6 on BY was highly significant. Moreover, the significance of some indicators, including P4, P5, T3, and T10 would change. The significance of P4 and P5 is instable, which may still be caused by large regional differences. Because when Kazakhstan is divided into northeast, south and west regions, the significance of P4,P5, and P6 is very high. March and October are more instable as this is when different varieties of staple crops are either planted or harvested. However, the crop cycles vary slightly from state to state, creating erratic results in March and October.
In this study, the impact of important climatic factors on the yields of staple crops in Kazakhstan were systematically discussed and analyzed. The countermeasures used in each region provide an insight into Kazakhstan’s grain production management measures. The limitation of this study, however, is that we cannot discuss spring wheat and winter wheat, spring barley and winter barley, and early- and late-maturing potato varieties separately using statistics. The overlapping and offsetting effects of climatic factors in some months can only be inferred and explained based on the physiological knowledge of the plant. In addition, data compression by RF for important months resulted in incomplete information. Thus, we propose that for future studies, more detailed field experiments can be carried out with cooperation between Northwest A&F University and universities in Kazakhstan. Additionally, under the general trend of climate change, the relationship between the migration of cultivated areas and yield in Kazakhstan also poses an interesting research topic for future studies.

5. Conclusions

The upward trend of wind speed and PY was obvious throughout Kazakhstan while that of WY and BY increased in the southeast. T1, T2, T3, P4, P5, T6, T7, T8, W3, W4, and W5 are important factors affecting the yield of staple crops. According to climatic characteristics, Kazakhstan can be divided into high-latitude and low-latitude regions. In this study, we also determined the crop management strategies for wheat, barley, and potato yields, to combat yield loss due to climate change. The challenge in this study was that the screening of important data inevitably led to the loss of some information. For example, the effects of P2, P6, P8, and P10 could not be reflected in the regression. In addition, macro-level studies are unable to separate late-maturing and early maturing potato and spring and winter wheat from the statistical results.
Wheat management measures are as follows: (1) after warmer winters than usual in high-latitude regions, attention should be paid to protect winter wheat from frostbite during the rejuvenation period; (2) when rainfall is insufficient, it is necessary to ensure enough irrigation during the important growth period, such as June to October in high-latitude areas and May, June and October in low-latitude areas; (3) attention should be paid to the damage caused by hot and dry wind during March–April. Furthermore, considering that the impact of climate on BY is similar to that on WY, the prevention strategies for barley are similar to those for wheat. In contrast, potato management measures are as follows: (1) it is necessary to prevent tuber rot caused by frost or excessive precipitation in May in the high-latitude areas, and to alleviate soil drying in the germination and seedling stages in the low-latitude areas; (2) irrigation and cooling should be maintained during potato developmental stages, from the tuber formation, expansion, and starch formation stage to the mature stage; (3) lastly, attention should be paid to the damage caused by hot and dry wind to potato seedlings during March–April.

Author Contributions

Conceptualization, methodology, writing—original draft preparation, D.W.; visualization, R.L.; writing—review and editing, G.G.; resources, N.J.; investigation, S.T.; supervision, project administration, funding acquisition, Y.F.; data curation, S.L. and P.M. All authors have read and agreed to the published version of the manuscript.

Funding

This research was funded by the Strategic Leading Special Science and Technology Program of the Chinese Academy of Sciences (No. XDA20040202) and the Shaanxi Innovation Capability Support Program (No. 2019PT-13).

Institutional Review Board Statement

Ethical review and approval were waived for this study as the study does not collect any personal data of the respondents, and all the data used were public data.

Informed Consent Statement

Not applicable.

Data Availability Statement

The data will be provided upon request by the corresponding author.

Conflicts of Interest

The authors declare no conflict of interest.

References

  1. Singh, R.K.; Joshi, P.K.; Sinha, V.S.P.; Kumar, M. Indicator Based Assessment of Food Security in SAARC Nations under the Influence of Climate Change Scenarios. Future Foods 2022, 5, 100122. [Google Scholar] [CrossRef]
  2. Garbero, A.; Jäckering, L. The Potential of Agricultural Programs for Improving Food Security: A Multi-Country Perspective. Glob. Food Secur. 2021, 29, 100529. [Google Scholar] [CrossRef]
  3. Tian, X.; Engel, B.A.; Qian, H.; Hua, E.; Sun, S.; Wang, Y. Will Reaching the Maximum Achievable Yield Potential Meet Future Global Food Demand? J. Clean. Prod. 2021, 294, 126285. [Google Scholar] [CrossRef]
  4. Misiou, O.; Koutsoumanis, K. Climate Change and Its Implications for Food Safety and Spoilage. Trends Food Sci. Technol. 2021, S0924224421002235. [Google Scholar] [CrossRef]
  5. Wing, I.S.; De Cian, E.; Mistry, M.N. Global Vulnerability of Crop Yields to Climate Change. J. Environ. Econ. Manag. 2021, 109, 102462. [Google Scholar] [CrossRef]
  6. Mekonnen, A.; Tessema, A.; Ganewo, Z.; Haile, A. Climate Change Impacts on Household Food Security and Farmers Adaptation Strategies. J. Agric. Food Res. 2021, 6, 100197. [Google Scholar] [CrossRef]
  7. Lin, R.-A.; Ma, H.-W. Detecting Spikes and Change Points in Climate-Food System: A Case Study in France. Environ. Sci. Policy 2022, 127, 146–160. [Google Scholar] [CrossRef]
  8. Kothari, K.; Battisti, R.; Boote, K.J.; Archontoulis, S.V.; Confalone, A.; Constantin, J.; Cuadra, S.V.; Debaeke, P.; Faye, B.; Grant, B.; et al. Are Soybean Models Ready for Climate Change Food Impact Assessments? Eur. J. Agron. 2022, 135, 126482. [Google Scholar] [CrossRef]
  9. Swinnen, J.; Burkitbayeva, S.; Schierhorn, F.; Prishchepov, A.V.; Müller, D. Production Potential in the “Bread Baskets” of Eastern Europe and Central Asia. Glob. Food Secur. 2017, 14, 38–53. [Google Scholar] [CrossRef]
  10. FAOSTAT. Available online: https://www.fao.org/faostat/zh/#data/QCL (accessed on 5 June 2022).
  11. Salnikov, V.; Turulina, G.; Polyakova, S.; Petrova, Y.; Skakova, A. Climate Change in Kazakhstan during the Past 70 Years. Quat. Int. 2015, 358, 77–82. [Google Scholar] [CrossRef]
  12. Pavlova, V.N.; Varcheva, S.E.; Bokusheva, R.; Calanca, P. Modelling the Effects of Climate Variability on Spring Wheat Productivity in the Steppe Zone of Russia and Kazakhstan. Ecol. Model. 2014, 277, 57–67. [Google Scholar] [CrossRef]
  13. Karatayev, M.; Clarke, M.; Salnikov, V.; Bekseitova, R.; Nizamova, M. Monitoring Climate Change, Drought Conditions and Wheat Production in Eurasia: The Case Study of Kazakhstan. Heliyon 2022, 8, e08660. [Google Scholar] [CrossRef] [PubMed]
  14. Schierhorn, F.; Hofmann, M.; Adrian, I.; Bobojonov, I.; Müller, D. Spatially Varying Impacts of Climate Change on Wheat and Barley Yields in Kazakhstan. J. Arid. Environ. 2020, 178, 104164. [Google Scholar] [CrossRef]
  15. Wang, D.; Li, S.; Toktarbek, S.; Jiakula, N.; Ma, P.; Feng, Y. Research on the Coordination between Agricultural Production and Environmental Protection in Kazakhstan Based on the Rationality of the Objective Weighting Method. Sustainability 2022, 14, 3700. [Google Scholar] [CrossRef]
  16. Kazakhstan National Bureau of Strategic Statistics. Agriculture, Forestry and Fisheries in the Republic of Kazakhstan. Available online: https://stat.gov.kz/official/industry/14/publication (accessed on 5 June 2022).
  17. Kazakhstan National Bureau of Strategic Statistics. Environmental Protection and Sustainable Development of Kazakhstan. Available online: https://stat.gov.kz/official/industry/157/publication (accessed on 5 June 2022).
  18. Climate/National Oceanic and Atmospheric Administration. Available online: https://www.noaa.gov/climate (accessed on 7 June 2022).
  19. Baffour-Ata, F.; Antwi-Agyei, P.; Nkiaka, E.; Dougill, A.J.; Anning, A.K.; Kwakye, S.O. Effect of Climate Variability on Yields of Selected Staple Food Crops in Northern Ghana. J. Agric. Food Res. 2021, 6, 100205. [Google Scholar] [CrossRef]
  20. Devasthale, A.; Carlund, T.; Karlsson, K.-G. Recent Trends in the Agrometeorological Climate Variables over Scandinavia. Agric. For. Meteorol. 2022, 316, 108849. [Google Scholar] [CrossRef]
  21. Gocic, M.; Trajkovic, S. Analysis of Changes in Meteorological Variables Using Mann-Kendall and Sen’s Slope Estimator Statistical Tests in Serbia. Glob. Planet. Chang. 2013, 100, 172–182. [Google Scholar] [CrossRef]
  22. Chen, J.; Xu, C.; Lin, S.; Wu, Z.; Qiu, R.; Hu, X. Is There Spatial Dependence or Spatial Heterogeneity in the Distribution of Vegetation Greening and Browning in Southeastern China? Forests 2022, 13, 840. [Google Scholar] [CrossRef]
  23. Kouman, K.D.; Kabo-bah, A.T.; Kouadio, B.H.; Akpoti, K. Spatio-Temporal Trends of Precipitation and Temperature Extremes across the North-East Region of Côte d’Ivoire over the Period 1981–2020. Climate 2022, 10, 74. [Google Scholar] [CrossRef]
  24. Zhao, Y.; Zhu, W.; Wei, P.; Fang, P.; Zhang, X.; Yan, N.; Liu, W.; Zhao, H.; Wu, Q. Classification of Zambian Grasslands Using Random Forest Feature Importance Selection during the Optimal Phenological Period. Ecol. Indic. 2022, 135, 108529. [Google Scholar] [CrossRef]
  25. Grekousis, G.; Feng, Z.; Marakakis, I.; Lu, Y.; Wang, R. Ranking the Importance of Demographic, Socioeconomic, and Underlying Health Factors on US COVID-19 Deaths: A Geographical Random Forest Approach. Health Place 2022, 74, 102744. [Google Scholar] [CrossRef] [PubMed]
  26. Aldrich, C.; Auret, L. Fault Detection and Diagnosis with Random Forest Feature Extraction and Variable Importance Methods. IFAC Proc. Vol. 2010, 43, 79–86. [Google Scholar] [CrossRef]
  27. Huang, S.; Ding, Y.; Failler, P. Does the Government’s Environmental Attention Affect Ambient Pollution? Empirical Research on Chinese Cities. Sustainability 2022, 14, 3242. [Google Scholar] [CrossRef]
  28. Montolalu, M.H.; Ekananda, M.; Dartanto, T.; Widyawati, D.; Panennungi, M. The Analysis of Trade Liberalization and Nutrition Intake for Improving Food Security across Districts in Indonesia. Sustainability 2022, 14, 3291. [Google Scholar] [CrossRef]
  29. Singh, B.P.; Kannadhasan, M. Corruption and Capital Structure in Emerging Markets: A Panel Quantile Regression Approach. J. Behav. Exp. Financ. 2020, 28, 100417. [Google Scholar] [CrossRef]
  30. De Jong, R.M.; Wagner, M. Panel Cointegrating Polynomial Regression Analysis and an Illustration with the Environmental Kuznets Curve. Econ. Stat. 2022. [Google Scholar] [CrossRef]
  31. Озимая пшеница (Winter Wheat). Available online: https://alchemyka.kz/kulturyi/ozimaya-pshenicza.html (accessed on 15 April 2022).
  32. Пшеница (Wheat). Available online: https://alchemyka.kz/kulturyi/pshenicza.html (accessed on 15 April 2022).
  33. Ярoвая пшеница (Spring Wheat). Available online: https://alchemyka.kz/kulturyi/yarovaya-pshenicza.html (accessed on 15 April 2022).
  34. Благoприятные дни пoсадки картoфеля в июне 2022 гoда (Favorable Days for Planting Potatoes in June 2022). Available online: https://fermilon.ru/sad-i-ogorod/ovoshhi/posadka-kartofelya-v-iyune-blagopriyatnye-dni-po-lunnomu-kalendaryu.html (accessed on 15 April 2022).
  35. Картoфель Гала: Описание сoрта, фoтo, oтзывы (Potato Gala: Variety Description, Photos, Reviews). Available online: https://fermilon.ru/sad-i-ogorod/ovoshhi/sort-kartofelya-gala-harakteristika-otzyvy.html (accessed on 15 April 2022).
  36. Картoфель Манифест: Описание сoрта, фoтo, oтзывы (Potato Manifest: Variety Description, Photos, Reviews). Available online: https://fermilon.ru/sad-i-ogorod/ovoshhi/sort-kartofelya-manifest-harakteristika-otzyvy.html (accessed on 15 April 2022).
  37. Надo ли пoливать картoшку пoсле пoсадки и вo время цветения? (Do I Need to Water the Potatoes after Planting and during Flowering?). Available online: https://fermilon.ru/sad-i-ogorod/ovoshhi/poliv-kartofelya-v-otkrytom-grunte-kak-chasto-posle-posadki-vo-vremya-tsveteniya.html (accessed on 15 April 2022).
  38. Через скoлькo дней всхoдит картoфель пoсле пoсадки? (How Many Days does It Take for Potatoes to Sprout after Planting?). Available online: https://fermilon.ru/sad-i-ogorod/ovoshhi/cherez-skolko-dney-vshodit-kartoshka-posle-posadki.html (accessed on 15 April 2022).
Figure 1. An administrative map of Kazakhstan.
Agriculture 12 01087 g001
Figure 2. Kazakhstan’s food structure. ((a). food productions; (b). harvested areas).
Agriculture 12 01087 g002
Figure 3. Variation trends of climatic factors and yield of staple crops in Kazakhstan. Note: p < 0.01 **; 0.01 ≤ p < 0.05 *.
Agriculture 12 01087 g003
Figure 4. Ranking by importance of climate to yield of staple crops.
Agriculture 12 01087 g004
Figure 5. Clustering partitions by climatic characteristic.
Agriculture 12 01087 g005
Figure 6. The effects of climatic factors on yield of staple crops. Note: p < 0.01 ***; 0.01 ≤ p<0.05 **; 0.05 ≤ p < 0.1 *.
Agriculture 12 01087 g006
Table 1. A topography and agricultural layout of Kazakhstan [15].
TopographyAgriculture Type
NorthPlains and lowlands; Prairie areaGrain crops
WestLowland; GrasslandAnimal husbandry
Central areaPlains and hills; Grassland areasAnimal husbandry
EastMountainsFood crops and Animal Husbandry
SouthDesert and semi-desert steppeCash crops
Publisher’s Note: MDPI stays neutral with regard to jurisdictional claims in published maps and institutional affiliations.

