The Impact of the Digital Economy on Agricultural Green Development: Evidence from China
Abstract
:1. Introduction
2. Mechanism Analysis and Hypotheses Development
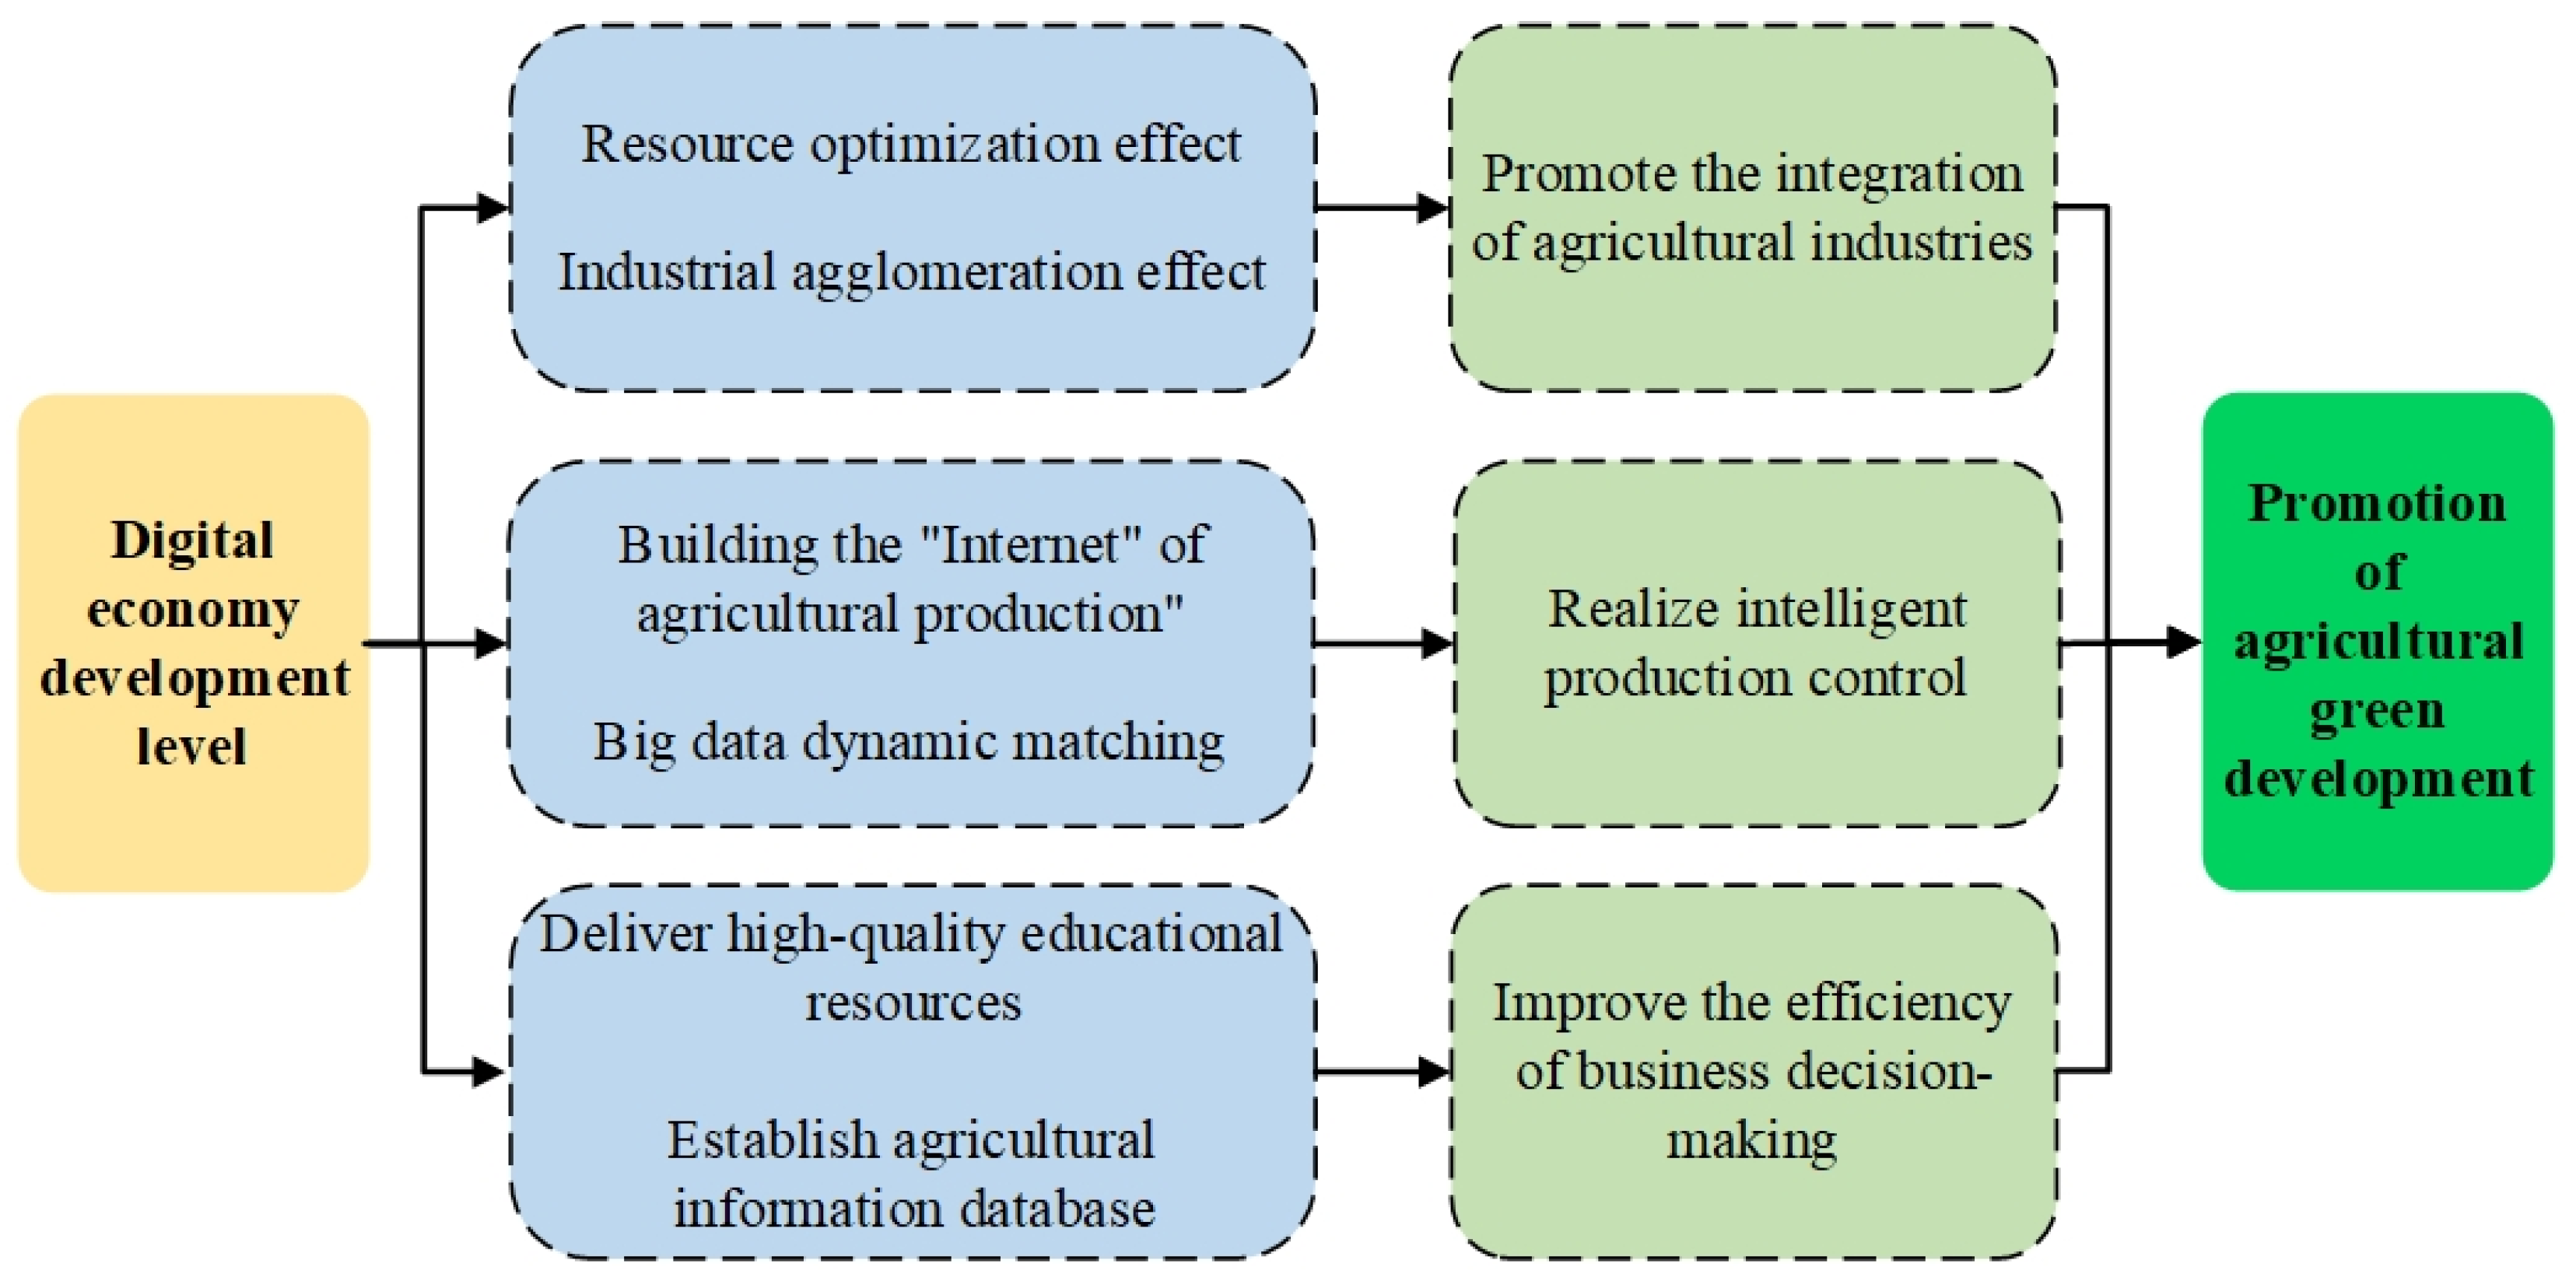
2.1. Influence Mechanism of the Digital Economy on Agricultural Green Development
2.2. Nonlinear Threshold Characteristics of the Digital Economy on Agricultural Green Development
2.3. Spatial Spillover Effect of the Digital Economy on Agricultural Green Development
3. Methodology and Data
3.1. Benchmark Model
3.2. Variables
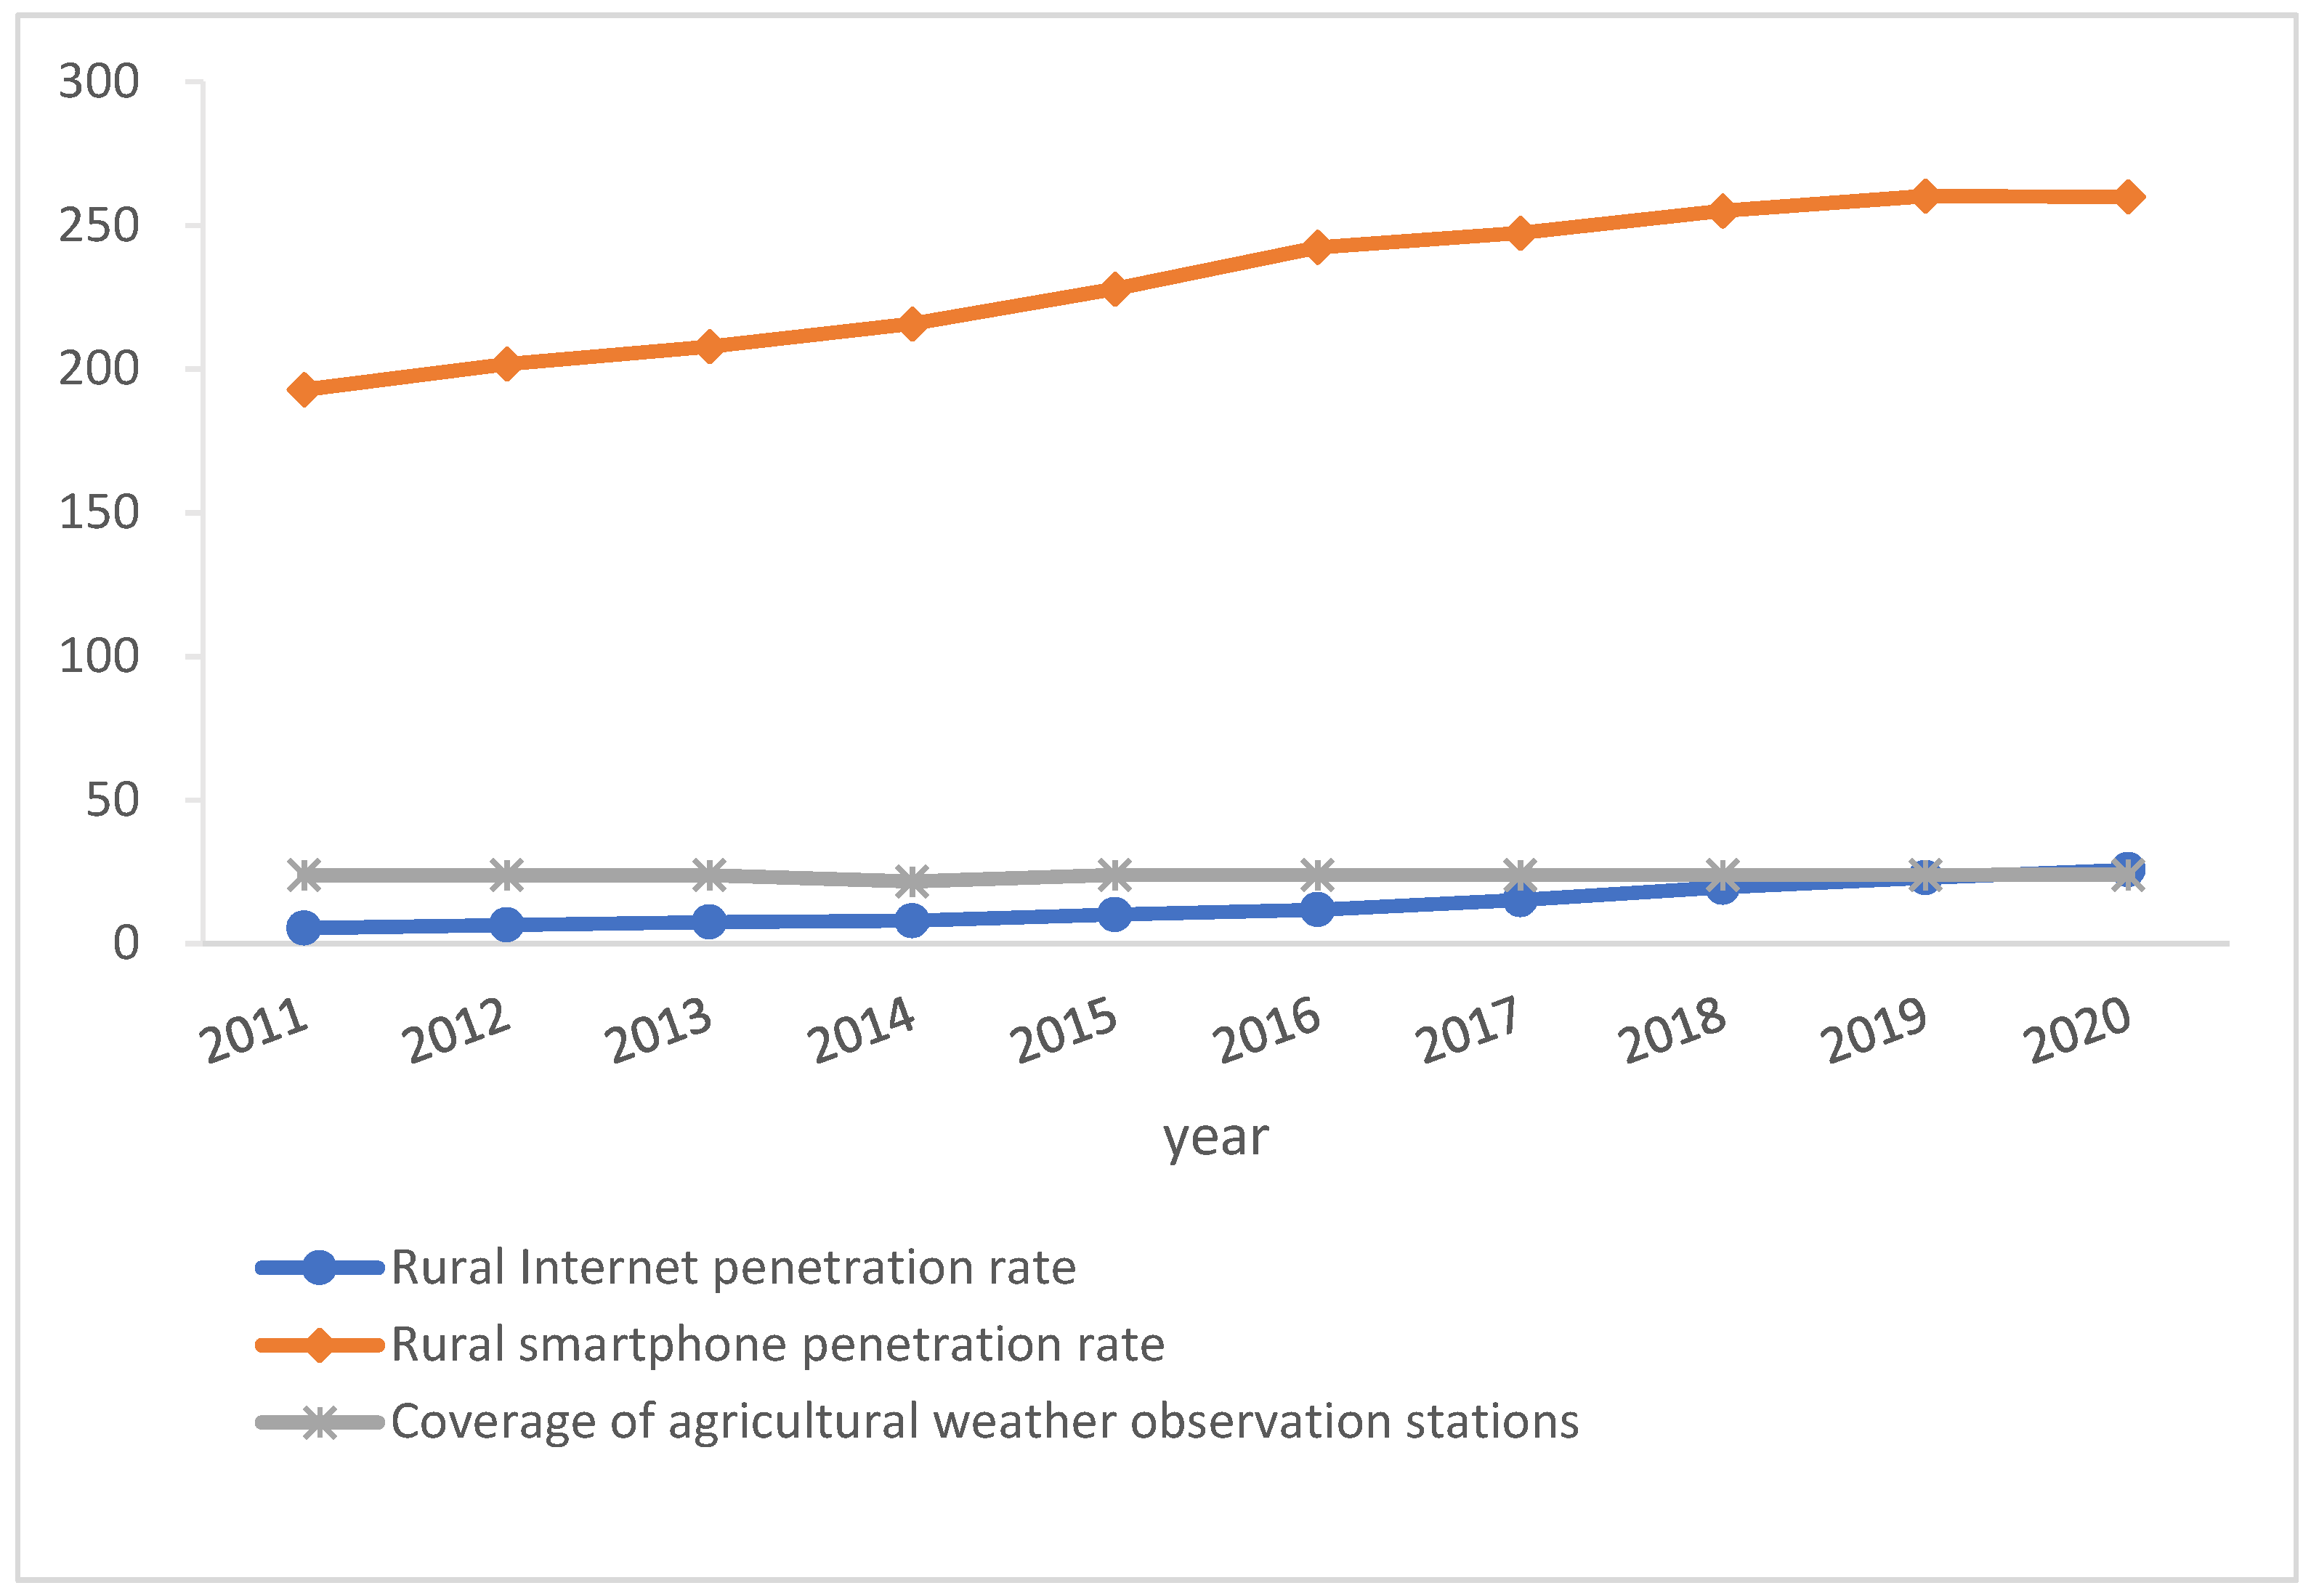
3.2.1. Measurement of the Development Level of the Digital Economy
3.2.2. Measurement of the Level of Green Development in Agriculture
3.2.3. Control Variables
3.2.4. Data Sources
4. Empirical Analysis
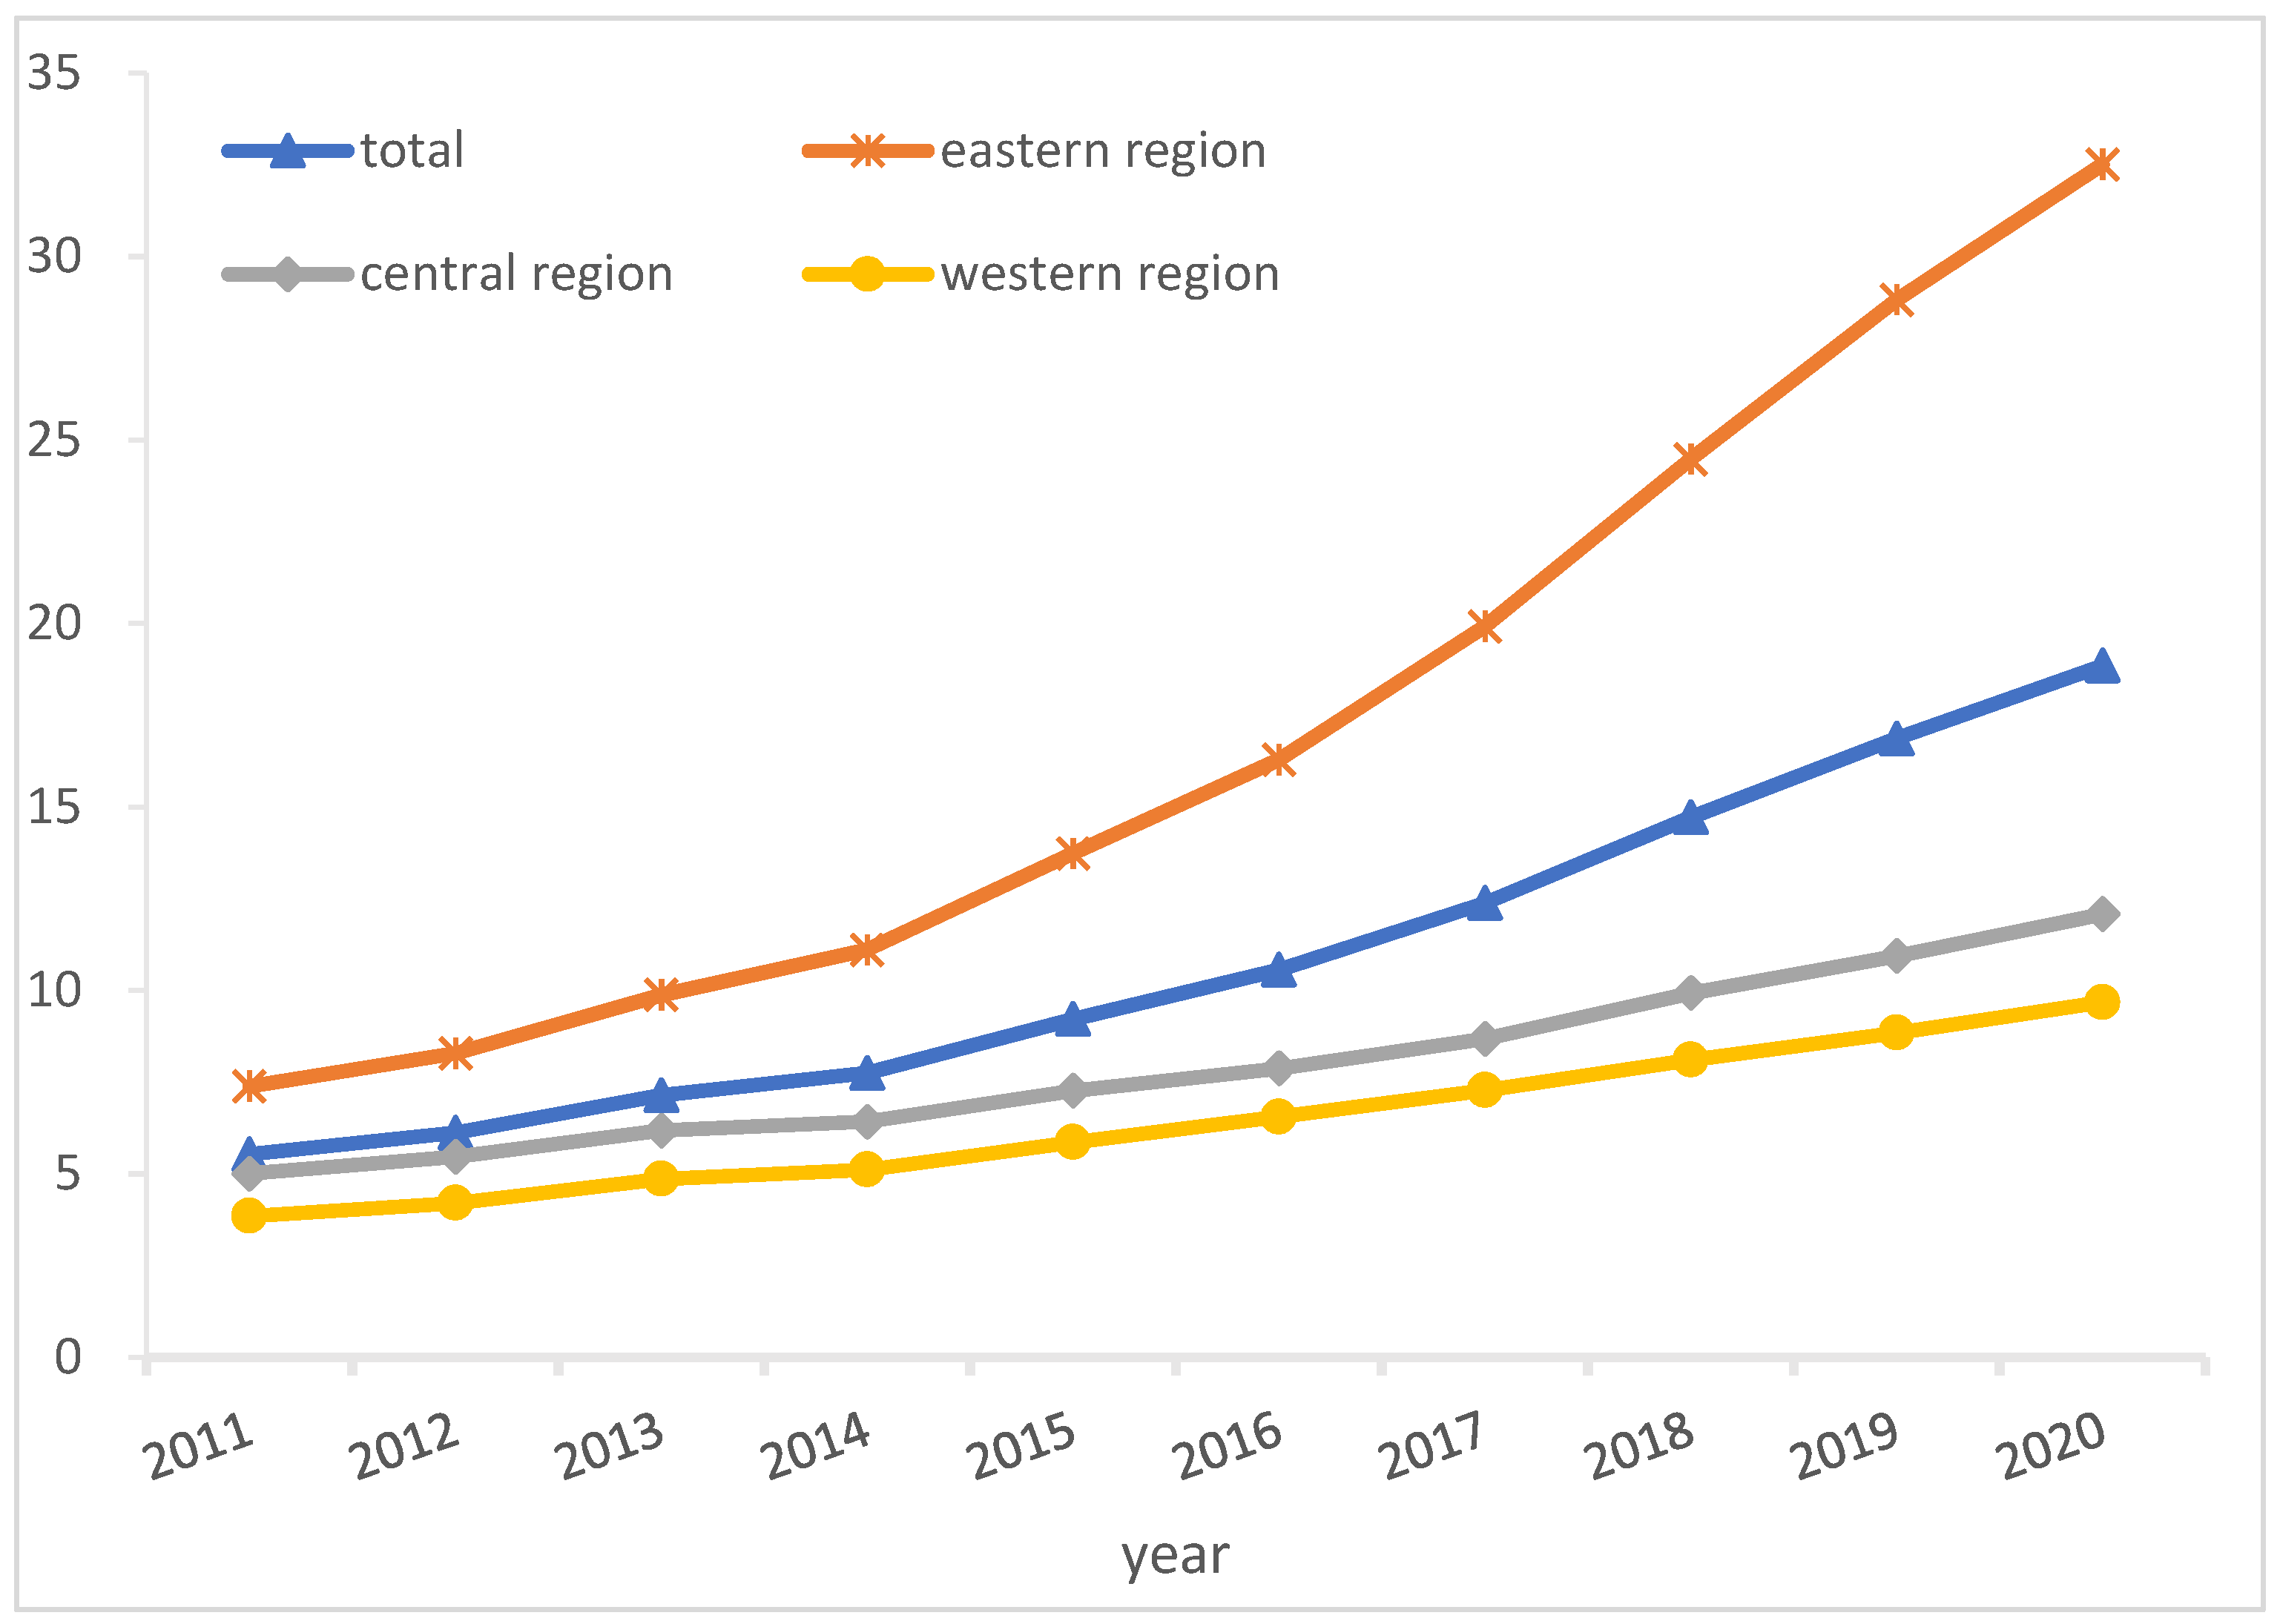
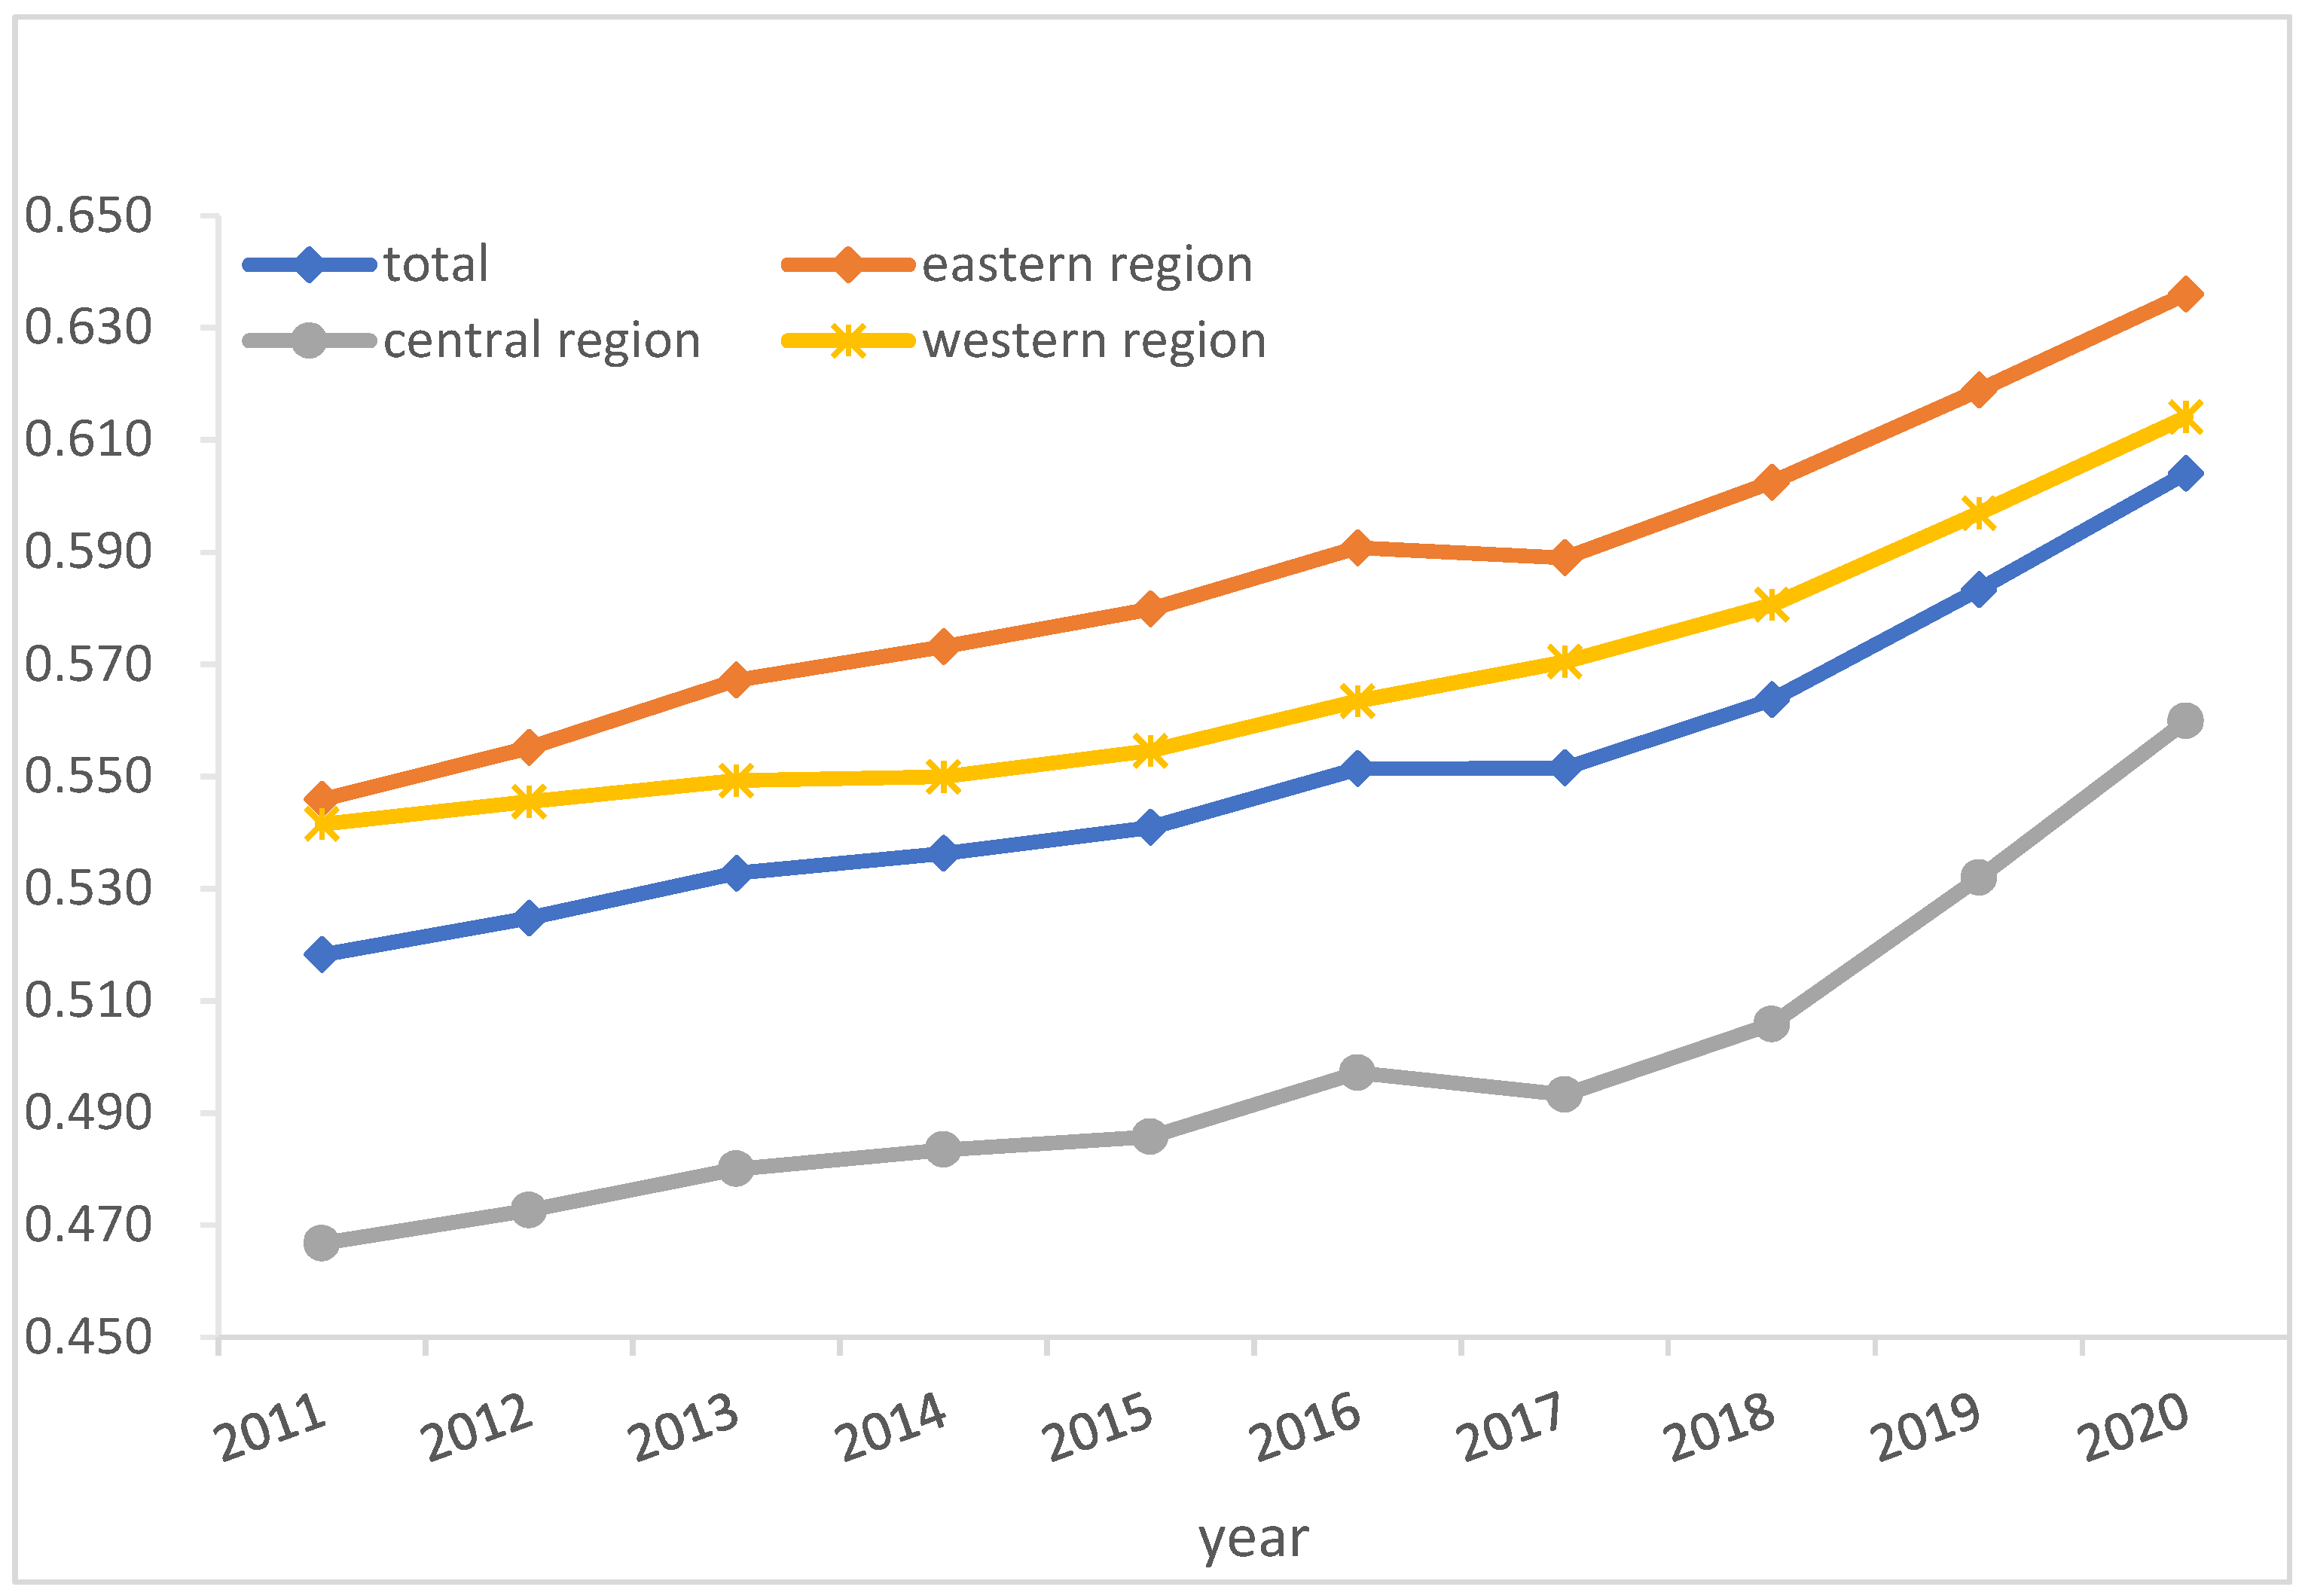
4.1. Measurement Results of Digital Economy and Agricultural Green Development Level
4.2. Benchmark Regression Results
4.3. Nonlinear Effect Analysis
4.4. Spatial Spillover Effect Analysis
4.5. Robustness Tests
- (1)
- The panel quantile regression method is used to test whether there are differences in the impact of the digital economy on agricultural green development under different agricultural green development levels. The results are presented in Model (1) in Table 9. The three quantiles of 25%, 50%, and 75% indicate the low, medium, and high levels of agricultural green development, respectively. Under different levels of agricultural green development, the positive impact of the digital economy on China’s agricultural green development is significant. This confirms the robustness of the empirical results.
- (2)
- Add control variables. Increased openness to the outside world will promote the development of the rural economy, innovate the agricultural development model, and enhance agricultural green development. In addition, enhancing agricultural fiscal spending will also promote agricultural technology research and development, which will drive the transformation of agricultural production to greenization. Therefore, the degree of openness to the outside world (open) and the level of agricultural fiscal spending (fin) are added as control variables. The degree of external openness is measured by the proportion of total imports and exports to GDP, and agricultural fiscal expenditure is directly measured by its proportion to total regional fiscal expenditure. The regression results are presented in Model (2) in Table 9. The regression coefficient of the core explanatory variable, the digital economy, is still significantly positive at the 1% level. The robustness of the benchmark regression results is tested again.
5. Regional Heterogeneity Analysis and the Effect of the “Broadband Village” Policy
5.1. Regional Heterogeneity Analysis
5.2. “Broadband Countryside” Policy Effect
6. Conclusions
6.1. Research Conclusions
6.2. Recommendations
6.3. Research Limitations and Areas for Future Studies
Author Contributions
Funding
Institutional Review Board Statement
Informed Consent Statement
Data Availability Statement
Conflicts of Interest
References
- Chen, J. Rapid urbanization in China: A real challenge to soil protection and food security. CATENA 2007, 69, 1–15. [Google Scholar] [CrossRef]
- Ministry of Environmental Protection, Statistics Department; Ministry of Agriculture. The Bulletin of the Second National Survey of Pollution Sources; Ministry of Environmental Protection of the People’s Republic of China: Beijing, China, 2020; Volume 3.
- Hosan, S.; Karmaker, S.C.; Rahman, M.M.; Chapman, A.J.; Saha, B.B. Dynamic links among the demographic dividend, digitalization, energy intensity and sustainable economic growth: Empirical evidence from emerging economies. J. Clean. Prod. 2022, 330, 129858. [Google Scholar] [CrossRef]
- Jiang, Z.; Guo, Y.; Wang, Z. Digital twin to improve the virtual-real integration of industrial IoT. J. Ind. Inf. Integr. 2021, 22, 100196. [Google Scholar] [CrossRef]
- Xiong, L.; Ning, J.; Dong, Y. Pollution reduction effect of the digital transformation of heavy metal enterprises under the agglomeration effect. J. Clean. Prod. 2022, 330, 129864. [Google Scholar] [CrossRef]
- Kovacikova, M.; Janoskova, P.; Kovacikova, K. The Impact of Emissions on the Environment within the Digital Economy. Transp. Res. Procedia 2021, 55, 1090–1097. [Google Scholar] [CrossRef]
- Smania, G.S.; de Sousa Mendes, G.H.; Godinho Filho, M.; Osiro, L.; Cauchick-Miguel, P.A.; Coreynen, W. The relationships between digitalization and ecosystem-related capabilities for service innovation in agricultural machinery manufacturers. J. Clean. Prod. 2022, 343, 130982. [Google Scholar] [CrossRef]
- Pan, W.; Xie, T.; Wang, Z.; Ma, L. Digital economy: An innovation driver for total factor productivity. J. Bus. Res. 2022, 139, 303–311. [Google Scholar] [CrossRef]
- Ozili, P.K. Impact of digital finance on financial inclusion and stability. Borsa Istanb. Rev. 2018, 18, 329–340. [Google Scholar] [CrossRef]
- Zatsarinnyy, A.A.; Shabanov, A.P. Model of a prospective digital platform to consolidate the resources of economic activity in the digital economy. Procedia Comput. Sci. 2019, 150, 552–557. [Google Scholar] [CrossRef]
- Zhong, R.; He, Q.; Qi, Y. Digital Economy, Agricultural Technological Progress, and Agricultural Carbon Intensity: Evidence from China. Int. J. Environ. Res. Public Health 2022, 19, 6488. [Google Scholar] [CrossRef]
- Hampton, S.E.; Strasser, C.A.; Tewksbury, J.J.; Gram, W.K.; Budden, A.E.; Batcheller, A.L.; Duke, C.S.; Porter, J.H. Big data and the future of ecology. Front. Ecol. Environ. 2013, 11, 156–162. [Google Scholar] [CrossRef]
- Jänicke, M.; Binder, M.; Mönch, H. ‘Dirty industries’: Patterns of change in industrial countries. Environ. Resour. Econ. 1997, 9, 467–491. [Google Scholar] [CrossRef]
- Buller, H.; Blokhuis, H.; Lokhorst, K.; Silberberg, M.; Veissier, I. Animal welfare management in a digital world. Animals 2020, 10, 1779. [Google Scholar] [CrossRef] [PubMed]
- Moyer, J.D.; Hughes, B.B. ICTs: Do they contribute to increased carbon emissions? Technol. Forecast. Soc. Chang. 2012, 79, 919–931. [Google Scholar] [CrossRef]
- Shin, D.H.; Choi, M.J. Ecological views of big data: Perspectives and issues. Telemat. Inform. 2015, 32, 311–320. [Google Scholar] [CrossRef]
- Zscheischler, J.; Brunsch, R.; Rogga, S.; Scholz, R.W. Perceived risks and vulnerabilities of employing digitalization and digital data in agriculture–Socially robust orientations from a transdisciplinary process. J. Clean. Prod. 2022, 358, 132034. [Google Scholar] [CrossRef]
- Kayad, A.; Sozzi, M.; Gatto, S.; Whelan, B.; Sartori, L.; Marinello, F. Ten years of corn yield dynamics at field scale under digital agriculture solutions: A case study from North Italy. Comput. Electron. Agric. 2021, 185, 106126. [Google Scholar] [CrossRef]
- Rijswijk, K.; Klerkx, L.; Bacco, M.; Bartolini, F.; Bulten, E.; Debruyne, L.; Dessein, J.; Scotti, I.; Brunori, G. Digital transformation of agriculture and rural areas: A socio-cyber-physical system framework to support responsibilisation. J. Rural Stud. 2021, 85, 79–90. [Google Scholar] [CrossRef]
- Mao, H.; Zhou, L.; Ying, R.; Pan, D. Time Preferences and green agricultural technology adoption: Field evidence from rice farmers in China. Land Use Policy 2021, 109, 105627. [Google Scholar] [CrossRef]
- Daum, T.; Adegbola, P.Y.; Adegbola, C.; Daudu, C.; Issa, F.; Kamau, G.; Kergna, A.O.; Mose, L.; Ndirpaya, Y.; Fatunbi, O.; et al. Mechanization, digitalization, and rural youth-Stakeholder perceptions on three mega-topics for agricultural transformation in four African countries. Glob. Food Secur. 2022, 32, 100616. [Google Scholar] [CrossRef]
- Gao, D.; Li, G.; Yu, J. Does digitization improve green total factor energy efficiency? Evidence from Chinese 213 cities. Energy 2022, 247, 123395. [Google Scholar] [CrossRef]
- Klerkx, L.; Jakku, E.; Labarthe, P. A review of social science on digital agriculture, smart farming and agriculture 4.0: New contributions and a future research agenda. NJAS-Wagening. J. Life Sci. 2019, 90, 100315. [Google Scholar] [CrossRef]
- Phillips, P.W.; Relf-Eckstein, J.A.; Jobe, G.; Wixted, B. Configuring the new digital landscape in western Canadian agriculture. NJAS-Wagening. J. Life Sci. 2019, 90, 100295. [Google Scholar] [CrossRef]
- Robinson, S.V.; Nguyen, L.H.; Galpern, P. Livin’on the edge: Precision yield data shows evidence of ecosystem services from field boundaries. Agric. Ecosyst. Environ. 2022, 333, 107956. [Google Scholar] [CrossRef]
- Na WE, I.; Feng YA, N.G.; Muthu, B.; Shanthini, A. Human machine interaction-assisted smart educational system for rural children. Comput. Electr. Eng. 2022, 99, 107812. [Google Scholar]
- Niloofar, P.; Francis, D.P.; Lazarova-Molnar, S.; Vulpe, A.; Vochin, M.C.; Suciu, G.; Balanescu, M.; Anestis, V.; Bartzanas, T. Data-driven decision support in livestock farming for improved animal health, welfare and greenhouse gas emissions: Overview and challenges. Comput. Electron. Agric. 2021, 190, 106406. [Google Scholar] [CrossRef]
- Yu, T.K.; Lin, M.L.; Liao, Y.K. Understanding factors influencing information communication technology adoption behavior: The moderators of information literacy and digital skills. Comput. Hum. Behav. 2017, 71, 196–208. [Google Scholar] [CrossRef]
- Ezenne, G.I.; Jupp, L.; Mantel, S.K.; Tanner, J.L. Current and potential capabilities of UAS for crop water productivity in precision agriculture. Agric. Water Manag. 2019, 218, 158–164. [Google Scholar] [CrossRef]
- Pagani, M.; Pardo, C. The impact of digital technology on relationships in a business network. Ind. Mark. Manag. 2017, 67, 185–192. [Google Scholar] [CrossRef]
- Li, M.; Li, Z.; Huang, X.; Qu, T. Blockchain-based digital twin sharing platform for reconfigurable socialized manufacturing resource integration. Int. J. Prod. Econ. 2021, 240, 108223. [Google Scholar] [CrossRef]
- Szalavetz, A. The digitalisation of manufacturing and blurring industry boundaries. CIRP J. Manuf. Sci. Technol. 2022, 37, 332–343. [Google Scholar] [CrossRef]
- Eom, S.J.; Lee, J. Digital government transformation in turbulent times: Responses, challenges, and future direction. Gov. Inf. Q. 2022, 39, 101690. [Google Scholar] [CrossRef]
- Yang, L.; Wang, S. Do fintech applications promote regional innovation efficiency? Empirical evidence from China. Socio-Econ. Plan. Sci. 2022, 83, 101258. [Google Scholar] [CrossRef]
- Zong, Y.; Gu, G. The threshold effect of manufacturing Servitization on carbon emission: An empirical analysis based on multinational panel data. Struct. Chang. Econ. Dyn. 2022, 60, 353–364. [Google Scholar] [CrossRef]
- Uberti, M.S.; Antunes MA, H.; Debiasi, P.; Tassinari, W. Mass appraisal of farmland using classical econometrics and spatial modeling. Land Use Policy 2018, 72, 161–170. [Google Scholar] [CrossRef]
- Kieti, J.; Waema, T.M.; Baumüller, H.; Ndemo, E.B.; Omwansa, T.K. What really impedes the scaling out of digital services for agriculture? A Kenyan users’ perspective. Smart Agric. Technol. 2022, 2, 100034. [Google Scholar] [CrossRef]
- Zou, J.; Deng, X. To inhibit or to promote: How does the digital economy affect urban migrant integration in China? Technol. Forecast. Soc. Chang. 2022, 179, 121647. [Google Scholar] [CrossRef]
- Song, J.; Jie, Z.; Shuang, Q. Digital Agriculture and Urbanization: Mechanism and Empirical Research. Technol. Forecast. Soc. Chang. 2022, 180, 121724. [Google Scholar]
- Chen, Z.; Sarkar, A.; Rahman, A.; Li, X.; Xia, X. Exploring the drivers of green agricultural development (GAD) in China: A spatial association network structure approaches. Land Use Policy 2022, 112, 105827. [Google Scholar] [CrossRef]
- Fang, L.; Hu, R.; Mao, H.; Chen, S. How crop insurance influences agricultural green total factor productivity: Evidence from Chinese farmers. J. Clean. Prod. 2021, 321, 128977. [Google Scholar] [CrossRef]
- Yao, P.; OuYang, J.; Liu, C.; Wang, S.; Wang, X.; Sun, S. Improving burn surgery education for medical students in China. Burns 2020, 46, 647–651. [Google Scholar] [CrossRef] [PubMed]
- Zhao, Z.; Wang, P.; Chen, J.; Zhang, F. Economic spillover effect of grass-based livestock husbandry on agricultural production—A case study in Hulun Buir, China. Technol. Forecast. Soc. Chang. 2021, 168, 120752. [Google Scholar] [CrossRef]
- Nan, S. Study on the Relationship of Grassroots Corruption and Government Expenditure Based on Panel Data. Procedia Comput. Sci. 2022, 199, 1192–1197. [Google Scholar] [CrossRef]
- Poggio, S.L.; Chaneton, E.J.; Ghersa, C.M. Landscape complexity differentially affects alpha, beta, and gamma diversities of plants occurring in fencerows and crop fields. Biol. Conserv. 2010, 143, 2477–2486. [Google Scholar] [CrossRef]
- Gimmon, E.; Levie, J. Founder’s human capital, external investment, and the survival of new high-technology ventures. Res. Policy 2010, 39, 1214–1226. [Google Scholar] [CrossRef]
- Zhang, Y. Influence of frequent flood disaster on agricultural productivity of rice planting and structural optimization strategy. Microprocess. Microsyst. 2021, 82, 103863. [Google Scholar] [CrossRef]
- Chen, Y. Improving market performance in the digital economy. China Econ. Rev. 2020, 62, 101482. [Google Scholar] [CrossRef]
- Heo, P.S.; Lee, D.H. Evolution of the linkage structure of ICT industry and its role in the economic system: The case of Korea. Inf. Technol. Dev. 2019, 25, 424–454. [Google Scholar] [CrossRef]
- Wang, A.; Lin, W.; Liu, B.; Wang, H.; Xu, H. Does smart city construction improve the green utilization efficiency of urban land? Land 2021, 10, 657. [Google Scholar] [CrossRef]


| Primary Indicator | Secondary Indicator | Indicator Interpretation | Indicator Attribute | Weightings (%) |
|---|---|---|---|---|
| Digital Infrastructure | Rural Internet penetration rate | The proportion of rural broadband access users to the rural population in the region | + | 7.6% |
| Rural smartphone penetration rate | Average cell phone ownership per 100 rural households | + | 1.7% | |
| Coverage of agricultural weather observation stations | Number of agricultural meteorological observation stations | + | 2.9% | |
| Digitalization of Agriculture | Digital trading scale of agricultural products | Online physical transaction volume | + | 23.3% |
| Agricultural infrastructure development | Investment in fixed assets in agriculture, forestry, animal husbandry, and fishery | + | 6.3% | |
| Digital industry support | The proportion of urban IT service personnel | + | 12.1% | |
| Digitization of the Agricultural Industry | IoT technology applications | Number of postal outlets | − | 0.7% |
| Rural digital bases | Number of Taobao villages | + | 45.2% |
| Indicator | Indicator Interpretation | Indicator Attribute | Weightings (%) |
|---|---|---|---|
| Fertilizer use efficiency | Net amount of chemical fertilizer consumed by agriculture, forestry, animal husbandry, and fishery production | − | 7.4% |
| Pesticide use efficiency | Pesticides consumed in agriculture, forestry, animal husbandry, and fishery production | − | 7.1% |
| Agricultural film utilization efficiency | Agricultural film consumed by agriculture, forestry, animal husbandry, and fishery production | − | 13.4% |
| Efficiency of agricultural machinery | Machinery input for agriculture, forestry, animal husbandry, and fishery production | − | 11.4% |
| Energy consumption for agricultural production | Total carbon emissions from agricultural production | − | 16.1% |
| Gross agricultural output | Gross output value of agriculture, forestry, animal husbandry, and fishery | + | 6.8% |
| Water resources utilization efficiency | Ratio of effective irrigation area to total cultivated land area at the end of the year | + | 37.7% |
| Year | Total | Eastern Region | Central Region | Western Region |
|---|---|---|---|---|
| 2011 | 5.534 | 7.389 | 5.009 | 3.851 |
| 2012 | 6.120 | 8.282 | 5.465 | 4.206 |
| 2013 | 7.139 | 9.876 | 6.180 | 4.860 |
| 2014 | 7.748 | 11.103 | 6.425 | 5.116 |
| 2015 | 9.217 | 13.734 | 7.267 | 5.864 |
| 2016 | 10.564 | 16.291 | 7.875 | 6.553 |
| 2017 | 12.382 | 19.921 | 8.680 | 7.280 |
| 2018 | 14.717 | 24.476 | 9.929 | 8.108 |
| 2019 | 16.867 | 28.821 | 10.940 | 8.844 |
| 2020 | 18.851 | 32.511 | 12.080 | 9.680 |
| Year | Total | Eastern Region | Central Region | Western Region |
|---|---|---|---|---|
| 2011 | 0.518 | 0.546 | 0.467 | 0.542 |
| 2012 | 0.525 | 0.555 | 0.473 | 0.545 |
| 2013 | 0.533 | 0.567 | 0.480 | 0.549 |
| 2014 | 0.536 | 0.573 | 0.483 | 0.550 |
| 2015 | 0.541 | 0.580 | 0.486 | 0.555 |
| 2016 | 0.551 | 0.591 | 0.497 | 0.563 |
| 2017 | 0.552 | 0.589 | 0.493 | 0.570 |
| 2018 | 0.564 | 0.602 | 0.506 | 0.581 |
| 2019 | 0.583 | 0.619 | 0.532 | 0.597 |
| 2020 | 0.604 | 0.636 | 0.560 | 0.614 |
| Variable | Agri | |
|---|---|---|
| (1) | (2) | |
| dige | 0.002 *** (0.000) | 0.003 *** (0.001) |
| human | 0.000 *** (0.000) | |
| add | −0.000 *** (0.000) | |
| policy | −0.642 ** (0.047) | |
| dis | −0.065 ** (0.043) | |
| Observations | 300 | 300 |
| Variable | Threshold Variable |
|---|---|
| (1) | |
| Threshold Value (Th1) | −1.08 |
| Threshold Value (Th2) | −0.92 |
| dige, t × I (Adj ≤ Th1) | 0.011 (0.227) |
| dige, t × I (Th1 < Adj ≤ Th2) | 0.044 *** (0.000) |
| dige, t × I (Adj > Th2) | 0.062 *** (0.000) |
| human | 0.233 *** (0.000) |
| add | −0.013 (0.445) |
| policy | 1.996 *** (0.000) |
| dis | 0.046 (0.105) |
| Observations | 300 |
| R2 | 0.819 |
| Year | Agri | Dige | ||||
|---|---|---|---|---|---|---|
| Moran’s I | Z-Value | p-Value | Moran’s I | Z-Value | p-Value | |
| 2011 | 0.221 | 2.291 | 0.011 | −0.054 | −0.174 | 0.431 |
| 2012 | 0.213 | 2.208 | 0.014 | −0.013 | 0.197 | 0.422 |
| 2013 | 0.176 | 1.876 | 0.030 | 0.011 | 0.411 | 0.340 |
| 2014 | 0.141 | 1.565 | 0.059 | 0.055 | 0.800 | 0.212 |
| 2015 | 0.131 | 1.478 | 0.070 | 0.114 | 1.339 | 0.090 |
| 2016 | 0.137 | 1.526 | 0.064 | 0.149 | 1.660 | 0.048 |
| 2017 | 0.143 | 1.570 | 0.058 | 0.195 | 2.073 | 0.019 |
| 2018 | 0.163 | 1.757 | 0.039 | 0.250 | 2.581 | 0.005 |
| 2019 | 0.216 | 2.240 | 0.013 | 0.281 | 2.859 | 0.002 |
| 2020 | 0.286 | 2.885 | 0.002 | 0.295 | 2.971 | 0.001 |
| Model | SAR | SEM | ||||
|---|---|---|---|---|---|---|
| Spatial Matrix | Geographic Distance Matrix | Economic Distance Matrix | Adjacency Matrix | Geographic Distance Matrix | Economic Distance Matrix | Adjacency Matrix |
| Variable | (1) | (2) | (3) | (4) | (5) | (6) |
| ρ | 0.154 *** (0.004) | 0.114 (0.124) | 0.201 *** (0.000) | |||
| λ | 0.252 *** (0.009) | 0.245 * (0.066) | 0.376 *** (0.000) | |||
| dige | 0.001 *** (0.000) | 0.001 *** (0.000) | 0.001 *** (0.000) | 0.003 *** (0.000) | 0.003 *** (0.000) | 0.002 *** (0.000) |
| human | 0.000 *** (0.000) | 0.000 *** (0.000) | 0.000 *** (0.000) | 0.000 *** (0.000) | 0.000 *** (0.000) | 0.000 *** (0.000) |
| add | 0.000 *** (0.000) | 0.000 *** (0.000) | 0.000 *** (0.000) | −0.000 *** (0.000) | −0.000 *** (0.000) | −0.293 (0.356) |
| policy | 0.233 (0.127) | 0.271 * (0.078) | 0.224 (0.132) | −0.230 (0.486) | −0.329 (0.309) | −0.000 *** (0.000) |
| dis | 0.014 (0.128) | 0.012 (0.170) | 0.017 * (0.054) | −0.029 (0.366) | −0.038 (0.235) | −0.008 (0.784) |
| Direct effect | 0.001 *** (0.000) | 0.001 *** (0.000) | 0.001 *** (0.000) | |||
| Indirect effect | 0.000 *** (0.010) | 0.000 (0.140) | 0.000 *** (0.000) | |||
| Total effect | 0.001 *** (0.000) | 0.001 *** (0.000) | 0.001 *** (0.000) | |||
| R2 | 0.844 | 0.848 | 0.845 | 0.372 | 0.369 | 0.364 |
| Variable | Agri | |||
|---|---|---|---|---|
| (1) | (2) | |||
| Quantile | 25% | 50% | 75% | |
| dige | 0.002 ** (0.024) | 0.003 *** (0.000) | 0.004 *** (0.000) | 0.003 *** (0.000) |
| human | 0.000 ** (0.033) | 0.000 (0.385) | 0.000 * (0.092) | 0.000 *** (0.000) |
| add | −0.000 *** (0.000) | −0.000 *** (0.000) | −0.000 *** (0.000) | −0.000 *** (0.000) |
| policy | −0.519 (0.453) | −0.106 (0.800) | −0.682 * (0.093) | −1.352 *** (0.001) |
| dis | −0.082 (0.196) | −0.109 * (0.050) | −0.034 (0.406) | −0.052 (0.105) |
| open | 0.001 *** (0.007) | |||
| fin | −0.009 (0.955) | |||
| Observations | 300 | 300 | 300 | 300 |
| Variable | Eastern Region | Central Region | Western Regions |
|---|---|---|---|
| dige | 0.003 *** (0.000) | 0.010 *** (0.000) | 0.005 (0.185) |
| human | 0.000 (0.931) | 0.000 *** (0.000) | 0.000 ** (0.014) |
| add | −0.000 *** (0.000) | −0.000 *** (0.000) | −0.000 (0.177) |
| policy | −0.477 (0.175) | −1.670 *** (0.002) | 5.614 *** (0.000) |
| dis | −0.015 (0.678) | 0.015 (0.770) | 0.041 (0.512) |
| Observations | 110 | 100 | 90 |
| R2 | 0.540 | 0.476 | 0.332 |
| Variable | Agri | |
|---|---|---|
| (1) | (2) | |
| treat × post | 0.035 (0.793) | 0.136 *** (0.000) |
| human | 0.262 *** (0.000) | |
| add | −0.032 (0.255) | |
| policy | 22.616 *** (0.000) | |
| dis | 0.330 *** (0.000) | |
| Observations | 40 | 40 |
| R2 | 0.567 | 0.922 |
Publisher’s Note: MDPI stays neutral with regard to jurisdictional claims in published maps and institutional affiliations. |
© 2022 by the authors. Licensee MDPI, Basel, Switzerland. This article is an open access article distributed under the terms and conditions of the Creative Commons Attribution (CC BY) license (https://creativecommons.org/licenses/by/4.0/).
Share and Cite
Jiang, Q.; Li, J.; Si, H.; Su, Y. The Impact of the Digital Economy on Agricultural Green Development: Evidence from China. Agriculture 2022, 12, 1107. https://doi.org/10.3390/agriculture12081107
Jiang Q, Li J, Si H, Su Y. The Impact of the Digital Economy on Agricultural Green Development: Evidence from China. Agriculture. 2022; 12(8):1107. https://doi.org/10.3390/agriculture12081107
Chicago/Turabian StyleJiang, Qi, Jizhi Li, Hongyun Si, and Yangyue Su. 2022. "The Impact of the Digital Economy on Agricultural Green Development: Evidence from China" Agriculture 12, no. 8: 1107. https://doi.org/10.3390/agriculture12081107
APA StyleJiang, Q., Li, J., Si, H., & Su, Y. (2022). The Impact of the Digital Economy on Agricultural Green Development: Evidence from China. Agriculture, 12(8), 1107. https://doi.org/10.3390/agriculture12081107


