Abstract
Harvest time and storage time had significant effects on nutrient quality and Volatile Organic Compounds (VOCs) of alfalfa. The objective of this study was to use headspace solid-phase microextraction gas chromatography-mass spectrometry (HS-SPME-GC-MS) to analyze alfalfa at different harvest periods (budding stage, early blooming, full blooming), and storage for 0 d, 90 d, 180 d, 270 d, and 360 d, the dynamic changes in VOCs and nutritional quality. Results indicated that ketones, aldehydes, alcohols and esters were the main volatile components of alfalfa VOCs, accounting for 87.41%, 88.57% and 90.85% of the total volatile components at budding stage, early blooming and full blooming, respectively. VOCs and nutrient quality of alfalfa varied significantly in different harvest periods; delayed harvesting significantly reduced alfalfa aldehydes, alcohols, crude protein (CP), and total digestible nutrients (TDN) and significantly increased ketone, dry matter (DM), acid detergent fiber (ADF) and neutral detergent fiber (NDF) contents (p < 0.05). After Comprehensive consideration ofthe yield, nutritional quality and VOCs of alfalfa, the best harvest time was determined to be the budding stage. The VOCs and nutrient quality of alfalfa were significantly different at different storage durations, and ketones, ADF and NDF were significantly increased and significantly reduced DM, CP and TDN (p < 0.05). Ketone content and neutral detergent fiber (NDF) content had a significant positive correlation, (NDF F = 5.5, p = 0.024). Storage 360 d 2-methylbutyraldehyde (musty), 1-octen-3-one (earthy musty odor) content increased. These may be the key compounds that causes the smell of fresh alfalfa to fade away and a musty smell to emerge.
1. Introduction
Alfalfa (Medicago sativa L.) is an important perennial leguminous forage crop; with high protein content, low fiber content, richness in vitamins and minerals and a full range of amino acids, it is one of the best forage crops, so it widely grown worldwide [1].
VOCs are metabolites produced by plants that can be perceived by humans or animals and are the determining factor in reflecting the different flavors of food [2]. VOCs are the primary indicator for quality evaluation of many agricultural products and the primary response medium for sensory evaluation. There are many indexes to evaluate alfalfa quality, while sensory index is one of the most important indexes to determine forage quality. Odor and color belong to the category of sensory evaluation of alfalfa, and VOCs have a significant effect on the odor of alfalfa [3]. VOCs are the critical factor in the formation of alfalfa odor, and the odor presented externally by alfalfa is the result of a clever combination of different VOCs. Feed choice by the animal is a highly sophisticated process [4]. The content of water-soluble carbohydrates is highly correlated with animals’ preference for food [5]. Livestock always show a strong appetite for fresh pasture; however, the appetite for forage stored for many years was very low. The palatability of herbage was affected and the appetite of livestock decreased due to the special smell of rancidity and mildew caused by microorganism metabolism. VOCs have been widely used as the basis for quality control in the agricultural field. For example, VOCs have become a key indicator in the characterization analysis of tea, it can accurately distinguish the origin [6,7], growth cycle [8], and preparation method of tea [8]. VOCs are also widely used in the fields of grain storage and food safety. The detection of VOCs produced by spoilage is a non-destructive testing method to judge the quality of rice and wheat [9,10,11]. At present, domestic and international researchers have used sensory quality as an indicator for grading alfalfa, but no researcher has specifically explained the VOCs of alfalfa. This study assessed alfalfa VOCs and nutritional quality to reveal the law of change of alfalfa VOCs and nutritional quality at different harvest and storage duration so as to provide a theoretical basis for evaluation of alfalfa quality.
In recent years, the continuous improvement of Headspace solid-phase microextraction (HS-SPME) technology has led to a wide range of applications in food, environmental protection, clinical medicine, toxicology, and other fields. SPME has many advantages over traditional sample pre-treatment methods; its ease of operation, no need for chemical reagents, environmental friendliness, and ease of automation have made it more widespread [12,13,14]. Headspace solid-phase microextraction gas chromatography-mass spectrometry (HS-SPME-GC-MS) can be used for accurate qualitative analysis of VOCs in complex samples. Therefore, a systematic study of alfalfa VOCs was carried out using HS-SPME-GC-MS.
2. Materials and Methods
2.1. Samples Collection
This study was conducted in a field site in Baotou City, Inner Mongolia Autonomous Region, China (110°60′27″ E, 40°6′5″ N). The area of the test site is about 0.13 hm2. The alfalfa variety is Zhong Mu No. 3; the experiment samples were alfalfa planted for three years. The mowing machines were used to mow the first crop of alfalfa in the budding stage, early blooming and full blooming, respectively, (Machines type: 9GXD-2.4 discrotary mower, Wuhan Fusen Machinery Co., Ltd., Wuhan, China), and the center of the test site was selected during sampling, to determine the nutritional quality and allow for VOCs identification of the best harvest time for alfalfa. When the water content of alfalfa was dried to 16% after each mow, it was bundled with a baling machine (Machines type: Ward 9YF-2200 baling machine, Shanghai Jiajing Machinery, Shanghai, China) and stored in a straw shed. In the storage test, only bales that were mowed and made hay at the optimum harvest period were sampled; hay samples were collected at 0, 90, 180, 270 and 360 days of storage, respectively, to determine the nutritional quality and VOCs.
2.2. Collection and Extraction of VOCs from Alfalfa
The sample extraction method using HS-SPME was as follows before extraction, the 50/30 μm divinylbenzene carboxen polydimethylsiloxane (DVB/CAR/PDMS) (Supelco, Bellefonte, PA, USA) extraction fiber needs to be aged at 250 °C high temperature for 0.5 h at the GC-MS inlet (Agilent, Palo Alto, CA, USA). Accurately weighed 1.5 g of alfalfa samples in 20 mL headspace vial (PerkinElmer, Waltham, MA, USA), and sealed the headspace vial with a TFE-silicone headspace septum (PerkinElmer, Waltham, MA, USA). Then, the extraction temperature was set to 90 °C, and the SPME extraction handle was inserted into the headspace bottle to extract VOCs. The fiber was exposed to the top of the headspace vial for extraction for 50 min. After the extraction, the extracted fiber was inserted into the GC-MS injection port and parsed for 3 min.
2.3. GC-MS Analysis Conditions
The alfalfa VOCs from three different harvest stages were analyzed by GC–MS using six biological repeats. The analysis was carried out on an agilent 8890 gas chromatograph coupled with an agilent 7000D mass detector (Agilent, Palo Alto, CA, USA). GC conditions: chromatographic columns are HP-5MS UI quartz capillary column (30 m × 0.25 mm × 0.25 μm), the initial column temperature was 35 °C, maintained for 4 min, after which the temperature was programmed to 200 °C at 5 °C/min, maintained for 5 min, and then increased the temperature to 15 °C/min. The min program temperature rose to 250 °C, which was kept for 4 min, and the injection-port temperature was 250 °C. The carrier gas was high-purity helium (purity ≥ 99.99%), with a helium flow rate of 1 mL/min, and pre-column pressure was 87.57 kPa. The inlet sampling mode was split, with a split ratio of 1:20, and the sampling mode was manual injection. MS conditions: The ion source temperature was 230 °C, and the transmission line temperature was 280 °C. The ionization method EI ion source was electron energy 70 Ev. The mass scanning range was 40–550 m/z, the acquisition mode was full scan mode, and the ion source vacuum was 7.2 × 10⁻⁷ mTorr [15,16].
2.4. VOCs Qualitative and Quantitative Analysis
The qualitative analysis of alfalfa VOCs was performed using NIST database (NIST 11.0, National Institute of Standards and Technology, Gaithersburg, MD, USA) in mass hunter workstation (Agilent, Palo Alto, CA, USA). According to formula 1, the peak area normalization method is used to calculate the relative content of VOCs.
where: Ci is relative content of VOCs i, Ai is VOCs i total peak area, ∑Ai is the sum of peak areas of all VOCs.
2.5. Analysis of Nutritional Quality of Alfalfa
The hay yield per hectare of alfalfa was converted from the mean alfalfa yield of 1 m × 1 m quadrat replicates 10 times. The dry matter (DM) content of fresh plant samples was oven-dried (ULM 800; GmbH, Schwabach, Germany) at 65 °C for 48 h. Dried samples were ground to 1 mm particles and crude protein (CP), neutral detergent fiber (NDF), acid detergent fiber (ADF), total digestible nutrients (TDN) were analyzed by near-infrared reflectance spectroscopy (FOSS 500, FOSS company, Hillerød, Denmark). Database source: Cumberland Valley Analytical Services (CVAS), Waynesboro, PA, USA.
2.6. Statistical Analysis
SAS 9.2 was used for statistical analysis (duncan method was used for ANOVA, p < 0.05), the VOCs content of alfalfa was expressed by the mean ± standard deviation of six repeated measurements. To detect the differences in VOCs profiling different treatments samples, we used the multivariate method of or-thogonal partial least squares discriminant analysis (OPLS-DA), OPLS-DA analysis used SIMCA 14. Redundancy analysis technique (RDA) was used to explain alfalfa VOCs and nutritional quality linear relationships; RDA analysis used Canoco 5. plotting with Origin 2018.
3. Results
3.1. Analysis of VOCs in Alfalfa at Different Harvest Periods
The VOCs of alfalfa at different harvest periods were analyzed by HS-SPME-GC-MS technique. As shown in Table 1, excluding some peaks due to chromatographic columns loss, 50 VOCs were identified, they could be classified 9 categories: 12 aldehydes, 13 ketones, 12 alcohols, 3 esters, 5 hydrocarbons, 2 phenols, 1 sulfur-containing compound, 1 heterocyclic, and 1 aromatic compound. The compound 2,5-dimethylbenzaldehyde, decanal (orange peel citrus floral), benzeneacetaldehyde,a-ethylidene- (green floral odor), 4-(2,6,6-trimethyl-1-cyclohexenyl)-3-buten-2-one (woody, floral odor), 2-pentylfuran (fruity, green odor) and olivetol were significantly higher at budding stage than at early blooming and full blooming (p < 0.05). The compound isovaleraldehyde (fruity odor), 2-methylbutyraldehyde (musty odor), (E,E)-2,4-hexadienal (sweet green odor), 3,3,5-trimethylcyclohexanol (mint, musty, spicy odor), 1,5,5-trimethyl-6-(3-methyl-buta-1,3-dienyl)-cyclohexene, 5-amino-2-methoxyphenol can only be detected in the budding stage. The content of compound 3-cyclohexadiene-1-carboxaldehyde,2,6,6-trimethyl-1 (fresh herbal odor), 1h-pyrrole-2,5-dione,3-ethyl-4-methyl-, 2-pentadecanone,6,10,14-trimethyl- (grease and herbal odor) in budding stage were significantly lower than those in early blooming and full blooming. The compound 6-methyl-5-hepten-2-one (citrus and musty odor), 2,6-dimethylcyclohexanol, 2-[(9Z)-9-octadecenyloxy]-ethanol, 9-hexylheptadecane can only be detected in the full blooming (Compound odor description: www.thegoodscentscompany.com, accessed on 29 April 2022).

Table 1.
VOCs types and relative content of alfalfa at different harvest periods.
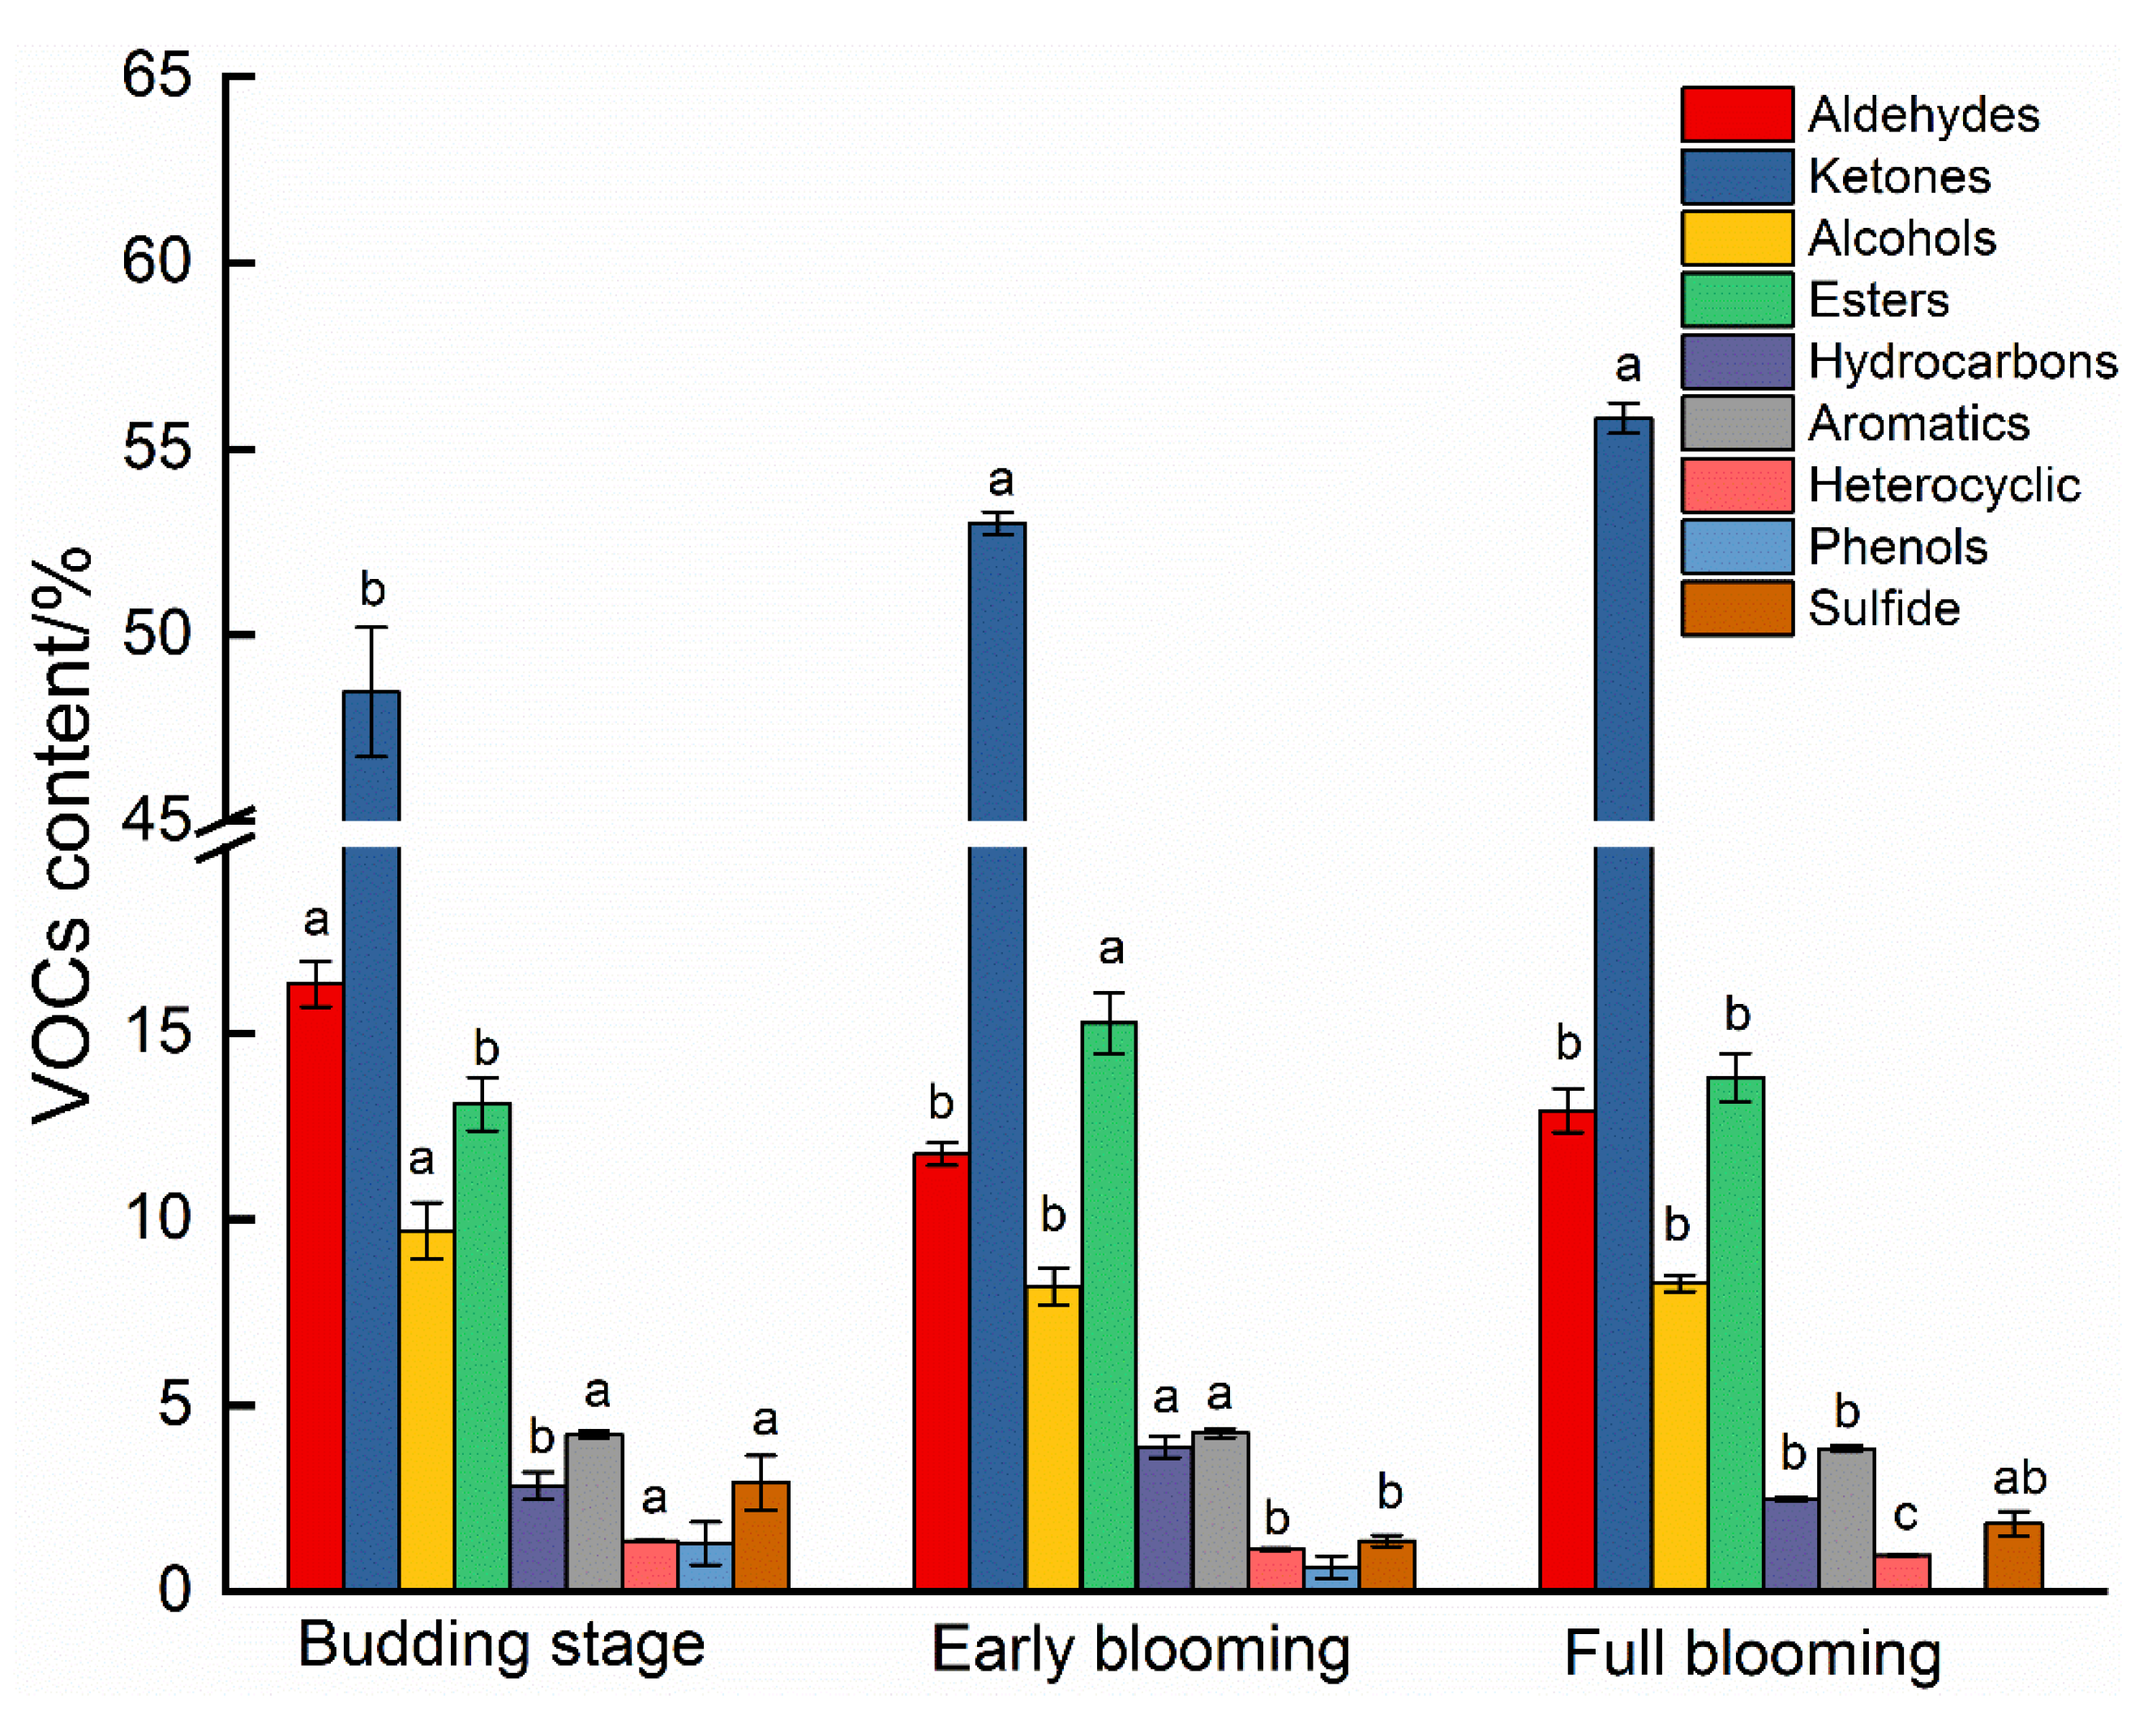
As shown in Figure 1, alfalfa VOCs were mainly composed of aldehydes, ketones, alcohols and esters, which accounted for 87.41%, 88.57% and 90.85% of the total VOCs at budding stage, early blooming and full blooming respectively, the content of other types of VOCs was low. With the extension of the harvest period, the alfalfa aldehydes and alcohols content showed decreased, and at the early blooming and full blooming content was significantly lower than at the budding stage (p < 0.05). The content of ketones showed a gradual increase, and their content at early blooming and full blooming was significantly higher than that at the budding stage (p < 0.05). Esters showed a trend of first increasing then decreasing, and the content at early blooming was significantly higher than at both budding stage and full blooming (p < 0.05).
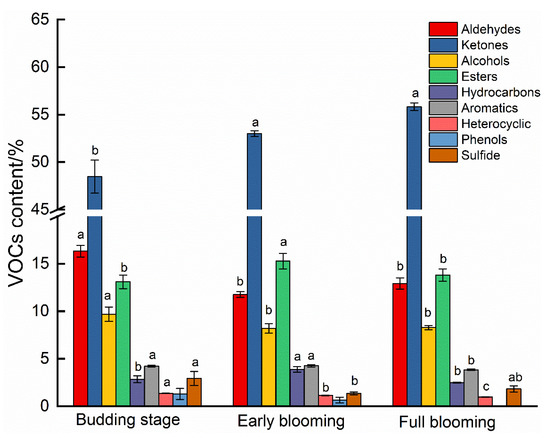
Figure 1.
Changes in VOCs content of alfalfa at harvest-reaping periods. Different lowercase letters indicate significant difference at p < 0.05.
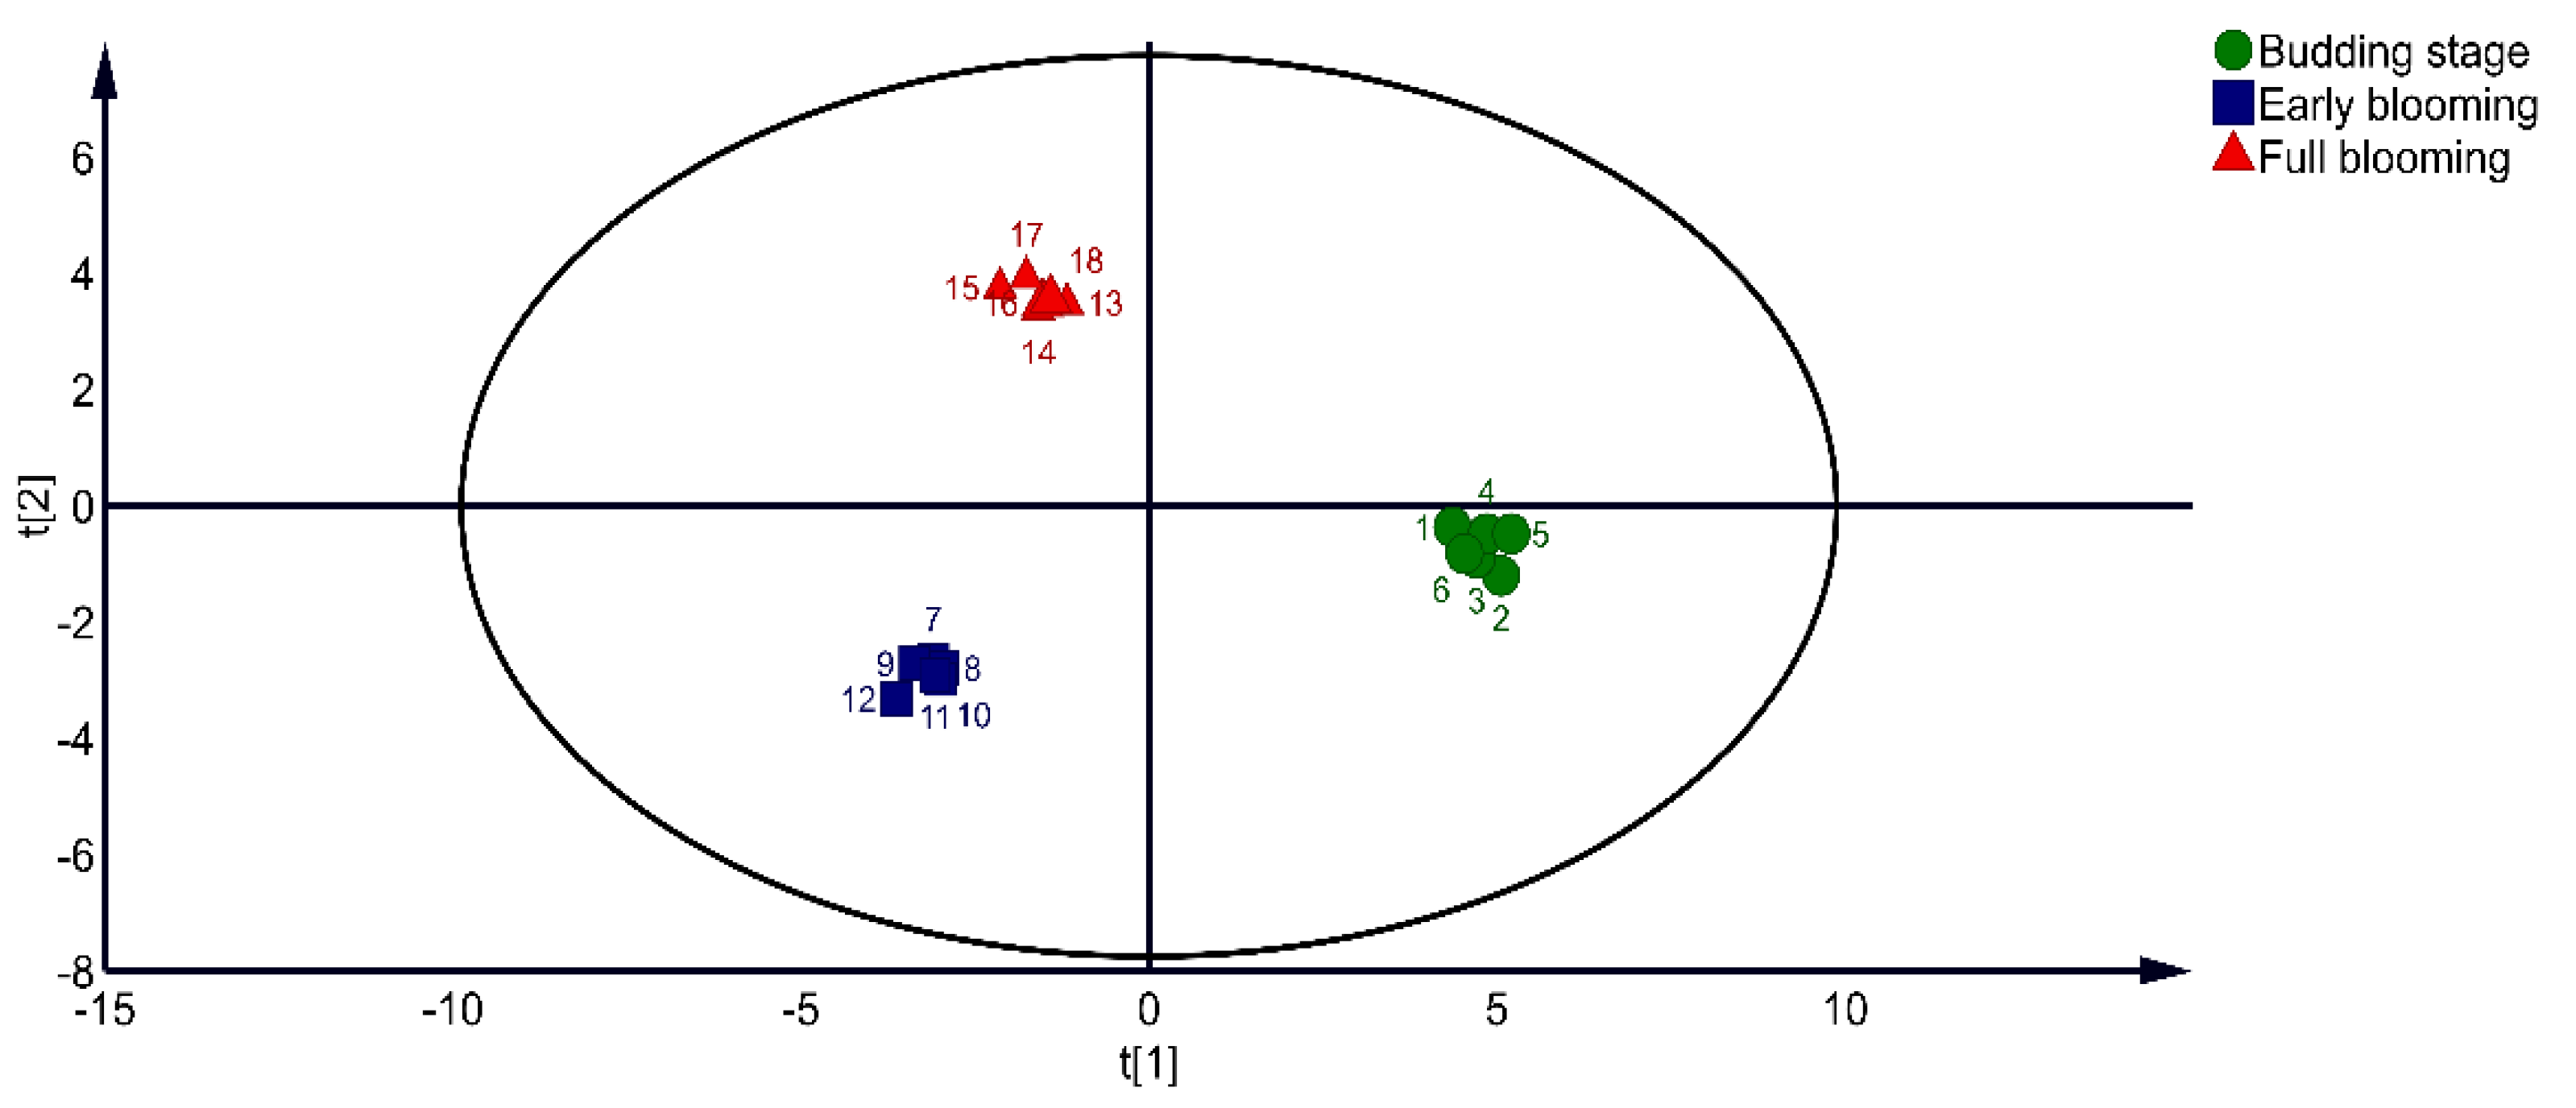
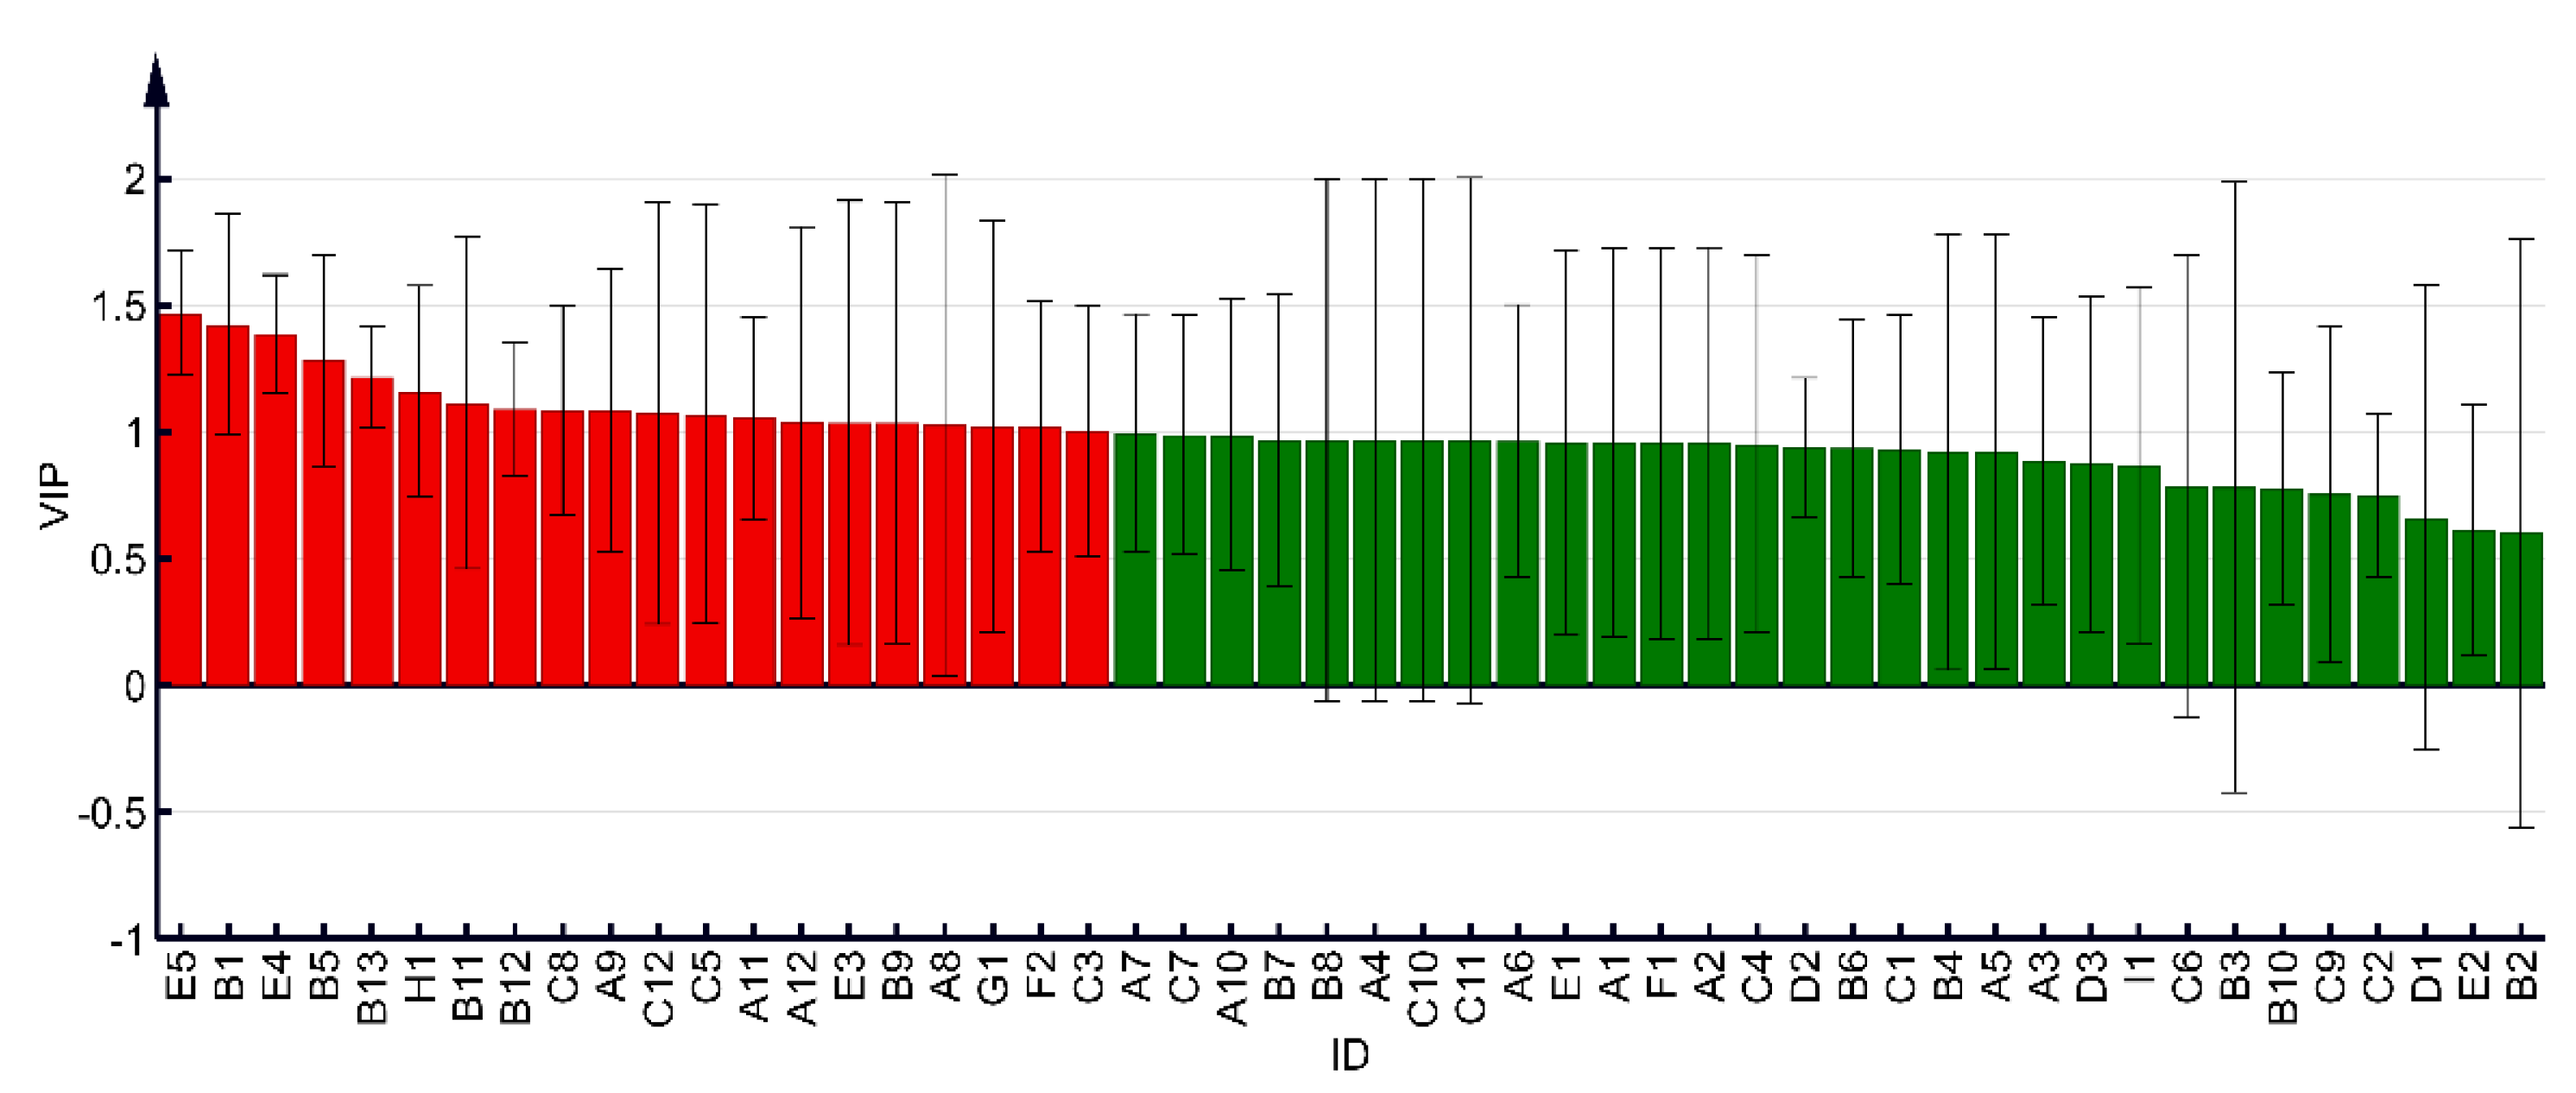
Using the OPLS-DA model for discriminant analysis of alfalfa, the model quality parameters were R2X = 0.768, R2Y = 0.993, Q2 = 0.972, both greater than 0.7, indicating that the model had a good fitting ability, and predictive ability [17,18]. As shown in Figure 2, according to VOCs, different harvesting periods of alfalfa can be clearly distinguished. The budding stages are shown in quadrant IV, early blooming in quadrant III, and full blooming in quadrant II. This shows that the harvest period significantly affects alfalfa VOCs (p < 0.05). As shown in Figure 3, the OPLS-DA model screened a total of 20 compounds with variable importance in projection (VIP) > 1. The 20 VOCs included 4 aldehydes (2,5-dimethylbenzaldehyde, 3-cyclohexadiene-1-carboxaldehyde,2,6,6-trimethyl-1, 2,6,6-trimethyl-1-cyclohexene-1-carboxaldehyde, benzeneacetaldehyde,a-ethylidene-), 6 ketones (6-methyl-5-hepten-2-one, 2-cyclopenten-1-one,3,4,3-trimethyl-, 6-methl-3-(1-methlethyl)-2-(2-oxopropyl)-cyclohexanone, geranylacetone, 4-(2,6,6-trimethyl-1-cyclohexenyl)-3-buten-2-one, 2-pentadecanone,6,10,14-trimethyl-), 4 alcohols(linalool, 2,6-dimethylcyclohexanol, phenethyl alcohol, 2-[(9Z)-9-octadecenyloxy]-ethanol), 3 hydrocarbons (dodecane,5,8-diethyl-, 9-hexylheptadecane, 2,6,10-trimethyl-tetradecane), 1 phenol (5-allylguaiacol), 1 sulfide (dimethyl sulfide), and 1 heterocyclic(2-pentylfuran). These 20 VOCs are the differential VOCs for the different harvest periods of alfalfa.
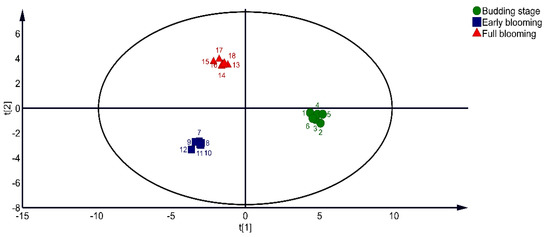
Figure 2.
OPLS−DA 2D scores of alfalfa at different harvest periods.
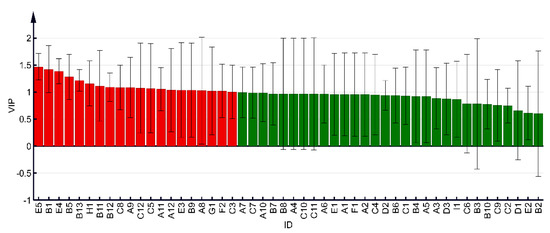
Figure 3.
VIP map of VOCs in alfalfa at different harvest periods.
3.2. Nutritional Value of Alfalfa in Different Harvest Periods
As shown in Figure 4, the harvest period on alfalfa nutrition was an obvious impact (p < 0.05). Delayed harvest significantly improves alfalfa hay yields, with yields up to 6095 Kg/hm2 at full blooming, and at the same time a substantially increases DM ADF and NDF accumulation (p < 0.05). However, it also significantly reduces the quality of alfalfa, the accumulation of CP and TND significantly decreased with the prolongation of alfalfa growth time, especially the CP content significantly decreased at the full flowering stage (p < 0.05).
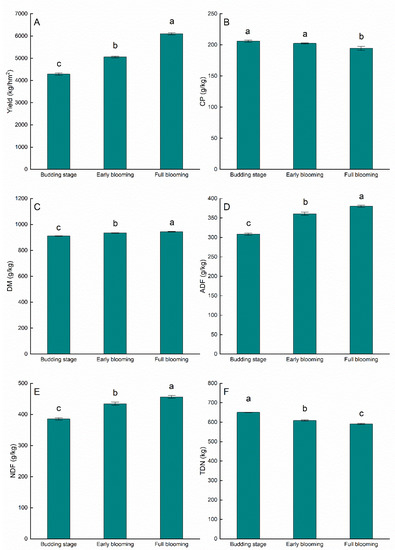
Figure 4.
The effects of harvest period on nutritional quality of alfalfa (A–F). (A) yield, (B) crude protein (CP), (C) dry matter (DM), (D) acid detergent fiber (ADF), (E) neutral detergent fiber (NDF), (F) total digestible nutrients (TDN). Bars indicate standard error of the means. Different lowercase letters indicate significant difference at p < 0.05.
3.3. Comprehensive Analysis of Alfalfa Quality at Different Harvest Periods
As a high quality roughage, the nutritional quality of alfalfa has always been the focus of consumers, but in recent years, the sensory quality of alfalfa has also become a primary indicator used in alfalfa grading. Hence, it is necessary to do a comprehensive analysis of alfalfa’s yield nutritional quality and sensory quality, which was used to jointly determine the optimal harvest period for alfalfa.
Adopting the theory of comprehensive evaluation method of affiliation function, the affiliation function of alfalfa was established as μ(x), the single-factor affiliation of the i indicator was calculated as μi(x) according to Equations (2) and (3).
When i is a positive indicator:
where: μi(x) is the single-factor affiliation of each indicator, x is the actual level of an indicator, a is the worst level of the indicator, b is the average level of the indicator, and c is the best level of the indicator.
When i is the negative indicator:
where a is the best level of the indicator, b is the average level of the indicator, and c is the worst level of the indicator.
The comprehensive affiliation degree is calculated according to Equation (4), where wi is the weight function of indicator i, μi(x) is the single factor affiliation of indicator i, ∑wi = 1.
Using Equations (5) and (6), the coefficient of variation method was used to determine the weights for normalization of each indicator.
Table 2 gives the results of comprehensively evaluating the quality of alfalfa at different harvest periods after considering yield, nutrition, and VOCs. Results showed that the comprehensive score in the budding stage was 0.6099, indicating the best quality. the budding stage harvests alfalfa with a strong grass flavor, high yields, and good nutritional quality for maximum economic value.
Table 2.
Quality ranking of alfalfa at different harvest periods.
3.4. Analysis of VOCs at Different Storage Durations
As shown in Table 3, excluding of siloxanes and their derivatives due to extraction fiber and column loss, 48 VOCs were detected during storage, including 15 aldehydes, 10 ketones, 13 alcohols, 2 esters, 2 phenols, 2 hydrocarbons, 2 heterocyclic compounds, 1 aromatic, and 1 sulfide. The content of compound hexanal (fresh green odor), benzaldehyde (fruity odor), trans,trans-2,4-heptadienal (fatty odor), phenylacetaldehyde (green floral odor), 1-nonanal (rose fresh orris odor), 3-cyclohexadiene-1-carboxaldehyde, 2,6,6-trimethyl-1 (woody odor), 2,6,6-trimethyl-1-cyclohexene-1-carboxaldehyde (fruity odor), 3,5-octadien-2-one,(E,E)- (fruity green grassy odor), geranylacetone (fresh green fruity odor), 4-(2,6,6-trimethyl-1-cyclohexenyl)-3-buten-2-one (floral woody odor), and 2-pentylfuran (fruity green) at 0 d storage was significantly higher than that at other storage stages (p < 0.05). The content of compound benzyl alcohol (floral odor), phenethyl alcohol (floral odor) at 360 d storage was significantly higher than that at other storage stages (p < 0.05). Storage 360 d 2-methylbutyraldehyde(musty), 1-octen-3-one (earthy musty odor) content increased, these may be the key compounds that causes the smell of fresh alfalfa grass to fade away and a musty smell to emerge.
Table 3.
Changes of VOCs in alfalfa during storage.
As shown in Figure 5, aldehydes, alcohols and esters were the highest, while ketones were the lowest after 0 days of storage (p < 0.05); ketones increased significantly and aldehydes decreased significantly after 360 days of storage (p < 0.05).
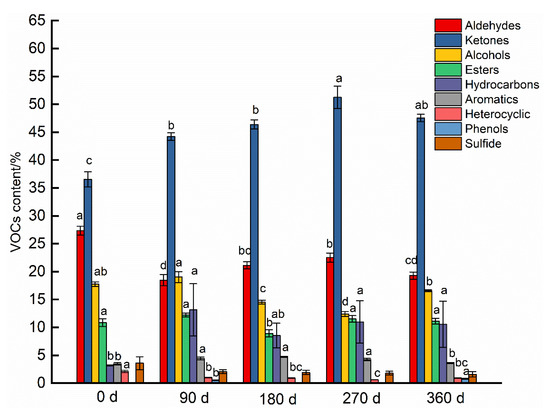
Figure 5.
Changes of VOCs in alfalfa at different storage durations. Different lowercase letters indicate significant difference at p < 0.05.
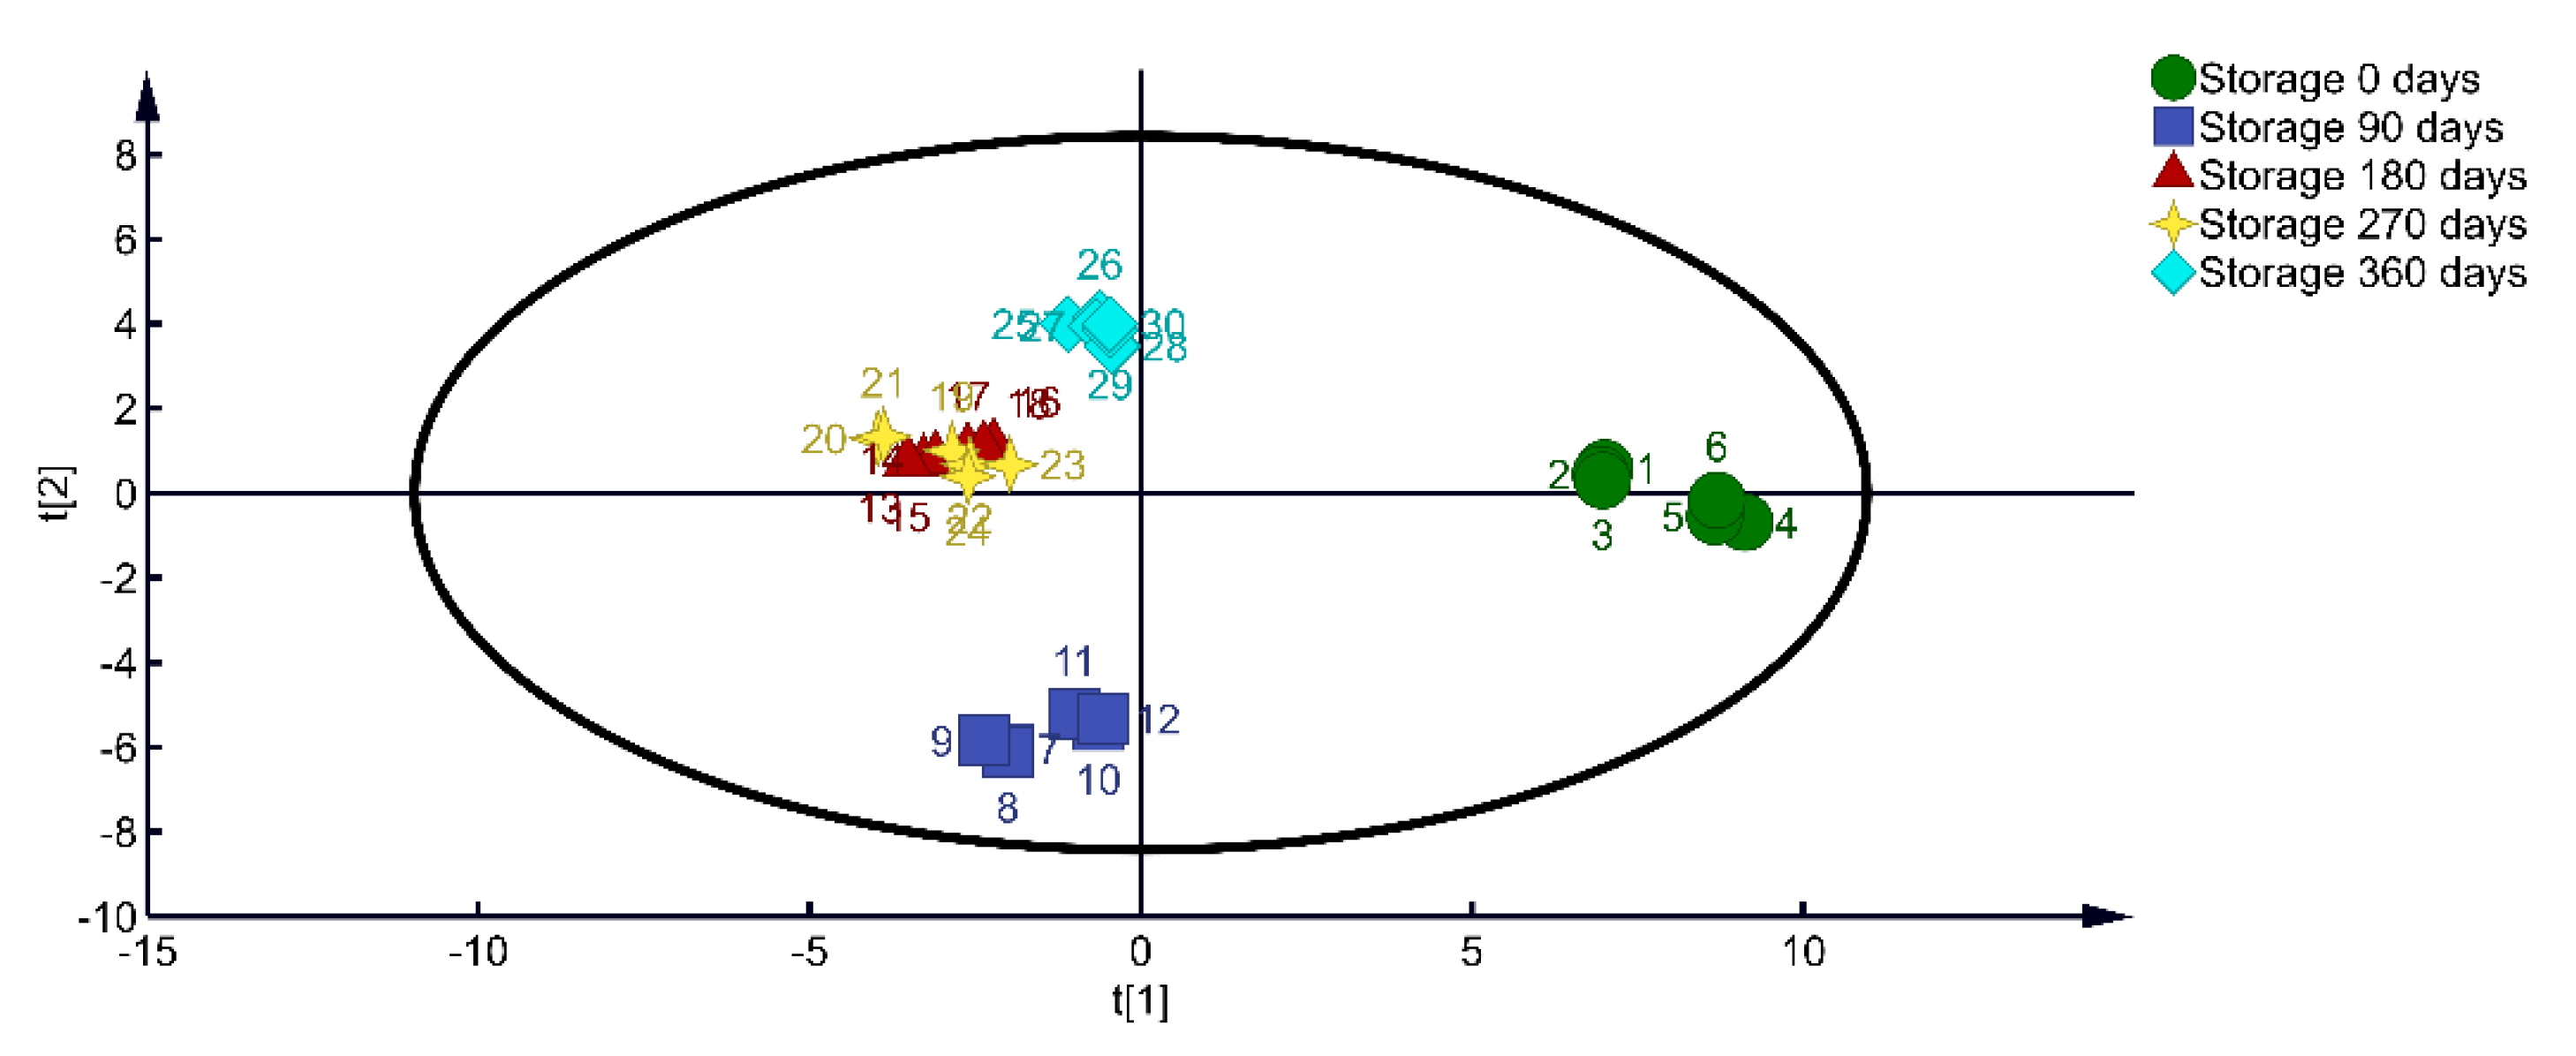
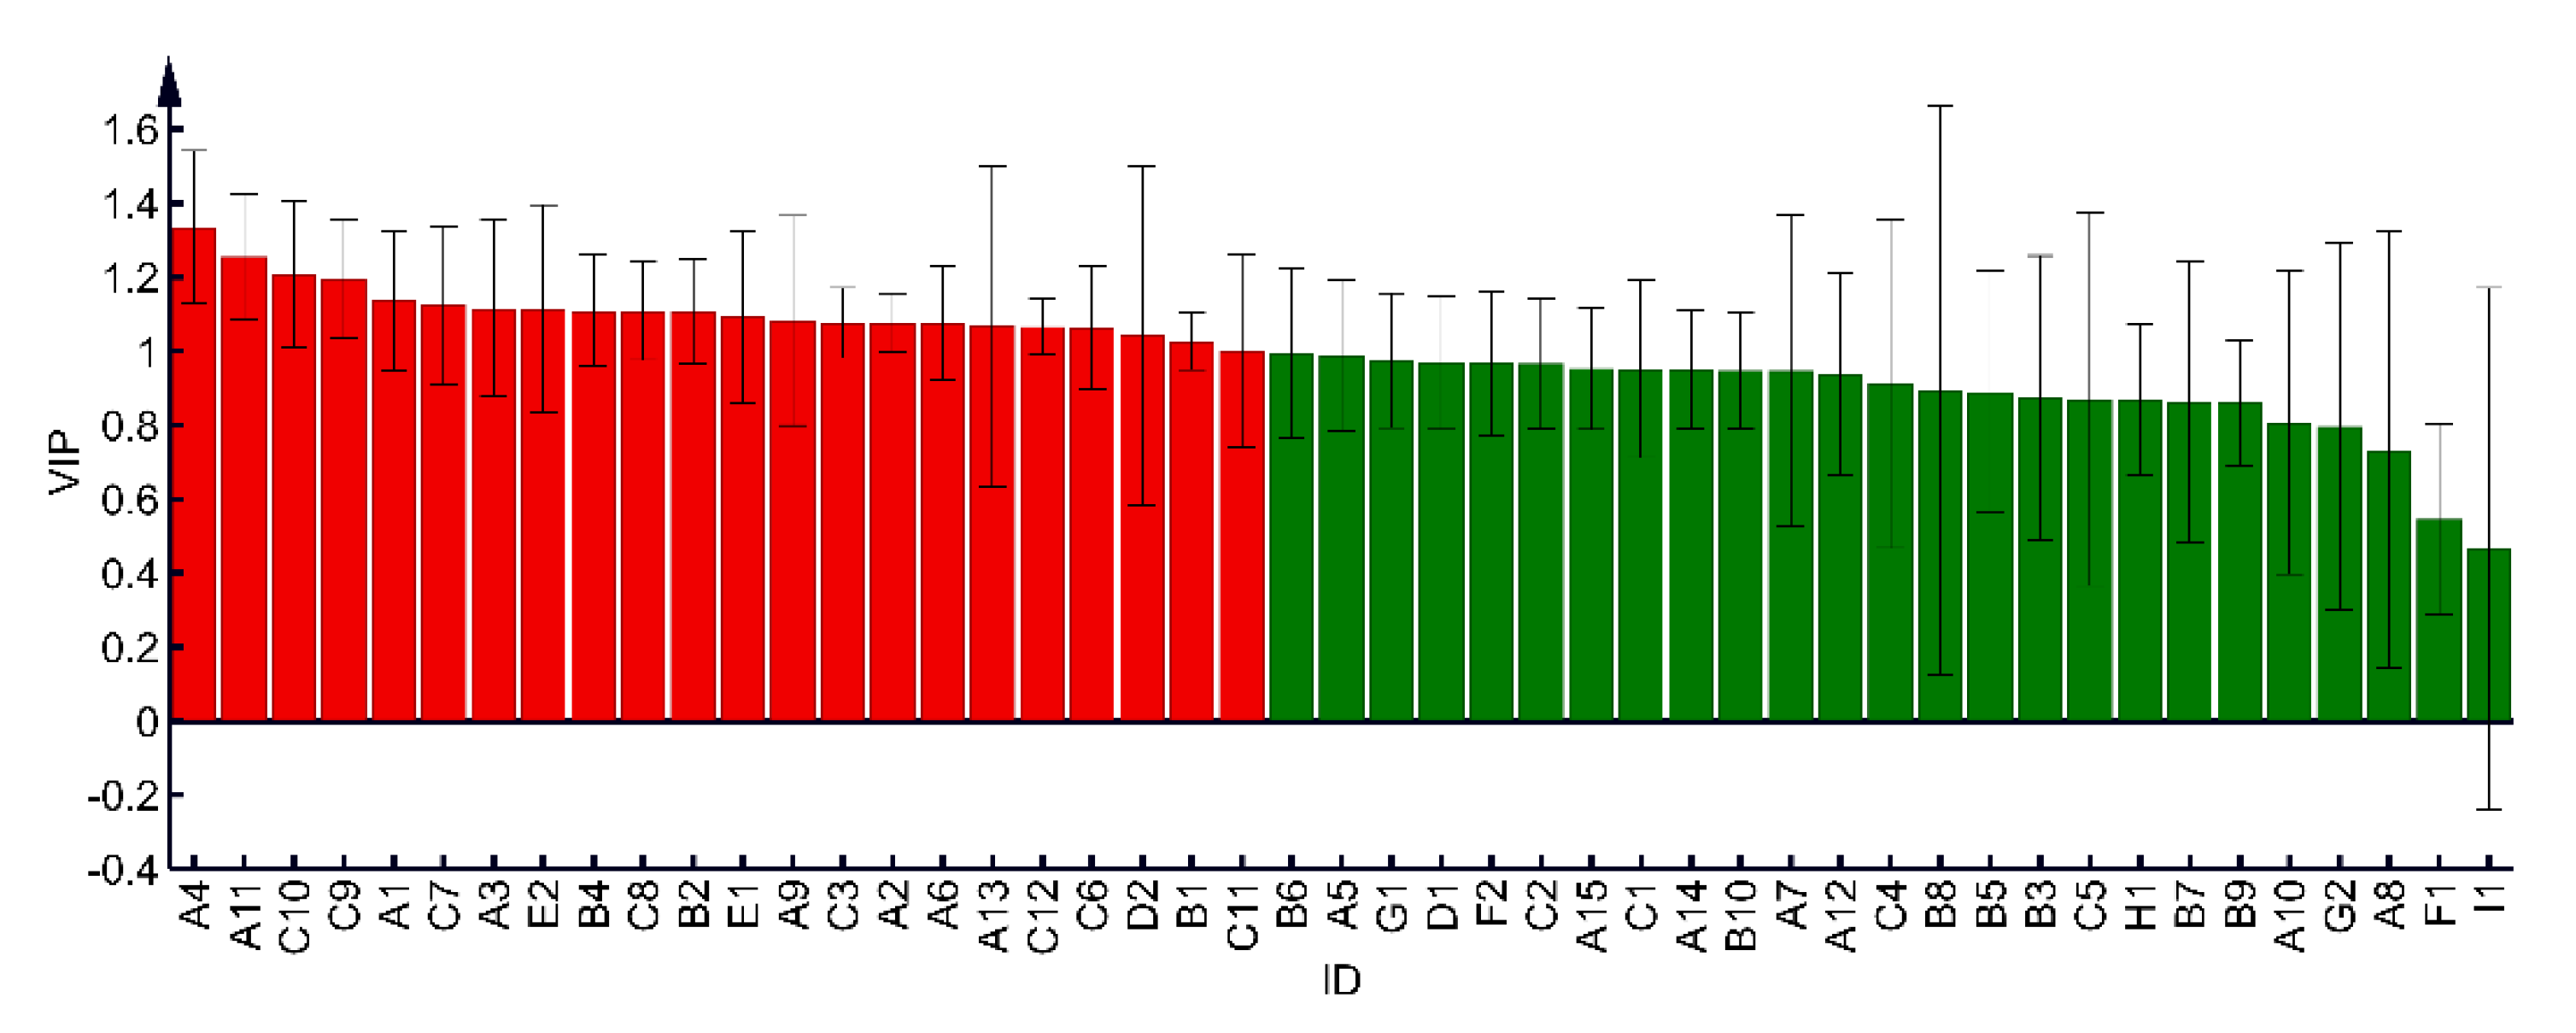
As shown in Figure 6, using the OPLS-DA model for discriminant analysis of alfalfa, the model quality parameters were R2X = 0.809, R2Y = 0.973, Q2 = 0.958, all of which are greater than 0.7, indicating that the model analysis results are accurate. In different storage durations, alfalfa VOCs whole have significant differences (p < 0.05). According to the VOCs classification, alfalfa hay stored for 0 days was between quadrant 1 and quadrant 4, alfalfa hay stored for 90 days is in the 3 quadrant, alfalfa stored for 180, 270 and 360 days was in the second quadrant; this showed that the VOCs change in alfalfa hay was more intense in the 180 days before storage, the VOCs of alfalfa hay tended to be stable after storage for 180 days. As shown in Figure 7, a total of 22 compounds had VIP > 1, VIP > 1 indicated that these 22 compounds were differential compounds of alfalfa hay at different storage time. Among these 22 compounds were 8 aldehydes (isovaleraldehyde, 2-methylbutyraldehyde, hexanal, trans-2-hexenal, (E)-2-octenal, (E)-hexadec-2-enal, 2,5-dimethylbenzaldehyde, decanal), 3 ketones (1-octen-3-one, 1-hepten-3-one, 3,5-octadien-2-one), 8 alcohols (3,5-Octadien-2-ol, cycloheptanol, phenethyl alcohol, 1-tricosanol, €-1-(1-hexenyl)-cyclohexanol, 3,7,11-trimethyl-1-dodecanol, 2-octadecoxyethanol, 2-[(9Z)-9-octadecenyloxy]-ethanol), 2 phenols (3-allyl-6-methoxyphenol, eugenol), and 1 ester((2,6,6-trimethyl-2-hydroxycyclohexylidene)acetic acid lactone).
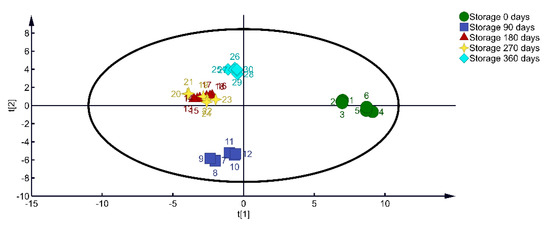
Figure 6.
OPLS−DA 2D scores of alfalfa at different storage durations.

Figure 7.
VIP map of VOCs during storage of alfalfa.
3.5. Nutritional Quality Analysis of Alfalfa at Different Storage Durations
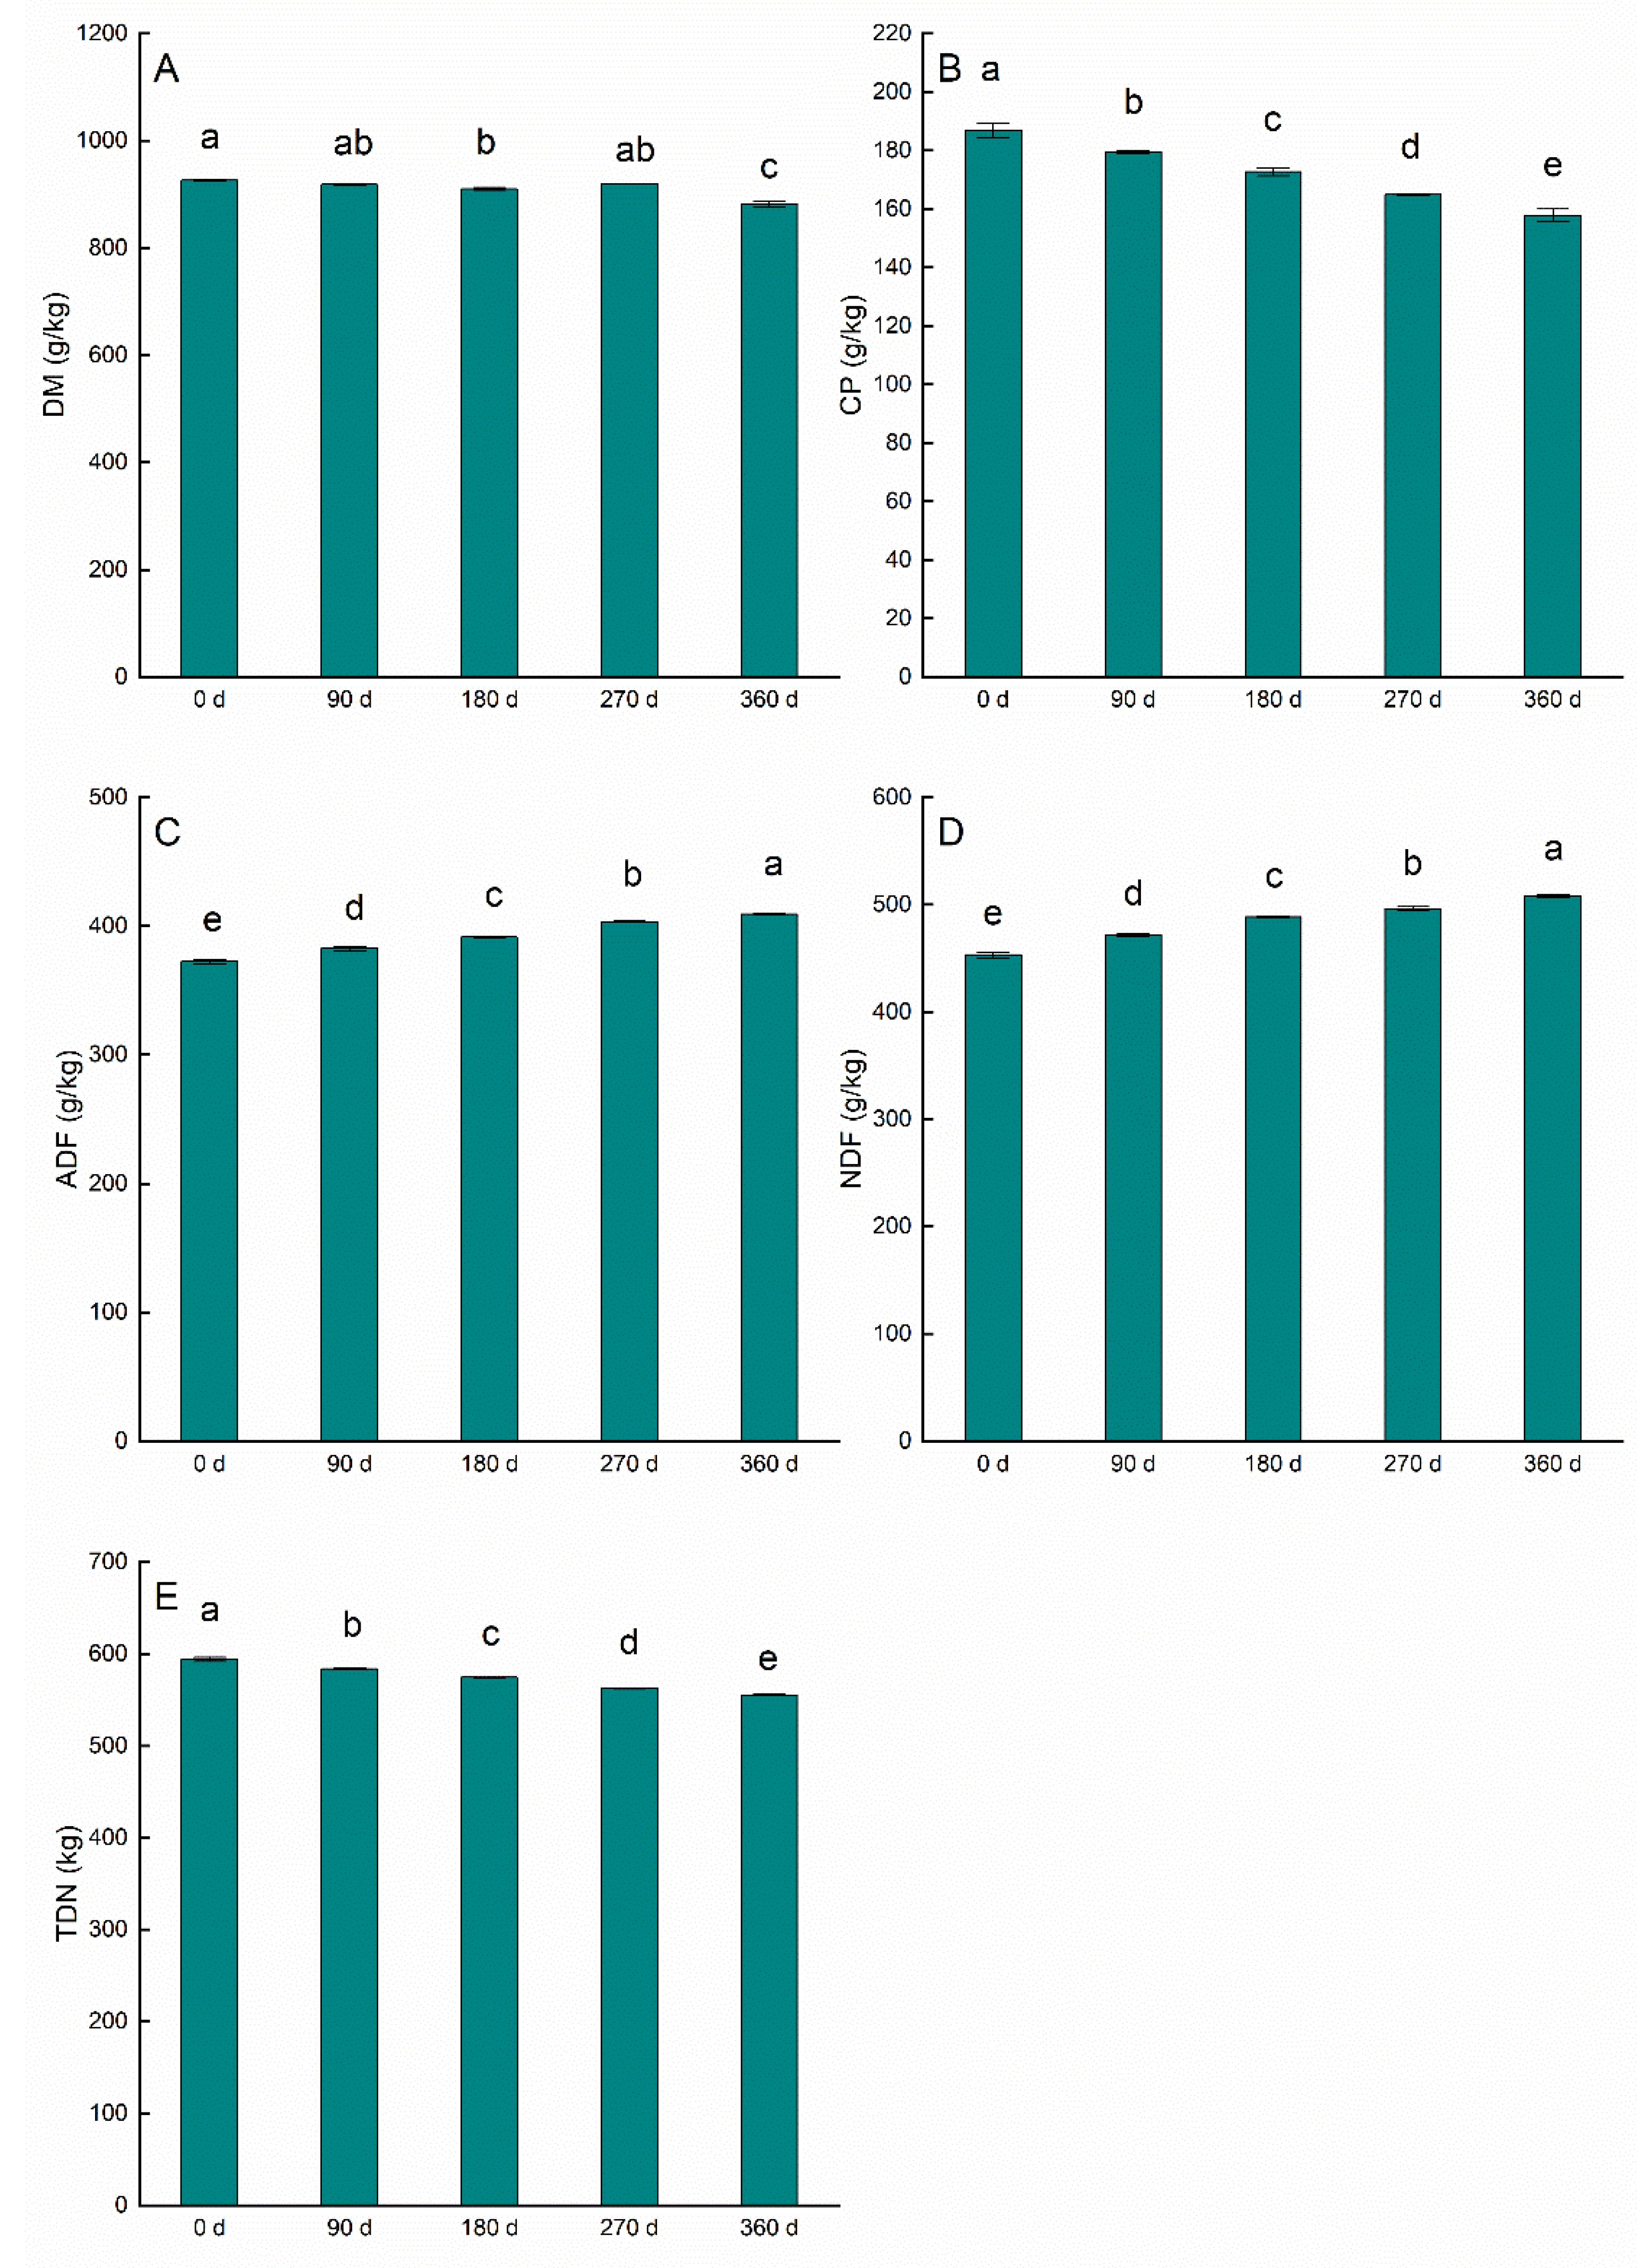
As shown in Figure 8, the storage durations have a clear effect on alfalfa nutrition (p < 0.05). Extended storage durations significantly decrease alfalfa DM, CP content, and TDN (p < 0.05), and increase ADF and NDF content (p < 0.05).

Figure 8.
The effects of storage durations on nutritional quality of alfalfa (A–E). (A) dry matter (DM), (B) crude protein (CP), (C) acid detergent fiber (ADF), (D) neutral detergent fiber (NDF), (E) total digestible nutrients (TDN). Bars indicate standard error of the means. Different lowercase letters indicate significant difference at p < 0.05.
3.6. The Relationship between Nutrients and VOCs
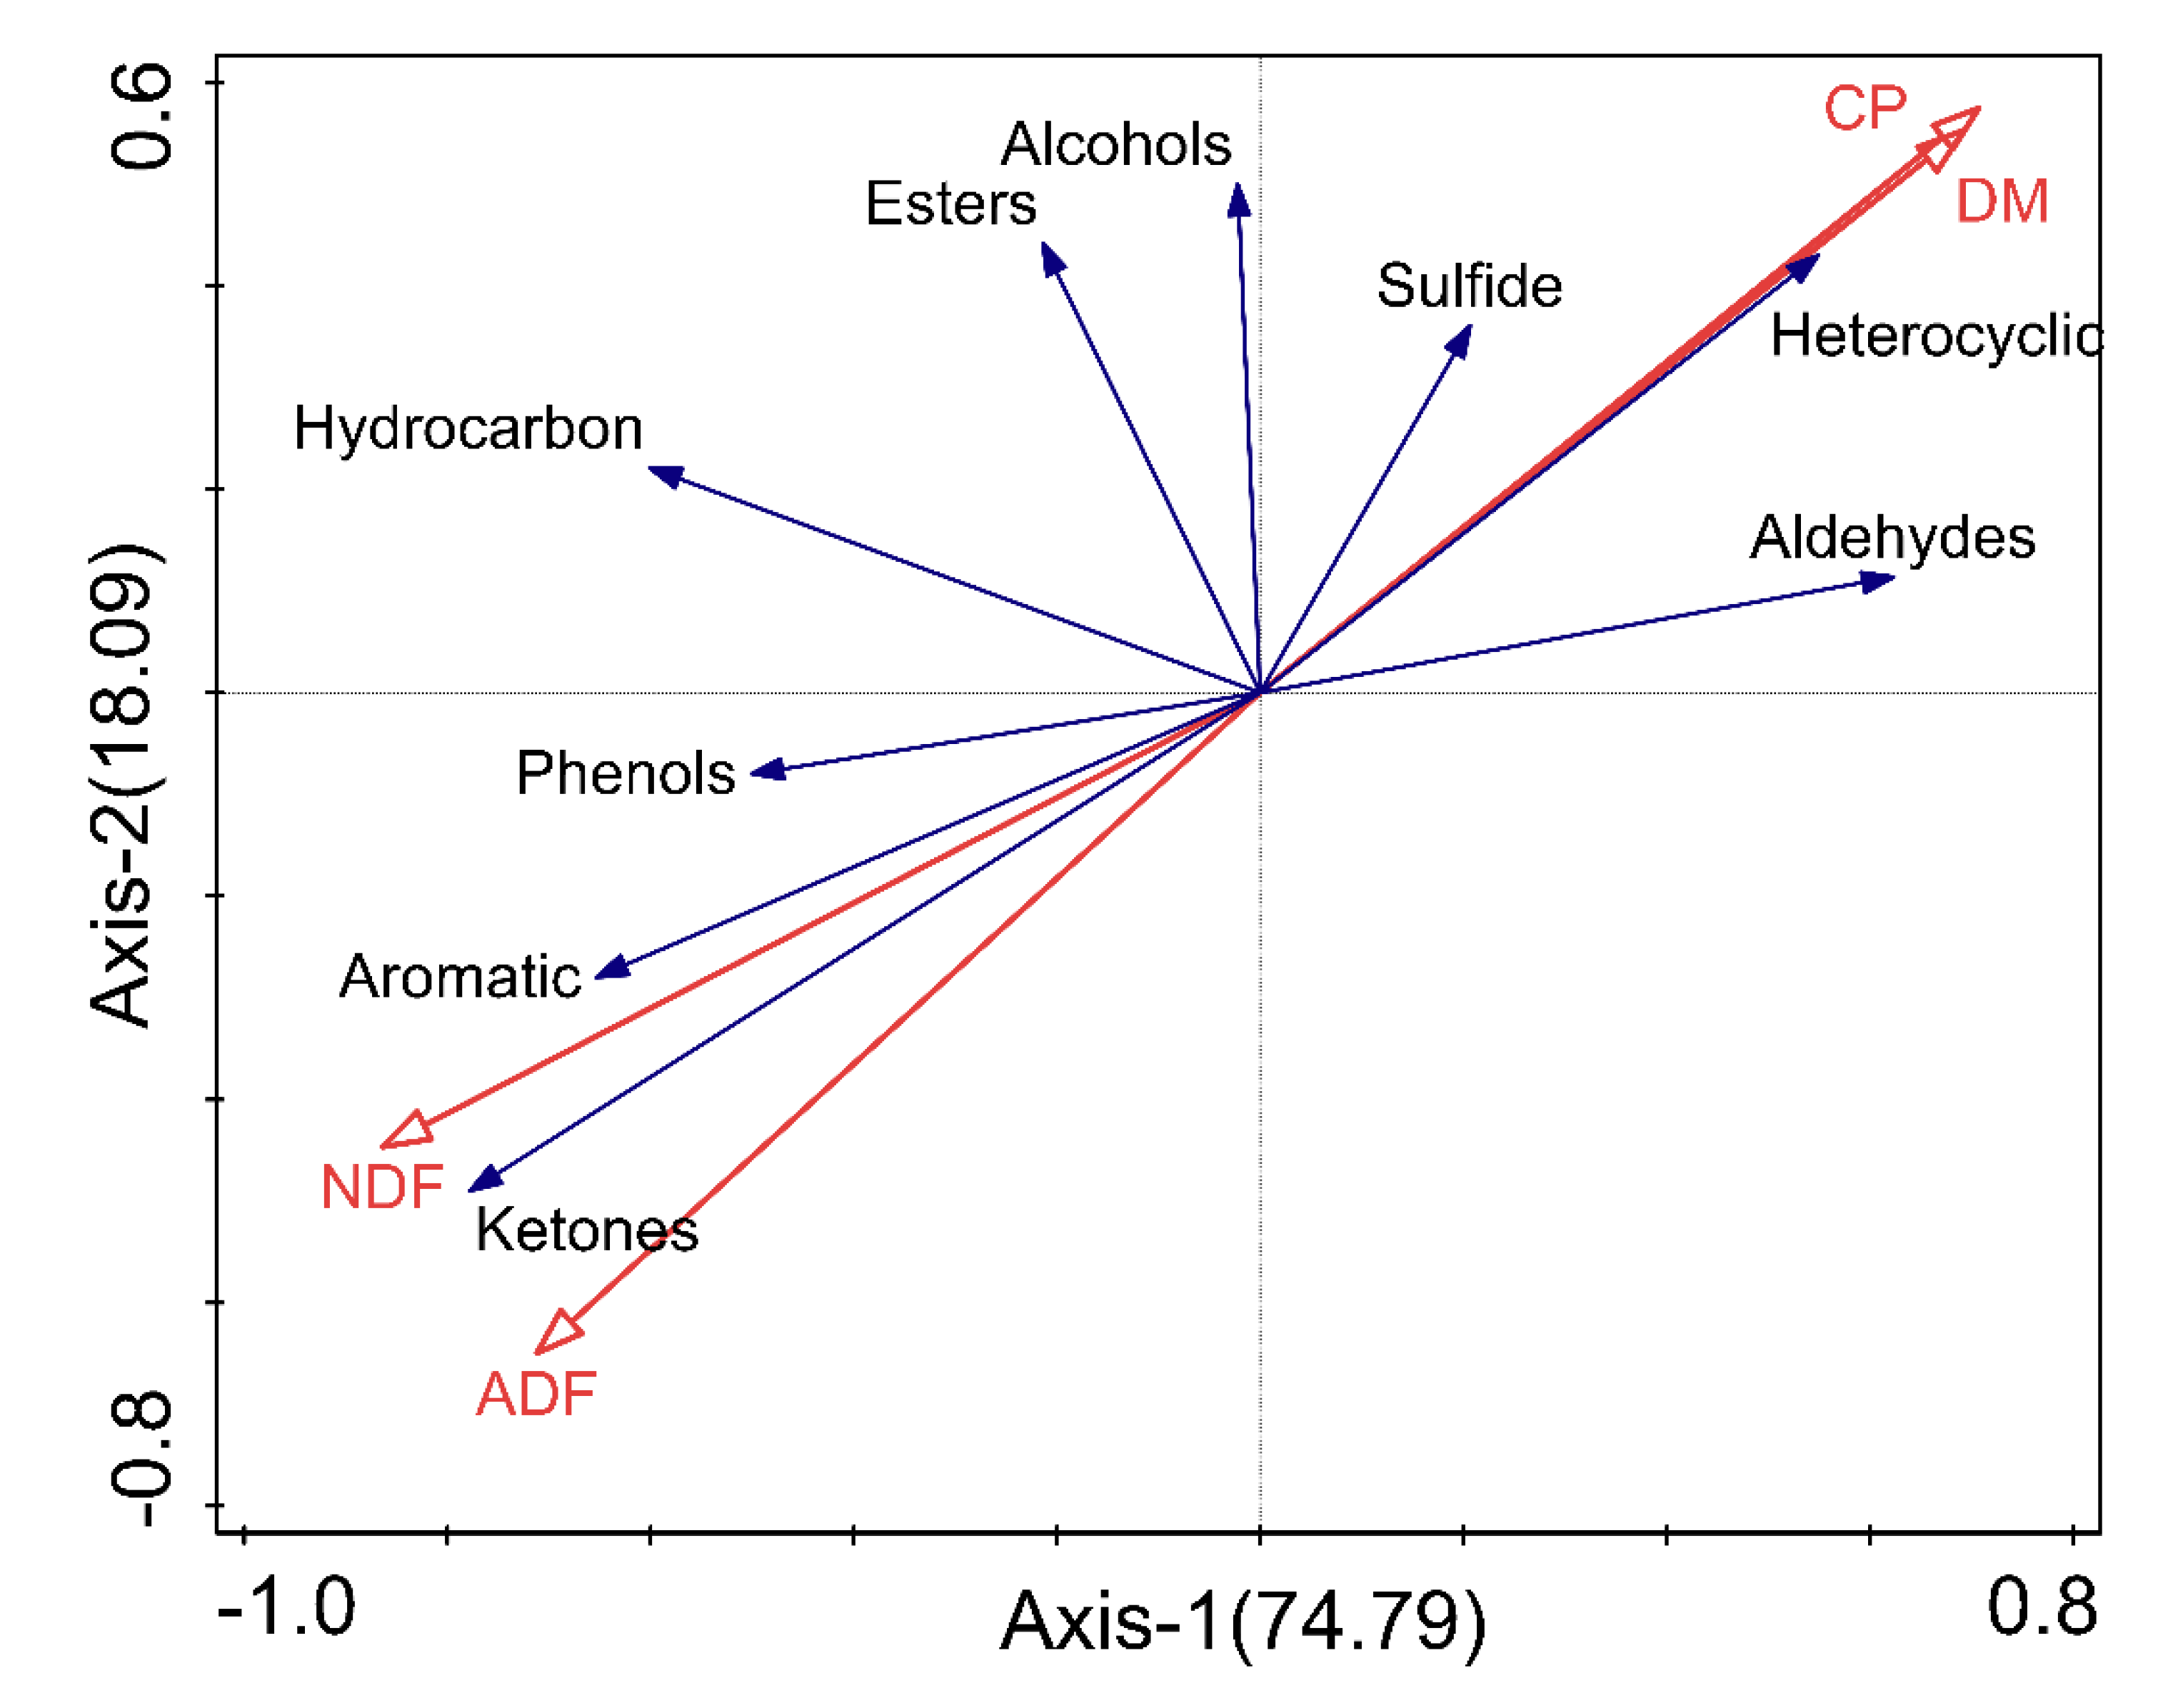
There is an inextricable link between nutrients and volatile organic compounds, as evidenced by many agricultural products such as apples and papayas [19,20,21]. As shown in Figure 9, the RDA results for Axis1 and Axis2 explained a total of 92.88% of the variation. The correlations between nutrients and VOCs are indicated by the angles of the red and blue arrows, arrows pointing in almost the same direction indicate a highly positive correlations, while arrows oriented at right angles indicate nearly zero correlation, and arrows pointing in opposite directions indicate a highly negative correlations [22]. There was a positive correlation between ADF and NDF and ketones, aromatic, hydrocarbon, and phenolic compounds. NDF had a significant effect on the formation of ketones, aromatics, hydrocarbon, and phenolics, especially for ketones (NDF F = 5.5, p = 0.024). There was a positive correlation between CP, DM and heterocycles, aldehydes, sulfides, and alcohols (p > 0.05).
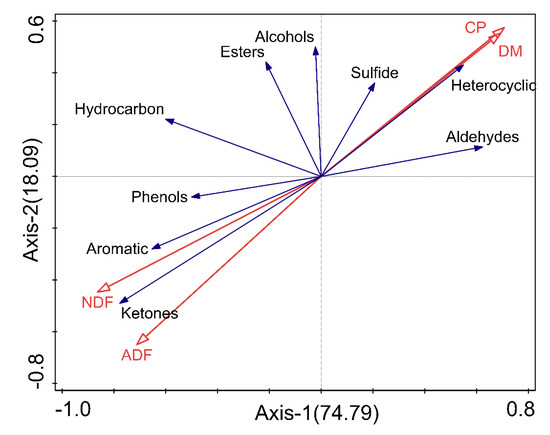
Figure 9.
Redundancy analysis of alfalfa nutrition and VOCs. The cosine value between nutrition and VOCs represents the correlation between them. A positive cosine value indicates a positive correlation, and a negative value represents a negative correlation. The red arrow represents the nutritional indicators of alfalfa, purple arrows indicate alfalfa VOCs. The length of the line indicates the magnitude of the contribution of the nutrient to explaining the formation of VOCs.
4. Discussion
VOCs analyses play an essential role in the quality control of agricultural products such as apples, mangoes, olive oil, and tomatoes and in assessing consumer preferences [23,24,25,26]. However, few researchers have focused on VOCs in forage. Aldehydes have green and fruity aromas, while sulfides have a pungent odor similar to that of onions; therefore, livestock will prefer forage with high aldehyde content and low sulfide content [27]. In this study, the content of aldehydes in budding alfalfa was higher, which may be the reason why livestock prefer to eat fresh alfalfa. Among the VOCs released by plants, terpenoids are considered to be the main compounds responsible for the decrease in palatability [28]. Terpenoids are toxic when ingested in specific amounts [29], the feedback mechanism after a certain amount of terpenoids has been consumed by livestock will prevent further intake of terpenoid-containing feed [30]. There are also strong links between nutrients and VOCs; more ketones compound were released when rice quality decreased during storage [31], ketones mainly came from the oxidation of polyunsaturated fatty acids, or the degradation or oxidation of amino acids [32]. In this study delayed mowing and prolonged storage time led to the deterioration of alfalfa quality, while the amino acids in the CP degraded into ketones, therefore, ketones increase in content. ketones is an indicator compound for the deterioration of alfalfa quality.
The effect of the harvest period on the quality of alfalfa has been extensively and intensively studied worldwide. The DM accumulation in legumes of with increasing maturity is important for proper timing of the harvest, as even though delaying the harvest will increase the DM yield of the crop significantly, the quality, the CP content in the DM, will decline [33]. Earlier harvested alfalfa has lower fiber content and higher protein content and later harvested alfalfa will have higher WSC content [34]. In this study, delayed harvesting decreased alfalfa quality, but also greatly increased alfalfa yield; alfalfa growers may abandon the improvement of nutritional quality in alfalfa in favor of higher yields, therefore delayed harvest may be a suitable option. The optimum mowing period is determined to be at the budding stage of emergence, taking into account yield, nutritional quality, and VOCs indicators. The earlier harvest shortened the growing season of alfalfa, meaning that alfalfa was harvested more frequently. The economic losses caused by early harvesting can be compensated for by increasing the frequency of harvesting, if there are greater economic returns from harvesting at 28 day intervals than at 35 day intervals [35,36].
Spontaneous heating of forage during storage has been found to be very pronounced, with fiber content being significantly and positively correlated with spontaneous heating [37,38,39]. After baling alfalfa, the internal temperature of the bale gradually increases, resulting in an increase in fiber content, while the high temperature increases acidic detergent insoluble N, thus reducing rumen digestibility of DM and CP [40]. Changes in quality generally coincide with changes in VOCs. Therefore, the quality can also be determined by the detection of VOCs. Prolonged storage can lead to mildew and spoilage of alfalfa hay. In this study, although no significant mildew was seen in the hay during the long storage period, the moldy odor compound 2-methylbutyraldehyde could be detected at 0d, 360d storage, indicating that the alfalfa is already showing signs of mildew; the mildew smell detected at 0 days of storage may be caused by soil mixed in the baling process. The content of 2-methylbutyraldehyde, 1-octen-3-one increased after 360 days of storage, indicating an increased risk of mildew. VOCs have been used extensively in the fruit and grain sectors for quality testing [10,41], and even for plant pest and disease diagnosis [42,43]. However, this technology has not yet been applied to forage-quality testing. The establishment of a forage quality testing technology based on VOCs would bring great economic returns to forage growers and farmers.
5. Conclusions
After comprehensive consideration of the yield, nutritional quality and VOCs of alfalfa, the best harvest time was budding stage. The mildew risk of alfalfa increased after 360 days of storage. During harvest and storage, the reduction in alfalfa quality was accompanied by an increase in ketones compound, the content of ketone compounds can reflect the quality of alfalfa. This study provides useful knowledge for rational harvesting and safe storage of alfalfa.
Author Contributions
Conceptualization, N.Y., G.G. and Y.J.; methodology, N.Y., S.D. and Z.W.; formal analysis, N.Y., Y.L. and J.H.; investigation, N.Y., M.Z. and Q.S.; data curation, N.Y., J.B. and L.S.; writing—original draft preparation, N.Y.; writing—review and editing, Y.J. and N.Y.; funding acquisition, Y.J. All authors have read and agreed to the published version of the manuscript.
Funding
This research was funded by the Inner Mongolia Science and Technology Plan (2021GG0109) and “National Dairy Technology Innovation Center to create” key project (2021-National Dairy Innovation Center-1).
Institutional Review Board Statement
Not applicable.
Informed Consent Statement
Not applicable.
Data Availability Statement
The data presented in this study are available on request from the author.
Acknowledgments
We are grateful for grants from the Key Laboratory of Forage Cultivation, Processing and High Efficient Utilization of Ministry of Agriculture and Rural Affairs, Key Laboratory of Grassland Resources, Ministry of Education Inner Mongolia Agricultural University. We would like to thank the editor and the reviewers for their useful feedback that improved this paper.
Conflicts of Interest
The authors declare no conflict of interest.
References
- Cheng, Q.M.; Bai, S.Q.; Ge, G.T.; Li, P.; Liu, L.Y.; Zhang, C.D.; Jia, Y.S. Study on differentially expressed genes related to defoliation traits in two alfalfa varieties based on RNA-Seq. BMC Genom. 2018, 19, 807. [Google Scholar] [CrossRef] [PubMed] [Green Version]
- Ji, Y.; Yuan, S.; Fu, H.; Yang, S.; Bu, F.; Li, X.; Wu, X. Activity strategy and pattern of the Siberian jerboa (Orientallactaga sibirica) in the Alxa desert region, China. PeerJ 2021, 9, e10996. [Google Scholar] [CrossRef] [PubMed]
- Ma, Q.; Xu, X.; Wang, W.; Zhao, L.; Ma, D.; Xie, Y. Comparative analysis of alfalfa (Medicago sativa L.) seedling transcriptomes reveals genotype-specific drought tolerance mechanisms. Plant Physiol. Biochem. 2021, 166, 203–214. [Google Scholar] [CrossRef]
- Owen, J. Genetic aspects of appetite and feed choice in animals. J. Agric. Sci. 1992, 119, 151–155. [Google Scholar] [CrossRef]
- Tava, A.; Berardo, N.; Cunico, C.; Romani, M.; Odoardi, M. Cultivar differences and seasonal changes of primary metabolites and flavor constituents in tall fescue in relation to palatability. J. Agric. Food Chem. 1995, 43, 98–101. [Google Scholar] [CrossRef]
- Chen, J.; Tao, L.; Zhang, T.; Zhang, J.; Wu, T.; Luan, D.; Ni, L.; Wang, X.; Zhong, J. Effect of four types of thermal processing methods on the aroma profiles of acidity regulator-treated tilapia muscles using E-nose, HS-SPME-GC-MS, and HS-GC-IMS. LWT 2021, 147, 111585. [Google Scholar] [CrossRef]
- Ye, N.S.; Zhang, L.Q.; Gu, X.X. Discrimination of Green Teas from Different Geographical Origins by Using HS-SPME/GC-MS and Pattern Recognition Methods. Food Anal. Methods 2012, 5, 856–860. [Google Scholar] [CrossRef]
- Zhang, D.D.; Wu, W.H.; Qiu, X.H.; Li, X.J.; Zhao, F.; Ye, N.X. Rapid and direct identification of the origin of white tea with proton transfer reaction time-of-flight mass spectrometry. Rapid Commun. Mass Spectrom. 2020, 34, e8830. [Google Scholar] [CrossRef]
- Lin, S.Y.; Lo, L.C.; Chen, I.Z.; Chen, P.A. Effect of shaking process on correlations between catechins and volatiles in oolong tea. J. Food Drug Anal. 2016, 24, 500–507. [Google Scholar] [CrossRef] [PubMed] [Green Version]
- Liu, K.W.; Zhang, C.; Xu, J.Y.; Liu, Q.Q. Research advance in gas detection of volatile organic compounds released in rice quality deterioration process. Compr. Rev. Food Sci. Food Saf. 2021, 20, 5802–5828. [Google Scholar] [CrossRef] [PubMed]
- Wenda-Piesik, A.; Piesik, D.; Ligor, T.; Buszewski, B. Volatile organic compounds (VOCs) from cereal plants infested with crown rot: Their identity and their capacity for inducing production of VOCs in uninfested plants. Int. J. Pest Manag. 2010, 56, 377–383. [Google Scholar] [CrossRef]
- Ficke, A.; Asalf, B.; Norli, H.R. Volatile Organic Compound Profiles From Wheat Diseases Are Pathogen-Specific and Can Be Exploited for Disease Classification. Front. Microbiol. 2022, 12, 803352. [Google Scholar] [CrossRef] [PubMed]
- Chen, J.M.; Zeng, J.B.; Chen, W.F.; Huang, X.L.; Chen, X. Development of New Coatings for Solid Phase Microextraction. Prog. Chem. 2009, 21, 1922–1929. [Google Scholar]
- Nam, T.G.; Lee, J.Y.; Kim, B.K.; Song, N.E.; Jang, H.W. Analyzing volatiles in brown rice vinegar by headspace solid-phase microextraction (SPME)-Arrow: Optimizing the extraction conditions and comparisons with conventional SPME. Int. J. Food Prop. 2019, 22, 1195–1204. [Google Scholar] [CrossRef] [Green Version]
- Hu, G. Advances of solid-phase microextraction and current status of application in food analysis. Chin. J. Chromatogr. 2009, 27, 1–8. [Google Scholar]
- Zhang, W.; Cao, J.; Li, Z.; Li, Q.; Lai, X.; Sun, L.; Chen, R.; Wen, S.; Sun, S.; Lai, Z. HS-SPME and GC/MS volatile component analysis of Yinghong No. 9 dark tea during the pile fermentation process. Food Chem. 2021, 357, 129654. [Google Scholar] [CrossRef] [PubMed]
- Loulier, J.; Lefort, F.; Stocki, M.; Asztemborska, M.; Szmigielski, R.; Siwek, K.; Grzywacz, T.; Hsiang, T.; Slusarski, S.; Oszako, T.; et al. Detection of Fungi and Oomycetes by Volatiles Using E-Nose and SPME-GC/MS Platforms. Molecules 2020, 25, 5749. [Google Scholar] [CrossRef]
- Mickiewicz, B.; Tam, P.; Jenne, C.N.; Leger, C.; Wong, J.; Winston, B.W.; Doig, C.; Kubes, P.; Vogel, H.J.; Network, A.S. Integration of metabolic and inflammatory mediator profiles as a potential prognostic approach for septic shock in the intensive care unit. Crit. Care 2015, 19, 11. [Google Scholar] [CrossRef] [Green Version]
- Espichan, F.; Rojas, R.; Quispe, F.; Cabanac, G.; Marti, G. Metabolomic characterization of 5 native Peruvian chili peppers (Capsicum spp.) as a tool for species discrimination. Food Chem. 2022, 386, 132704. [Google Scholar] [CrossRef] [PubMed]
- Waghmode, B.; Masoodi, L.; Kushwaha, K.; Mir, J.I.; Sircar, D. Volatile components are non-invasive biomarkers to track shelf-life and nutritional changes in apple cv. ‘Golden Delicious’ during low-temperature postharvest storage. J. Food Compos. Anal. 2021, 102, 104075. [Google Scholar] [CrossRef]
- Spadafora, N.D.; Amaro, A.L.; Pereira, M.J.; Muller, C.T.; Pintado, M.; Rogers, H.J. Multi-trait analysis of post-harvest storage in rocket salad (Diplotaxis tenuifolia) links sensorial, volatile and nutritional data. Food Chem. 2016, 211, 114–123. [Google Scholar] [CrossRef] [Green Version]
- Kushwaha, K.; Saini, S.S.; Waghmode, B.; Gaid, M.; Agrawal, P.K.; Roy, P.; Sircar, D. Volatile components in papaya fruits are the non-invasive biomarkers to monitor the ripening stage and the nutritional value. Eur. Food Res. Technol. 2021, 247, 907–919. [Google Scholar] [CrossRef]
- Ferrao, L.F.V.; Johnson, T.S.; Benevenuto, J.; Edger, P.P.; Colquhoun, T.A.; Munoz, P.R. Genome-wide association of volatiles reveals candidate loci for blueberry flavor. New Phytol. 2020, 226, 1725–1737. [Google Scholar] [CrossRef]
- Roberts, G.; Spadafora, N.D. Analysis of Apple Flavours: The Use of Volatile Organic Compounds to Address Cultivar Differences and the Correlation between Consumer Appreciation and Aroma Profiling. J. Food Qual. 2020, 2020, 8497259. [Google Scholar] [CrossRef]
- Taiti, C.; Marone, E.; Bazihizina, N.; Caparrotta, S.; Azzarello, E.; Petrucci, A.W.; Pandolfi, C.; Giordani, E. Sometimes a Little Mango Goes a Long Way: A Rapid Approach to Assess How Different Shipping Systems Affect Fruit Commercial Quality. Food Anal. Methods 2016, 9, 691–698. [Google Scholar] [CrossRef]
- da Costa, J.R.O.; Dal Bosco, S.M.; Ramos, R.C.D.; Machado, I.C.K.; Garavaglia, J.; Villasclaras, S.S. Determination of volatile compounds responsible for sensory characteristics from Brazilian extra virgin olive oil using HS-SPME/GC-MS direct method. J. Food Sci. 2020, 85, 3764–3775. [Google Scholar] [CrossRef] [PubMed]
- D’Angelo, M.; Zanor, M.I.; Sance, M.; Cortina, P.R.; Boggio, S.B.; Asprelli, P.; Carrari, F.; Santiago, A.N.; Asis, R.; Peralta, I.E.; et al. Contrasting metabolic profiles of tasty Andean varieties of tomato fruit in comparison with commercial ones. J. Sci. Food Agric. 2018, 98, 4128–4134. [Google Scholar] [CrossRef] [PubMed]
- Rapisarda, T.; Mereu, A.; Cannas, A.; Belvedere, G.; Licitra, G.; Carpino, S. Volatile organic compounds and palatability of concentrates fed to lambs and ewes. Small Rumin. Res. 2012, 103, 120–132. [Google Scholar] [CrossRef]
- Zhang, R.M.; Zhang, W.G.; Zuo, Z.J.; Li, R.; Wu, J.H.; Gao, Y. Inhibition effects of volatile organic compounds from Artemisia frigida Willd. on the pasture grass intake by lambs. Small Rumin. Res. 2014, 121, 248–254. [Google Scholar] [CrossRef]
- Stegelmeier, B.L.; Gardner, D.R.; James, L.F.; Panter, K.E.; Molyneux, R.J. The toxic and abortifacient effects of ponderosa pine. Vet. Pathol. 1996, 33, 22–28. [Google Scholar] [CrossRef]
- Dziba, L.E.; Hall, J.O.; Provenza, F.D. Feeding Behavior of Lambs in Relation to Kinetics of 1,8-cineole Dosed Intravenously or into the Rumen. J. Chem. Ecol. 2006, 32, 391–408. [Google Scholar] [CrossRef]
- Zhao, Q.Y.; Yousaf, L.; Xue, Y.; Shen, Q. Changes in flavor of fragrant rice during storage under different conditions. J. Sci. Food Agric. 2020, 100, 3435–3444. [Google Scholar] [CrossRef]
- Dong, X.-P.; Li, D.-Y.; Huang, Y.; Wu, Q.; Liu, W.-T.; Qin, L.; Zhou, D.-Y.; Prakash, S.; Yu, C.-X. Nutritional value and flavor of turbot (Scophthalmus maximus) muscle as affected by cooking methods. Int. J. Food Prop. 2018, 21, 1972–1985. [Google Scholar] [CrossRef] [Green Version]
- Solati, Z.; Jorgensen, U.; Eriksen, J.; Soegaard, K. Dry matter yield, chemical composition and estimated extractable protein of legume and grass species during the spring growth. J. Sci. Food Agric. 2017, 97, 3958–3966. [Google Scholar] [CrossRef] [Green Version]
- Wang, J.P.; Wang, Q.Y.; Liu, N.; Xue, B.Q. Effects of supplementary with alfalfa hay collected in different mature stages on the performance of rabbits. In Livestock Environment VII, Proceedings of the Seventh International Symposium, Beijing, China, 18–20 May 2005; American Society of Agricultural and Biological Engineers: St. Joseph, MI, USA, 2005; pp. 593–599. [Google Scholar]
- Xu, X.; Min, D.; McDonald, I. Effects of harvest intervals and seeding rates on dry matter yield and nutritive value of alfalfa cultivars. J. Anim. Sci. Technol. 2021, 63, 1098–1113. [Google Scholar] [CrossRef]
- Brink, G.; Hall, M.; Shewmaker, G.; Undersander, D.; Martin, N.; Walgenbach, R. Changes in Alfalfa Yield and Nutritive Value within Individual Harvest Periods. Agron. J. 2010, 102, 1274–1282. [Google Scholar] [CrossRef] [Green Version]
- McBeth, L.J.; Coffey, K.P.; Coblentz, W.K.; Turner, J.E.; Scarbrough, D.A.; Bailey, C.R.; Stivarius, M.R. Impact of heating-degree-day accumulation during bermudagrass hay storage on nutrient utilization by lambs. J. Anim. Sci. 2001, 79, 2698–2703. [Google Scholar] [CrossRef]
- Coblentz, W.K. Effects of Wrapping Method and Soil Contact on Hay Stored in Large Round Bales in Central Wisconsin. Appl. Eng. Agric. 2009, 25, 835–850. [Google Scholar] [CrossRef]
- Coblentz, W.K.; Hoffman, P.C. Effects of spontaneous heating on fiber composition, fiber digestibility, and in situ disappearance kinetics of neutral detergent fiber for alfalfa-orchardgrass hays. J. Dairy Sci. 2009, 92, 2875–2895. [Google Scholar] [CrossRef] [Green Version]
- Guerrero, J.N.; Calderon-Cortes, J.F.; Montano-Gomez, M.F.; Gonzalez-Vizcarra, V.; Lopez-Soto, M.A. Effect of storage system and tarpaulin color on nutritional quality and digestibility of stored lucerne hay in the irrigated Sonoran Desert. Anim. Feed Sci. Technol. 2010, 162, 28–36. [Google Scholar] [CrossRef]
- Lin, H.; Kang, W.C.; Kutsanedzie, F.Y.H.; Chen, Q.S. A Novel Nanoscaled Chemo Dye-Based Sensor for the Identification of Volatile Organic Compounds During the Mildewing Process of Stored Wheat. Food Anal. Methods 2019, 12, 2895–2907. [Google Scholar] [CrossRef]
- Ricciardi, V.; Marciano, D.; Sargolzaei, M.; Maddalena, G.; Maghradze, D.; Tirelli, A.; Casati, P.; Bianco, P.A.; Failla, O.; Fracassetti, D.; et al. From plant resistance response to the discovery of antimicrobial compounds: The role of volatile organic compounds (VOCs) in grapevine downy mildew infection. Plant Physiol. Biochem. 2021, 160, 294–305. [Google Scholar] [CrossRef] [PubMed]


Publisher’s Note: MDPI stays neutral with regard to jurisdictional claims in published maps and institutional affiliations. |
© 2022 by the authors. Licensee MDPI, Basel, Switzerland. This article is an open access article distributed under the terms and conditions of the Creative Commons Attribution (CC BY) license (https://creativecommons.org/licenses/by/4.0/).