Abstract
The effort to increase agricultural productivity continues to receive interest in Africa as low productivity levels, poverty and food insecurity remain or even increase. This study used the Färe-Primont Index to estimate agricultural total factor productivity growth for 49 African countries. Panel data consisting of 833 observations for the period 2000 to 2016 were obtained from the United State Department of Agriculture Economic Research Service database. The results show that the average growth rate for agriculture in Africa is 0.73% per annum. The sector experienced increased growth after the Maputo Declaration, which was sustained during the global financial crisis. West Africa experienced the largest growth while Southern Africa suffered a substantial decline. The study also discovered that growth differed between countries indicating that customization of the Comprehensive Africa Agriculture Development Programme into regional and country-specific policy interventions is important to boost agricultural productivity. Finally, the growth was achieved through technical change, while efficiency change constrained growth. Policy-makers should increase investment in agricultural extension services, education and training to enhance managerial capacity (efficiency change) because improved managerial capacity could increase agricultural growth and thereby increase food security and alleviate poverty in Africa.
1. Introduction
Agriculture is an important sector for many world economies, providing food, employment, foreign earnings and income [1,2,3]. This implies that the sector carries huge potential to contribute towards key continental priorities in Africa, such as poverty alleviation, and hunger eradication, increased intra-Africa trade and investments growth, accelerated industrialization and economic diversification, sustainable resource and environmental management [4,5,6,7]. This is also supported by Nkamleu [8] who stressed that increased agricultural productivity growth, driven by technology and investments, has a powerful dynamic effect that benefits any given economy through increased agricultural income, employment, increased food availability and lower food prices. Collectively, these have led to increased optimism about the improvement of agricultural productivity in the African continent, particularly in the twenty-first century.
In 2003, the African Union (AU) and the New Partnership for Africa’s Development (NEPAD) established the Comprehensive Africa Agriculture Development Program (CAADP) in response to the recognition of potential benefits from increased agricultural productivity growth [9]. The program is intended to assist African countries in achieving higher levels of economic growth by focusing on agriculture-led development, which eliminates hunger, reduces poverty and food insecurity, and allows for increased exports [5]. The intended growth will be achieved by encouraging all African Union member states to devote 10% of their budgets to agriculture to attain a goal of 6% annual agricultural productivity growth [10]. The program (CAADP) currently consists of various results framework indicators organized into three levels: (i) the agriculture’s contribution to growth and development, (ii) agricultural transformation and inclusive growth, and (iii) systematic capacity to deliver results [11,12]; monitored on a biennial basis. Overall, this initiative (CAADP) and its facets on the continent show the seriousness with which African governments regard the improvement of agricultural productivity.
After the endorsement of CAADP with the Maputo Declaration on Agriculture and Food Security in Africa [13], other declarations have been made as supplement initiatives with a special emphasis on country compliance. These include amongst others the Sirte Declaration on the Challenges of Implementing Integrated and Sustainable Development on Agriculture and Water in Africa [14], which calls for the establishment of a common market now manifesting itself through the African Continental Free Trade Area (AfCFTA), and; the Abuja Declaration on Fertilizer for the African Green Revolution [15] that sets a target of increasing fertilizer use from an average of 8 kg per hectare to 50 kg per hectare by 2015. Additionally, the Abuja Declaration on Food Security designates specific crops (rice, maize, legumes, cotton, oil palm, beef, dairy, poultry, and fisheries products at the continental level and cassava, sorghum, and millet at the subregional level) as strategic commodities needing special attention to form the basis for continental free trade area [15]. These developments have renewed interest in studies on agricultural productivity growth in Africa.
The available literature has consistently defined Total Factor Productivity (TFP) as aggregated output over inputs [16]. Ever since the concept of TFP was first defined by Solow [17] a plethora of literature has been produced on TFP in various fields of study. Agriculture TFP studies have been conducted in Asia [18,19], Europe [20,21], Australia [22,23] and America [24,25] and has estimated the TFP growth and has investigated the determinants of TFP. Recently Kryszak et al. [16] have produced a comprehensive bibliometric review on agriculture productivity. However, the literature tends to be more advanced than African studies because of several factors such as the completeness of data and the use of advanced methodologies. The existing studies on productivity growth in Africa [8,26,27,28,29,30,31,32,33,34,35,36] have largely covered the twentieth century, particularly the period from 1960 to 1990s. These studies consistently maintained that agricultural productivity growth rates in Africa were positive during the 1960s, declined in the 1970s, and then recovered in the 1980s and 1990s. Studies covering the twenty-first century report that Africa’s agricultural productivity growth lags behind compared to other continents [37,38,39,40,41,42], and this implies an inability to alleviate poverty and eradicate hunger given the rapid population growth. Additionally, these studies continue to rely on methods such as the Malmquist Index that yield unreliable TFP estimates and lack a singular focus on the twenty-first century. Moreover, previous research have been restricted to the use of three or four variables (land, labour and capital or livestock) with other key input variables being ignored in the analysis. The implication is that more work is needed to understand agriculture TFP for Africa during the twenty-first century by using improved methodologies.
The aim of the paper is to investigate the agricultural TFP estimates in Africa for the first sixteen years in the twenty-first century using the Färe-Primont Index. The study contributes to the existing literature on agricultural productivity growth in Africa by using the FPI approach [43] to focus specifically on the first sixteen years of the twenty-first century. The study period was chosen because of the establishment of CAADP in 2003 and the recent methodological advances such as the development of FPI, Meta-frontier and a four-error component dynamic stochastic frontier method by Kumbhakar et al. [44]. The study has three novel contributions: firstly, unlike other index methods, FPI meets all of the index number theory’s axioms and has been deemed a complete and appropriate index. The use of FPI enables the researcher to estimate the mix-efficiency change, a TFP component that other methodologies cannot determine. The mix-efficiency change evaluates to what extent TFP could be changed by holding the inputs fixed and relaxing the constraints on the output mix. Secondly, the results could be used to evaluate the progress of African nations in meeting the targets of CAADP. Thirdly, unlike previous African studies, our analysis uses USDA ERS panel data for 49 African countries with six key input variables including fertilizer and feed.
The paper is organised into five sections. The introduction is followed by Section 2, which is the data and methods, specifically dealing with data information and themodel. The results and discussion are presented in Section 3 and Section 4, respectively. Section 5 is the conclusions followed by the list of references.
2. Data and Methods
2.1. Data
The study evaluates agricultural TFP growth or 49 countries on the African continent for the first 16 years of the twenty-first century. The 49 countries were divided according to 5 regions; West Africa (16 countries), Southern Africa (13 countries), Central Africa (8 countries), East Africa (7 countries), and North Africa (5 countries). The analysis considered panel data acquired from the USDA ERS and we chose this data source because of the better organisation of the data compared to the original source. Seven variables were selected (land, labour, machinery, fertilizer, feed, livestock and gross agricultural output) based on previous continental, regional and country or cross-country level studies that have assessed agricultural productivity growth. The variables are further classified into six inputs (land, labour, machinery, fertilizer, feed, and livestock) and one output variable (gross agricultural output).
Land is measured in 1000 hectares of rainfed-cropland equivalent (rain-fed cropland, irrigated cropland, cropland and pasture), weighted by relative quality. Labour refers to 1000 economically active persons in agriculture (15+ years, male and female). Machinery is measured by the total stock of farm machinery in “40-CV tractor equivalents” (CV = metric horsepower). The number of 2-wheel tractors, 4-wheel tractors, and combine-harvesters and threshers in use was aggregated. Feed refers to all types of animal feed, except forage and silage and is measured in 1000 Mcal of metabolizable energy. Fertilizer is described in Metric tons of all N, P2O5, and K2O nutrients for fertilizer consumption. And Livestock is the total livestock capital on farms in “cattle equivalents” based on the relative size and feeding requirements (measured in thousand head). Output refers to the gross agricultural output measured as the value of agricultural production for each of the countries included in the sample over the study period. The gross agricultural output is valued at constant global average prices from 2004–2006 and is measured in dollars. Previous research exploring some of these variables include Akamin & Molua [45], Coelli & Rao [46] and Nkamleu [8]. Table 1 presents the means, standard deviation (Std), minimum (Min) and maximum (Max) for the input and output variables on the African continent from 2000 to 2016.

Table 1.
Summary of output and input variables, 2000–2016.
The data in Table 1 shows that over the study period, the output for agriculture in Africa averaged 3,479,353 (Std = 5,860,654) and ranged from 4489 in 2009 to 41,446,447 in 2015. This was obtained from, on average, 19,877 ha of land (Std = 24,886), 3178 labourers (Std = 6155), 5267 head of cattle (Std = 12,647), 12,404 of 40-CV tractor equivalents (Std = 25,012), 87,660 metric tons of fertilizer applied (Std = 224,730) and 4,720,281 Mcal of feed (Std = 10,594,707). Overall, the findings show that output and inputs grew at an average of 6%. Ideally, the desired outcome would be to use fewer inputs to produce more output. Therefore, Africa exhibited poor input management, which undermined the output growth over the study period.
Details on the input use and output production for the regions and countries are shown in Table 2. The output and input use for the regions and countries show that regional and country differences exist. For example, North Africa (8,246,572) had the highest average output with a range from 1,134,000 (Libya) and 21,526,849 (Egypt). The average output of West Africa was 4,025,909 and ranged from 44,557 in Cape Verde to a high of 34,558,815 in Nigeria. The region with the third highest output is East Africa with an average of 3,497,287 (65,095 in Djibouti to 7,613,275 in Tanzania) while Southern Africa had an average of 2,180,172 (range from 69,229 in Comoros to 12,315,956 in South Africa). Finally, Central Africa was the least productive with an average output at 1,502,207 ranging from 43,582 in Equatorial Guinea to 4,587,207 in Cameroon). The input use decisions also show variation between the regions and countries. The regional differences in agricultural output and inputs imply that the regions are different in terms of natural resource endowments, technological advancement, institutional development, climate and political environment (institutions).Consequently, interventions to boost agricultural productivity growth should be region-specific and country-specific, as opposed to adopting a uniform strategy.
Table 2.
Summary of output and input variables for 49 African countries for the period from 2000–2016.
2.2. Model Specification
According to O’Donnell [43], the FPI which estimates agricultural TFP of country i in period t relative to country h in period s can be expressed as follows:
where is an output quantity index and is an input quantity index. This implies that TFP is the output index divided by the input index. Consequently, Equation (1) is re-defined as:
The first term on the right-hand side of Equation (2) measures the change in maximum TFP over time. Thus, it is a measure of technical change. The second term is a measure of overall efficiency change. The latter further decomposes into three fine measures, which implies that Equation (2) can be re-written as:
The study used the output-orientation because maximizing output is one of the most common objectives in agriculture. Hence OTE signifies a measure of the Farrell output-orientated technical efficiency, OSE is output-orientated scale efficiency and RME is a measure of residual mix efficiency. O’Donnell [43] also gives the following expression for the above Equation (3):
were OSME is the output-orientated scale-mixed-efficiency.
2.3. Estimation Procedure
The model specified in Equations (1)–(4) is estimated using the DPIN 3.0 software [43] and Data Envelopment Analysis (DEA) method. The DEA is defined as a non-parametric mathematical programming methodology initially proposed by Charnes et al. [47], based on Farrell’s work on firm performance. This method uses observed input and output quantities to create a production possibility space against which particular countries’ productivity growth is measured. According to O’Donnell [43], the fundamental premise underlying the use of DEA is that the output distance function representing the available technology in period t takes the form:
D0 represents the output distance function while x and q signify the input (land, labour, livestock, machinery, fertilizer and feed) and output (value of agricultural production) vectors for individual country i in period t. The output-oriented problem entails determining the unknown parameters in Equation (4) to reduce technical efficiency. This yields the following equation:
where Q is a J × Mt matrix of observed values of agricultural production, X is K × Mt matrix of observed inputs, t is an Mt × 1 unit vector, and Mt denotes the number of observations used to estimate the frontier in period t [43]. The DPIN 3.0 software computes productivity and efficiency indices using a variant of this linear programming problem. It begins by solving the following linear programming problem to obtain the Färe-Primont aggregates:
After which the FPI’s aggregated output and inputs are solved as follows:
3. Results
3.1. Regional Färe-Primont TFP Estimates for Africa
The FPI results for West Africa are shown in Figure 1. The TFP, technical inefficiency (dOTE) and scale-mix efficiency (dOSME) are shown using a colour scale for the countries in the region. The darker the colour on the colour scale the lower the estimated TFP, dOTE or dOSME. The results show that West Africa (1.14% p.a) was the most productive region with a positive dTech of 0.91% p.a and a dTFPE of 0.22% p.a (where dTFPE = dOTE × dOMSE). As can be seen in Figure 1, OTE (−0.36% p.a) continued to underpin agricultural productivity growth in this region over the study period. The results further show that 75% of sampled countries in this region recorded growth in agriculture productivity over the study period. They were led by Sierra Leone at 5.94% followed by Burkina Faso (4.74%), Mali (3.64%), Niger (2.92%), Ghana (2.46%), Mauritania (1.88%), Senegal (1.35%) and Guinea-Bissau (1.29%) where growth was largely driven by dTFPE. Only three countries (Nigeria, Côte d’Ivoire and Benin) experienced a decline in scale-mix efficiency (dOSME). More detail on the various components of TFP for the individual countries is given in Appendix A.
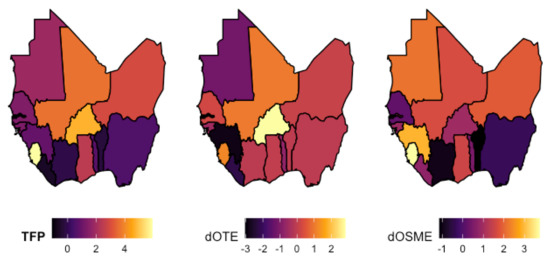
Figure 1.
Agricultural productivity growth in West Africa as shown by TFP and components of TFPE, 2000–2016. Note: dTFP = Productivity Change, dOTE = Technical Efficiency Change and dOSME = Scale-Mix Efficiency.
North Africa had the second highest average TFP increase at 0.97% p.a with a relatively high dTech and low dTFPE (dOTE = −0.52% and dOSME = 0.40%). The TFP, technical inefficiency (dOTE) and scale-mix efficiency (dOSME) results for North Africa are shown in Figure 2. Similar to the approached use for West Africa the darker colour shows lower levels of the estimated TFP, dOTE or dOSME.
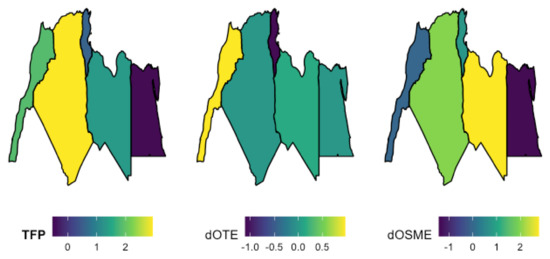
Figure 2.
Agricultural productivity growth in North Africa as shown by TFP and components of TFPE, 2000–2016. Note: dTFP = Productivity Change, dOTE = Technical Efficiency Change and dOSME = Scale-Mix Efficiency.
The results in Figure 2 show that Algeria was the single most productive country in this particular region, followed by Morocco (1.88%) and Libya (1.33%) while Egypt witnessed an average decline of 0.53% p.a. The differences in productivity growth estimates can be ascribed to a number of factors such as technological advancement, support given to agriculture, institutional capacity and agro-climatic conditions. Nonetheless, this implies that each country should follow a unique policy intervention. For instance, Egypt should be given top priority in terms of regional interventions for agriculture. The results in Figure 2 further reveal a sharp decline of dOSME in Morocco (−0.02%) and Egypt (−1.43%). While, dOTE showed a decline in Libya (−2.31%) and Tunisia (−1.11%). Another important finding is that OTE remained unchanged in Algeria and Egypt. Overall, the findings suggest that productivity growth in North Africa was undermined by dTFPE over the study period.
The agricultural productivity growth in Central Africa is shown in Figure 3. The average annual productivity growth for this region was 0.78% with a relatively high dTech and lower dTFPE. Interestingly the estimated dOTE showed a sharp decline at 0.49% while dOSME was positive with an average at 0.30%.
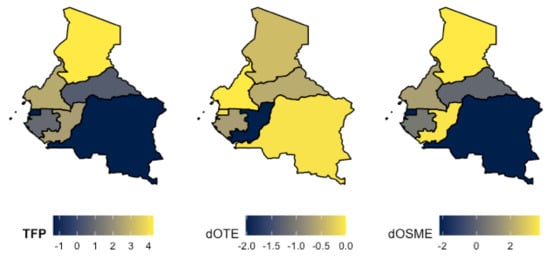
Figure 3.
Agricultural productivity growth in Central Africa as shown by TFP and components of TFPE, 2000–2016. Note: dTFP = Productivity Change, dOTE = Technical Efficiency Change and dOSME = Scale-Mix Efficiency.
The country-specific results shown in Figure 3 show that TFP growth was led by Chad (4.26%), Cameroon (2.72%) and the Republic of Congo (2.42%). The results show that TFP in the first two countries was driven by dTFPE while it was influenced by dTech in the Central African Republic. This implies that applying a single umbrella policy may not yield the same improvement in productivity for all the countries in this region.
Countries where TFP declined were Equatorial Guinea (−1.30%), and Sao Tome and Principe (−0.10%), and this was expected due to small land size. The decline in TFP was very high in the Democratic Republic of Congo (−1.35%), possibly because of political instability in the country. The results also showed a decline in efficiency components with OTE at 0.06% and OSME at 2.18% for the Democratic Republic of Congo. Only Cameroon had an unchanged dOTE for the study period. Cameroon also recorded positive growth in dOSME at 1.80% along with Chad (3.72%), the Republic of Congo (3.59%) and Gabon (0.64%). The overall findings show that dTFPE is an inhibitor of growth in the region.
The TFP estimates for East Africa are shown in Figure 4. This region showed an average annual TFP growth of 0.64% decomposed into dTech (0.91%) and dTFPE (−0.26%). A possible explanation for this finding is climate change because the regions have undergone some increases in temperatures, shifting rainfall patterns, and an increased frequency of extreme weather events. This implies that any effort to improve TFP should also include climate-smart agriculture policies for the region. The breakdown of dTFPE shows a dOTE of −0.66% and a dOSME of 0.42%.
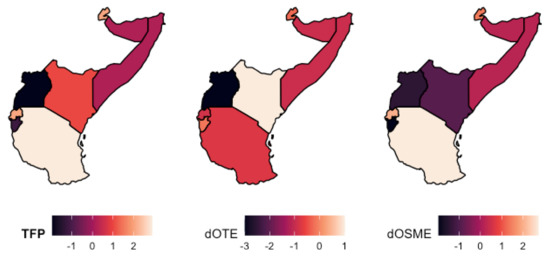
Figure 4.
Agricultural productivity growth in East Africa as shown by TFP and components of TFPE, 2000–2016. Note: dTFP = Productivity Change, dOTE = Technical Efficiency Change and dOSME = Scale-Mix Efficiency.
The factors of agricultural growth (TFP) vary greatly at the country level in this region. The most productive countries were Tanzania (2.90%), Djibouti (2.07%), Rwanda (2.06%) and Kenya (1.03%). The high level of productivity is ascribed to both dTech and dTFPE progression over the reviewed period. A notable decline in TFP growth was observed in Burundi (−1.20%) and Uganda (−1.95%) due to low levels of dTFPE. Kenya was the only country in the region with a positive OTE at 1.02%. On the other hand, Tanzania (2.72%), Rwanda (2.01%), and Djibouti (1.41%) showed an increase in OSME. The overall results show that 71% of sampled countries in this region were productive. Fifty-seven percent (57%) of the countries, showed progress in dTFPE while only 14% had progressed in OTE. Lastly, only two countries showed a reduction in OSME.
The results for Southern Africa showed an overall TFP growth rate on average of 0.15% per year. The dTFPE showed a decline (−1.05%) due to the decline in both dOTE (−1.01%) and dOSME (−0.04%). There were 13 countries included in the analysis and 8 (translated as 62%) experience growth in agriculture TFP over the study period. The results for the country-specific TFP indicators are shown in Figure 5.
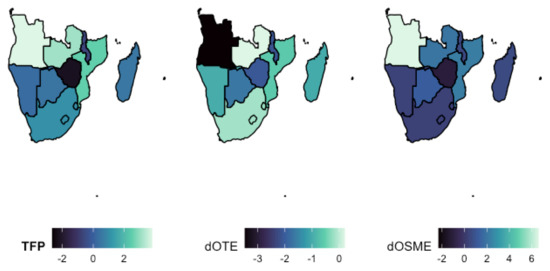
Figure 5.
Agricultural productivity growth in Southern Africa as shown by TFP and components of TFPE, 2000–2016. Note: dTFP = Productivity Change, dOTE = Technical Efficiency Change and dOSME = Scale-Mix Efficiency.
The countries that showed agricultural growth include Angola (3.83%), Zambia (3.15%), Mozambique (2.54%), South Africa (1.08%), Eswatini (1.03%), Madagascar (0.52%), Botswana (0.46%) and Namibia (0.30%). While the other countries (Malawi, Mauritius, Comoros, Zimbabwe and Lesotho) showed negative growth in agricultural TFP. Nonetheless, all the countries had similar dTech at 0.91% suggesting the possibility of similar production technology. This result can be attributed to the fact that like the other four regions, it is largely dominated by smallholder farmers who generally face similar production constraints such as access to credit, information, markets and using mainly outdated production technologies. Only five of the countries (Angola, Zambia, Mozambique, South Africa and Eswatini) showed better resource management (dTFPE) in the production of output. A significant decline in dTFPE were observed in Malawi (−1.57%), Mauritius (−2.13%), Comoros (−2.93%), Zimbabwe (−3.17%) and Lesotho (3.54%). Further analysis of dTFPE reveals that Angola was the only country in this region to report progress in OTE despite being negligible. Sixty-nine percent (69%) of these countries also revealed significant progress in OSME.
The findings indicate that Africa’s agricultural productivity growth remains slow. Over the study period, Africa had an average TFP growth of 0.73% per annum (p.a.), driven by technical change (dTech) at an average of 0.91%. The downside of the findings is that dTech was insufficient to offset the decrease in efficiency change (−0.18% p.a). Despite this, the results showed a significant increase in technology adoption over the study period. This suggests an inability to make agriculture the primary driver of inclusive growth and economic development in order to ensure wealth creation, food and nutrition security, poverty alleviation and prosperity. They suggest that technological adoption must be matched by significant improvement of managerial capabilities of farmers in order to boost agricultural productivity growth at the regional level. The results for the efficiency change (dTFPE) indicate that improving technical inefficiency (dOTE) (−0.60%) is likely to increase the current annual average productivity growth on the continent. This intervention can be accomplished by enhancing the agricultural extension programmes, agrarian reform and financial incentives. However, it might not be enough to develop a single intervention strategy because the regional results suggest that region-specific interventions are required based on the individual needs of the regions and countries.
3.2. Impact of Shocks and Policies on Agricultural Productivity Growth in Africa, 2000–2016
The agricultural productivity growth is affected by changes in policies and shocks such as drought, floods, wars and economic downturns. In Figure 6, we evaluate such an impact to gain a better understanding of agricultural TFP growth in Africa over the study period. A yearly agricultural TFP and technology change (dTech) and efficiency change (dTFPE) were calculated to evaluate how these factors changed over time.
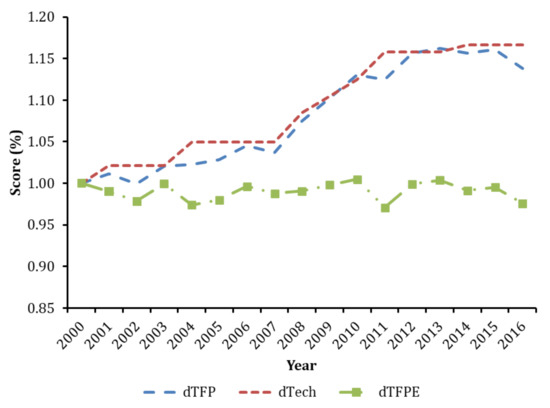
Figure 6.
Yearly agricultural productivity change (dTFP) and technical change (dTech) and efficiency change (dTFPE) from 2000 to 2016.
The results in Figure 6 show that TFP growth was relatively low during the first three years of the twenty-first century with a range from 1.01% to 1.02%. In subsequent years the dTFP starts to increase to a maximum of 1.15%. This increase in TFP corresponds with the Maputo Declaration on Agriculture by the African Union member states as well as the global financial crisis. Even though a reduction in growth was expected as a result of the financial crisis, it seems as if Africa at large continued to show agricultural growth. Further analysis of the TFP did, however, show that for the period 2000 to 2008, Africa had an average TFP of 10% ranging from 0.77% in East Africa and 1.32% in North Africa. From 2008 to the end of the study period the recorded agricultural growth decreased by 1.6% to an average growth rate of 8.7%. This reduction in TFP was likely because of the decline in both dTech (−10.2%) and dTFPE (−18.6%). Further analysis of dTFPE estimated from 2008 to 2016 reveals an increase in OTE (5.0%) and a decrease in OSME (−0.31%). Towards the end of the study period (around 2014), the TFP seems to move sideways and even shows a decrease. A result that is in line with the occurrence of Ebola in West Africa and the establishment of the Malabo Declaration (by the African Union) on Accelerated Agricultural Growth.
4. Discussion
The paper reports an average agricultural TFP of 0.73% over the study period. This finding is consistent with the results reported by Anik et al. [39] and Le Clech & Fillat-Casrejon [40] who estimated a TFP at 0.66% and 0.94%. Although these papers also use the FPI approach to investigate TFP the papers considered different time periods and countries. Compared to the research conducted by Adeleke et al. [37] and Nkamleu et al. [48], who used the Malmquist index, our TFP results are significantly lower. However, we are of the opinion that the estimates reported in this paper are more accurate because the Malmquist index yields biased estimates [49,50].
The regional results highlighted several main results. Firstly, the TFP estimated for the five regions of Africa varies. The estimated TFP was highest for West Africa which is in line with the results of previous research. Nkamleu [8] argued that West Africa has healthy soils and diverse ecosystems, which result in a high number of food production systems and thereby high agricultural productivity growth. The results also showed that country and regional growth differs. All the AU member states have adopted the Maputo declaration and the resulting CAADP, however, the current program must be customized into regional and country-specific policy interventions to boost agricultural productivity [11]. Nkamleu [8] argued that agro-climatic conditions, the political environment, advances in technology adoption and institution contribute to variations in TFP estimates. Thirdly, the result showed that technical change increased growth while efficiency change constrained growth. This matches Ajao [51] who found technical change to be the main driver of agricultural productivity for 43 African nations from 1961 to 2003. However, Coelli & Rao [46] found that technical change and efficiency change increased agricultural TFP for 26 African Nations. Out of the 49 African countries included in our sample, 26 (48%) experienced growth in agricultural productivity. These are classified into countries with an annual average growth of between 1.00% and 1.88% (Morocco, Mauritania, Senegal, Libya, Guinea-Bissau, South Africa, Eswatini and Kenya), 2.06% and 2.93% (Algeria, Niger, Tanzania, Cameroon, Mozambique, Ghana, Congo, Djibouti and Rwanda) and over 3.00% (Sierra Leone, Burkina Faso, Chad, Angola, Mali and Zambia). The agricultural productivity growth of these countries was driven by efficiency change indicating increased farm managerial capacity. However, the level of commercialisation as indicated by technical change (0.91%) still needs to be strengthened in these countries. An increase in technical change can be obtained by focusing on increased extension service support and investment in R&D as the main policy interventions [52].
Several African countries showed negative growth due to a decline in efficiency change. These countries include Lesotho (−2.66%), Zimbabwe (−2.28%), Comoros (−2.04%), Uganda (−1.95%), Congo DR (−1.35%), Equatorial Guinea (−1.30%), Mauritius (−1.24%), Burundi (−1.20%) and Gambia (−1.10%). These countries had a joint input growth averaging 1.70% while agricultural output was declining at 0.22% per year. The results at country levels are mixed compared to existing literature and this can be attributed to the use of different methodologies and datasets covering different periods. For instance, Yun et al. [53] excluded Seychelles, Comoro, Congo DR, and Equatorial Guinea in their analysis of agricultural productivity in Africa but found that three of our sampled countries (Burundi, Uganda and Gambia) recorded negative growth over the period 1961 to 1999. The same study reported positive growth in Lesotho, Zimbabwe and Uganda. While, Fuglie & Rada [54] reported negative growth in Congo DR, Burundi, Uganda, Lesotho, and Gambia, but positive growth for Mauritius and Zimbabwe for the period from 1961 to 2008. Recent studies by Anik et al. [39], Le Clech & Fillat-Castejon [40] and Ogundari & Onyeaghala [41] also report mixed findings on agricultural productivity growth at the country level in the African continent. The mixed findings can be attributed to a number of factors ranging from poor government support to agriculture, variations in agro-climatic conditions, low literacy rates, lack of institutional capacity and poor technology adoption rates. Overall, the findings are consistent with Nsiah & Fayissa [55] who found that Lesotho, Gambia, Sao Toma and Principe and Zimbabwe are the African countries with the lowest agricultural productivity growth. The negative growth for the above-mentioned countries is because input growth is greater than output growth. This can be redressed by focusing on reforms that impact input and output prices, or through economic incentives such as taxes.
The results of cumulative annual agricultural productivity growth exhibit an upward trend in productivity over the study period. This finding corroborates previous research by Block [56] and Mason et al. [57] in that Africa’s TFP growth rates for agriculture have improved in the twenty-first century due to the increasing levels of technical progress. The exact estimates of agricultural productivity growth or decline vary in the literature [26,32,53,58,59], but the studies commonly agree that the pace of productivity growth has picked up in the last decade or two. During the food and financial crises that devastated the global economy in 2008–2009, Africa managed to maintain relatively positive growth. This can be ascribed to increased state-led fertilizer procurement and distribution to boost productivity arising from the Abuja Declaration on Fertilizer application rates in the continent [15,60]. The Outbreak of Ebola negatively impacted the agricultural productivity of four countries in West Africa due to labour disruptions [61], but this did not affect the overall growth of the continent. Great strides were also made by many African countries over the study period to increase the adoption of improved inputs through the Alliance for Green Revolution in Africa [4,62]. Hence the climate crisis seems not to have affected agricultural productivity growth over the study period.
The increase in technical progress, which led to a 10.3% increase in TFP growth from 2000 to 2008, can be ascribed to the implementation of CAADP. The program encouraged African countries to allocate 10% of their budget to agriculture to achieve a goal of 6% annual TFP growth. Benin et al. [63] and Benin [64] maintains that the implementation of CAADP has a positive and significant impact on government expenditure on agriculture, and land and labour productivity in Africa. Despite the decrease in both technical change (−10.2%) and efficiency change (−18.6%), the TFP growth rate showed an increase of 8.7% due to improved technical (5.0%), scale (12.1%) and mix (20.4%) efficiency. This continued increase in agricultural productivity growth in the presence of shocks and policy reforms implies resilience in the African agricultural sector [65].
The results reported in the paper corroborate two major concerns that have been raised by literature [66]. First, the current level of agricultural productivity growth in Africa has not yet matched those recorded in the early 1960s. And secondly, the measured agricultural productivity is still too low to combat hunger, poverty and food insecurity that arises from the fast-rising population [66]. For instance, while productivity has remained positive over the study period, food imports have also increased over the same period [4,62]. The implication is that more effort is still needed to boost agricultural productivity growth in Africa to take full advantage of CAADP and AfCFTA, while striving to achieve the SDGs in terms of ending hunger, poverty alleviation and improving food security.
5. Conclusions
The aim of the paper was to investigate total agricultural productivity growth for various African regions and countries for 16 years (2000–2016) using the Färe-Primont Index approach. This approach was applied to panel data consisting of 833 observations for five sub-regions or 49 countries. Based on the findings the following conclusions are drawn: first, over the study period the agriculture sector in Africa showed an improvement in TFP growth due to technological progress. Secondly, technical efficiency was the major inhibiting factor to TFP growth while scale-mix efficiencies contributed positively. Thirdly, Southern Africa was the only region exhibiting a decrease in TFP growth. About 48% of the sampled countries were productive and their annual average growth rates ranged from 1.01% to 5.94%. Following the Maputo Declaration agricultural growth rose by 10.3% and a further increase of 8.7% was found between 2008 to 2016. Surprisingly, the continent maintained positive growth during the 2008–2009 food and financial crises that devastated the global economy. A possible explanation could be the increased state-led fertilizer procurement and distribution activities to boost productivity in African countries that was a direct result of the Abuja Declaration on Fertilizer Application Rates on the African Continent. Due to labour disruptions which were caused by the Ebola outbreak, agricultural growth for four countries in West Africa was negatively impacted. However, these disruptions had no effect on the continent’s overall growth.
In general, our findings imply that more effort into the commercialisation of agriculture at all levels in Africa will help to improve productivity growth rates. The implication is that increased investment in R&D for innovation purposes is non-negotiable. Furthermore, relying solely on AU member states’ 10% allocation to CAADP may not be sufficient to achieve the desired growth to combat the increasing food import, poverty, hunger and food insecurity. Increased investment in education and training for both farmers and extension officers are needed to ensure higher adoption rates of R&D-derived technologies. In this way, the African continent can improve productivity growth rates.
Overall, the findings indicate that policy-makers should focus on investment in R&D, training and education, agrarian reform and climate-smart agricultural practices. We, therefore, recommend that future research extend the period of coverage and adopt the “green total factor productivity” approach to simultaneously improve agricultural productivity growth and environmental quality.
Author Contributions
All authors made a significant contribution to the present manuscript preparation. L.W.M. was involved in conceptualisation, data collection, data analysis and contributed to drafting the article. Y.T.B. and N.M. were supervisors and collaborators of this project, aided with constructive comments towards the publication of the study and editing of the final draft. All authors have read and agreed to the published version of the manuscript.
Funding
This research received no external funding.
Institutional Review Board Statement
Not applicable.
Informed Consent Statement
Not applicable.
Data Availability Statement
Data are available upon request from the lead author LW Myeki.
Conflicts of Interest
The authors declare no conflict of interest.
Appendix A
Table A1.
Summary of country TFP, 2000–2016.
Table A1.
Summary of country TFP, 2000–2016.
| Country | dTFP | dTech | dTFPE | dOTE | dOSE | dOME | dOSME |
|---|---|---|---|---|---|---|---|
| Algeria | 2.93% | 0.91% | 2.00% | 0.00% | 2.71% | 0.00% | 2.00% |
| Angola | 3.83% | 0.91% | 2.89% | −3.48% | 1.22% | 0.00% | 6.60% |
| Benin | −0.29% | 0.91% | −1.19% | −0.05% | −0.03% | 0.00% | −1.15% |
| Botswana | 0.46% | 0.91% | −0.45% | −1.67% | −1.56% | 0.00% | 1.24% |
| Burkina Faso | 4.74% | 0.91% | 3.79% | 2.83% | 1.48% | 0.00% | 0.94% |
| Burundi | −1.20% | 0.91% | −2.09% | −0.14% | −0.01% | 0.00% | −1.96% |
| Cameroon | 2.72% | 0.91% | 1.80% | 0.00% | 1.09% | 0.00% | 1.80% |
| Cape Verde | 0.21% | 0.91% | −0.69% | −1.17% | −0.90% | 0.00% | 0.48% |
| Central African Republic | 0.51% | 0.91% | −0.39% | −0.53% | −0.14% | 0.00% | 0.13% |
| Chad | 4.26% | 0.91% | 3.32% | −0.39% | 1.97% | 0.00% | 3.72% |
| Comoros | −2.04% | 0.91% | −2.93% | −0.62% | −0.11% | 0.00% | −2.32% |
| Congo, DR | −1.35% | 0.91% | −2.24% | −0.06% | −0.29% | 0.00% | −2.18% |
| Congo, Republic | 2.42% | 0.91% | 1.50% | −2.02% | −0.07% | 0.00% | 3.59% |
| Côte d’Ivoire | −0.14% | 0.91% | −1.04% | −0.07% | −0.25% | 0.00% | −0.97% |
| Djibouti | 2.07% | 0.91% | 1.14% | −0.26% | −0.38% | 0.00% | 1.41% |
| Egypt | −0.53% | 0.91% | −1.43% | 0.00% | 0.00% | 0.00% | −1.43% |
| Equatorial Guinea | −1.30% | 0.91% | −2.19% | −0.07% | −0.04% | −0.03% | −2.12% |
| Gabon | 0.89% | 0.91% | −0.02% | −0.66% | −0.06% | 0.00% | 0.64% |
| Gambia | −1.10% | 0.91% | −1.99% | −3.04% | 0.00% | 0.00% | 1.08% |
| Ghana | 2.46% | 0.91% | 1.53% | 0.00% | 0.00% | 0.00% | 1.53% |
| Guinea | 0.88% | 0.91% | −0.03% | −2.86% | 0.22% | 0.00% | 2.91% |
| Guinea-Bissau | 1.29% | 0.91% | 0.38% | −0.52% | 0.05% | 0.00% | 0.90% |
| Kenya | 1.03% | 0.91% | 0.11% | 1.02% | −0.45% | 0.00% | −0.89% |
| Lesotho | −2.66% | 0.91% | −3.54% | −1.72% | −0.35% | 0.00% | −1.85% |
| Liberia | −0.62% | 0.91% | −1.51% | −2.23% | −0.09% | 0.00% | 0.74% |
| Libya | 1.33% | 0.91% | 0.41% | −2.31% | 0.16% | 0.00% | 2.78% |
| Madagascar | 0.52% | 0.91% | −0.38% | −1.01% | −1.61% | 0.00% | 0.63% |
| Malawi | −0.68% | 0.91% | −1.57% | −2.13% | −0.57% | 0.00% | 0.57% |
| Mali | 3.64% | 0.91% | 2.71% | 1.02% | −0.04% | 0.00% | 1.67% |
| Mauritania | 1.88% | 0.91% | 0.96% | −1.18% | −0.04% | 0.00% | 2.16% |
| Mauritius | −1.24% | 0.91% | −2.13% | −0.16% | 0.00% | 0.00% | −1.98% |
| Morocco | 1.88% | 0.91% | 0.96% | 0.98% | 0.33% | 0.00% | -0.02% |
| Mozambique | 2.54% | 0.91% | 1.61% | −0.60% | 0.65% | 0.00% | 2.23% |
| Namibia | 0.30% | 0.91% | −0.60% | −0.98% | −0.36% | 0.00% | 0.38% |
| Niger | 2.92% | 0.91% | 1.99% | 0.11% | 1.24% | 0.00% | 1.88% |
| Nigeria | 0.53% | 0.91% | −0.38% | −0.06% | −0.56% | 0.00% | -0.32% |
| Rwanda | 2.06% | 0.91% | 1.14% | −0.85% | −0.04% | 0.00% | 2.01% |
| Sao Tome and Principe | −0.10% | 0.91% | −1.00% | −0.39% | −0.07% | 0.00% | −0.61% |
| Senegal | 1.35% | 0.91% | 0.44% | 0.25% | 0.34% | 0.00% | 0.19% |
| Sierra Leone | 5.94% | 0.91% | 4.99% | 1.21% | 0.01% | 0.00% | 3.74% |
| Somalia | 0.18% | 0.91% | −0.72% | −0.94% | −0.23% | 0.00% | 0.22% |
| South Africa | 1.08% | 0.91% | 0.16% | −0.16% | −0.19% | 0.00% | 0.33% |
| Swaziland | 1.03% | 0.91% | 0.12% | −0.22% | 0.96% | 0.00% | 0.34% |
| Tanzania | 2.90% | 0.91% | 1.97% | −0.73% | −2.23% | 0.00% | 2.72% |
| Togo | 0.67% | 0.91% | −0.24% | −0.72% | −0.15% | 0.00% | 0.49% |
| Tunisia | 0.58% | 0.91% | −0.32% | −1.11% | 0.87% | 0.00% | 0.79% |
| Uganda | −1.95% | 0.91% | −2.84% | −3.00% | −1.42% | 0.00% | 0.17% |
| Zambia | 3.15% | 0.91% | 2.22% | 0.21% | 1.13% | 0.00% | 2.00% |
| Zimbabwe | −2.28% | 0.91% | −3.17% | −2.08% | −0.70% | 0.00% | −1.11% |
Note: Grey to blue colour represents an increase in productivity, pink to red denote a decline in productivity. The darker the colour the larger the increase or decline.
References
- FAO. OECD-FAO Agricultural Outlook 2020–2029; Food & Agriculture Organization: Rome, Italy, 2020. [Google Scholar]
- Robinson, G.M. Globalization of agriculture. Annu. Rev. Resour. Econ. 2018, 10, 133–160. [Google Scholar] [CrossRef]
- Temoso, O.; Villano, R.; Hadley, D. Agricultural productivity, efficiency and growth in a semi-arid country: A case study of Botswana. Afr. J. Agric. Resour. Econ. 2015, 10, 192–206. [Google Scholar]
- AGRA. Africa Agriculture Status Report. Feeding Africa’s Cities: Opportunities, Challenges, and Policies for Linking African Farmers with Growing Urban Food Markets; (Issue 8); Alliance for a Green Revolution in Africa (AGRA): Nairobi, Kenya, 2020. [Google Scholar]
- NEPAD. Agriculture in Africa: Transformation and Outlook. Randjespark, Midrand, South Africa; NEPAD: Johannesburg, South Africa, 2013. [Google Scholar]
- African Union Commission. Framework for Boosting Intra-Africa Trade in Agricultural Commodities and Services; Africa Union Publication: Addis Ababa, Ethiopia, 2020. [Google Scholar]
- Woldemichael, A.; Salami, A.; Mukasa, A.; Simpasa, A.; Shimeles, A. Transforming Africa’s agriculture through agro-industrialization. Afr. Econ. Brief 2017, 8, 1–12. [Google Scholar]
- Nkamleu, G.B. Productivity growth, technical progress and efficiency change in African agriculture. Afr. Dev. Rev. 2004, 16, 203–222. [Google Scholar] [CrossRef]
- Brüntrup, M. The Comprehensive Africa Agriculture Development Programme (CAADP)—An Assessment of a Pan-African Attempt to Revitalise Agriculture. Q. J. Int. Agric. 2011, 50, 79–106. [Google Scholar]
- Kimenyi, M.S.; Routman, B.; Westbury, A.; Omiti, J.; Akande, T. CAADP at 10: Progress towards Agricultural Prosperity; The Brookings Institution: Washington, DC, USA, 2013. [Google Scholar]
- Makombe, T.; Tefera, W.; Benin, S. Tracking key CAADP indicators and implementation processes. In Boosting Growth to End Hunger by 2025: The Role of Social Protection; Regional Strategic Analysis and Knowledge Support System (RESAKSS) Annual Trends and Outlook Report 2017–2018; Wouterse, F.S., Taffesse, A.S., Eds.; International Food Policy Research Institute: Washington, DC, USA, 2018; pp. 161–177. [Google Scholar]
- Phiri, E.; Bwalya, M.; Froebrich, J.; Mweetwa, A.; Chishala, B.; Meebelo, N.; Shepande, C.; De Witt, M.; De Clercq, W. Transdisciplinary development and adoption of irrigation innovations in Africa. Linkages to principles of CAADP: A commentary. Irrig. Drain. 2020, 69, 148–154. [Google Scholar] [CrossRef]
- African Union. Declaration on Agriculture and Food Security in Africa; Maputo Declaration: Maputo, Mozambique, 2003; Volume 11. [Google Scholar]
- African Union. Sirte Declaration on the Challenges of Implementing Integrated and Sustainable Development on Agriculture and Water in Africa; Assembly of the African Union: Sirte, Libya, 2004; Volume 27. [Google Scholar]
- African Union. Abuja Declaration on Fertilizer for the African Green Revolution. In Proceedings of the Africa Fertilizer Summit, African Union Special Summit of the Heads of State and Government, Abuja, Nigeria, 13 June 2006; pp. 1–3. [Google Scholar]
- Kryszak, Ł.; Świerczyńska, K.; Staniszewski, J. Measuring total factor productivity in agriculture: A bibliometric review. Int. J. Emerg. Mark. 2021. ahead-of-print. [Google Scholar] [CrossRef]
- Solow, R.M. Technical change and the aggregate production function. Rev. Econ. Stat. 1957, 1957, 312–320. [Google Scholar] [CrossRef]
- Liu, J.; Wang, M.; Yang, L.; Rahman, S.; Sriboonchitta, S. Agricultural productivity growth and its determinants in south and southeast asian countries. Sustainability 2020, 12, 4981. [Google Scholar] [CrossRef]
- Liu, J.; Dong, C.; Liu, S.; Rahman, S.; Sriboonchitta, S. Sources of total-factor productivity and efficiency changes in China’s agriculture. Agriculture 2020, 10, 279. [Google Scholar] [CrossRef]
- Bureau, J.C.; Antón, J. Agricultural Total Factor Productivity and the Environment: A Guide to Emerging Best Practices in Measurement; OECD Food, Agriculture and Fisheries Paper No. 177; OECD Publishing: Paris, France, 2022. [Google Scholar]
- Baležentis, T.; Blancard, S.; Shen, Z.; Štreimikienė, D. Analysis of environmental total factor productivity evolution in European agricultural sector. Decis. Sci. 2021, 52, 483–511. [Google Scholar] [CrossRef]
- Sheng, Y.; Jackson, T.; Zhao, S.; Zhang, D. Measuring output, input and total factor productivity in Australian agriculture: An industry-level analysis. Rev. Income Wealth 2017, 63, S169–S193. [Google Scholar] [CrossRef]
- Chancellor, W.; Hughes, N.; Zhao, S.; Soh, W.Y.; Valle, H.; Boult, C. Controlling for the effects of climate on total factor productivity: A case study of Australian farms. Food Policy 2021, 102, 102091. [Google Scholar] [CrossRef]
- Plastina, A.; Lence, S.H. A parametric estimation of total factor productivity and its components in US agriculture. Am. J. Agric. Econ. 2018, 100, 1091–1119. [Google Scholar] [CrossRef]
- Gasques, J.G.; Bastos, E.T.; Valdes, C.; Bacchi, M.R.P. Total factor productivity in Brazilian agriculture. Product. Growth Agric. Int. Perspect. 2012, 2012, 145–162. [Google Scholar]
- Alene, A.D. Productivity growth and the effects of R&D in African agriculture. Agric. Econ. 2010, 41, 223–238. [Google Scholar]
- Bates, R.H.; Block, S.A. Revisiting African agriculture: Institutional change and productivity growth. J. Politics 2013, 75, 372–384. [Google Scholar] [CrossRef]
- Benin, S.; Yu, B. Complying with the Maputo Declaration Target: Trends in public agricultural expenditures and implications for pursuit of optimal allocation of public agricultural spending. In ReSAKSS Annual Trends and Outlook Report; International Food Policy Research Institute: Washington, DC, USA, 2012. [Google Scholar]
- Frisvold, G.; Ingram, K. Sources of agricultural productivity growth and stagnation in sub-Saharan Africa. Agric. Econ. 1995, 13, 51–61. [Google Scholar]
- Fuglie, K.; Gautam, M.; Goyal, A.; Maloney, W.F. Harvesting Prosperity: Technology and Productivity Growth in Agriculture; World Bank Publications: Washington, DC, USA, 2019. [Google Scholar]
- Fuglie, K.O. Is a slowdown in agricultural productivity growth contributing to the rise in commodity prices? Agric. Econ. 2008, 39, 431–441. [Google Scholar] [CrossRef]
- Fulginiti, L.E.; Perrin, R.K.; Yu, B. Institutions and agricultural productivity in Sub-Saharan Africa. Agric. Econ. 2004, 31, 169–180. [Google Scholar] [CrossRef]
- Lusigi, A.; Piesse, J.; Thirtle, C. Convergence of per capita incomes and agricultural productivity in Africa. J. Int. Dev. J. Dev. Stud. Assoc. 1998, 10, 105–115. [Google Scholar] [CrossRef]
- Temoso, O.; Villano, R.; Hadley, D. Evaluating the productivity gap between commercial and traditional beef production systems in Botswana. Agric. Syst. 2016, 149, 30–39. [Google Scholar] [CrossRef]
- Thirtle, C.; Von Bach, H.S.; van Zyl, J. Total factor productivity in South African agriculture, 1947–91. Dev. S. Afr. 1993, 10, 301–318. [Google Scholar] [CrossRef]
- Thirtle, C.; Lin, L.; Piesse, J. The impact of research-led agricultural productivity growth on poverty reduction in Africa, Asia and Latin America. World Dev. 2003, 31, 1959–1975. [Google Scholar] [CrossRef]
- Adeleke, O.; Adeleke, H.; Fajobi, D. Productivity Growth, Technical Progress, and Efficiency Change in ECOWAS Agriculture 1971–2009: A Full Cumulative (FC) Extended Malmquist Approach. Int. J. Innov. Res. Adv. Stud. 2017, 4, 416–423. [Google Scholar]
- Adetutu, M.O.; Ajayi, V. The impact of domestic and foreign R&D on agricultural productivity in sub-Saharan Africa. World Dev. 2020, 125, 104690. [Google Scholar]
- Reza Anik, A.; Rahman, S.; Sarker, J.R. Five decades of productivity and efficiency changes in world agriculture (1969–2013). Agriculture 2020, 10, 200. [Google Scholar] [CrossRef]
- Le Clech, N.A.; Fillat-Castejon, C. New estimates of total factor productivity, technical and efficiency changes for the global agricultural economy. Span. J. Agric. Res. 2020, 18, e0104. [Google Scholar] [CrossRef]
- Ogundari, K.; Onyeaghala, R. The effects of climate change on African agricultural productivity growth revisited. Environ. Sci. Pollut. Res. 2021, 28, 30035–30045. [Google Scholar] [CrossRef]
- Sunge, R.; Ngepah, N. The impact of agricultural trade liberalization on agricultural total factor productivity growth in Africa. Int. Econ. J. 2020, 34, 571–598. [Google Scholar] [CrossRef]
- O’Donnell, C.J. DPIN 3.0: A program for decomposing productivity index numbers. In Centre for Efficiency and Productivity Analysis; Univ. Queensland: Brisbane, Australia, 2011. [Google Scholar]
- Kumbhakar, S.C.; Lien, G.; Hardaker, J.B. Technical efficiency in competing panel data models: A study of Norwegian grain farming. J. Product. Anal. 2014, 41, 321–337. [Google Scholar] [CrossRef]
- Akamin, A.; Molua, E.L. Agricultural productivity growth, technical progress and efficiency decline in Central Africa. In Proceedings of the 6th African Conference of Agricultural Economists, Abuja, Nigeria, 23–26 September 2019. [Google Scholar]
- Coelli, T.J.; Rao, D.P. Total factor productivity growth in agriculture: A Malmquist index analysis of 93 countries, 1980–2000. Agric. Econ. 2005, 32, 115–134. [Google Scholar] [CrossRef]
- Charnes, A.; Cooper, W.W.; Rhodes, E. Measuring the efficiency of decision making units. Eur. J. Oper. Res. 1978, 2, 429–444. [Google Scholar] [CrossRef]
- Nkamleu, G.B.; Sylla, K.; Zonon, A. What accounts for growth in African agriculture. Am. J. Agric. Biol. Sci. 2008, 3, 379–388. [Google Scholar] [CrossRef][Green Version]
- O’Donnell, C.J. Nonparametric estimates of the components of productivity and profitability change in US agriculture. Am. J. Agric. Econ. 2012, 94, 873–890. [Google Scholar] [CrossRef]
- O’Donnell, C. Estimating total factor productivity change when no price or value-share data are available. In Centre for Efficiency and Productivity Analysis Working Papers; University of Queensland: Brisbane, Australia, 2017. [Google Scholar]
- Ajao, O.A. Determinants of agricultural productivity growth in sub-Sahara Africa: 1961–2003. Trop. Subtrop. Agroecosyst. 2012, 15, 575–582. [Google Scholar]
- Owusu, R.; Kwadzo, M.; Ghartey, W. Regional Productivity Differential and Technology Gap In African Agriculture: A Stochastic Metafrontier Approach. Int. J. Food Agric. Econ. (IJFAEC) 2022, 10, 95–109. [Google Scholar]
- Yu, B.; Nin-Pratt, A. Agricultural Productivity and Policies in Sub-Saharan Africa; International Food Policy Research Inst. Discussion paper No. 01150; International Food Policy Research Inst.: Washington, DC, USA, 2011. [Google Scholar]
- Fuglie, K.; Rada, N. Resources, policies, and agricultural productivity in sub-Saharan Africa. In Economic Research Report 145; USDA Economic Research Services: Washington, DC, USA, 2013. [Google Scholar]
- Nsiah, C.; Fayissa, B. Trends in agricultural production efficiency and their implications for food security in sub-Saharan African countries. Afr. Dev. Rev. 2019, 31, 28–42. [Google Scholar] [CrossRef]
- Block, S.A. The post-independence decline and rise of crop productivity in sub-Saharan Africa: Measurement and explanations. Oxf. Econ. Pap. 2014, 66, 373–396. [Google Scholar] [CrossRef]
- Mason, N.M.; Jayne, T.S.; Van De Walle, N. The political economy of fertilizer subsidy programs in Africa: Evidence from Zambia. Am. J. Agric. Econ. 2017, 99, 705–731. [Google Scholar] [CrossRef]
- Benin, S.; Pratt, A.N.; Wood, S.; Guo, Z.; Pratt, R.N. Trends and spatial patterns in agricultural productivity in Africa, 1961–2010. ReSAKSS Annu. Trends Outlook Rep. 2011, 2011, 9780896298019. [Google Scholar]
- Ludena, C.E.; Hertel, T.W.; Preckel, P.V.; Foster, K.; Nin, A. Productivity growth and convergence in crop, ruminant, and nonruminant production: Measurement and forecasts. Agric. Econ. 2007, 37, 1–17. [Google Scholar] [CrossRef]
- Badiane, O.; Makombe, T. The Theory and Practice of Agriculture, Growth, and Development in Africa; UNU-WIDER Working Paper 61/2014; United Nations University World Institute for Development Economics Research: Helsinki, Finland, 2014. [Google Scholar]
- Fan, S.; Si, W.; Zhang, Y. How to prevent a global food and nutrition security crisis under COVID-19? China Agric. Econ. Rev. 2020, 12, 471–480. [Google Scholar] [CrossRef]
- Jayne, T.; Yeboah, F.K.; Henry, C. The Future of Work in African Agriculture Trends and Drivers of Change; International Labour Organization: Geneva, Switzerland, 2017. [Google Scholar]
- Benin, S.; Ulimwengu, J.M.; Tefera, W. The CAADP Inaugural Biennial Review and Africa Agricultural Transformation Scorecard: Results and Areas for Improvement; Discussion Paper 01754; International Food Policy Research Institute: Washington, DC, USA, 2018. [Google Scholar]
- Benin, S. From Maputo to Malabo: How has CAADP Fared? Technical report, ReSAKSS Discussion Paper (Forthcoming); IFPRI: Washington, DC, USA, 2018. [Google Scholar]
- Badiane, O.; Diao, X.; Jayne, T. Africa’s unfolding agricultural transformation. Agric. Dev. New Perspect. Chang. World 2021, 2021, 153–192. [Google Scholar]
- Jayne, T.S.; Sanchez, P.A. Agricultural productivity must improve in sub-Saharan Africa. Science 2021, 372, 1045–1047. [Google Scholar] [CrossRef] [PubMed]


Publisher’s Note: MDPI stays neutral with regard to jurisdictional claims in published maps and institutional affiliations. |
© 2022 by the authors. Licensee MDPI, Basel, Switzerland. This article is an open access article distributed under the terms and conditions of the Creative Commons Attribution (CC BY) license (https://creativecommons.org/licenses/by/4.0/).