Article

Stable Isotope Analysis Supports Omnivory in Bank Voles in Apple Orchards

by
Linas Balčiauskas
1,*,
Vitalijus Stirkė
1,
Andrius Garbaras
2,
Raminta Skipitytė
2 and
Laima Balčiauskienė
1
1
Nature Research Centre, Akademijos 2, 08412 Vilnius, Lithuania
2
Center for Physical Sciences and Technology, Saulėtekio av. 3, 02300 Vilnius, Lithuania
*
Author to whom correspondence should be addressed.
Agriculture 2022, 12(9), 1308; https://doi.org/10.3390/agriculture12091308
Submission received: 13 July 2022 / Revised: 19 August 2022 / Accepted: 22 August 2022 / Published: 25 August 2022
(This article belongs to the Special Issue Biodiversity in Fruit Orchards)

Abstract

:
With only periodic and incomplete studies of its diet over time, all with differing methods and conclusions, the degree of omnivory in the bank vole (Clethrionomys glareolus) is not fully clear. We assessed the trophic niche of the species using isotopic (δ15N and δ13C) compositions from hair samples and analysed how C. glareolus shares trophic space with herbivores, granivores and insectivores living syntopically. According to the numbers trapped, C. glareolus was the fourth most numerous species in the apple orchards that we investigated, accounting for 14.4% of all trapped small mammals with a relative abundance of 1.12 individuals per 100 trap nights. The average values of both δ15N and δ13C in the hair of C. glareolus differed from the other trophic groups, with the average of δ15N in orchards and neighbouring habitats (6.55–6.95‰) being closest to that of insectivores. Intraspecific trophic niche differences (depending on age, gender and reproductive status) were not expressed, while correlations between body mass, body condition index and both δ15N and δ13C values were not consistent. In comparison to analysed basal resources, isotopic signatures in the hair were closest to the values in invertebrates and apple seeds. The degree of omnivory in C. glareolus was not the same in different habitats. This may be an indication of ecological plasticity within the species, allowing its inclusion/success in multi-species small mammal communities.

1. Introduction

Omnivory in small mammals can be understood as a strategy for surviving in communities involving several trophic groups. However, the significance of omnivory is not understood well, especially in terms of its stabilizing role, its influence on habitat selection and its role in the population dynamics of omnivorous species [1]. Based on the capacity of vertebrates to respond to habitat changes as a function of their ecological traits [2], omnivores show synchronous responses, and therefore could be more resistant to negative influences.
According their teeth, rodents mostly originated as omnivores, but later, in the evolution of the order, radiated into several different trophic groups [3]. In small mammals, omnivores differ in their foods from herbivores, granivores and carnivores, but there may be seasonal shifts in the differences [4]. The proportion of omnivorous species in small mammal communities differs across continents, latitudes and habitats; they are best represented in tropical and desert habitats [5,6,7]. In desert habitats with limited availability of seed resources, granivory in small mammals is limited and replaced by omnivory [8].
Though deviation of the diet from the population average is not advantageous for an omnivore [9], seasonal shifts in the breadth of the isotopic niche depending on food resources is characteristic of tropical climates, abounding in generalist species [10]. In forest zones, clear-cutting can result in changes in the proportions of trophic groups, best expressed in granivore-omnivores and being characteristic of both coniferous and deciduous stands [11]. After canopy closure, the numbers of omnivores decrease and insectivores increase [12]. In addition to the influence of successional stage, the responses of small mammals to herbicide treatment might be important to changes in the proportions of trophic groups [13]. This also should be kept in mind for small mammals in commercial apple orchards [14].
The bank vole (Clethrionomys glareolus), also known as Myodes glareolus [15], is a small mammal species widespread in the Palaearctic and inhabits various woodlands, shrubby areas and parklands [16]. In Lithuania, it is very widespread and numerous, found in all forest habitats, lakeshores, shrubby meadows and reedbeds [17,18], as well as agricultural and commensal habitats [14,19]. In orchards, C. glareolus can cause damage by gnawing bark [20] and, thus, knowledge of its diet might have practical significance.
The trophic position of C. glareolus has not been clearly defined, though an intermediate position between herbivorous and insectivorous/granivorous species was recognized recently [21]. It can survive on animal resources only [3] and shows preference for animal food when starving [22]. Other authors show various proportions of animal foods, seeds and other components in the diet of C. glareolus, thereby recognizing species omnivory [23,24] or terming the species omnivorous [25]. These studies included various methods of diet investigation, including stomach or faeces analyses [24,26], various cafeteria experiments [22,23,27], the studying the relative lengths of the parts of alimentary tract [4] and environmental niche modelling [28].
In C. glareolus, the content of nitrogenous substances in the stomachs and, consequently, in the food varied depending on the year and habitat [29]. This was in contrast to the findings of Palo and Olsson [30] about seasonal stability of nitrogenous substances in the stomachs. They also found that the nitrogen concentrations in stomachs were not related to the body masses of these voles.
Isotopic niches, as a substitute for trophic or dietary niches, of small mammals are currently used instead of direct investigations of the diet. Isotopic signatures in tissues or hair show dietary information, with a higher ratio of nitrogen (15N/14N) indicating consumption of animal foods [27]. This method allows diets to be related to body condition [31]. For C. glareolus, it was experimentally shown how big the trophic discrimination factor (Δδ13C and Δδ15N) is, as measured between diet and hair, when fed on C3 plant-based diets and 30% animal matter based diets [32]. In Lithuania, isotopic analysis has been the only method used for dietary studies of small mammal herbivores [33] and granivores [34], while the diet of omnivorous small mammals, as a trophic group, had not been investigated so far.
The aim of this investigation was to evaluate the trophic position of C. glareolus in commercial apple orchards along with proportion of the species in small mammal communities and its relative abundance. To assess its omnivory, we analysed whether the species position in the isotopic space differed from herbivorous and granivorous species according to carbon, and how close the species position was to insectivorous species according to nitrogen values. We tested two working hypotheses: (1) to demonstrate that C. glareolus is omnivorous, the values of stable carbon and nitrogen isotopes in their hair should differ from those in the other trophic groups; (2) concerning intraspecific patterns of diet, we tested whether higher nitrogen values were characteristic of females with forming embryos or in lactation and whether nitrogen values differed according body the mass/body condition index of individuals.

2. Materials and Methods

2.1. Study Sites

During 2018–2021, ten commercial apple orchards in Lithuania, characterised by different age and intensity of agricultural measures, were investigated (Figure 1). Every site had an adjacent control habitat: a mowed meadow, an unmowed meadow or a forest. The average size of an orchard was 63.7 ha. In the young and middle-aged apple orchards (Figure 1b) only one rodent individual was trapped during the first two years of study, therefore we expanded the number of old orchards in 2020 (sites 8–10), abandoning sites 6 and 7. The intensities of agricultural practices (Figure 1c) were defined as high when two or more practices (application of plant protection agents, application of rodenticides, soil scarification, grass mowing, grass mulching) were applied frequently. Medium intensity meant applying two of the listed measures once or twice during the crop season, while low intensity meant only grass mowing [14,35].

2.2. Small Mammal Trapping and Size of Bank Vole Samples

We used snap-traps, arranged in lines of 25 traps at 5 m intervals [36]. Traps were baited with brown bread and raw sunflower oil, exposed for three days, checked once per day in the morning. Bait was changed after rain or when consumed. Total trapping effort was 23,433 trap-days during 2018–2021 (15,458 for the orchards and 7965 for the control habitats). Due to the different representation of orchards and their control habitats, equal trapping effort was not achieved (Table S1).
Species of trapped small mammals were identified by their external features, and specimens of Microtus voles were identified by their teeth [17]. The age (adults, sub-adults, juveniles) and reproductive parameters of small mammals were identified under dissection based on body weight, the status of sex organs and atrophy of the thymus, the last of which decreases with animal age [37]. Individual fitness was calculated as body condition index C according to Moors [38], based on body weight in g (Q) and body length in mm (L). For pregnant females, the weight of the uterus with embryos was excluded [39]. In males, participation in reproduction was assessed by checking testes size and fullness of edidymis and additional glands. In females, participation in reproduction was assessed by checking perforation and plug of vagina, counting the numbers of placental scars, corpora lutea and assessing the number and mass of embryos.
During the four years of study, 1270 small mammal individuals were trapped in orchards and non-orchard habitats (Table S2). Species were attributed to four groups according to [4,21,22,23,24,26,27,28,33,34]. These were insectivores—common shrews (Sorex araneus), pygmy shrews (S. minutus) and Mediterranean water shrews (Neomys anomalus); herbivores—field voles (Microtus agrestis), common voles (M. arvalis), root voles (M. oeconomus) and water voles (Arvicola amphibius); granivores—striped field mice (Apodemus agrarius), yellow-necked mice (A. flavicollis) and harvest mice (Micromys minutus). Omnivores were represented with C. glareolus and house mice (Mus musculus). This last species was trapped in the control habitats only (proportion 0.7%, CI = 0.3–1.7%) and, therefore, was not analysed further. According to the numbers trapped, C. glareolus was the fourth most numerous species in the apple orchards and the third in the adjacent control habitats.
During 2018–2021, 191 C. glareolus individuals were trapped. Excluding very dirty or blood covered individuals, as well as those affected by insects, this number was down-sampled to 141 individuals for the isotopic analysis. The distribution of the sampled C. glareolus by habitat, age and gender is presented in Table 1.

2.3. Stable Isotope Analysis of Hair and Basal Resources

We analysed carbon and nitrogen stable isotopes in the hair of the trapped C. glareolus. About 5 mm of hair was clipped from the back of individuals between the shoulders. Dirty samples were washed in deionized water and methanol, then dried. Samples were stored dry in bags before analyses.
Basal resources, representing possible foods of C. glareolus in eight orchards, were collected in 2020–2021. They represented invertebrates, sedges (exclusively Poacea), forbs (other plants, such as Taraxacum, Urtica, Trifolium, Plantago, Artemisia, Achillea, Chenopodium), apple fruit, apple fruit seeds and leaves of the apple trees. Samples (n = 61) of the basal resources were stored in a freezer at below −20 °C prior to preparation and analysis. Samples were dried in an oven at 60 °C to a constant weight for 24–48 h and then homogenized to a fine powder (using mortar and pestle and a Retsch mixer mill MM 400).
Analyses were conducted using an elemental analyser (EA) (Flash EA1112) coupled to an isotope ratio mass spectrometer (IRMS) (Thermo Delta V Advantage) via a ConFlo III interface (EA-IRMS). Five percent of the samples were run in duplicates and the obtained results for these samples were averaged.
Caffeine IAEA-600 (δ13C = −27.771 ± 0.043‰, δ15N = 1 ± 0.2‰), Ammonium Sulfate IAEA-N-1 (δ15N = 0.4 ± 0.2‰), and Graphite USGS24 (δ13C = −16.049 ± 0.035‰), provided by the International Atomic Energy Agency (IAEA), were used as reference materials. We re-ran standards every 12 samples [34,35], obtaining SD = 0.06‰ for carbon and SD = 0.10‰ for nitrogen. Of the basal resources, invertebrates were analysed in a single run, and plant foods in duplicate. The obtained values were averaged.

2.4. Data Analyses

For each locality, the relative abundance (RA) of C. glareolus was expressed as the number of individuals trapped per 100 trap-days per trapping session [40]. We used standard statistics (average, SE, minimum and maximum in tables, 95% CI in figures) for RA and stable isotope values. The proportion of C. glareolus among all trapped small mammals was presented as average and the 95% CI was calculated with the Wilson method of the score interval [41] using OpenEpi epidemiological software [42]. The Wilson confidence intervals have better coverage rates for small samples. Differences in the proportions were evaluated using the G test with an online calculator [43].
We used general linear models (GLM) in two analyses. In the first case, the RA of C. glareolus was used as the dependent variable, with habitat, orchard age, intensity of agricultural measures, year and season as categorical predictors, and trapping effort and abundances of three most numerous herbivore/granivore species as continuous predictors. In the second model, the values of δ13C and δ15N were used as the dependent variables, with habitat, intensity of agricultural measures, season, year, animal age and animal gender as categorical predictors, and body mass and body condition index of an individual as continuous predictors. Hotelling’s T2 was used to test the significance of the model and eta-squared for the influence of the categorical factors. We applied Tukey HSD with unequal N for post-hoc analysis. The minimum confidence level was set as p < 0.05. At the level p < 0.10, we supposed a trend, but not a difference, would exist.
Before running the GLM, we tested the normality of the distributions of the δ13C and δ15N values, body condition index, body mass and RA via Kolmogorov–Smirnov’s D. The first three listed parameters conformed to normal distribution (D = 0.08, 0.09 and 0.07 respectively, all p > 0.50). The distributions of the body mass in adult, sub-adult and young C. glareolus also were normal (D = 0.12, p = 0.27; D = 0.21, p = 0.06; and D = 0.12, p = 0.15 respectively). The distribution of RA was not normal due to the high number of trapping sessions when C. glareolus was not present, especially in summer.
The relationships between δ13C and δ15N values and body mass, body condition index and reproduction parameters were assessed using ANOVA and Pearson correlation. In adult C. glareolus, we compared three male groups (non-breeding, spermatogenesis weak, spermatogenesis strong) and four female groups (inseminated, gravid with visible embryos, after normal gravidity and after gravidity when non-implantation occurred).
The isotopic signatures of the basal resources were analyzed by object group (invertebrates, sedges, forbs and apple). The reported values are the arithmetic means with SE of the δ13C and δ15N for all basal resources mentioned above. Diet/hair trophic discrimination factors (TDF) were calculated as the difference between diet and hair, expressed as Δ13C and Δ15N [32,44].
Calculations were done in Statistica for Windows, version 6.0 (StatSoft, Inc., Tulsa, OK, USA), and biplots were drawn in SigmaPlot ver. 12.5 (Systat Software Inc., San Jose, CA, USA).

3. Results

3.1. Proportions of Bank Voles in Small Mammal Communities and Species Abundances in Apple Orchards and Control Habitats

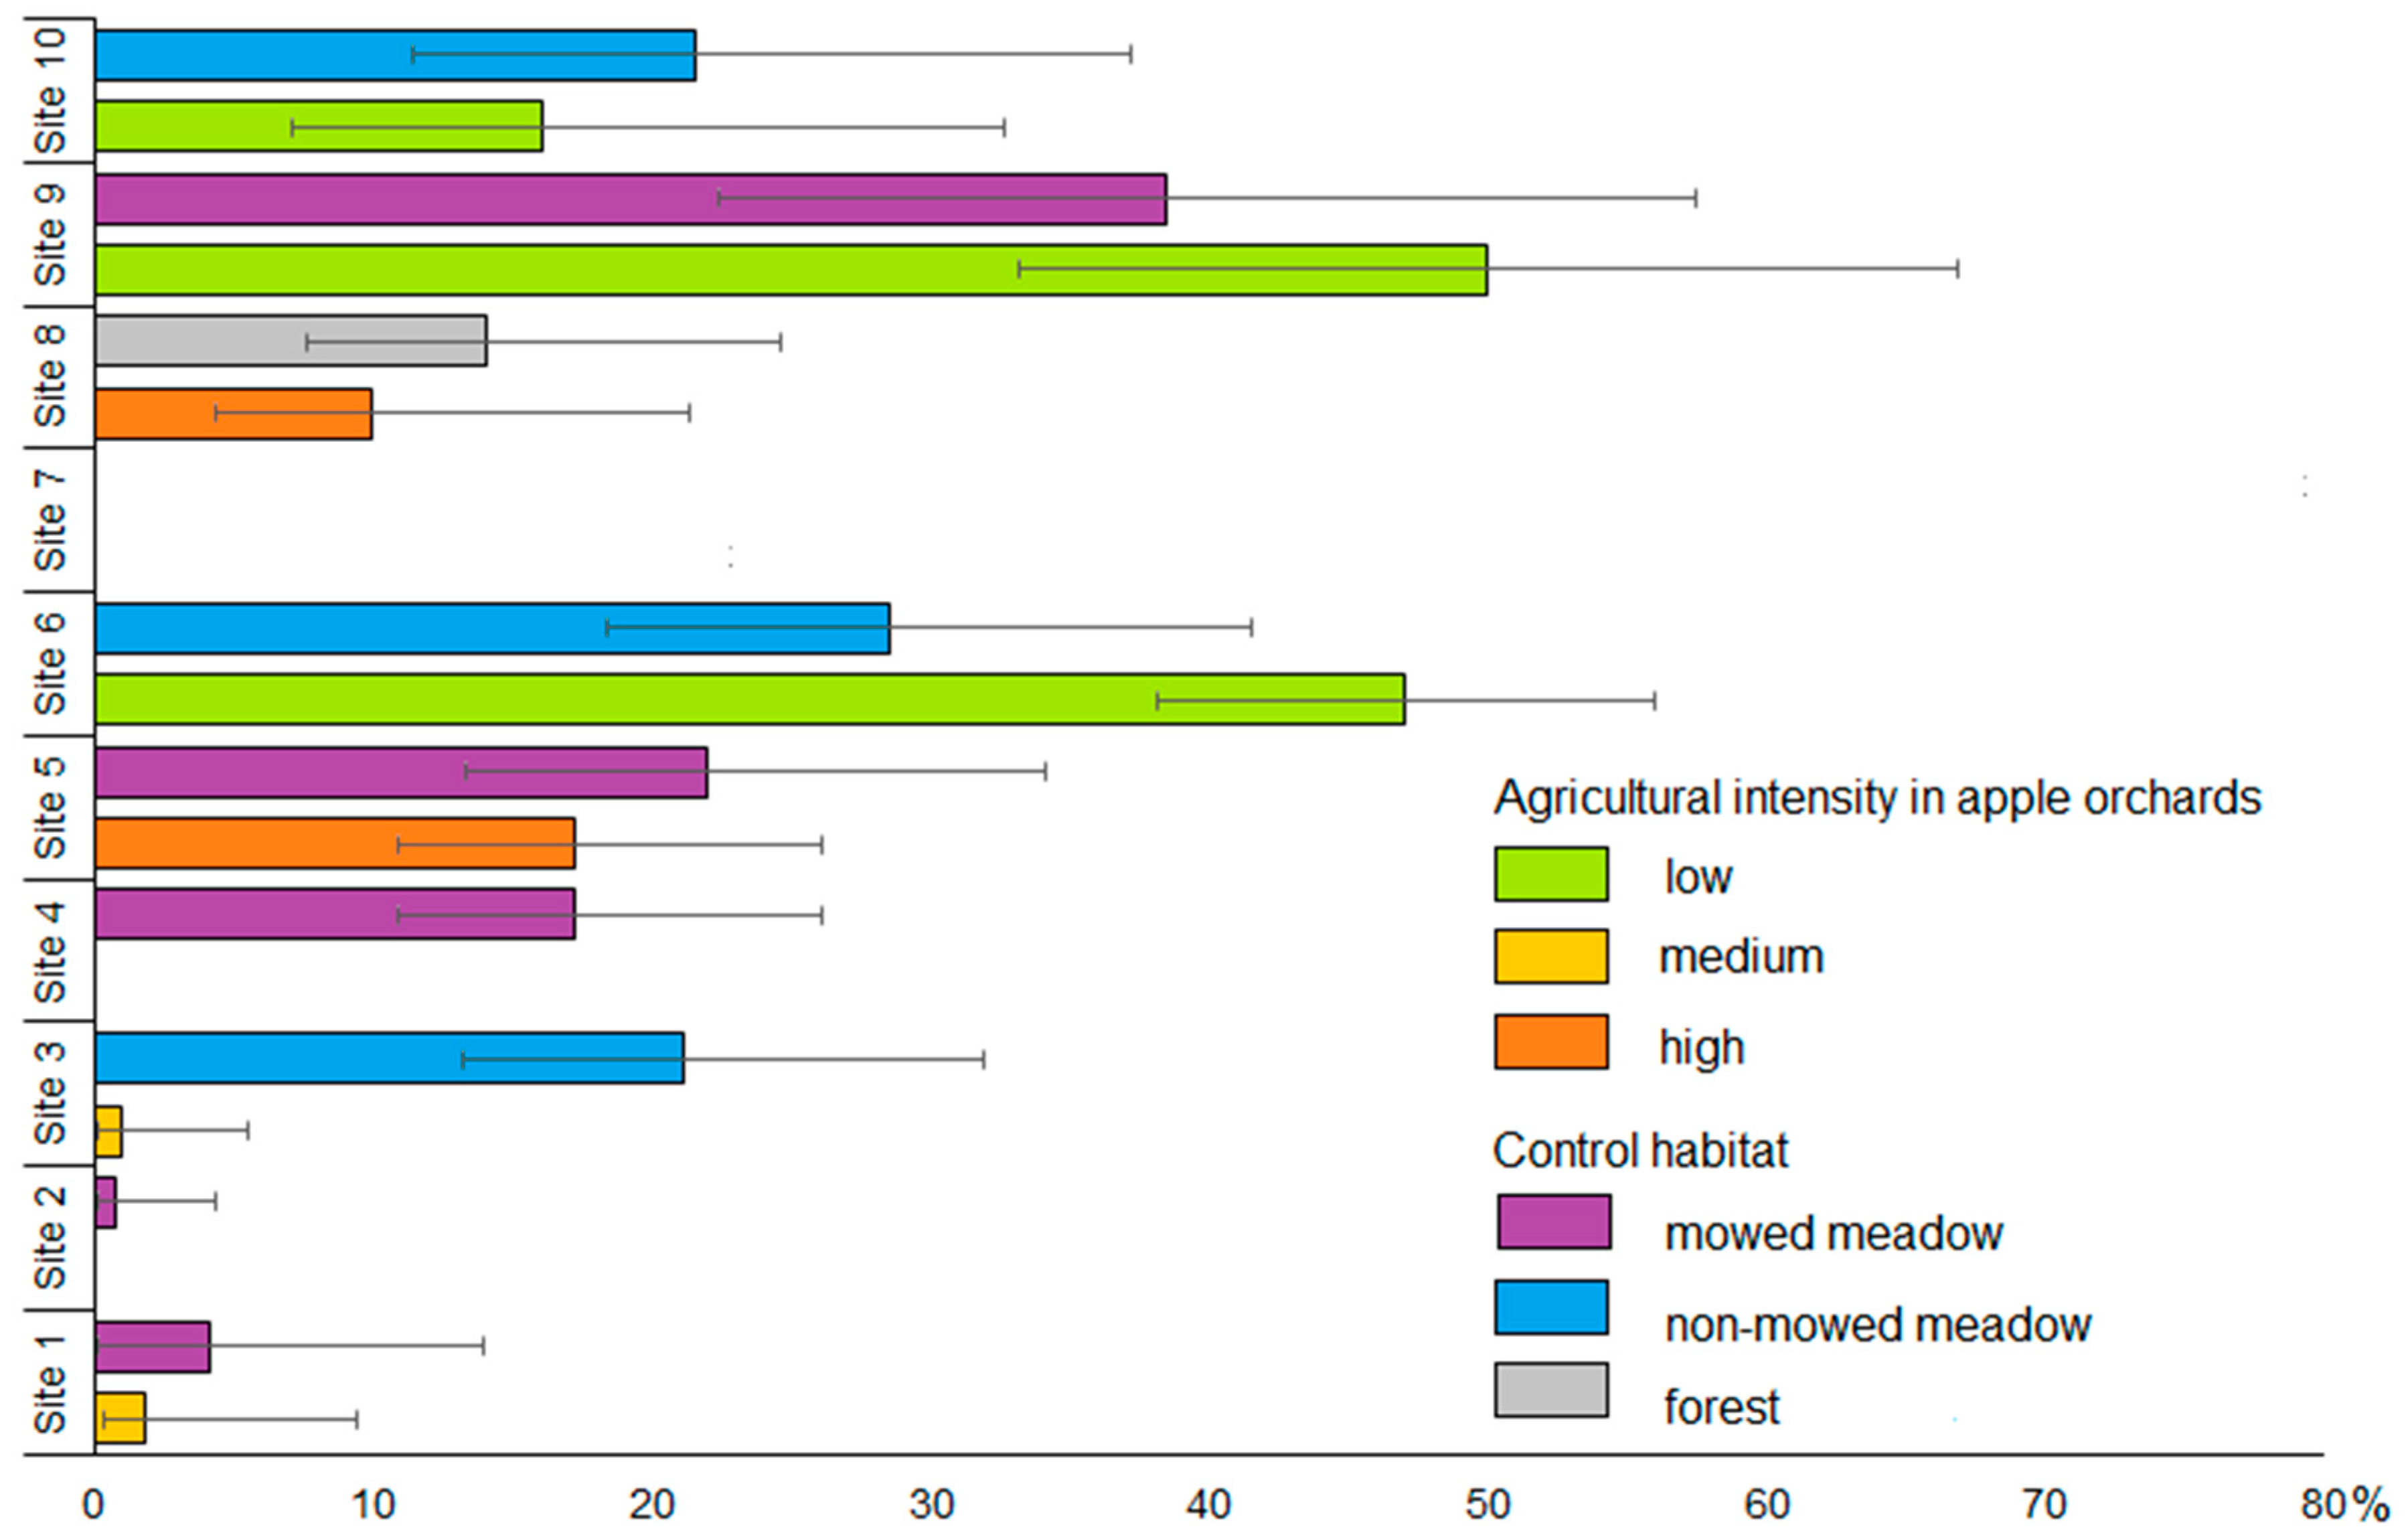
Irrespective of habitat, the proportions of C. glareolus in the investigation sites varied considerably (Figure 1d). The proportions of C. glareolus in all trapped small mammals in sites 5, 8 and 10 varied in the range 10–20%, while in sites 1, 3 and 4 it was between 3–9% and in sites 2 and 7 between 0.6% and zero. These differences are significant (G = 186.7, p < 0.0001).
The proportion of C. glareolus in small mammal communities varied depending on the habitat (G = 17.6, p < 0.005). In total, the highest proportion was found in non-mowed meadows (29.8%, CI = 22.2–38.8%), followed by apple orchards (14.4%, CI = 12.0–17.3%) and forest (14.1%, CI = 7.6–24.6%), with smallest figure in mowed meadows, where C. glareolus comprised only 12.1% (CI = 9.3–15.6%).
In the orchards, the presence of C. glareolus was related to agricultural intensity (Figure 2). The proportion of the species at low intensity was 42.1% (CI = 35.1–49.5%), significantly exceeding that at medium (4.5%, CI = 2.2–9.1%) and high (6.1%, CI = 4.0–9.1%) intensity of treatment (G = 96.0, p < 0.0001).
The average relative abundance (RA) of C. glareolus in the study period was 1.2 ± 0.2 individuals per 100 trap-days, not very high. Out of 128 trapping sessions, the species was not trapped in 84 sessions (zero abundance), while the maximum abundance was 15.3 individuals per 100 trap-days. The dynamics of the RA are presented in Table S3. The general pattern (low RA and weak representation in summer across all sites, both increasing in autumn) remained the same throughout the study period.
The analysed GLM model was significant (F15,112 = 5.829, p < 0.0001) and explained 36% of the variation of RA of C. glareolus. The influence of the habitat (F2,112 = 5.53, p < 0.0001), the intensity of the agricultural treatment (F2,112 = 4.94, p < 0.01) and the abundance of A. agrarius (F1,112 = 4.59, p < 0.05) were the most expressed, with the partial eta2 being 8.90, 8.11 and 3.94% respectively. These influences were not constrained by trapping effort (F1,112 = 0.021, p = 0.88).
Post-hoc analysis confirmed significant differences of RA between seasons (0.84 individuals per 100 trap-days in summer versus 1.63 individuals per 100 trap-days in autumn, HSD, p < 0.05). The highest average RA of the species were found in non-mowed meadows (3.39 individuals per 100 trap-days), significantly exceeding that in mowed meadows (0.83), but not significantly differing from those in apple orchards (1.12) and forest (1.50 individuals per 100 trap-days). The average RA of C. glareolus in the orchards with low intensity of treatment (5.28 individuals per 100 trap-days) exceeded those in meadows and forest (1.35), and orchards with medium (0.04) or high (0.21 individuals per 100 trap-days) intensity of treatment; all differences highly significant (HSD, p < 0.001).

3.2. Stable Isotope Ratios of Omnivorous Bank Voles and Related Factors

The central positions and ranges of stable isotope ratios in the hair of C. glareolus irrespective of the habitat were: δ13C = −26.10 ± 0.08, range −26.10–−28.55‰; δ15N = 6.17 ± 0.14, range 1.94–11.30‰. Thus, variation in the nitrogen was quite wide. The cumulative influence of year, season, habitat, intensity of agricultural treatment, animal gender, age, body mass and body condition index explained 13.5% of δ13C variation (GLM, F11,126 = 2.94, p < 0.002) and 27.2% of δ15N variation (F11,126 = 5.64, p < 0.0001).
The most significant influences were by habitat (Hotelling’s T2 = 0.19, p < 0.001, partial eta2 = 8.8%), intensity of treatment (T2 = 0.08, p < 0.05, partial eta2 = 7.5%) and season (T2 = 0.05, p < 0.05, partial eta2 = 5.0%). The influence of the animal’s age was on a tendency level (T2 = 0.08, p = 0.054, partial eta2 = 3.7%), while the influences of the year, animal gender, body mass and body condition index were not significant.
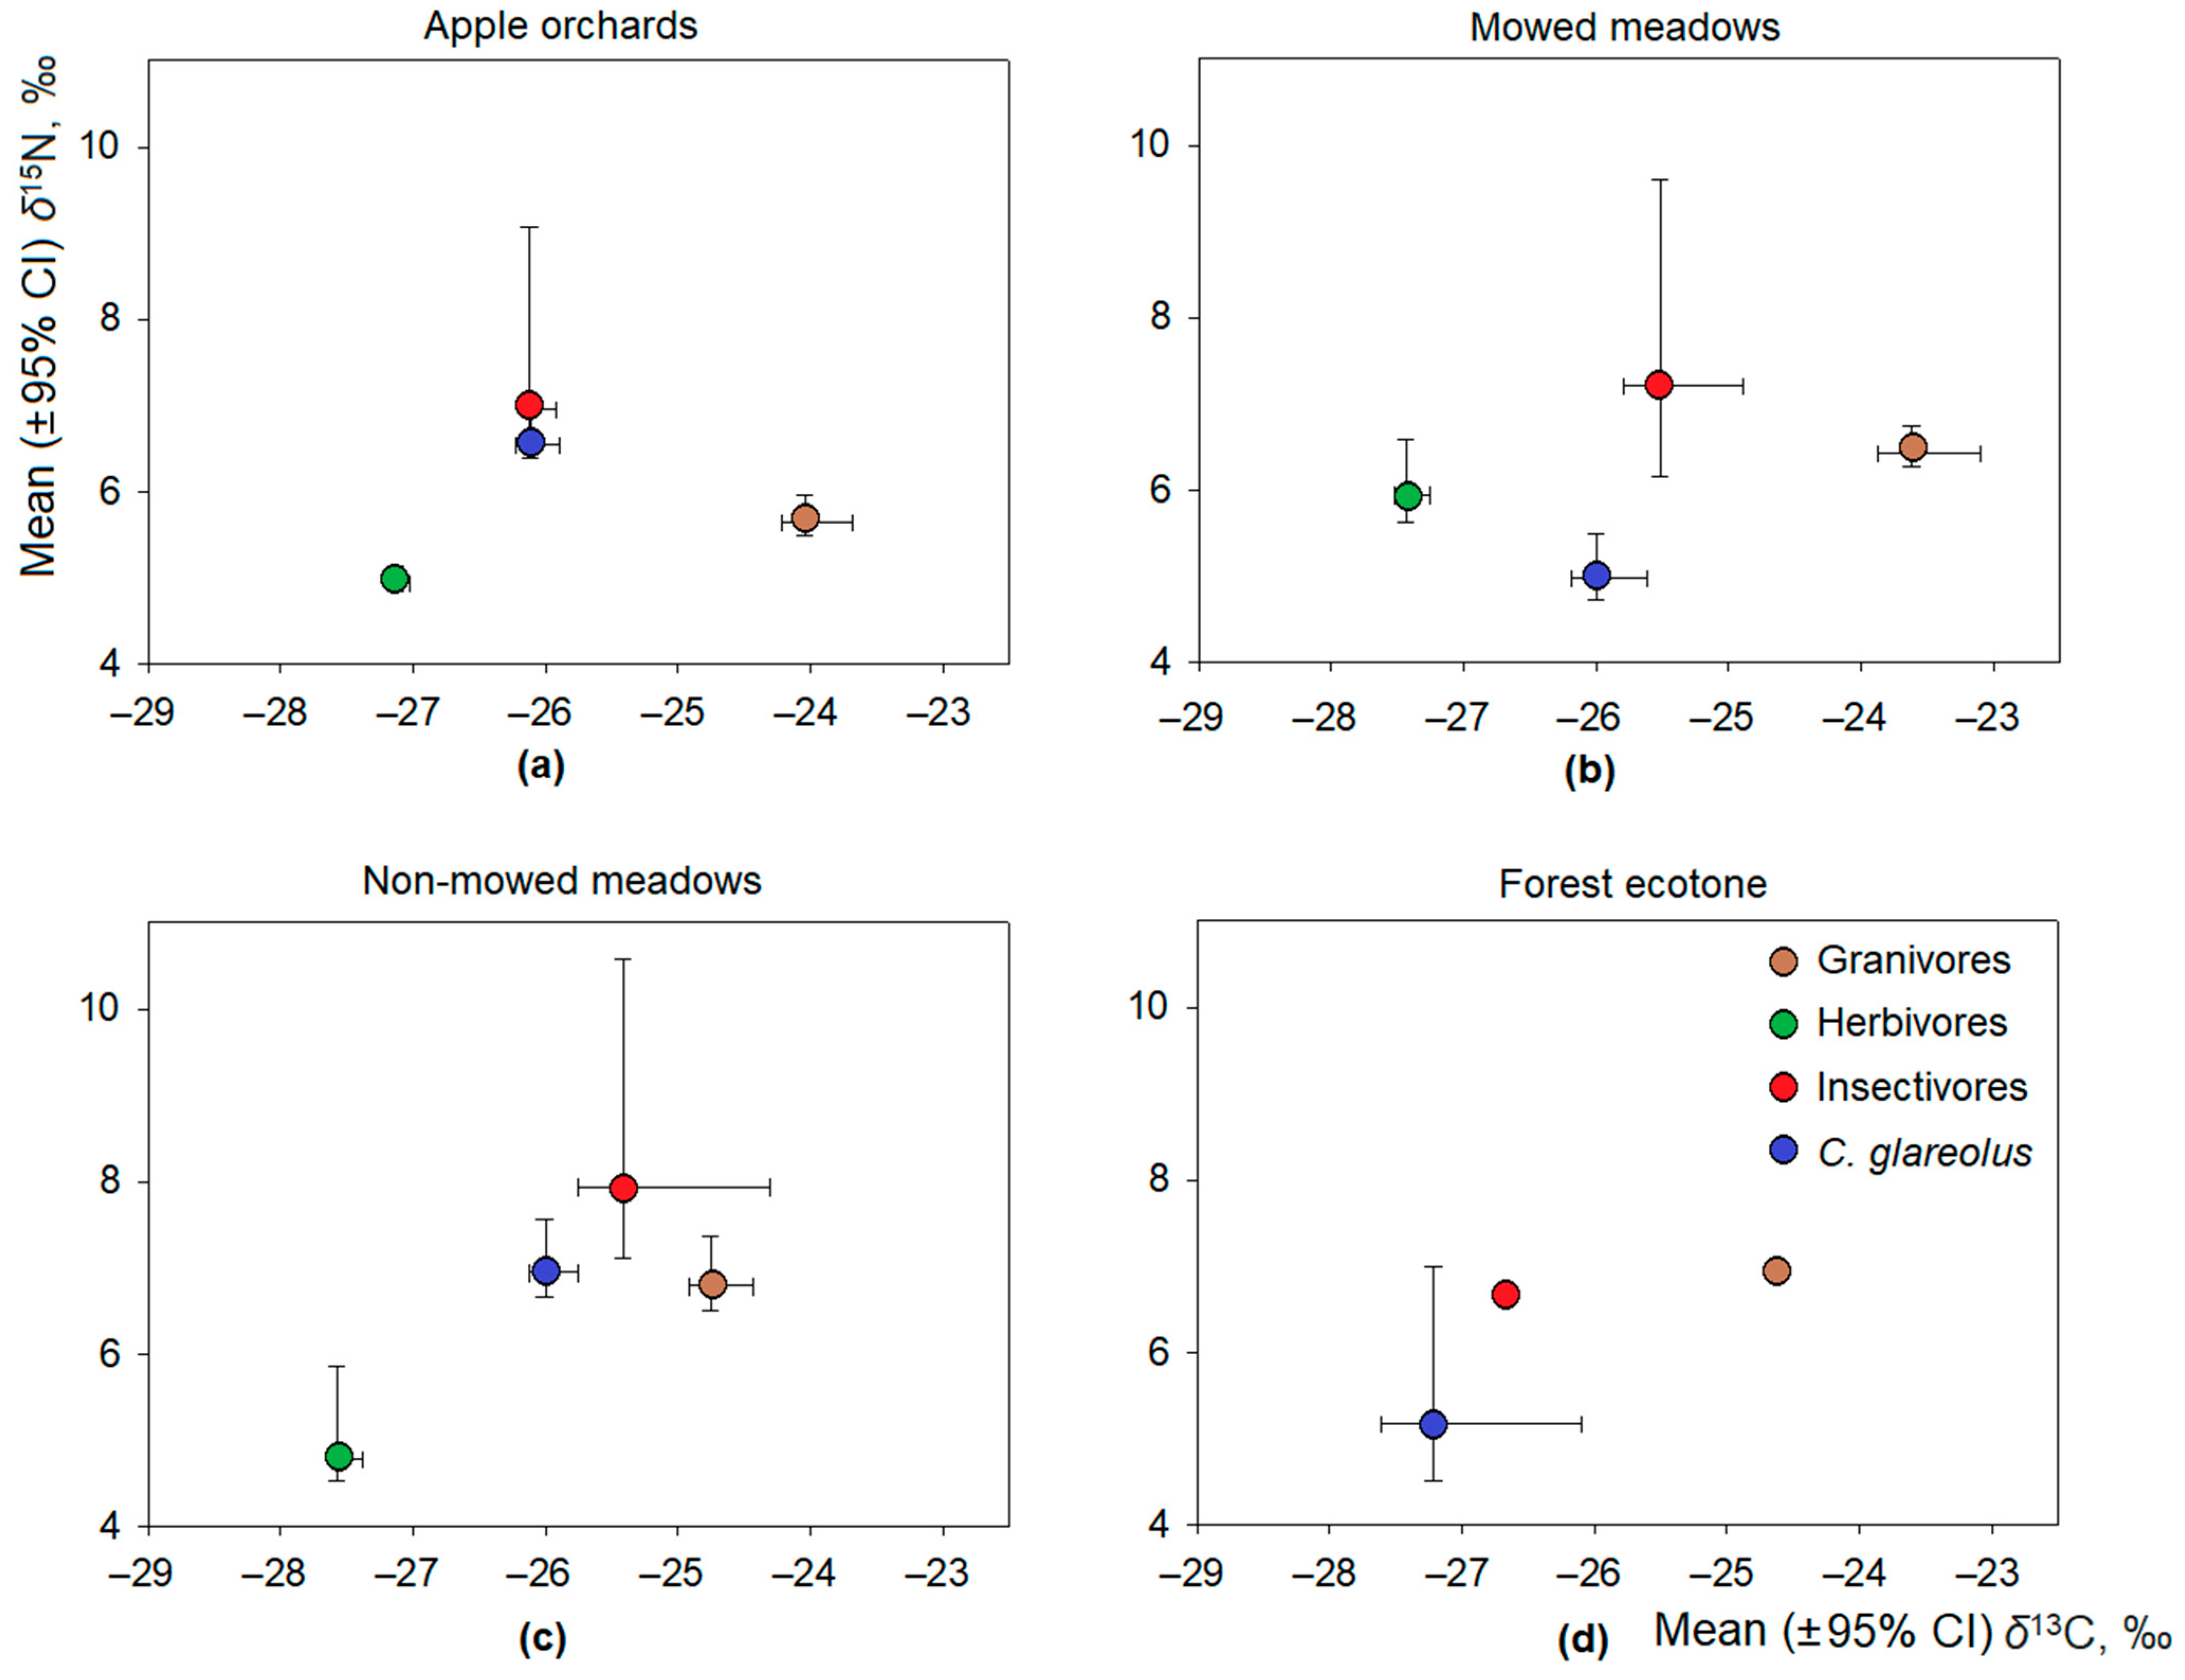
In the apple orchards (Figure 3a), the differences in both δ13C and δ15N average values in the hair of co-occurring C. glareolus from the other trophic groups were significant (F3,384 = 87.5 and F2,385 = 15.9, respectively, both p < 0.0001). The average value of δ13C in C. glareolus was between those in granivores and herbivores, differing from both (Tukey HSD, p < 0.001), but equalling that in insectivores. The average value of δ15N in C. glareolus was significantly above those in granivores and herbivores (HSD, p < 0.005), but did not differ from that in insectivores (Figure 3a).
In the mowed meadows (Figure 3b), significant differences in the hair of co-occurring C. glareolus from the other trophic groups were found in δ13C (F3,251 = 27.7, p < 0.0001), but not in δ15N (F3,251 = 1.3, NS). The average value of δ13C in C. glareolus was between those in granivores and herbivores, differing from both (Tukey HSD, p < 0.0001), but not from that in insectivores. The average value of δ15N was the lowest, but did not differ significantly from other trophic groups (Figure 3b).
In the non-mowed meadows (Figure 3c), significant differences in both δ13C and δ15N average values in C. glareolus from the other trophic groups were found (F3,53 = 22.82, p < 0.0001 and F3,53 = 2.93, p < 0.05, respectively). The average value of δ13C was similar to that in mowed meadows. This value was between those in granivores and herbivores, differing from both (Tukey HSD, p < 0.05 and p < 0.001, respectively), but not from insectivores. The average value of δ15N did not differ from the other trophic groups (Figure 3c).
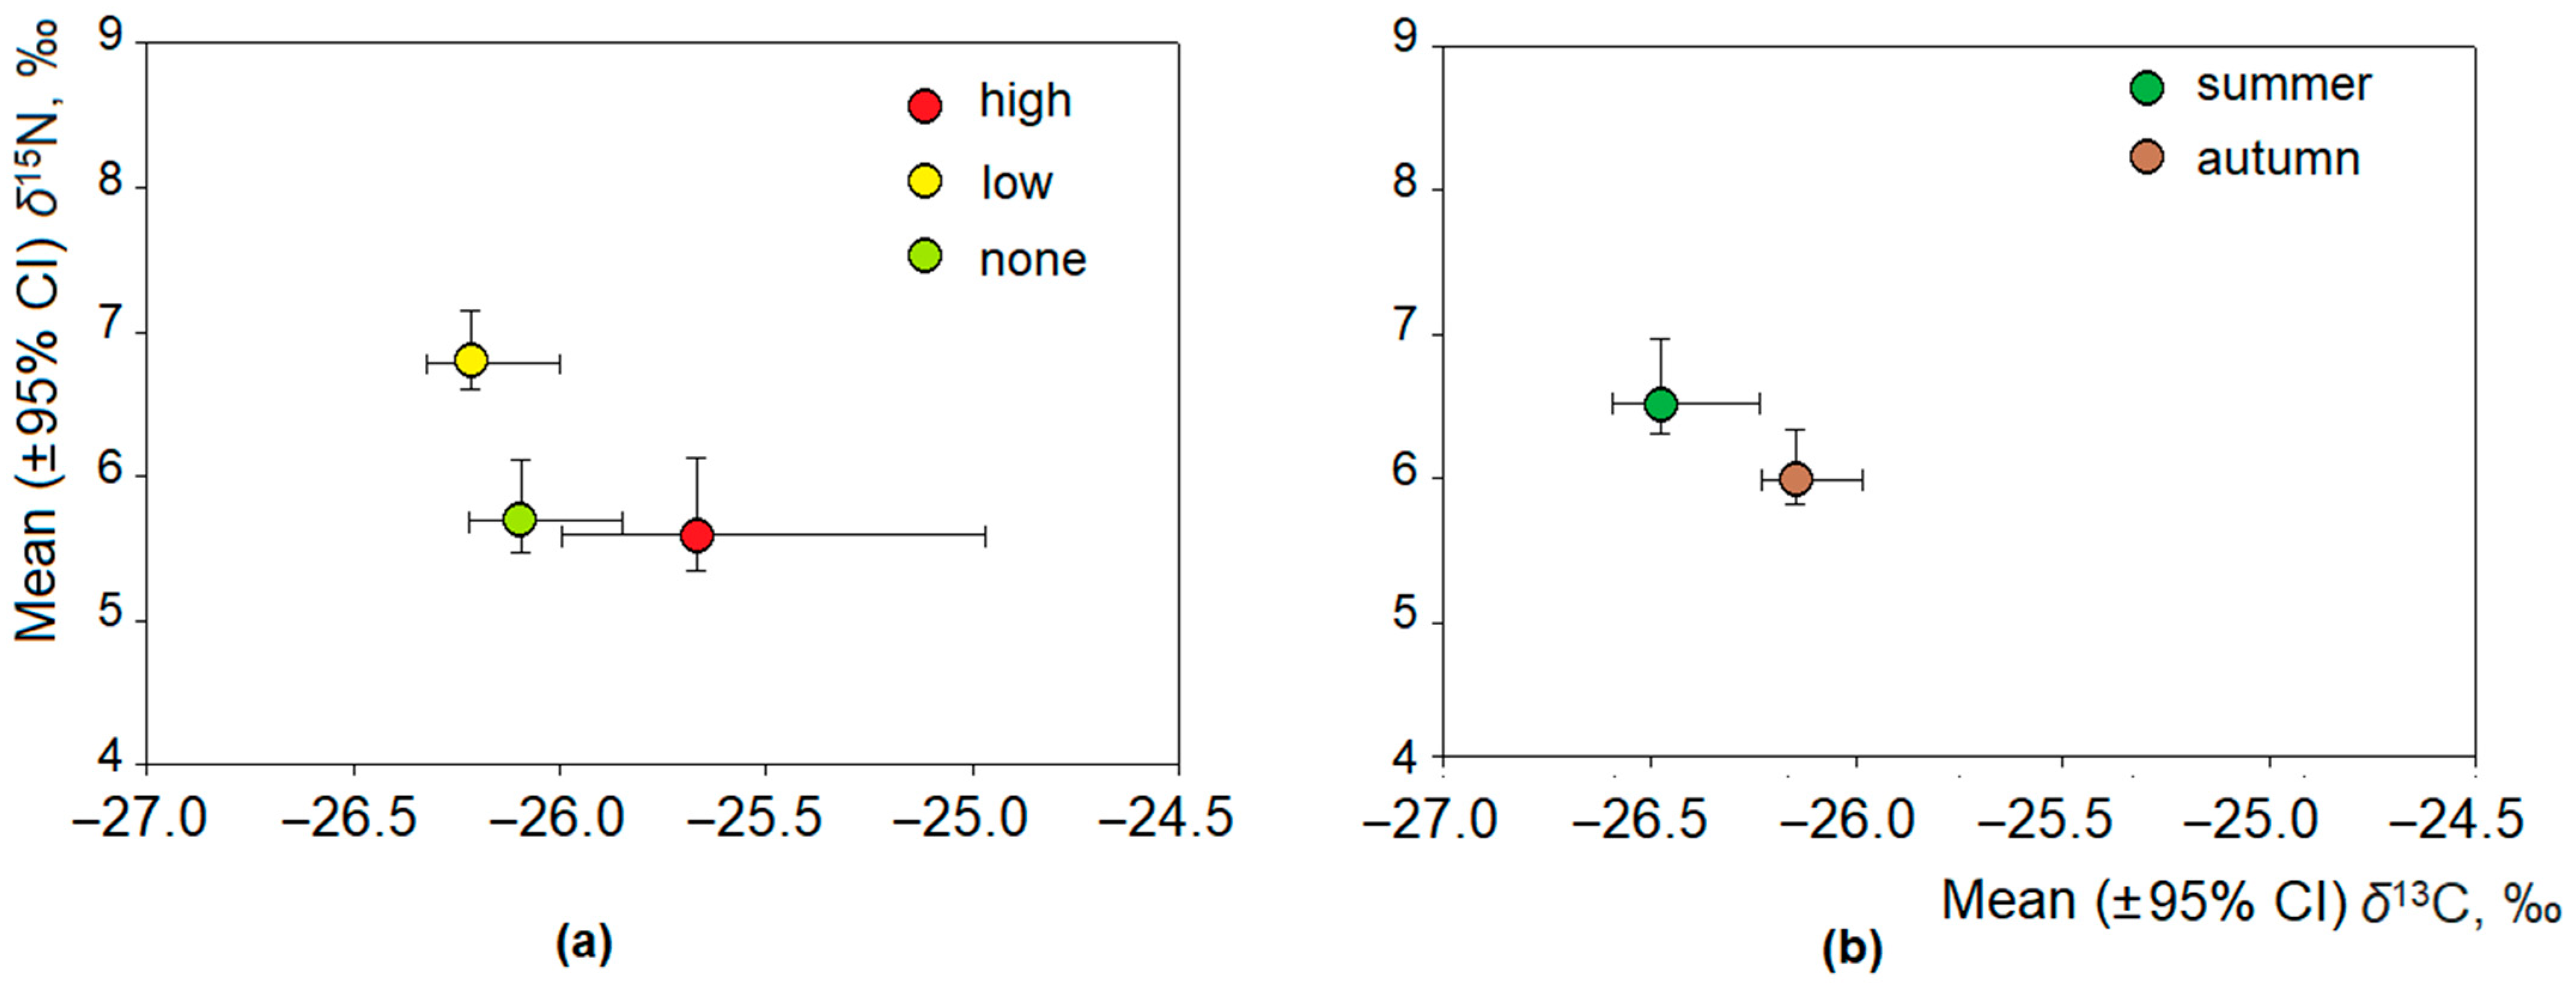
No significant differences were found comparing the δ13C values in C. glareolus in meadows/forests, apple orchards with high intensity of treatment and orchards with low intensity of treatment. The values of δ15N differed significantly, being highest (HSD, p < 0.0001) in orchards with low intensity of treatment (Figure 4a). Note, no C. glareolus were trapped in apple orchards with medium intensity of treatment.
As for the seasonal differences, there were no differences in δ15N (Figure 4b), but δ13C values were higher in the autumn (HSD, p < 0.02).
Quite unexpectedly, nitrogen values were low in the basal resources of both animal and plant origin collected in the apple orchards (Table 2). Invertebrates were more enriched in 15N than in 13C, and the range of 15N was very wide in plants. The most negative value of nitrogen was found in a single sample of lichen (not readily present in other sites). The most positive value was found in apple seeds and was close to that in invertebrates. Average δ13C values were similar, with the range being wider in plants.
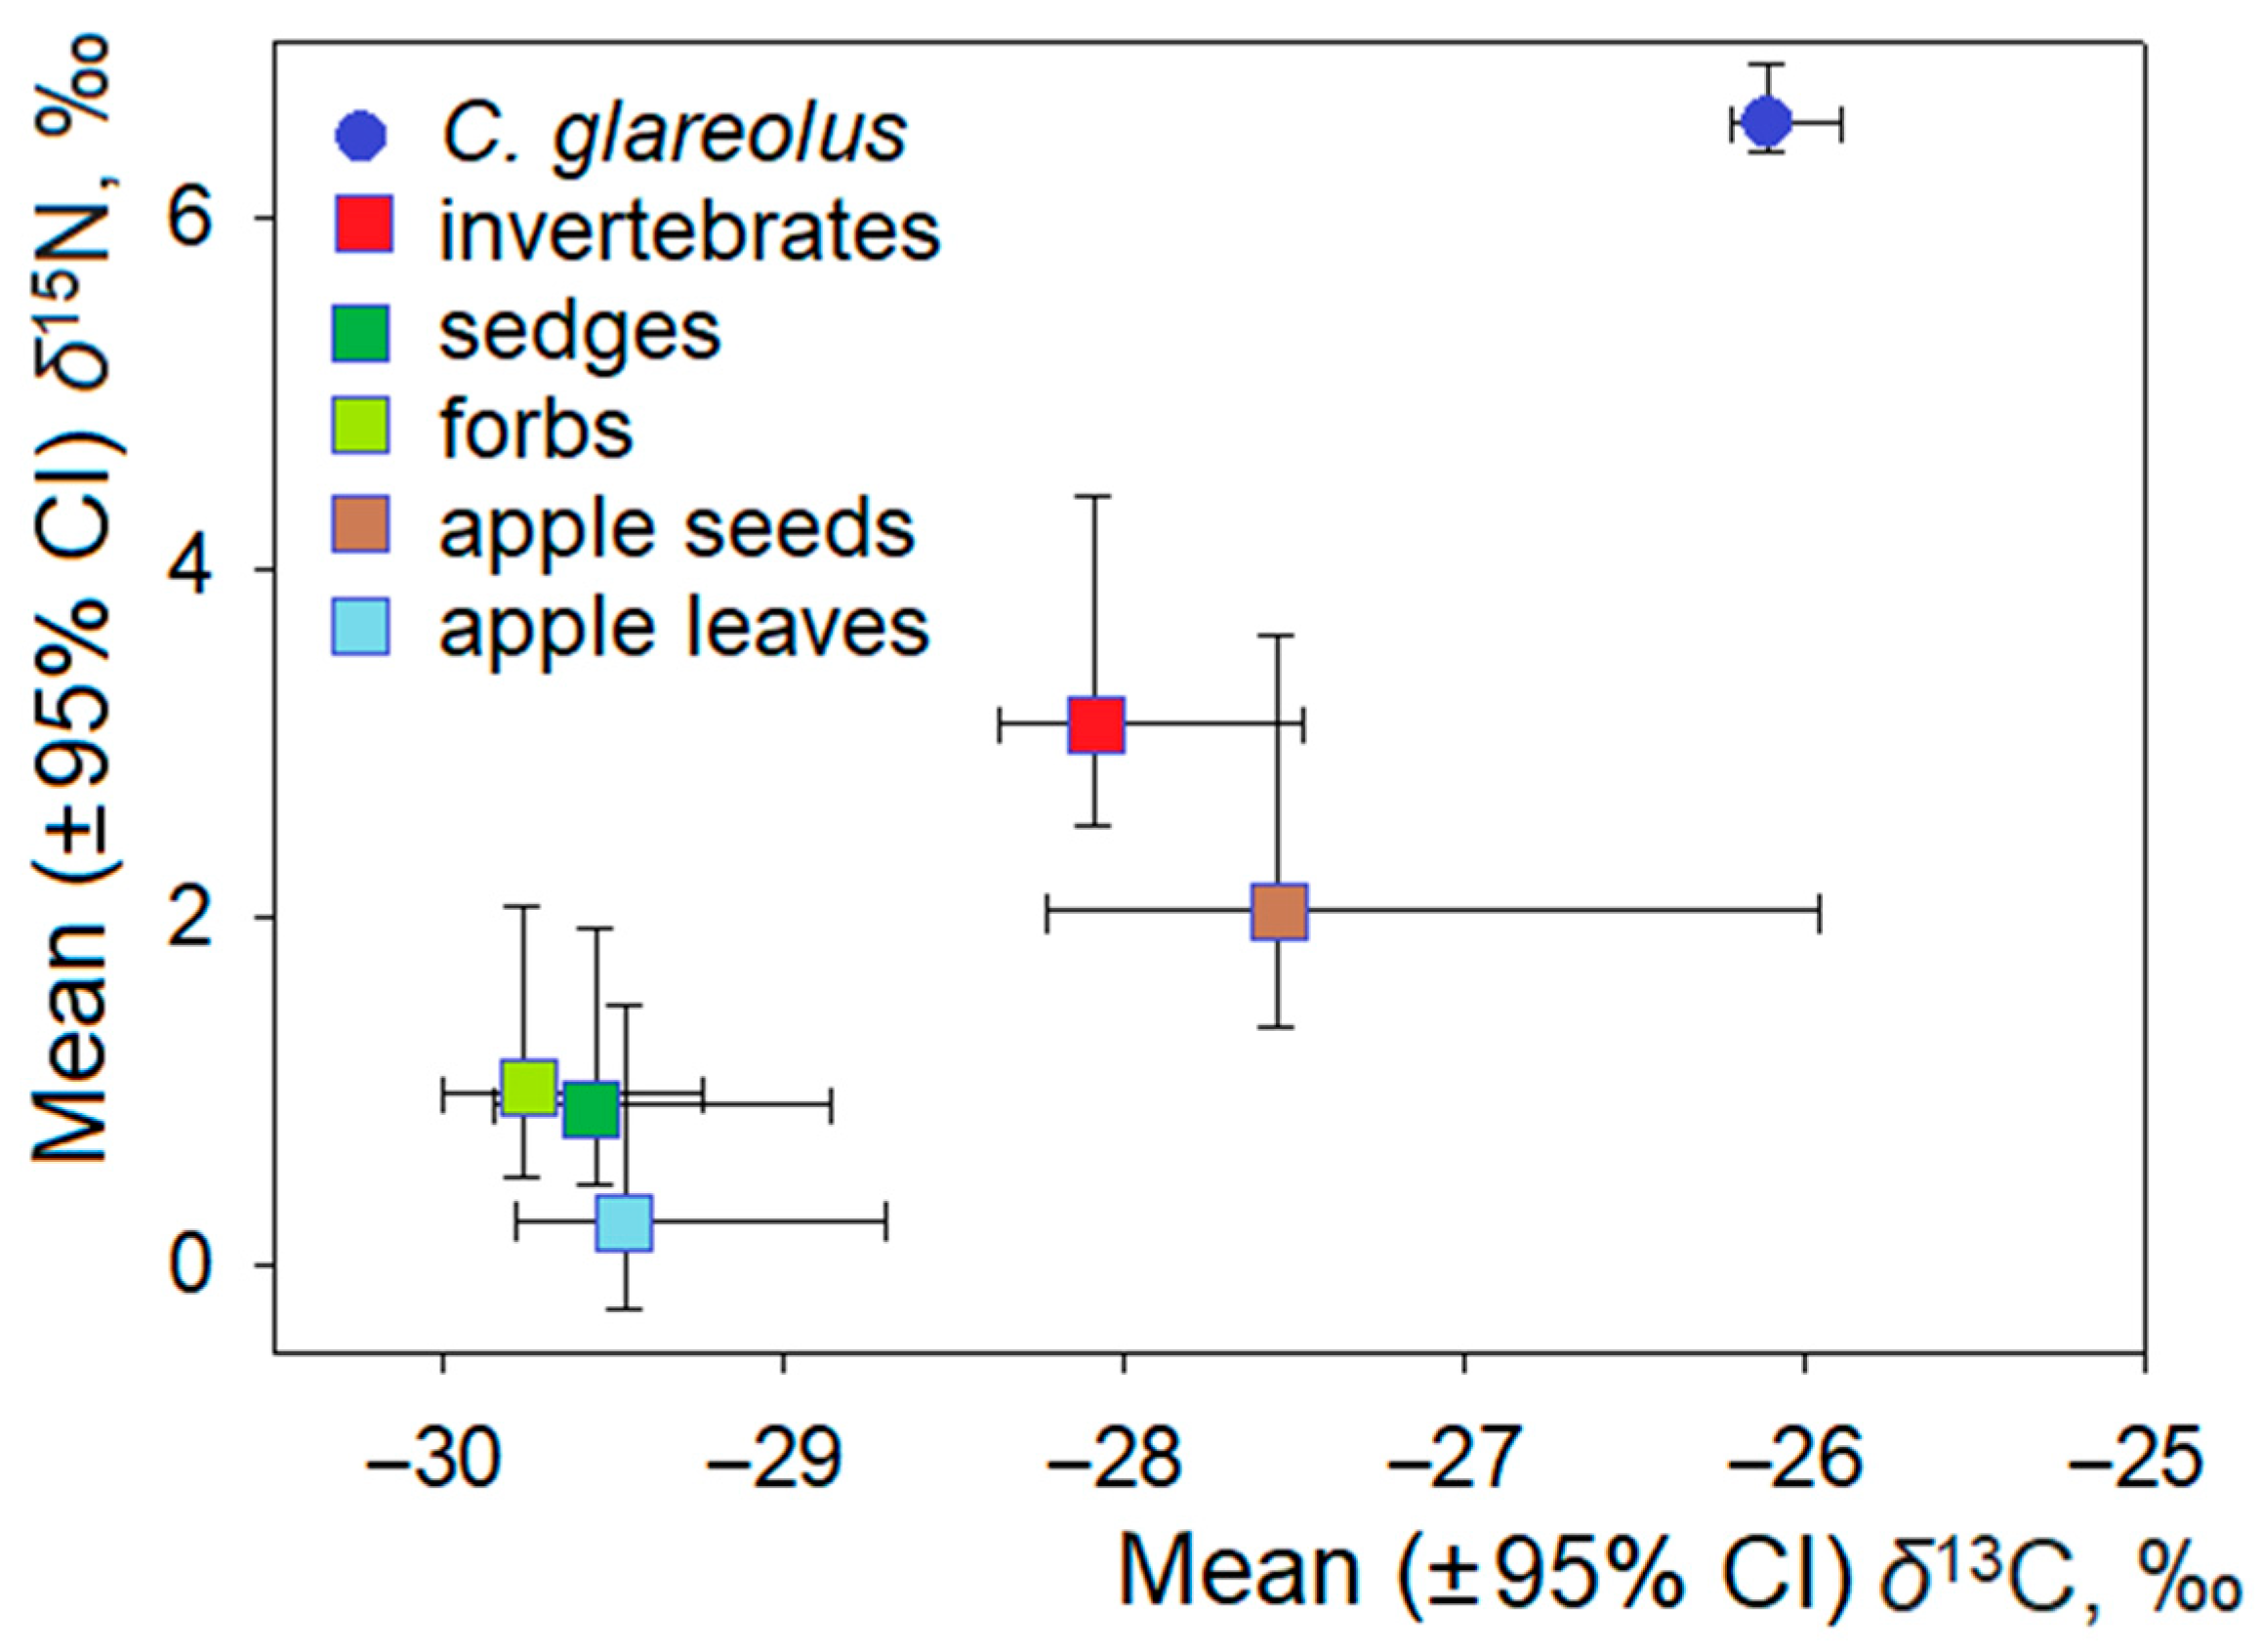
We compared the isotopic signatures in the hair of C. glareolus with the δ13C and δ15N values in the possible food sources. Both invertebrates and apple seeds were at the closest distance to the C. glareolus hair (Figure 5). As for the age-based differences, the highest amount of foods of animal origin was used by subadult and juvenile individuals (Figure S1b). As presented in Figure 3a, the isotopic composition of sedges, forbs and apple leaves were closest to the hair of herbivores, while the content of 13C in granivore hair is very different. The diet/hair TDF in C. glareolus from the apple orchards was 2.48‰/5.33‰ in a pooled sample (irrespective of age), with 2.10‰/4.85‰ in adult voles, 2.34‰/5.91‰ in subadult voles and 2.90‰/5.54‰ in juveniles.

3.3. Intraspecific Differences in Isotopic Ratios in Bank Voles

Irrespective of habitat, intraspecific differences of the isotopic niche of C. glareolus were significant depending on animals’ age (Hotelling’s T2 = 0.12, p < 0.005, partial eta2 = 5.8%), but not their gender (T2 = 0.02, p = 0.30).
When analysed on the habitat basis, intraspecific differences of the isotopic niche of C. glareolus were less expressed (Figure S1). In the apple orchards, the influence of the animal age was significant (T2 = 0.25, p < 0.002, partial eta2 = 5.4%). The model worked for both δ13C (F2,75 = 6.43, p < 0.003) and δ15N (F2,75 = 3.41, p < 0.05). Juveniles were characterised by the highest average δ13C, significantly exceeding that of adults (HSD, p < 0.005), but no differences in age groups were noted according to δ15N value (Figure S1a). Age-based differences in the other habitats were not significant (mowed meadows, T2 = 0.11, p = 0.48; non-mowed meadows T2 = 0.15, p = 0.64).
The influence of the animal gender was not significant in any of the habitats: apple orchards (T2 = 0.02, p = 0.47), mowed meadows (T2 = 0.04, p = 0.54) and non-mowed meadows (T2 = 0.07, p = 0.52).

3.4. Relationship between Bank Vole Breeding Status, Body Mass, Body Condition Index and Their Isotopic Ratios

In C. glareolus, we did not find a significant influence of reproductive status on the δ13C and δ15N values in the hair (F6,37 = 1.28, p = 0.29 and F6,37 = 0.51, p = 0.80, respectively). Based on HSD, none of the δ13C and δ15N values in the analysed groups of adult males and females differed according to reproductive status. Data on the central positions of the stable isotope ratios in the hair of C. glareolus according to their reproductive status are presented in Table S4.
We did not find regular and explainable correlation patterns between δ13C and δ15N values and body mass or body condition index in C. glareolus. All significant correlations between body mass and δ13C were negative, and none of the correlations with δ15N were significant (Table S5). Scatterplots with distribution of raw values are presented in Figure S2.

4. Discussion

Our main goal was to demonstrate that C. glareolus is an omnivore small mammal species in apple orchards and surrounding habitats. The isotopic niche of C. glareolus was separated from granivores and herbivores according to δ13C in apple orchards, mowed and non-mowed meadows, and according to δ15N in apple orchards and non-mowed meadows, thus confirming first research hypothesis. The average δ15N value in the hair of C. glareolus, being >6‰, clearly indicates diet peculiarities that place them close to carnivores/insectivores [45,46]. The similarity of δ15N values to insectivores allow us to suppose the importance of foods of animal origin to their diet, offering them some advantage in competition with herbivores and granivores when living syntopically. C. glareolus is known to use animal foods and even preferring them when starving and being able to survive on animal resources only [3,21,22,23,24,25]. It is quite possible that foods of animal origin (including small vertebrates and their carcasses is more widely used by C. glareolus as δ15N values in their hair were higher than in any of the dietary items we analysed.
Our second hypothesis was rejected—the 15N values in the hair of C. glareolus were not related to individual body mass (the same as in [30]), body condition index or reproduction patterns. Based on diet/hair TDS, increased amounts of animal-based foods were characteristic of non-adult voles, especially subadults. This finding might be related to the dispersion of the non-adult individuals [47,48], this being challenging to an individual, thereby changing its bioenergetics [49]. The movement of small mammals can be influenced by herbicide treatment [13], which was used in many of the investigated apple orchards [14]. We do not speculate on the influence of possibly scarcer food resources in the orchards due to agricultural treatments. In granivores, body condition decreases in lower quality habitats [50], while the influence of habitat richness on C. glareolus is not known. It has, however, been shown that C. glaeolus may be paradoxically less numerous in richer habitats [1]. We, therefore, interpret the values of TDS between the diet and hair of C. glareolus, exceeding those found in temperate forest [32], only as confirming species omnivory and as showing an increased share of animal food in the diet. Our data confirm seasonal stability of content of nitrogenous substances in the diet, as shown by [30], but are in contrast with [29].
As shown by [27], the diet of an individual is also dependent on individual preferences; niche differentiation in C. glareolus can be influenced by behavioural selection, supporting predatory behaviour. According to [27], predatory behaviour not only induces the consumption of more food items of animal origin, but also results in dietary niche heterogeneity and breath of ecological niche. Therefore, assessments of the diet and the trophic position of species require estimates of TDS values derived from wild animals [51].
We understand that the registered δ13C and δ15N values could be influenced not only by the factors assessed, but also (indirectly) by precipitation and land use, as found by [52] in California vole (Microtus californicus), as well as by the amount of fertilizers used [53], possible spatiotemporal variation [29,30,54], interactions with other species [55,56] and individual preferences [27].
Investigation of the use of apple seeds by C. glareolus could be of interest in the future, as (1) this resource is closest to invertebrates according to isotopic signatures (see Figure 5), and (2) they contain bioactive compounds and oils [57,58] and, therefore, might be preferred by these voles. As for the lichens, in our case they were very low in nitrogen (δ15N = −12.4‰) and high in carbon (δ13C = −25.4‰). Such values correspond to the published data [59] but, as shown by [60], lichens are unlikely to be used by C. glareolus. Consequently, we did not not analyse lichens as a food source.
We found the central positions of the stable isotope ratios in the hair of C. glareolus in the apple orchards to not be fully in line with those found in other investigated habitats in the country [61,62,63]. Both carbon and nitrogen values in the orchards were similar to those in flooded meadows and mowed meadows (Table 3; Figure 3). However, the carbon and nitrogen values in C. glareolus from the forest and non-mowed meadows, and from forests in the colonies of great cormorants (Phalacrocorax carbo), differed significantly from the orchards (HSD, p < 0.001).
Flooded meadows, mowed meadows and apple orchards have additional nitrogen input from floods or fertilizers. The differences in the stable isotope ratios in the hair of C. glareolus from forests in the cormorant colonies are a result of the extremely high enrichment of the basal resources in the colony environment with guano [62]: the δ15N values in the hair of C. glareolus were higher than normally found in carnivores [61].
Interspecific competing for limited resources could be limited if species compete for different foods [64]. The case of C. glareolus (this paper), as well as inter- and intraspecific competition of herbivorous [33] and granivorous [34] small mammals in the orchards confirm such a point of view. Omnivory of C. glareolus might be supported by a significant amount of animal-based foods in the diet, including frogs, bird nestlings and small mammal carcasses when starving, snails, earthworms, grubs, beetles, grasshoppers and other invertebrates [3,22]. Therefore, further studies on the diets of small mammals in agricultural habitats, assessing usage of fungi [65], pulses [66] and effects of mixed diets [67] are worthwhile.
Although we did not find a strong relationships between the diet of C. glareolus and body mass and body condition, the latter two parameters are important in defining the suitability of the habitat. For the wood mouse (Apodemus sylvaticus), a granivorous small mammal, physical condition is determined by two factors—the presence of food and the presence of shelter [68]. Consequently, body mass is one of the main factors defining migration in small mammals, based on risk taking decisions and on details of species-specific biology [69].
Other ecological parameters of C. glareolus in the apple orchards, such as the proportion of the species in the small mammal community and relative abundance, follow patterns already known from the habitats. According to [70], agricultural intensification results in a decrease in small mammal diversity, but might have a positive effect on the population abundance of surviving species. Challenges facing farmland small mammals may be solved by migration, which in the case of C. glareolus extend to an average of 135–240 m, with a maximum of 440–480 m [71]. In our context, this means that the populations of C. glareolus in the apple orchards might be augmented from the nearest habitats. However, as C. glareolus in orchards and commensal habitats are very close to human settlements [19], these aspects might be of importance in hantavirus transmission [72,73].
For C. glareolus, as a forest small mammal species, apple orchards might serve as secondary habitats fulfilling a gap between forest and farmland. Using secondary habitats, such as hedgerows, orchards and shrubby meadows, small mammals might survive successfully even in conditions of intensive agriculture [74,75,76]. In general, orchards provide long-term vegetation cover, therefore they are favourable habitats for small mammals [77]. However, it is presumed that under agricultural activities, the amount/diversity of foods available for small mammals in such habitats is limited, and there are sudden changes in food availability. To survive in such habitats, species must have certain degree of ecological plasticity. Varying degree of omnivory in C. glareolus is one of such traits, enabling species prosperity in the agrolandscape.

5. Conclusions

Isotopic analyses supported the hypothesis of omnivory in C. glareolus in the apple orchards, with the species being separated from granivores and herbivores according to δ13C, while being closest to insectivores according to δ15N. It is possible that the species is using foods with higher δ15N values, such as small vertebrates and their carcasses. In the apple orchards, foods of animal origin are preferred by non-adult individuals of C. glareolus.
The degree of omnivory in C. glareolus in the orchards differed from that in surrounding meadows and forests, indicating ecological plasticity of the species and allowing its inclusion/success in the multi-species small mammal communities.

Supplementary Materials

The following are available online at https://www.mdpi.com/article/10.3390/agriculture12091308/s1, Figure S1: Intraspecific differences of the isotopic niches of C. glareolus in apple orchards, mowed and non-mowed meadows: (a) by gender, (b) by age; Figure S2: Correlation of C. glareolus body mass and body condition index as proxy of individual fitness with δ13C and δ15N values (significant regression line shown in red, 95% CI represented with dotted line) and distribution of the raw values of these parameters: (a) in general, (b) in summer, (c) in autumn, (d) in apple orchards, and (e) in surrounding meadows or forests; Table S1: Trapping effort in 2018–2021 according to apple orchard age, intensity of agriculture, and control habitat type; Table S2: Numbers of small mammals trapped in commercial apple orchards and their control non-orchard habitats (mowed meadows, non-mowed meadows and forests) in 2018–2021, according to dietary groups; Table S3: Changes of relative abundances of C. glareolus (individuals per 100 trap-days) in 2018–2021 irrespective of the habitat; Table S4: Central positions and ranges of stable isotope ratios in the hair of adult C. glareolus males and females according to their reproductive status; Table S5: Pearson correlation coefficients of stable isotope values in the hair of C. glareolus with body mass (Q) and body condition index (BCI) of the individuals. Coefficients shown in bold are significant at p < 0.05.

Author Contributions

Conceptualisation and investigation, L.B. (Linas Balčiauskas), R.S., A.G., V.S. and L.B. (Laima Balčiauskienė); methodology and formal analysis, L.B. (Linas Balčiauskas), R.S. and A.G.; data curation, V.S. and L.B. (Laima Balčiauskienė); resources, A.G.; supervision, project administration, and funding acquisition, L.B. (Linas Balčiauskas) and A.G. All authors have read and agreed to the published version of the manuscript.

Funding

In 2018 and 2019, this research was funded by the Ministry of Agriculture of the Republic of Lithuania, grant number MT-18-3. In 2020 and 2021 research was done under long-term research program of the Nature Research Centre.

Institutional Review Board Statement

The study was conducted in accordance with Lithuanian (the Republic of Lithuania Law on the Welfare and Protection of Animals No. XI-2271, “Requirements for the Housing, Care and Use of Animals for Scientific and Educational Purposes”, approved by Order No B1-866, 31/10/2012 of the Director of the State Food and Veterinary Service (Paragraph 4 of Article 16) and European legislation (Directive 2010/63/EU) on the protection of animals and approved by the Animal Welfare Committee of the Nature Research Centre, protocols No GGT-7 and GGT-8. Snap trapping was justifiable as we also studied reproduction parameters and collected tissues and internal organs for analysis of pathogens, elemental content and stable isotopes (not covered in this publication).

Informed Consent Statement

Not applicable.

Data Availability Statement

This is an ongoing research, therefore data are available from the corresponding author upon request.

Conflicts of Interest

The authors declare no conflict of interest. The funders had no role in the design of the study, nor in the collection, analysis or interpretation of data, or the writing of the manuscript or in the decision to publish the results.

References

  1. Morris, D.W. Paradoxical avoidance of enriched habitats: Have we failed to appreciate omnivores? Ecology 2005, 86, 2568–2577. [Google Scholar] [CrossRef]
  2. Santos, M.J.; Thorne, J.H.; Moritz, C. Synchronicity in elevation range shifts among small mammals and vegetation over the last century is stronger for omnivores. Ecography 2014, 38, 556–568. [Google Scholar] [CrossRef]
  3. Landry, S.O. The Rodentia as Omnivores. Q. Rev. Biol. 1970, 45, 351–372. [Google Scholar] [CrossRef] [PubMed]
  4. Schieck, J.O.; Millar, J.S. Alimentary tract measurements as indicators of diets of small mammals. Mammalia 1985, 49, 93–104. [Google Scholar] [CrossRef]
  5. Braithwaite, R.W.; Cockburn, A.; Lee, A.K. Resource partitioning by small mammals in lowland heath communities of south-eastern Australia. Austral Ecol. 1978, 3, 423–445. [Google Scholar] [CrossRef]
  6. Kelt, D.A.; Brown, J.H.; Heske, E.J.; Marquet, P.A.; Morton, S.R.; Reid, J.R.; Rogovin, K.A.; Shenbrot, G. Community structure of desert small mammals: Comparisons across four continents. Ecology 1996, 77, 746–761. [Google Scholar] [CrossRef]
  7. Campos, C.; Ojeda, R.; Monge, S.; Dacar, M. Utilization of food resources by small and medium-sized mammals in the Monte Desert biome, Argentina. Austral Ecol. 2001, 26, 142–149. [Google Scholar] [CrossRef]
  8. Fox, B.J. Review of small mammal trophic structure in drylands: Resource availability, use, and disturbance. J. Mammal. 2011, 92, 1179–1192. [Google Scholar] [CrossRef]
  9. Shaner, P.J.L.; Wu, S.H.; Ke, L.; Kao, S.J. Trophic niche divergence reduces survival in an omnivorous rodent. Evol. Ecol. Res. 2013, 15, 933–946. [Google Scholar]
  10. Ribeiro, J.F.; Guaraldo, A.; Nardoto, G.B.; Santoro, G.; Vieira, E.M. Habitat type and seasonality influence the isotopic trophic niche of small mammals in a neotropical savanna. Hystrix 2019, 30, 30–38. [Google Scholar] [CrossRef]
  11. Kirkland, G.L. Responses of Small Mammals to the Clearcutting of Northern Appalachian Forests. J. Mammal. 1977, 58, 600–609. [Google Scholar] [CrossRef]
  12. Dolan, J.D.; Rose, R.K. Depauperate small mammal communities in managed pine plantations in eastern Virginia. Va. J. Sci. 2007, 58, 1. [Google Scholar] [CrossRef]
  13. Sullivan, T.P.; Sullivan, D.S. Responses of small-mammal populations to a forest herbicide application in a 20-year-old conifer plantation. J. Appl. Ecol. 1982, 19, 95–106. [Google Scholar] [CrossRef]
  14. Balčiauskas, L.; Balčiauskienė, L.; Stirkė, V. Mow the Grass at the Mouse’s Peril: Diversity of Small Mammals in Commercial Fruit Farms. Animals 2019, 9, 334. [Google Scholar] [CrossRef]
  15. Kryštufek, B.; Tesakov, A.S.; Lebedev, V.S.; Bannikova, A.A.; Abramson, N.I.; Shenbrot, G. Back to the future: The proper name for red-backed voles is Clethrionomys Tilesius and not Myodes Pallas. Mammalia 2020, 84, 214–217. [Google Scholar] [CrossRef]
  16. Hutterer, R.; Kryštufek, B.; Yigit, N.; Mitsainas, G.; Palomo, L.; Henttonen, H.; Vohralík, V.; Zagorodnyuk, I.; Juškaitis, R.; Meinig, H.; et al. Myodes glareolus (Amended Version of 2016 Assessment). The IUCN Red List of Threatened Species 2021: E.T4973A197520967. 2021. Available online: https://www.iucnredlist.org/species/4973/197520967 (accessed on 18 June 2022).
  17. Prūsaitė, J. (Comp.) Fauna of Lithuania. Mammals; Mokslas: Vilnius, Lithuania, 1988; p. 295. [Google Scholar]
  18. Balčiauskas, L.; Trakimas, G.; Juškaitis, R.; Ulevičius, A.; Balčiauskienė, L. Atlas of Lithuanian Mammals, Amphibians and Reptiles, 2nd ed.; Akstis: Vilnius, Lithuania, 1999; p. 112. [Google Scholar]
  19. Balčiauskas, L.; Balčiauskienė, L.; Garbaras, A.; Stirkė, V. Diversity and Diet Differences of Small Mammals in Commensal Habitats. Diversity 2021, 13, 346. [Google Scholar] [CrossRef]
  20. Suchomel, J.; Šipoš, J.; Ouředníčková, J.; Skalský, M.; Heroldová, M. Bark Gnawing by Rodents in Orchards during the Growing Season—Can We Detect Relation with Forest Damages? Agronomy 2022, 12, 251. [Google Scholar] [CrossRef]
  21. Butet, A.; Delettre, Y.R. Diet differentiation between European arvicoline and murine rodents. Acta Theriol. 2011, 56, 297–304. [Google Scholar] [CrossRef]
  22. Wrangel, H. Beitrage zur Biologie der Rötelmaus (Clethrionomys glareolus Schr.). Z. Saügetierk. 1940, 14, 52–93. [Google Scholar]
  23. Miller, R.S. Food habits of the woodmouse and the bank vole in Wytham Woods, Berks. Siiugetierk. Mitt. 1954, 2, 109–113. [Google Scholar]
  24. Abt, K.F.; Bock, W.F. Seasonal variations of diet composition in farmland field mice Apodemus spp. and bank voles Clethrionomys glareolus. Acta Theriol. 1998, 43, 379–389. [Google Scholar] [CrossRef]
  25. Martiniaková, M.; Omelka, R.; Stawarz, R.; Formicki, G. Accumulation of Lead, Cadmium, Nickel, Iron, Copper, and Zinc in Bones of Small Mammals from Polluted Areas in Slovakia. Pol. J. Environ. Stud. 2012, 21, 153–158. [Google Scholar]
  26. Watts, C.H. The foods eaten by wood mice (Apodemus sylvaticus) and bank voles (Clethrionomys glareolus) in Wytham Woods, Berkshire. J. Anim. Ecol. 1968, 37, 25–41. [Google Scholar] [CrossRef]
  27. Hämäläinen, A.; Kiljunen, M.; Koskela, E.; Koteja, P.; Mappes, T.; Rajala, M.; Tiainen, K. Artificial selection for predatory behaviour results in dietary niche differentiation in an omnivorous mammal. Proc. R. Soc. B 2022, 289, 20212510. [Google Scholar] [CrossRef] [PubMed]
  28. Escalante, M.A.; Horníková, M.; Marková, S.; Kotlík, P. Niche differentiation in a postglacial colonizer, the bank vole Clethrionomys glareolus. Ecol. Evol. 2021, 11, 8054–8070. [Google Scholar] [CrossRef] [PubMed]
  29. Čepelka, L.; Heroldová, M.; Jánová, E.; Suchomel, J. The Dynamics of Nitrogenous Substances in Rodent Diet in a Forest Environment. Mammalia 2014, 78, 327–333. [Google Scholar] [CrossRef]
  30. Palo, R.T.; Olsson, G.E. Nitrogen and Carbon Concentrations in the Stomach Content of Bank Voles (Myodes glareolus). Does Food Quality Determine Abundance? Open Ecol. J. 2009, 2, 86–90. [Google Scholar] [CrossRef]
  31. Hughes, K.L.; Whiteman, J.P.; Newsome, S.D. The relationship between dietary protein content, body condition, and Δ15N in a mammalian omnivore. Oecologia 2018, 186, 357–367. [Google Scholar] [CrossRef]
  32. Chibowski, P.; Brzeziński, M.; Suska-Malawska, M.; Zub, K. Diet/hair and diet/faeces trophic discrimination factors for stable carbon and nitrogen isotopes, and hair regrowth in the yellow-necked mouse and bank vole. Annales Zoologici Fennici 2022, 59, 171–185. [Google Scholar] [CrossRef]
  33. Balčiauskas, L.; Skipitytė, R.; Garbaras, A.; Stirkė, V.; Balčiauskienė, L.; Remeikis, V. Stable Isotopes Reveal the Dominant Species to Have the Widest Trophic Niche of Three Syntopic Microtus Voles. Animals 2021, 11, 1814. [Google Scholar] [CrossRef]
  34. Balčiauskas, L.; Skipitytė, R.; Garbaras, A.; Stirkė, V.; Balčiauskienė, L.; Remeikis, V. Isotopic Niche of Syntopic Granivores in Commercial Orchards and Meadows. Animals 2021, 11, 2375. [Google Scholar] [CrossRef] [PubMed]
  35. Stirkė, V.; Balčiauskas, L.; Balčiauskienė, L. Common vole as a focal small mammal species in orchards of the Northern Zone. Diversity 2021, 13, 134. [Google Scholar] [CrossRef]
  36. Balčiauskas, L. Methods of Investigation of Terrestrial Ecosystems; Part I. Animal Surveys; VU Leidykla: Vilnius, Lithuania, 2004; p. 183. [Google Scholar]
  37. Balčiauskas, L.; Balčiauskienė, L.; Janonytė, A. Reproduction of the root vole (Microtus oeconomus) at the edge of its distribution range. Turk. J. Zool. 2012, 36, 668–675. [Google Scholar] [CrossRef]
  38. Moors, P.J. Norway rats (Rattus norvegicus) on the Noises and Motukawao islands, Hauraki Gulf, New Zealand. N. Z. J. Ecol. 1985, 8, 37–54. [Google Scholar]
  39. Sibly, R.M.; Brown, J.H. Effects of body size and lifestyle on evolution of mammal life histories. Proc. Natl. Acad. Sci. USA 2007, 104, 17707–17712. [Google Scholar] [CrossRef] [PubMed] [Green Version]
  40. Stirkė, V.; Balčiauskas, L.; Balčiauskienė, L. Spatiotemporal Variation of Small Mammal Communities in Commercial Orchards across the Small Country. Agriculture 2022, 12, 632. [Google Scholar] [CrossRef]
  41. Brown, L.D.; Cat, T.T.; DasGupta, A. Interval Estimation for a proportion. Stat. Sci. 2001, 16, 101–133. [Google Scholar] [CrossRef]
  42. Dean, A.G.; Sullivan, K.M.; Soe, M.M. OpenEpi: Open Source Epidemiologic Statistics for Public Health. Available online: http://OpenEpi.com (accessed on 19 January 2021).
  43. G-Test Calculator. Available online: https://elem.com/~btilly/effective-ab-testing/g-test-calculator.html (accessed on 10 April 2022).
  44. Hola, M.; Ježek, M.; Kušta, T.; Košatová, M. Trophic discrimination factors of stable carbon and nitrogen isotopes in hair of corn fed wild boar. PLoS ONE 2015, 10, e0125042. [Google Scholar] [CrossRef]
  45. Ben-David, M.; Flaherty, E.A. Stable isotopes in mammalian research: A beginner’s guide. J. Mammal. 2012, 93, 312–328. [Google Scholar] [CrossRef]
  46. Lynggaard, C.; Woolsey, I.D.; Al-Sabi, M.N.S.; Bertram, N.; Jensen, P.M. Parasites in Myodes glareolus and their association with diet assessed by stable isotope analysis. Int. J. Parasitol. Parasites Wildl. 2018, 7, 180–186. [Google Scholar] [CrossRef]
  47. Mazurkiewicz, M.; Rajska, E. Dispersion of young bank voles from their place of birth. Acta Theriol. 1975, 20, 71–81. [Google Scholar] [CrossRef]
  48. Gliwicz, J.; Ims, R.A. Dispersal in the bank vole. Pol. J. Ecol. 2000, 48, 51–61. [Google Scholar]
  49. Boratyński, Z.; Szyrmer, M.; Koteja, P. The metabolic performance predicts home range size of bank voles: A support for the behavioral–bioenergetics theory. Oecologia 2020, 193, 547–556. [Google Scholar] [CrossRef] [PubMed]
  50. Navarro-Castilla, Á.; Barja, I. Stressful living in lower-quality habitats? Body mass, feeding behavior and physiological stress levels in wild wood mouse populations. Integr. Zool. 2019, 14, 114–126. [Google Scholar] [CrossRef]
  51. Stephens, R.B.; Ouimette, A.P.; Hobbie, E.A.; Rowe, R.J. Reevaluating trophic discrimination factors (Δδ13C and Δδ15N) for diet reconstruction. Ecol. Monogr. 2022, e1525. [Google Scholar] [CrossRef]
  52. Crumsey, J.M.; Searle, J.B.; Sparks, J.P. Isotope values of California vole (Microtus californicus) hair relate to historical drought and land use patterns in California, USA. Oecologia 2019, 190, 769–781. [Google Scholar] [CrossRef]
  53. Lu, C.; Tian, H. Global nitrogen and phosphorus fertilizer use for agriculture production in the past half century: Shifted hot spots and nutrient imbalance. Earth Syst. Sci. Data 2017, 9, 181–192. [Google Scholar] [CrossRef]
  54. Ecke, F.; Benskin, J.P.; Berglund, Å.M.; de Wit, C.A.; Engström, E.; Plassmann, M.M.; Rodushkin, I.; Sörlin, D.; Hörnfeldt, B. Spatio-temporal variation of metals and organic contaminants in bank voles (Myodes glareolus). Sci. Total Environ. 2020, 713, 136353. [Google Scholar] [CrossRef]
  55. Schirmer, A.; Hoffmann, J.; Eccard, J.A.; Dammhahn, M. My niche: Individual spatial niche specialization affects within-and between-species interactions. Proc. Royal Soc. B 2020, 287, 20192211. [Google Scholar] [CrossRef]
  56. Nunes, S.F.; Mota-Ferreira, M.; Sampaio, M.; Andrade, J.; Oliveira, N.; Rebelo, R.; Rocha, R. Trophic niche changes associated with the eradication of invasive mammals in an insular lizard: An assessment using isotopes. Curr. Zool. 2022, 68, 211–219. [Google Scholar] [CrossRef]
  57. Yu, X.; Van De Voort, F.R.; Li, Z.; Yue, T. Proximate composition of the apple seed and characterization of its oil. Int. J. Food Eng. 2007, 3. [Google Scholar] [CrossRef]
  58. Fidelis, M.; de Moura, C.; Kabbas Junior, T.; Pap, N.; Mattila, P.; Mäkinen, S.; Putnik, P.; Kovačević, D.B.; Tian, Y.; Yang, B.; et al. Fruit seeds as sources of bioactive compounds: Sustainable production of high value-added ingredients from by-products within circular economy. Molecules 2019, 24, 3854. [Google Scholar] [CrossRef] [PubMed]
  59. Beck, A.; Mayr, C. Nitrogen and carbon isotope variability in the green-algal lichen X anthoria parietina and their implications on mycobiont–photobiont interactions. Ecol. Evol. 2012, 2, 3132–3144. [Google Scholar] [CrossRef] [PubMed]
  60. Nybakken, L.; Helmersen, A.M.; Gauslaa, Y.; Selås, V. Lichen compounds restrain lichen feeding by bank voles (Myodes glareolus). J. Chem. Ecol. 2010, 36, 298–304. [Google Scholar] [CrossRef]
  61. Balčiauskas, L.; Skipitytė, R.; Jasiulionis, M.; Trakimas, G.; Balčiauskienė, L.; Remeikis, V. The impact of Great Cormorants on biogenic pollution of land ecosystems: Stable isotope signatures in small mammals. Sci. Total Environ. 2016, 565, 376–383. [Google Scholar] [CrossRef]
  62. Balčiauskas, L.; Skipitytė, R.; Jasiulionis, M.; Balčiauskienė, L.; Remeikis, V. Immediate increase in isotopic enrichment in small mammals following the expansion of a great cormorant colony. Biogeosciences 2018, 15, 3883–3891. [Google Scholar] [CrossRef] [Green Version]
  63. Balčiauskas, L.; Skipitytė, R.; Balčiauskienė, L.; Jasiulionis, M. Resource partitioning confirmed by isotopic signatures allows small mammals to share seasonally flooded meadows. Ecol. Evol. 2019, 9, 5479–5489. [Google Scholar] [CrossRef]
  64. Casula, P.; Luiselli, L.; Amori, G. Which population density affects home ranges of co-occurring rodents? Basic Appl. Ecol. 2019, 34, 46–54. [Google Scholar] [CrossRef]
  65. Hobbie, E.A.; Shamhart, J.; Sheriff, M.; Ouimette, A.P.; Trappe, M.; Schuur, E.A.G.; Hobbie, J.E.; Boonstra, R.; Barnes, B.M. Stable isotopes and radiocarbon assess variable importance of plants and fungi in diets of arctic ground squirrels. Arctic Antarct. Alp. Res. 2017, 49, 487–500. [Google Scholar] [CrossRef]
  66. Selva, N.; Hobson, K.A.; Cortés-Avizanda, A.; Zalewski, A.; Donázar, J.A. Mast pulses shape trophic interactions between fluctuating rodent populations in a primeval forest. PLoS ONE 2012, 7, e51267. [Google Scholar] [CrossRef]
  67. Swan, G.J.; Bearhop, S.; Redpath, S.M.; Silk, M.J.; Goodwin, C.E.; Inger, R.; McDonald, R.A. Evaluating Bayesian stable isotope mixing models of wild animal diet and the effects of trophic discrimination factors and informative priors. Methods Ecol. Evol. 2020, 11, 139–149. [Google Scholar] [CrossRef]
  68. Fragoso, R.; Santos-Reis, M.; Rosalino, L.M. Drivers of wood mouse body condition in Mediterranean agroforestry landscapes. Eur. J. Wildl. Res. 2020, 66, 13. [Google Scholar] [CrossRef]
  69. Bednarz, P.A.; Zwolak, R. Body mass and sex, but not breeding condition and season, influence open-field exploration in the yellow-necked mouse. Ecol. Evol. 2022, 12, e8771. [Google Scholar] [CrossRef] [PubMed]
  70. Gentili, S.; Sigura, M.; Bonesi, L. Decreased small mammals species diversity and increased population abundance along a gradient of agricultural intensification. Hystrix 2014, 25, 39–44. [Google Scholar] [CrossRef]
  71. Kozakiewicz, M.; Kozakiewicz, A.; Łukowski, A.; Gortat, T. Use of space by bank voles (Clethrionomys glareolus) in a Polish farm landscape. Landsc. Ecol. 1993, 8, 19–24. [Google Scholar] [CrossRef]
  72. Imholt, C.; Reil, D.; Eccard, J.A.; Jacob, D.; Hempelmann, N.; Jacob, J. Quantifying the past and future impact of climate on outbreak patterns of bank voles (Myodes glareolus). Pest Manag. Sci. 2015, 71, 166–172. [Google Scholar] [CrossRef] [PubMed]
  73. Jeske, K.; Schulz, J.; Tekemen, D.; Balčiauskas, L.; Balčiauskienė, L.; Hiltbrunner, M.; Drewes, S.; Mayer-Scholl, A.; Heckel, G.; Ulrich, R.G. Cocirculation of Leptospira spp. and multiple orthohantaviruses in rodents, Lithuania, Northern Europe. Transbound. Emerg. Dis. 2022. [Google Scholar] [CrossRef]
  74. Fitzgibbon, C.D. Small mammals in farm woodlands: The effects of habitat, isolation and surrounding land-use patterns. J. Appl. Ecol. 1997, 34, 530–539. [Google Scholar] [CrossRef]
  75. Gelling, M.; Macdonald, D.W.; Mathews, F. Are hedgerows the route to increased farmland small mammal density? Use of hedgerows in British pastoral habitats. Landsc. Ecol. 2007, 22, 1019–1032. [Google Scholar] [CrossRef]
  76. Michel, N.; Burel, F.; Legendre, P.; Butet, A. Role of habitat and landscape in structuring small mammal assemblages in hedgerow networks of contrasted farming landscapes in Brittany, France. Landsc. Ecol. 2007, 22, 1241–1253. [Google Scholar] [CrossRef]
  77. Janova, E.; Heroldova, M. Response of small mammals to variable agricultural landscapes in central Europe. Mamm. Biol. 2016, 81, 488–493. [Google Scholar] [CrossRef]
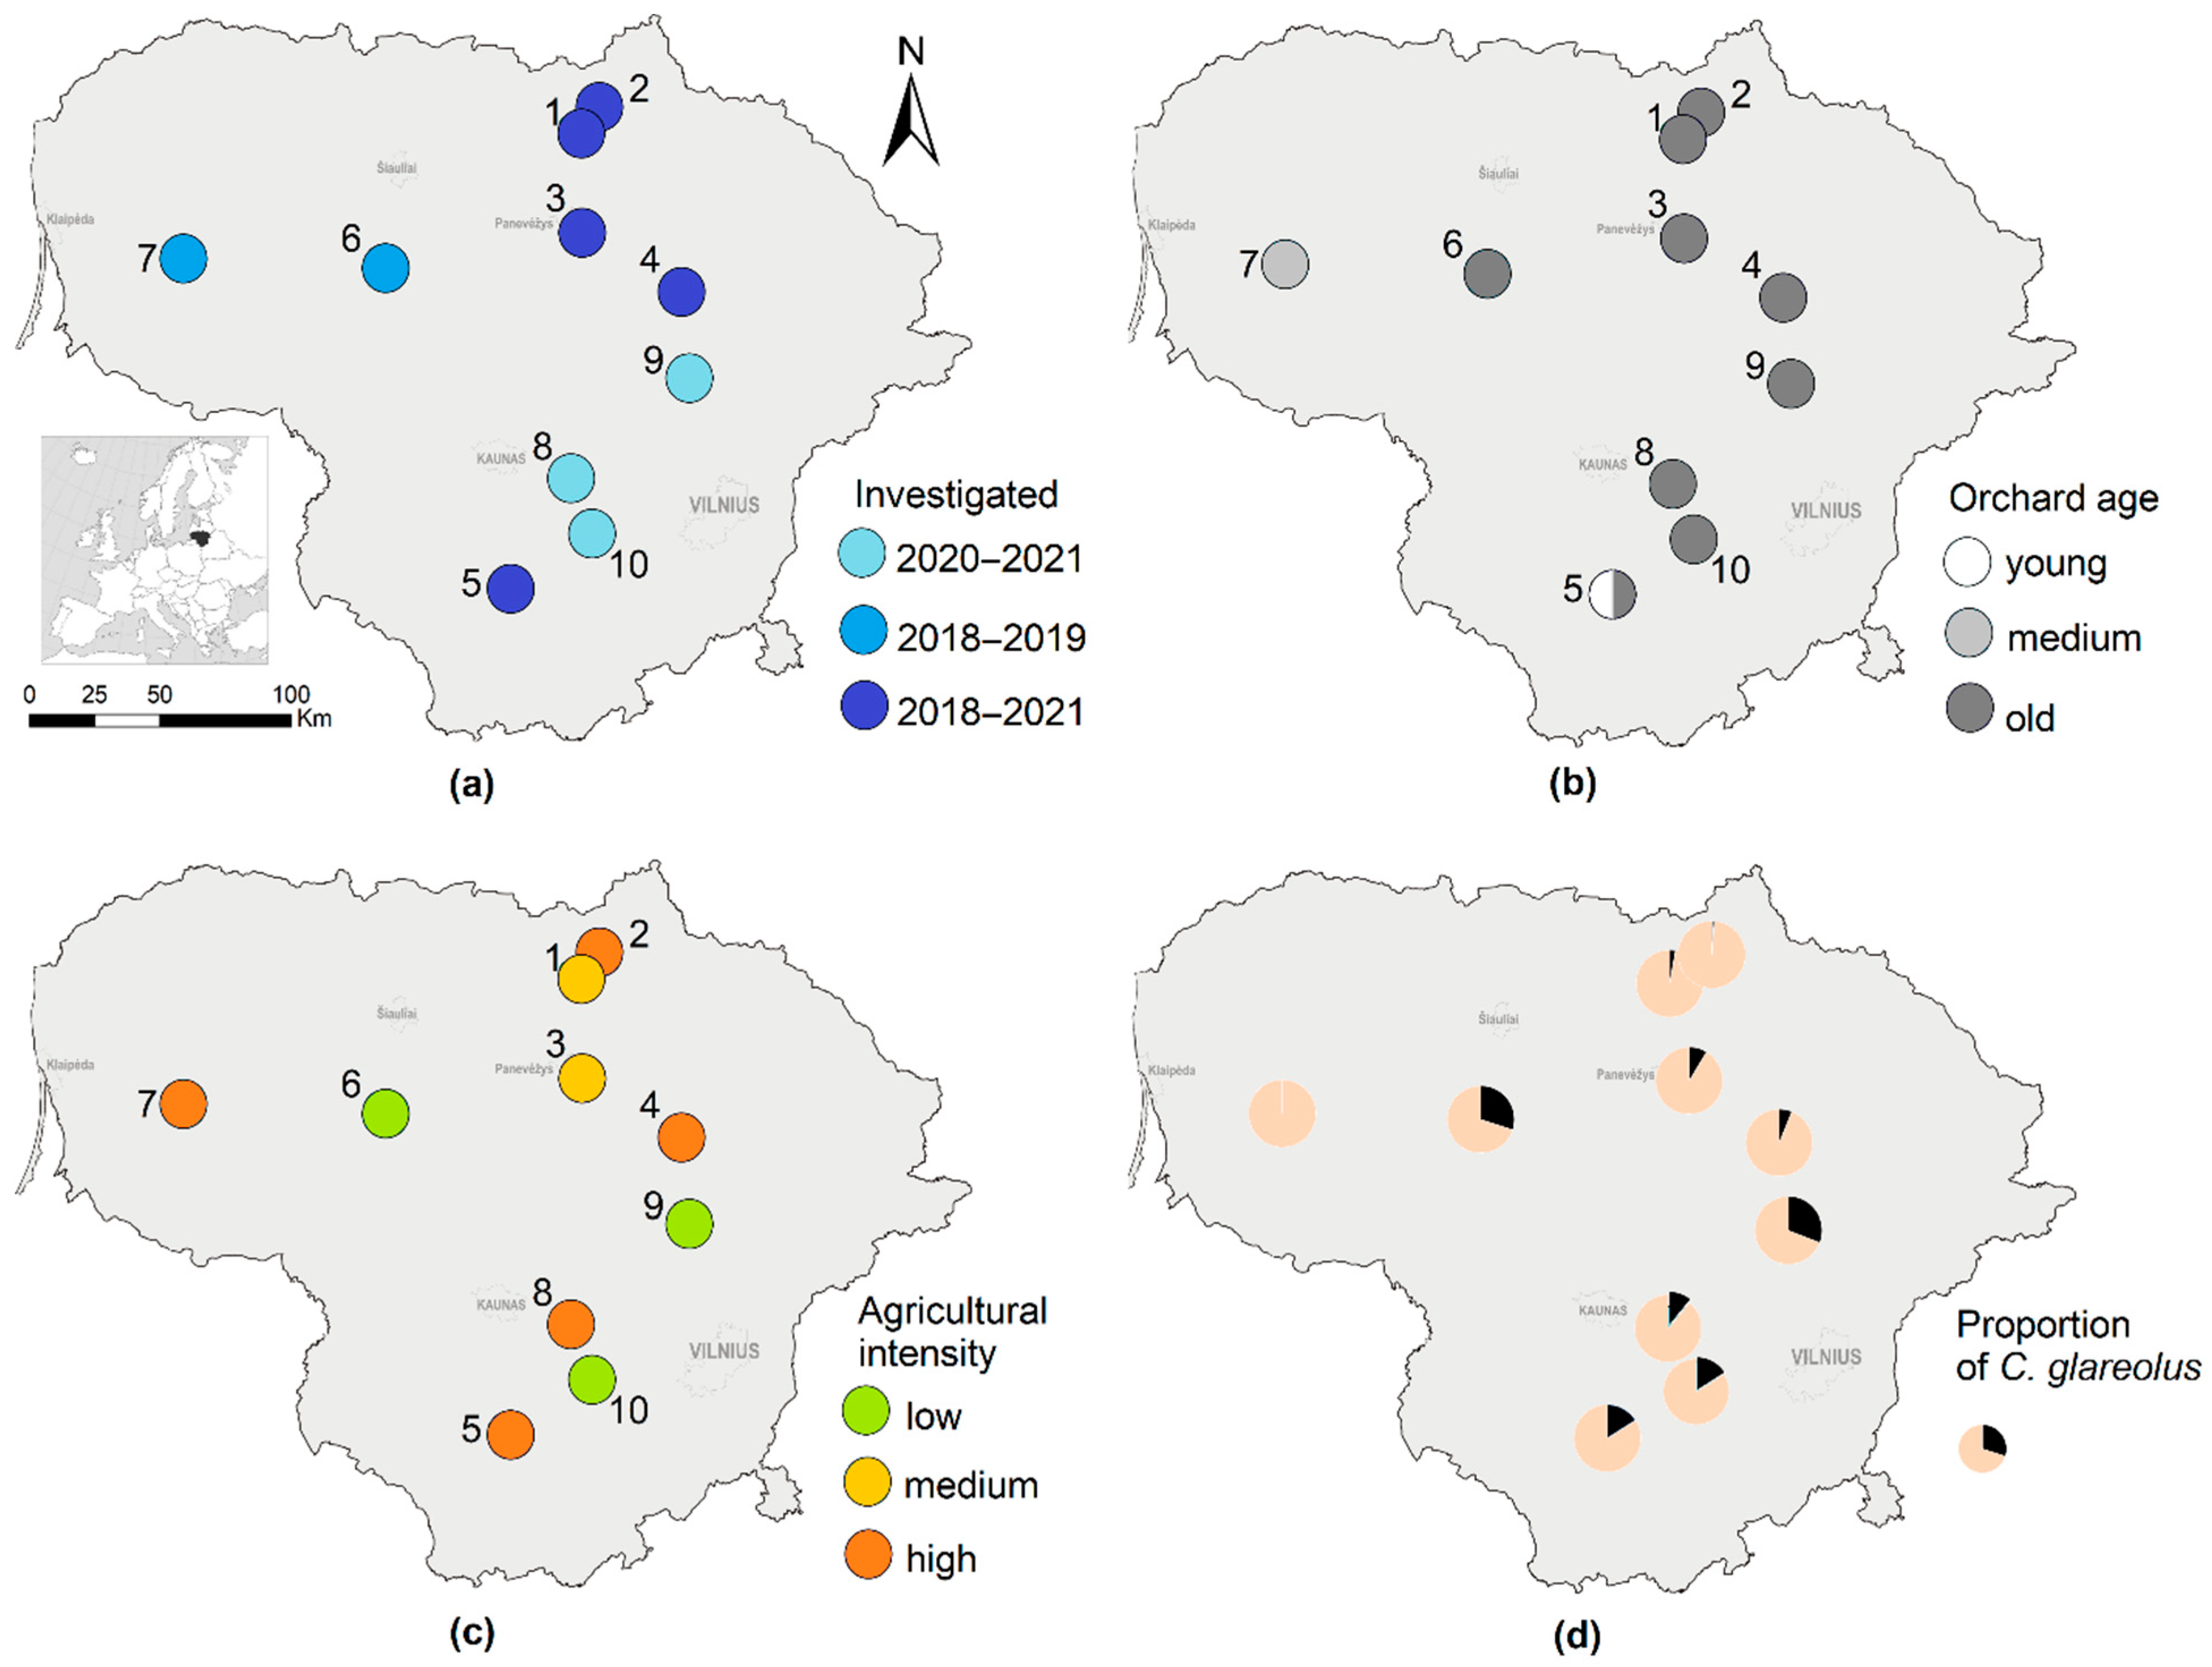
Figure 1. Investigated apple orchards in Lithuania, 2018–2021: (a)—position of study sites with length of the study indicated; (b)—age of orchard; (c)—intensity of agricultural measures; (d)—proportion of C. glareolus in all trapped small mammals.
Agriculture 12 01308 g001
Figure 2. Proportion of C. glareolus in all trapped small mammals according to habitat (95% CI represented by error bars).
Agriculture 12 01308 g002
Figure 3. Position of C. glareolus and species of the other trophic groups according to stable isotope ratios: (a) in the apple orchards; (b) in mowed meadows; (c) in non-mowed meadows; and (d) in forests. Due to insignificant variation, SE is not visible for some groups. Sample size of herbivores and granivores in the forests was not sufficient.
Agriculture 12 01308 g003
Figure 4. Position of C. glareolus according to stable isotope ratios: (a) depending on the intensity of agricultural treatment; (b) in different seasons.
Agriculture 12 01308 g004
Figure 5. Isotopic signatures of potential animal and plant foods compared to the isotopic signatures in the hair of C. glareolus from apple orchards.
Agriculture 12 01308 g005
Table 1. C. glareolus sample sizes used for stable isotope analysis by habitat, age and gender.
HabitatNMalesFemalesAdultsSubadultsJuveniles
Apple orchards784335311433
Mowed meadow361917101313
Unmowed meadow2211112416
Forest523113
Table 2. Isotopic signatures of basal resources (invertebrates and plants, lichens not included) in the apple orchards.
Resourcesnδ13C, ‰ ± SEδ13C, ‰ Min–Maxδ15N, ‰ ± SEδ15N, ‰ Min–Max
Invertebrates10−28.09 ± 0.27−29.41–−26.773.10 ± 0.570.75–6.44
Plants50−28.69 ± 0.24−31.63–−24.950.76 ± 0.41−12.41–5.38
Table 3. Central positions and ranges of stable isotope values in the hair of C. glareolus in various habitats of Lithuania. Great cormorant colonies 1, 2 and 3 are characterised with increasing numbers of breeding bird pairs, therefore, higher input of guano. Significance of differences from apple orchards: *—p< 0.01, **—p < 0.001.
HabitatReferenceδ13C Values, ‰δ15N Values, ‰
Mean ± SEMin–MaxMean ± SEMin–Max
Apple orchardsThis paper−26.11 ± 0.11−28.28–−25.226.55 ± 0.163.03–11.30
Forest[63]−27.91 ± 0.17 **−29.14–−27.915.18 ± 0.23 **3.32–7.96
Flooded meadow[63]−26.22 ± 0.14−27.53–−25.466.38 ± 0.254.77–8.21
Forest (colony 1)[61]−26.73 ± 0.12 *−28.51–−24.938.91 ± 0.55 **3.12–15.80
Forest (colony 2)[61]−24.78 ± 0.17 **−26.15–−23.1212.42 ± 0.88 **5.04–19.24
Forest (colony 3)[61]−25.72 ± 0.17−28.88–−24.2817.20 ± 0.56 **5.79–20.55
Publisher’s Note: MDPI stays neutral with regard to jurisdictional claims in published maps and institutional affiliations.