Abstract
Soil moisture is not only an essential component of the water cycle in terrestrial ecosystems but also a major influencing factor of regional climate. In the soil hydrothermal process, soil moisture has a significant regulating effect on surface temperature; it can drive surface temperature change by influencing the soil’s physical properties and the partitioning of the available surface energy. However, limited soil temperature and moisture observations restrict the previous studies of soil hydrothermal processes, and few models focus on estimating the impact of soil moisture on soil temperature. Therefore, based on the experiments conducted in Wuchuan County in 2020, this study proposes a soil water and heat coupling model that includes radiation, evaporation, soil water transport, soil heat conduction and ground temperature coupling modules to simulate the soil temperature and moisture and subsequently estimate the effects of soil moisture. The results show that the model performs well. The Nash–Sutcliffe coefficient (NSE) and the concordance index (C) of the simulated and measured values under each treatment are higher than 0.26 and 0.7, respectively. The RMSE of the simulation results is between 0.0067–0.017 kg kg−1 (soil moisture) and 0.43–1.06 °C (soil temperature), respectively. The simulated values matched well with the actual values. The soil moisture had a noticeable regulatory effect on the soil temperature change, the soil surface temperature would increase by 0.08–0.43 °C for every 1% decrease in soil moisture, and with the increase in soil moisture, the variation of the soil temperature decreased. Due to the changes in the solar radiation, the sensitivity of the soil temperature to the decline in soil moisture was the greatest during June–July and the least in September. Moreover, the contributions of soil moisture changes to temperature increase under various initial conditions are inconsistent, the increase in sunshine hours, initial daily average temperature and decrease in leaf area index (LAI), soil density and soil heat capacity can increase the soil surface temperature. The results are expected to provide insights for exploring the impact mechanism of regional climate change and optimizing the structure of agricultural production.
1. Introduction
As an important factor of the soil hydrothermal process, soil moisture not only drives the change in surface temperature by affecting the distribution of the surface net radiation into the latent and sensible heat flux [1,2], it also affects regional and even global climate through the hydrological cycle between sea–land and land–atmosphere [3]. Therefore, many scholars have paid close attention to the change in temperature caused by soil moisture in the hydrothermal process [4,5,6,7].
Soil moisture can regulate evapotranspiration that alters the temperature and humidity of the atmosphere at lower levels. The decrease in soil moisture can intensify the surface-sensible heat flux and restrict evapotranspiration, resulting in a rapid increase in surface air temperature [8,9]. For example, Kirien et al. [10] observed that there was a negative correlation between soil moisture and the maximum summer monthly temperature in Europe. Moreover, some studies have pointed out that soil moisture plays an important role in heatwave generation [4,11,12].
The global average surface air temperature has been continuously increasing since the mid-1950s [8], while the global average soil moisture has been significantly decreasing [13]. In the context of climate change, meteorological disasters, such as heatwaves and dry hot winds, are more prominent and sensitive to global warming, and have become one of the key and hot issues in climate change research [12]. Record-breaking extreme heat events have recently hit America, Europe, Australia and Asia [14,15,16]. It is possible that extreme heat will last longer, be more intense, and be more frequently experienced on a global scale in the future [17]. These heatwaves seriously threaten human survival, social activities, economic development and industrial and agricultural production. Therefore, exploring the connection between soil moisture and temperature will enable us to estimate and predict evapotranspiration, as well as other heat fluxes, which can lead to better climate predictions [18]. In recent research, many scholars have investigated the impact of soil moisture on surface air temperature and climate change [19,20,21]. However, how soil moisture affects temperature is not yet well understood; therefore, the establishment of soil water and heat coupling model in farmland is of great significance for temperature forecasting and can provide beneficial insights for the development of sustainable agriculture.
The current hydrothermal models are mainly based on the soil–plant–atmosphere continuum (SPAC) theory, which simulates the dynamic changes in soil water or crop growth and yield, and are gradually applied to farmland crop irrigation management. With the expansion of the theoretical research on the SPAC theory, there are many developed models that take into account both soil, crops and atmosphere, including DNDC [22], DSSAT [23], CLM [24], SWAT [25] and CoLM [26]. However, many models have focused on analyzing the impact of climate warming on soil moisture [27,28], while little attention has been paid to the direct link between soil moisture and temperature, the feedback effect of soil moisture changes on climate warming and the impact of increasing agricultural production on soil moisture and even climate change [29].
With the development of water-saving agriculture and global climate change, the contribution of farmland hydrothermal processes to climate change is an important part of soil–atmosphere interaction effects in the scientific research of climate change, and it is also a key factor in the study of sustainable agricultural development. Therefore, the objectives of this study are to (a) establish a soil water and heat coupling model based on the theory of water and heat transportation, (b) predict changes in soil temperature and moisture and (c) provide some insights for exploring the impact mechanism of regional climate change.
2. Materials and Methods
2.1. Study Region and Field Experiments
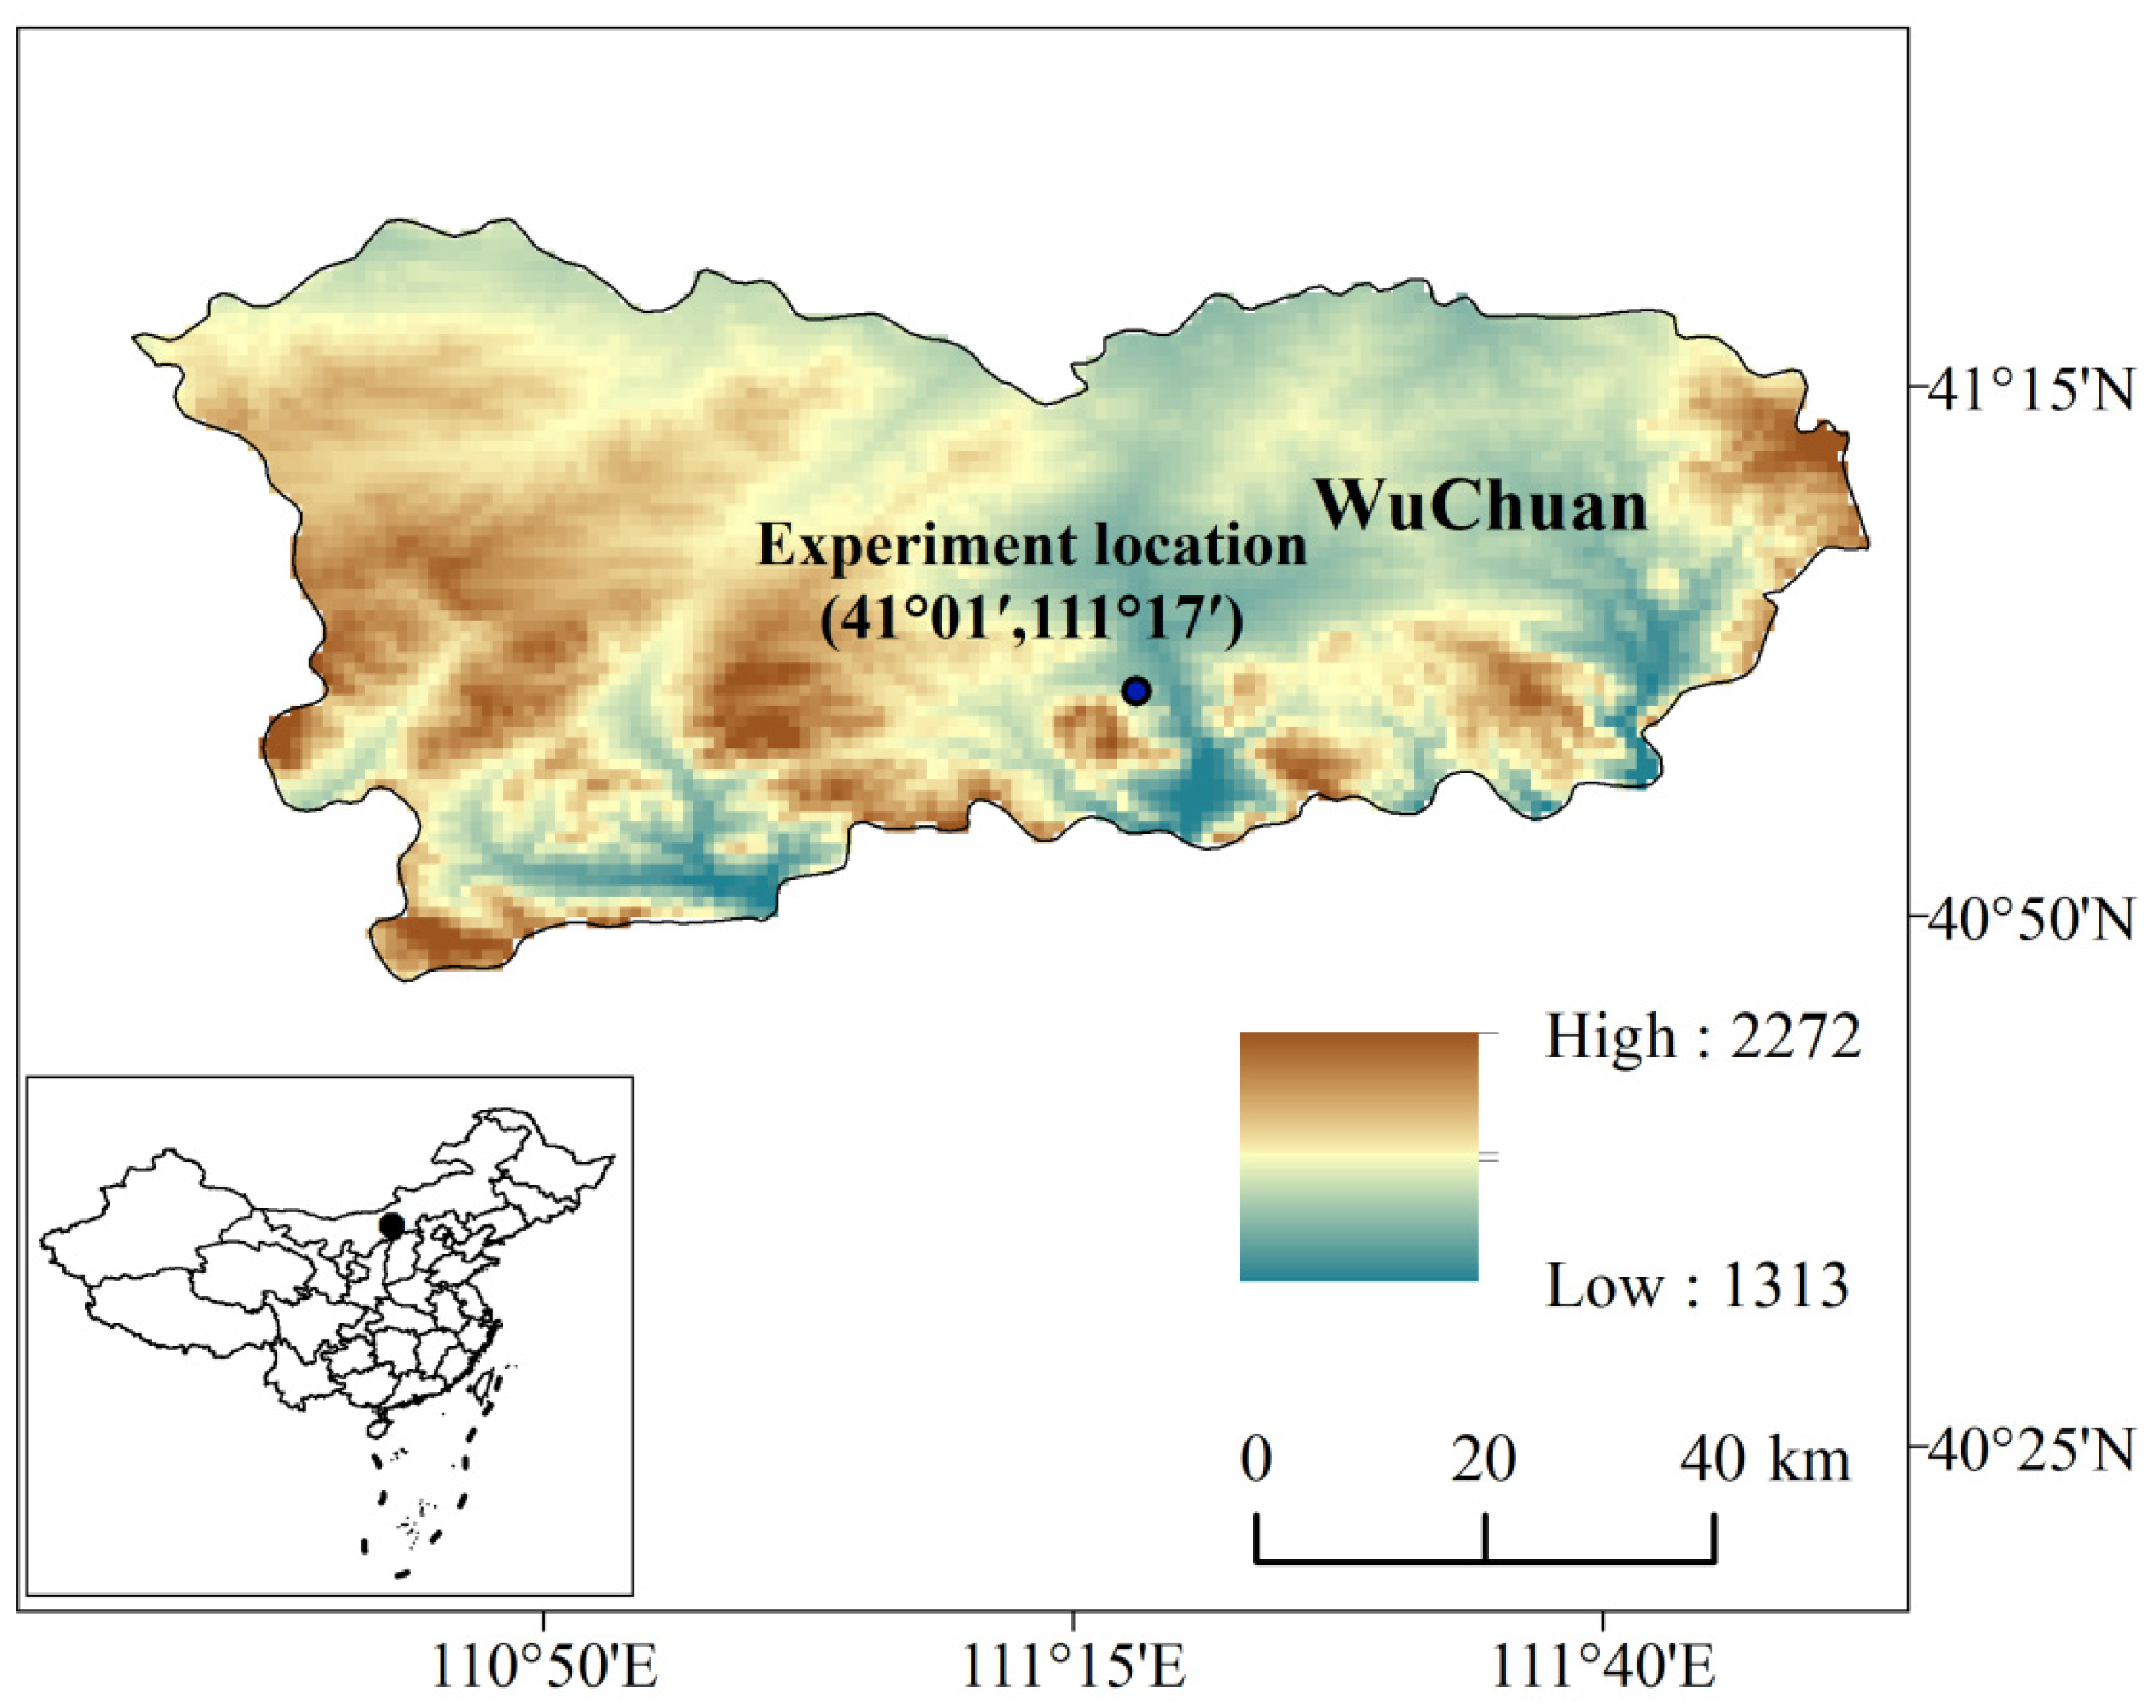
In this paper, all experiments were conducted at the Ecology and Environment Experimental Station in Wuchuan County (40°01′ N, 111°17′ E), Inner Mongolia, China (Figure 1). The altitude varies from 1500 to 2000 m. Wuchuan County has a mid-temperate continental monsoon climate, characterized by abundant sunshine, considerable temperature differences between day and night and between winter and summer, with an average annual temperature of 3.0 °C. The average annual precipitation is 344 mm and the average precipitation during the growing season is 307.1 mm, accounting for 90% of the annual precipitation. The annual wind speed is 4.5 m/s, with the maximum wind speed of 6 m/s in May, and the frost-free period is about 124 days [6]. The soil type is mainly Castanozems with high sediment concentrations in the tillage layer [30]. Rain-fed farming with only one ripening season per year is the dominant farming practice [31], and potato is the main staple crop grown in the region.
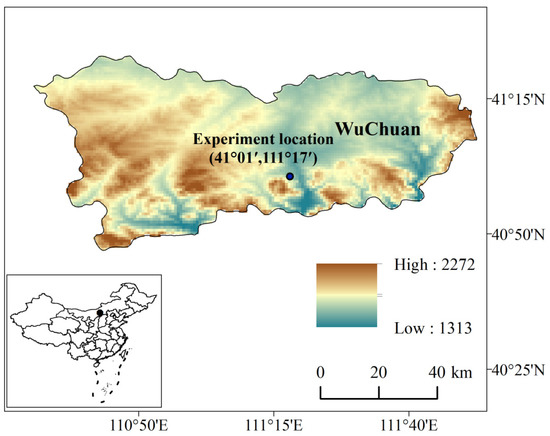
Figure 1.
Study region.
Five plots with different fertilizer treatments (Table 1) were selected to observe the soil temperature and soil moisture during the potato growth period. Each plot covered an area of 30 m2 (7.5 m × 4 m). The potatoes were planted on 1 May and harvested on 15 September at a planting density of 46,500 plants ha−1; all plots were irrigated with 180 mm. The level of fertilization was divided into 5, and the specific fertilization is shown in Table 1.

Table 1.
Fertilizer application.
Soil moisture (volumetric water content) and soil temperature at the depth of 5 cm and surface temperature in five plots were measured. The soil temperature and moisture were measured by Stevens Hydra Probe II and collected by a CR-800 sensor (Campbell Scientific Inc., Logan, America). The probe was positioned at 5 cm. Measurements were obtained every 10 minutes and average data were collected and saved every half hour. The data collection period was from the mid-May to the potato harvest time in early September.
2.2. Model Development
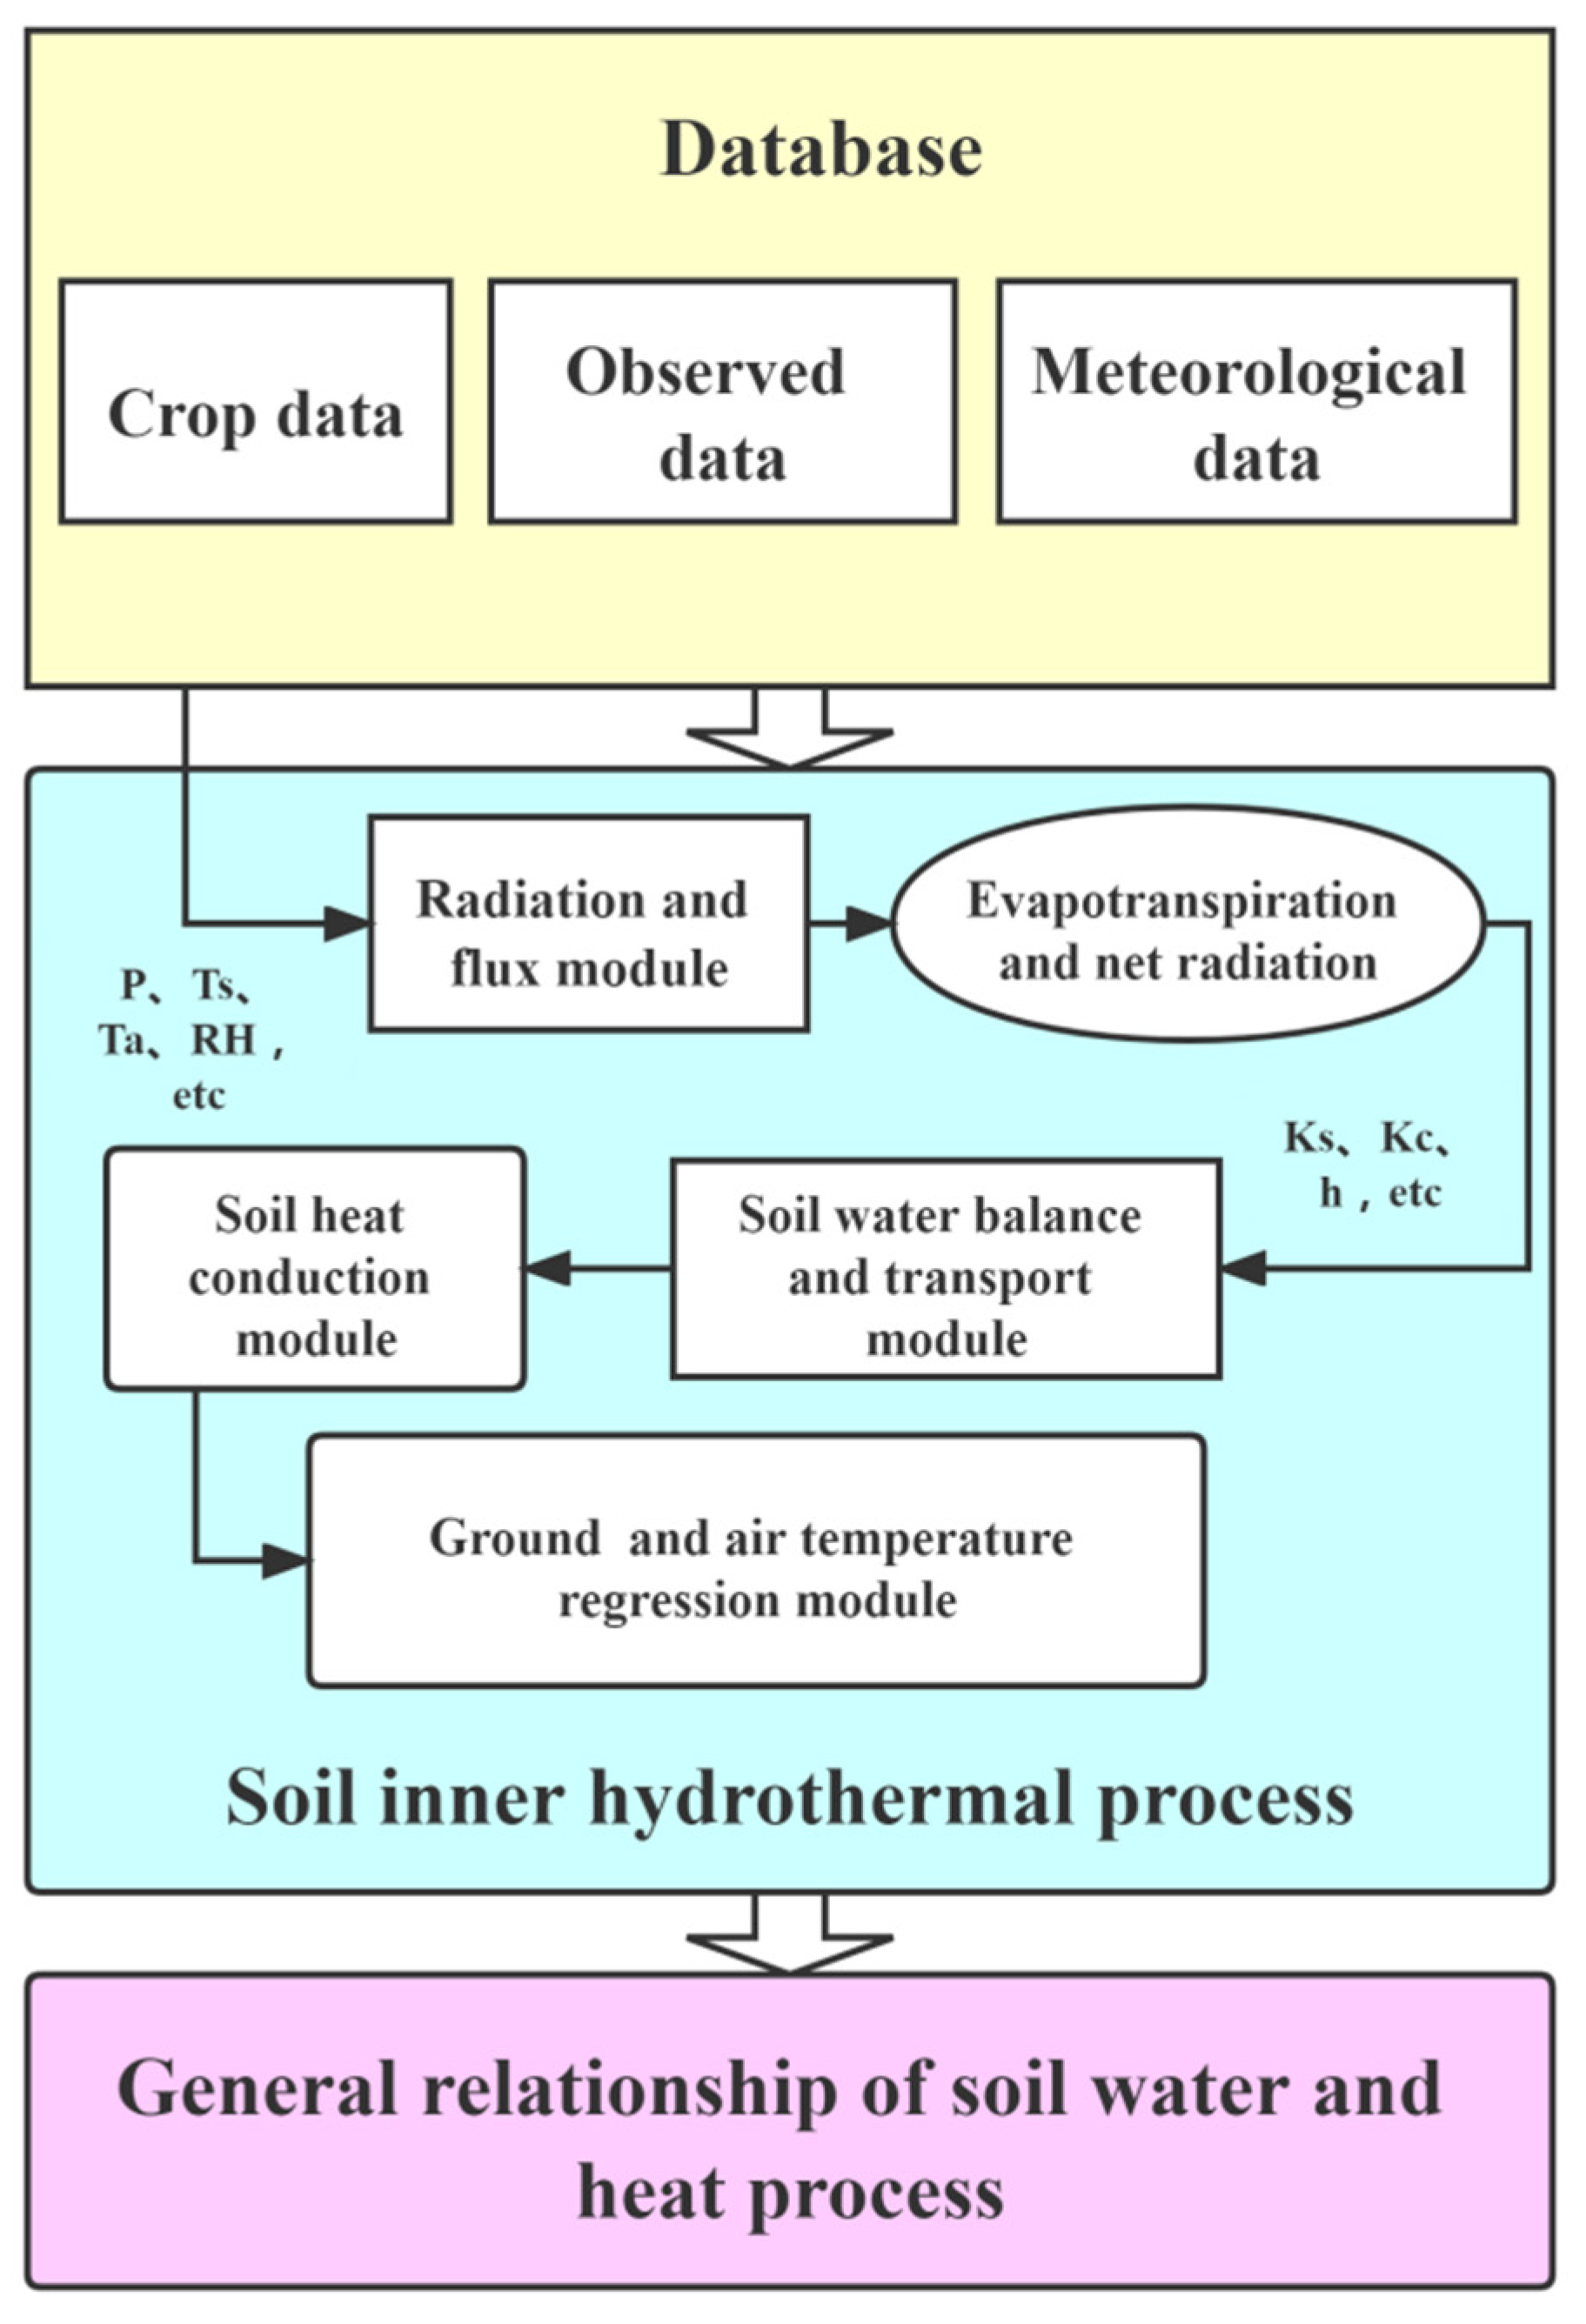
Our intention was to establish a model capable of exploring the coupling effects between soil temperature and moisture, and reveal the role of soil moisture in the interactions of the soil and atmosphere. Here, we described an integrated model of water, crop and soil hydrothermal processes that runs on a daily time step. The model mainly includes radiation, evaporation, soil water transport, soil heat conduction and ground temperature coupling modules. The relationships between the main modules are presented in Figure 2.
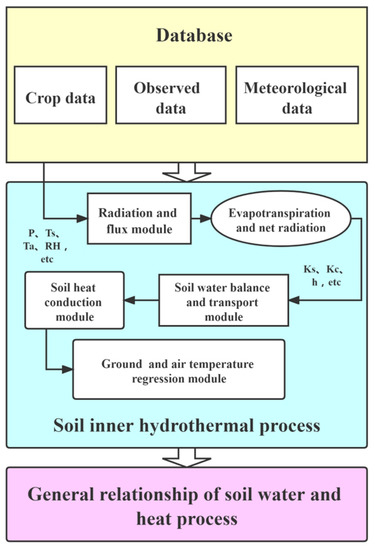
Figure 2.
Process description of soil water and heat coupling model.
P was the precipitation (mm); Ts was the soil surface temperature (°C); Ta was the air temperature at the height of 1.5 m (°C); RH was the air relative humidity (%); Ks was the water stress coefficient; Kc was the crop coefficient; and h was the soil depth (m).
2.2.1. General Relationship Equation of Soil Water and Heat
For soil with a volume of V, when its temperature changes by ΔT, the required heat Q is [32]:
where Cv is the heat capacity of the soil; for any specified soil, Cv changes with the change in soil moisture (J kg−1 K−1). V is the volume of soil (m3). T1 and T2 are the temperature before and after the soil is heated (cooled), respectively; ΔT is the variation in soil temperature change (°C).
Since the heat capacity of air is negligible, the heat capacity of wet soil is [32]:
where Cs is the specific heat capacity of dry soil (J kg−1 K−1); Cw is the specific heat capacity of water (J kg−1 K−1); W is the soil moisture (mass water content) (g g−1); and ρb is the soil bulk density (kg m−3).
The above formulas can be presented as:
Following the complete differentiated of soil moisture and heat, we can obtain:
Therefore, the general relationship of soil water and heat can be written as:
Generally, the heat obtained by the soil is obtained from solar net radiation. After the net radiation reaches the ground, the energy is distributed and transformed in the soil surface [33], which is divided into latent heat (LE), sensible heat (H) and soil heat (G) (MJ m−2 day−1) fluxes. Where Q is the part of the net radiation that heats the soil, that is, the soil heat flux (G), dW is the variation in soil moisture.
Equation (5) is the general relationship equation of the soil water and heat. The calculation of the two key factors dQ (Section 2.2.2) and dW (Section 2.2.3), the soil heat transfer process (Section 2.2.4) and the relationship of soil–air temperature (Section 2.2.5) are described in the following parts of this section.
2.2.2. Radiation and Flux Module
The calculation of the net radiation and evapotranspiration in the model used the Penman–Monteith equation proposed by the United Nations Food and Agriculture Organization of the (FAO) [34].
where Rn is the net radiation (MJ m−2 day−1); Δ is the slope of saturation vapor pressure curve (kPa °C−1); γ is the psychrometric constant (kPa °C−1); es and ea are the saturation and actual vapor pressure (kPa); σ is the Stefan–Boltzmann constant, which is 4.903×10⁻⁹ (MJ K−4 m−2 day−1); Tmax and Tmin are the maximum and minimum thermodynamic temperatures of the day (K); SHa is the actual sunshine hours; SHm is the maximum sunshine hours (h); RA is the extraterrestrial radiation for a daily period (MJ m−2 day−1); RS is the shortwave radiation (MJ m−2 day−1); RSO is the clear-sky solar radiation (MJ m−2 day−1); and H is the local altitude (m). Some of the parameters were calculated as follows:
The actual net radiation received by the ground is dependent on the transmissivity and albedo of each plant species within the canopy layer and the leaf area index of that layer [35]. Transmissivity to direct radiation for each canopy layer was calculated as follows [36]:
Here, Γ is the transmissivity to direct radiation for the canopy layer i, Li,j is the leaf area index and Kj is the extinction coefficient (yielding a value of 0.5, [37,38]).
Hereafter, we supposed that the soil heat flux (G) could be estimated by a linear equation of crop height [39], and its empirical equation is expressed as:
Therefore, dQ is calculated as:
where Gx is the soil heat flux for the day x, MJ/(m2·day); Gx−1 is the soil heat flux for the previous day (MJ m−2 day−1).
2.2.3. Soil Water Balance and Transport Module
Here, we calculated the variations in the soil moisture (W) from the perspective of water balance:
where P is the precipitation; I is the irrigation; M is the anastatic water; N is the condensation water; the above parts are the income items; ETa is the actual evapotranspiration; J is the ground surface runoff; U is the infiltration; B is the crop interception and these five parts are the expenditure items. The above units are mm. Since the M, B and N are small and negligible, Equation (16) can be expressed as:
where Kc is the crop coefficient; Ks is the water stress coefficient. The calculation methods of Kc [40] and Ks [41] are:
where S* is the field capacity; Sw is the wilting coefficient. The calculation method of ground surface runoff (J) is [42,43]:
where Ia is the initial abstraction (including crop interception, infiltration, etc.) (mm); S is a factor related to the storage of watersheds. According to the USDASCS experience, the average value of Ia was chosen as 0.2 S, and CN (curve number) is a comprehensive parameter that reflects the previous rainfall values, land-use methods and soil types.
For the evaporation demand of soil at different depths, the model used the soil water evaporation module in SWAT (soil and water assessment tool), and the maximum evaporation distribution equation at different depths is [25]:
where Esoil,z is the evaporation demand at a depth of z (mm); Es″ is the maximum evaporation (mm) and z is the depth from the ground (mm). The evaporation requirement of each layer is determined by the difference between the evaporation requirements of the upper and lower layers:
where Esoil,ly is the evaporation demand of the ly soil layer (mm); Esoil,zl is the evaporation demand of the lower soil layer (mm); Esoil,zu is the evaporation demand of the upper soil layer (mm); and esco is the soil evaporation compensation coefficient.
2.2.4. Soil Heat Conduction Module
For a certain layer of soil with approximately the same thermal characteristics, the variation curve of its temperature is similar to a sinusoidal wave. Therefore, the variation in soil temperature with time and depth can be simulated by an equation with a sinusoidal function, which can be expressed as [44]:
where T(z,t) is the soil temperature at time t and depth zm (m); A(0) is the amplitude of the surface soil temperature (°C); Ta is the average soil temperature (°C); and D is the damping depth (m). The damping depth is calculated by D = (2 K ω−1)0.5, where K is the thermal diffusivity (m2 s−1) and ω is the period of temperature (s).
Equation (24) shows that the amplitude of soil temperature decreases with the increase in soil depth, and the daily temperature variation at a depth of 3D is only 4% of the surface layer. Therefore, the depth of 3D is usually called the constant temperature layer. We can conclude that after the soil is heated (cooled), the average change (ΔTa) from the surface layer to the constant temperature layer is:
2.2.5. Ground and Air Temperature Regression Module
The relationship between the ground temperature in the model adopted the method of the statistical regression of the multi-year monthly average temperature. The daily average air and surface temperature data obtained from the local meteorological station in the study area were used to establish an empirical equation of the multi-year monthly average surface temperature (Tsx) and air temperature (Tax).
The calculations of the maximum and minimum temperatures are:
Tax is the air temperature of the day x (°C); Tax−1 is the air temperature of the previous day (°C); Tax min is the daily minimum temperature of the air (°C); and Tax max is the daily maximum temperature of the air (°C).
2.3. Model Calibration and Validation
We calibrated empirical coefficients using local meteorological station data (observed by Wuchuan Meteorological Bureau) and field observational data, where the test field and experiments presented in Section 2.1 were not the same field; the two fields were 2.5 km apart. These data contained the following information: maximum temperature (Tmax,K), minimum temperature (Tmin,K), relative humidity (RH), sunshine hours (SHa), precipitation (P), soil surface temperature (Ts) and soil moisture (W). In order to deduce the esco (Equation (23)) values for all the conditions available, the simulations were repeated on each measured day, the esco was optimized to yield the minimum RMS error (step size = 0.1) for the modeled soil moisture [33]. Model input parameters are presented in Table 2. We evaluated the model performance with the RMS error, the Nash–Sutcliffe coefficient NSE [45] and concordance index C [46]. The expressions of the three indices are as follows:
where n is the number of samples, Oi and Si are the observational and simulated values, respectively, and O is the average observational value. The NSE and C value ranged from negative infinity to 1; when the NSE and C values were closer to 1, the better the simulation effects, and the consistency between the simulated and observational values were also better.
Table 2.
Initial parameter values of the model.
3. Results
3.1. Evaluations of the Model Performances
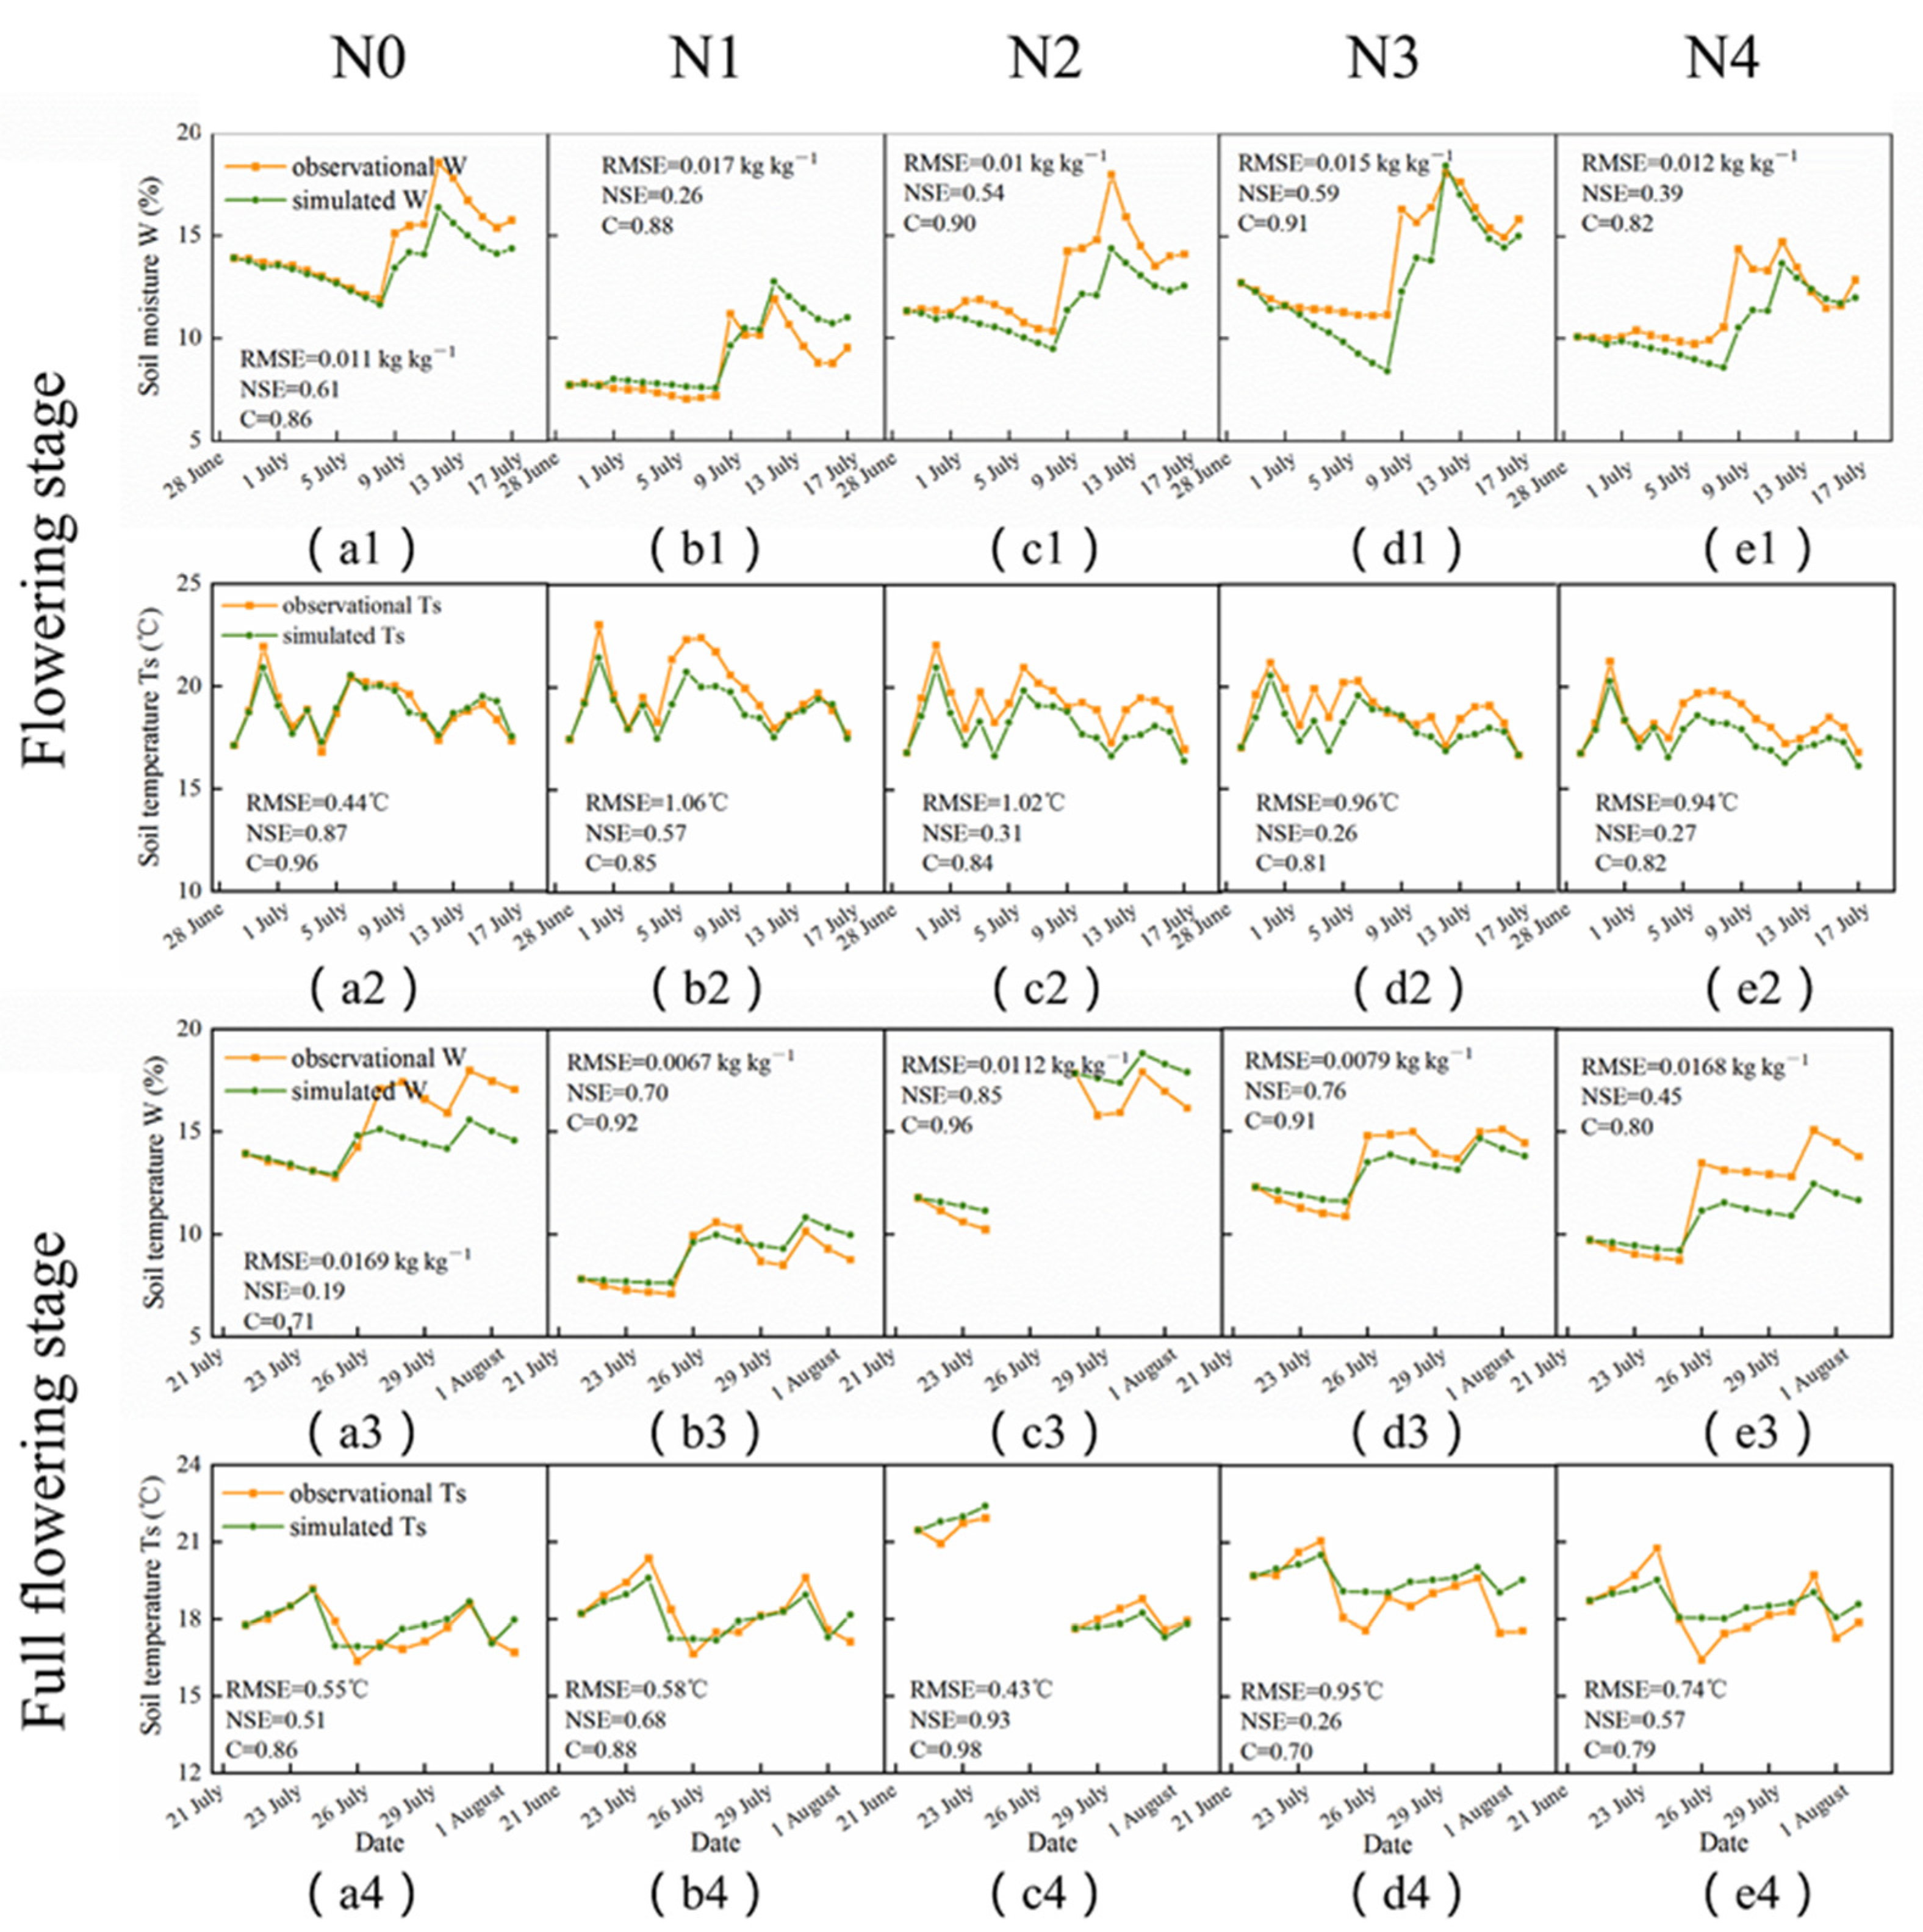
Here, the model was tested through a comparison of simulated values with the observational soil moisture and soil temperature of five different fertilization treatments in Wuchuan County in 2020. Concordance index C, RMS error and NSE of the observational and simulated values were calculated to analyze the simulation effects of the model. The simulation was divided into two periods, corresponding to the flowering stage (28 June–17 July) and full-flowering stage (21 July–2 August) of the local potato growth period.
The comparison results are shown in (Figure 3(a1–e1,a3–e3) soil moisture; Figure 3(a2–e2,a4–e4) soil temperature). Since the treatment of N2 failed to accurately calculate the amount of irrigation due to the failure of the irrigation equipment in late July, the simulation was divided into two stages Figure 3(c3,d3). In general, the model can effectively reflect the variations in soil temperature and moisture, the three statistical indices (RMSE, NSE, C) performed well and the simulated values were in good agreement with the measured values. The NSE and C values of the simulated and measured values under each treatment were higher than 0.26 and 0.7, respectively. The RMSE values of the simulation results were between 0.0067–0.017 kg kg−1 (soil moisture) and 0.43–1.06 °C (soil temperature), respectively. The simulation results of soil moisture for N1 (Figure 3(b3)) and N3 (Figure 3(d3)) were the best, with the lowest RMSE (0.0067 and 0.0074 kg kg−1), highest NSE (0.70 and 0.76) and C (0.92 and 0.91) among all treatments of N0–N4. It also can be observed from Figure 3(a1–e1,a3–e3) that the soil moisture slowly decreased without precipitation and irrigation, and the simulated values were close to the observational values. However, following rainfall, the simulation effects of each treatment would be different due to uneven precipitation distributions. For the soil temperature, it was not only affected by solar radiation and soil moisture, but also fluctuated due to cold or warm currents. Taking the warming event caused by the warm current on 4 July as an example (Figure 3(a2–e2)), it could be observed that the simulated values were lower than the observed values, except for the N0 treatment, which also had an impact on the subsequent simulations, where the simulated values were consistently lower than the observed values, and the overall NSE and C index were lower than that of the soil moisture.
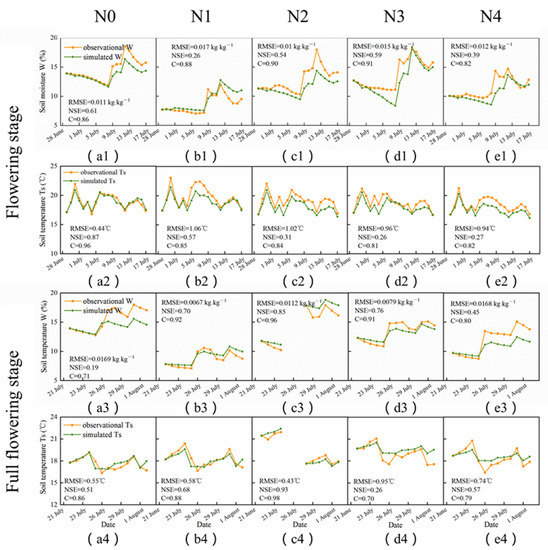
Figure 3.
Comparison of simulated and observational soil moisture (a1–e1, a3–e3) and soil temperature (a2–e2, a4–e4) during flowering (a,b) and full-flowering periods (c,d).
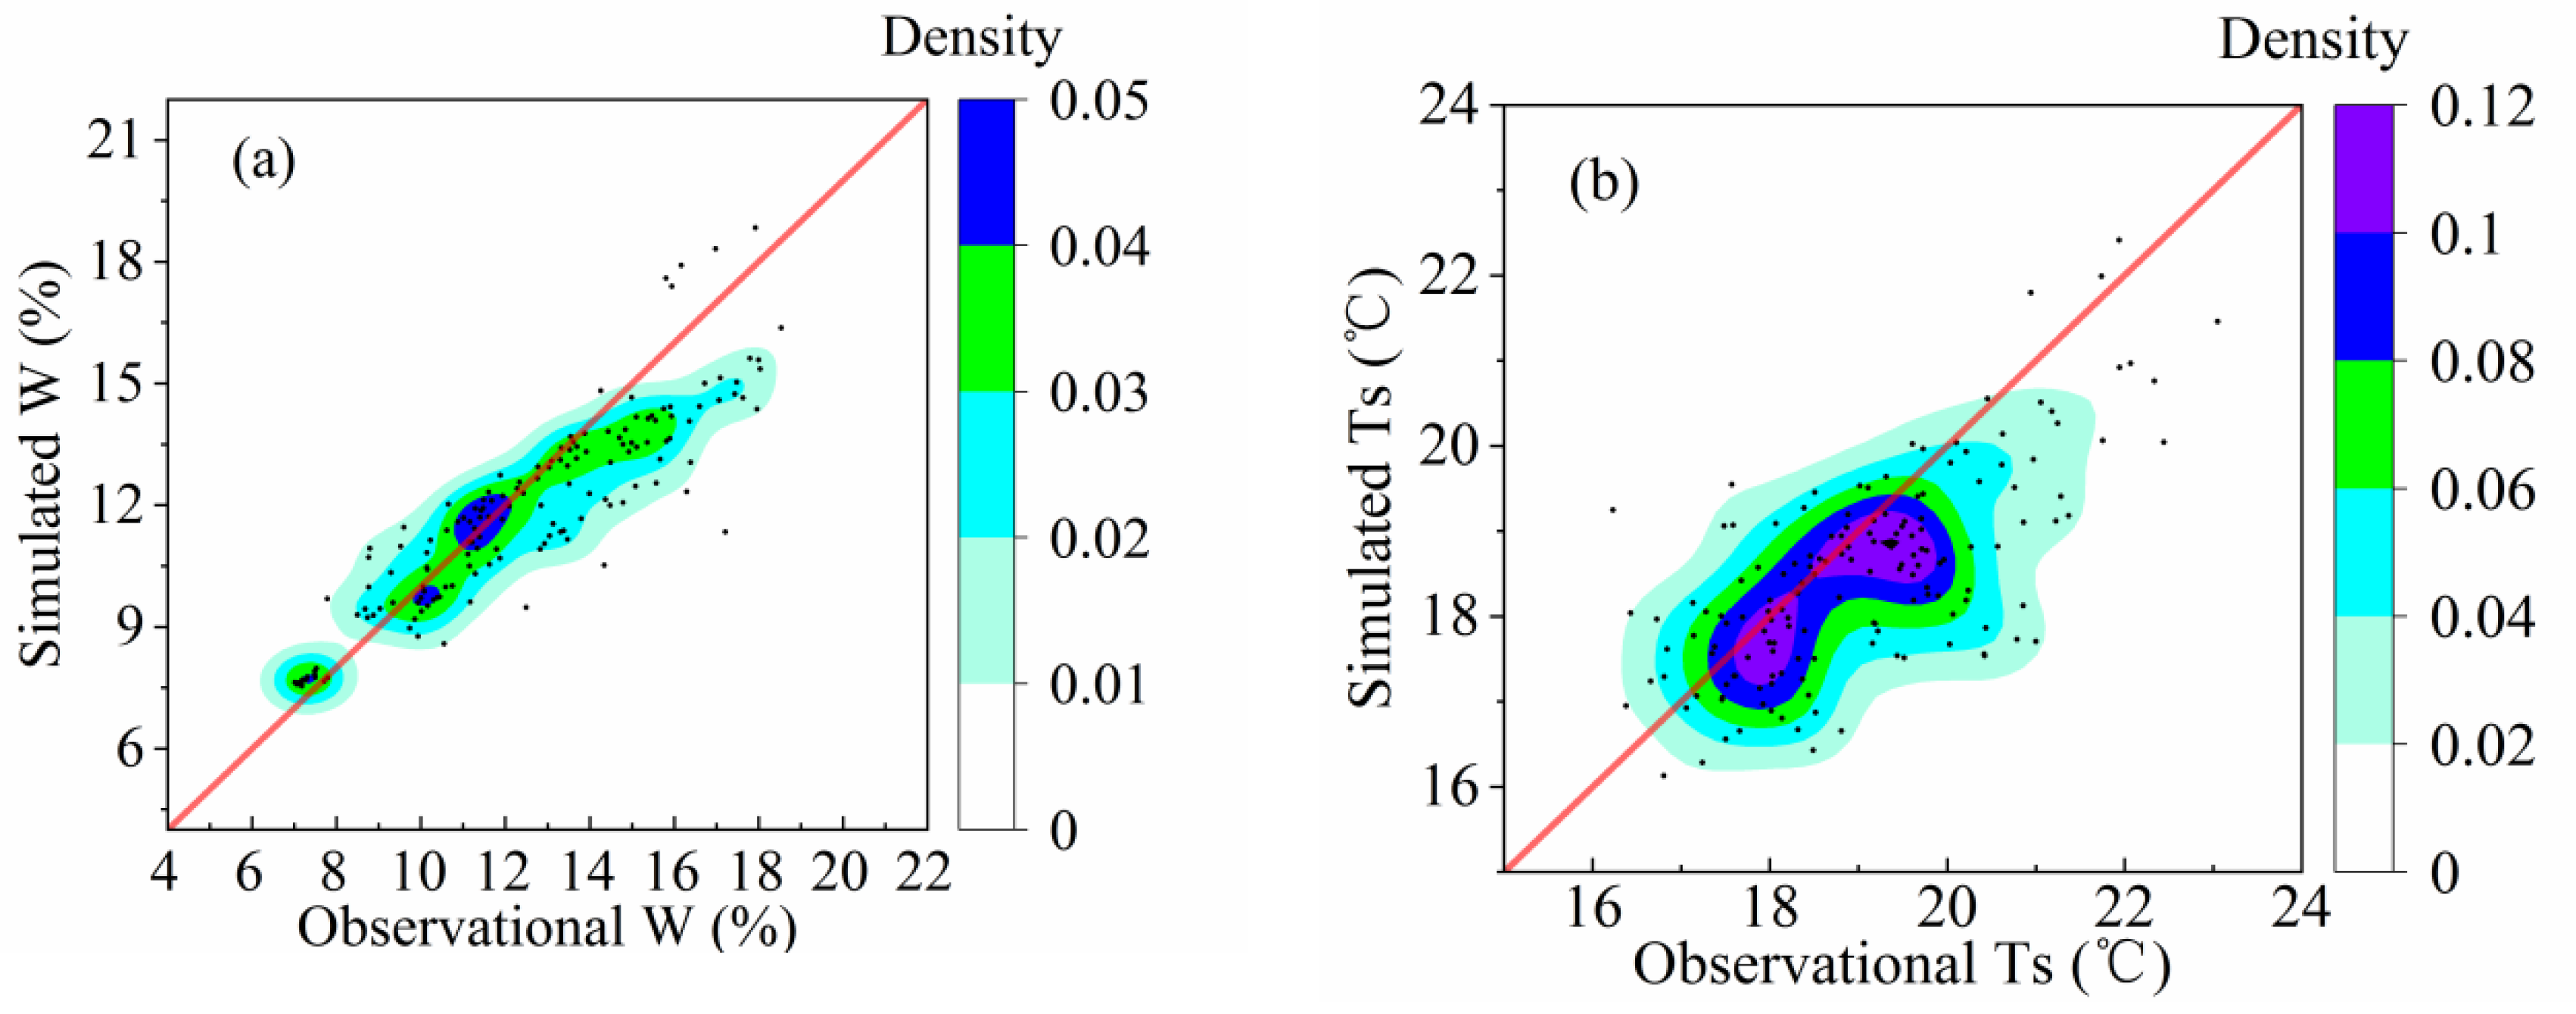
In order to reflect the simulation results more comprehensively and clearly, we plotted scatter density diagrams (Figure 4). It was observed that the temperature distribution (Figure 4a) was mainly concentrated between 16–21 °C, while the distribution of soil moisture (Figure 4b) was more dispersed, and the densest area was between 0.11–0.13. In addition, the distribution of the soil temperature pointed on the right side of y = x was denser and more frequent than the left side, which showed that the overall simulated values of soil temperature were slightly lower than the actual values. In the context of the monsoon climate, a warm current is frequent in Wuchuan region and the warming effect might be the main factor affecting the accuracy of the simulation; therefore, the model will further consider the influence of weather processes and optimize the simulation.
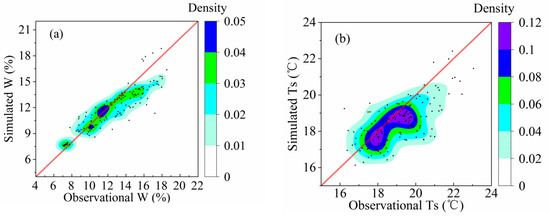
Figure 4.
Scatter density plots between simulated and observational soil moisture (a) and soil temperature (b).
3.2. Sensitivity of Soil Temperature to the Changes in Soil Moisture
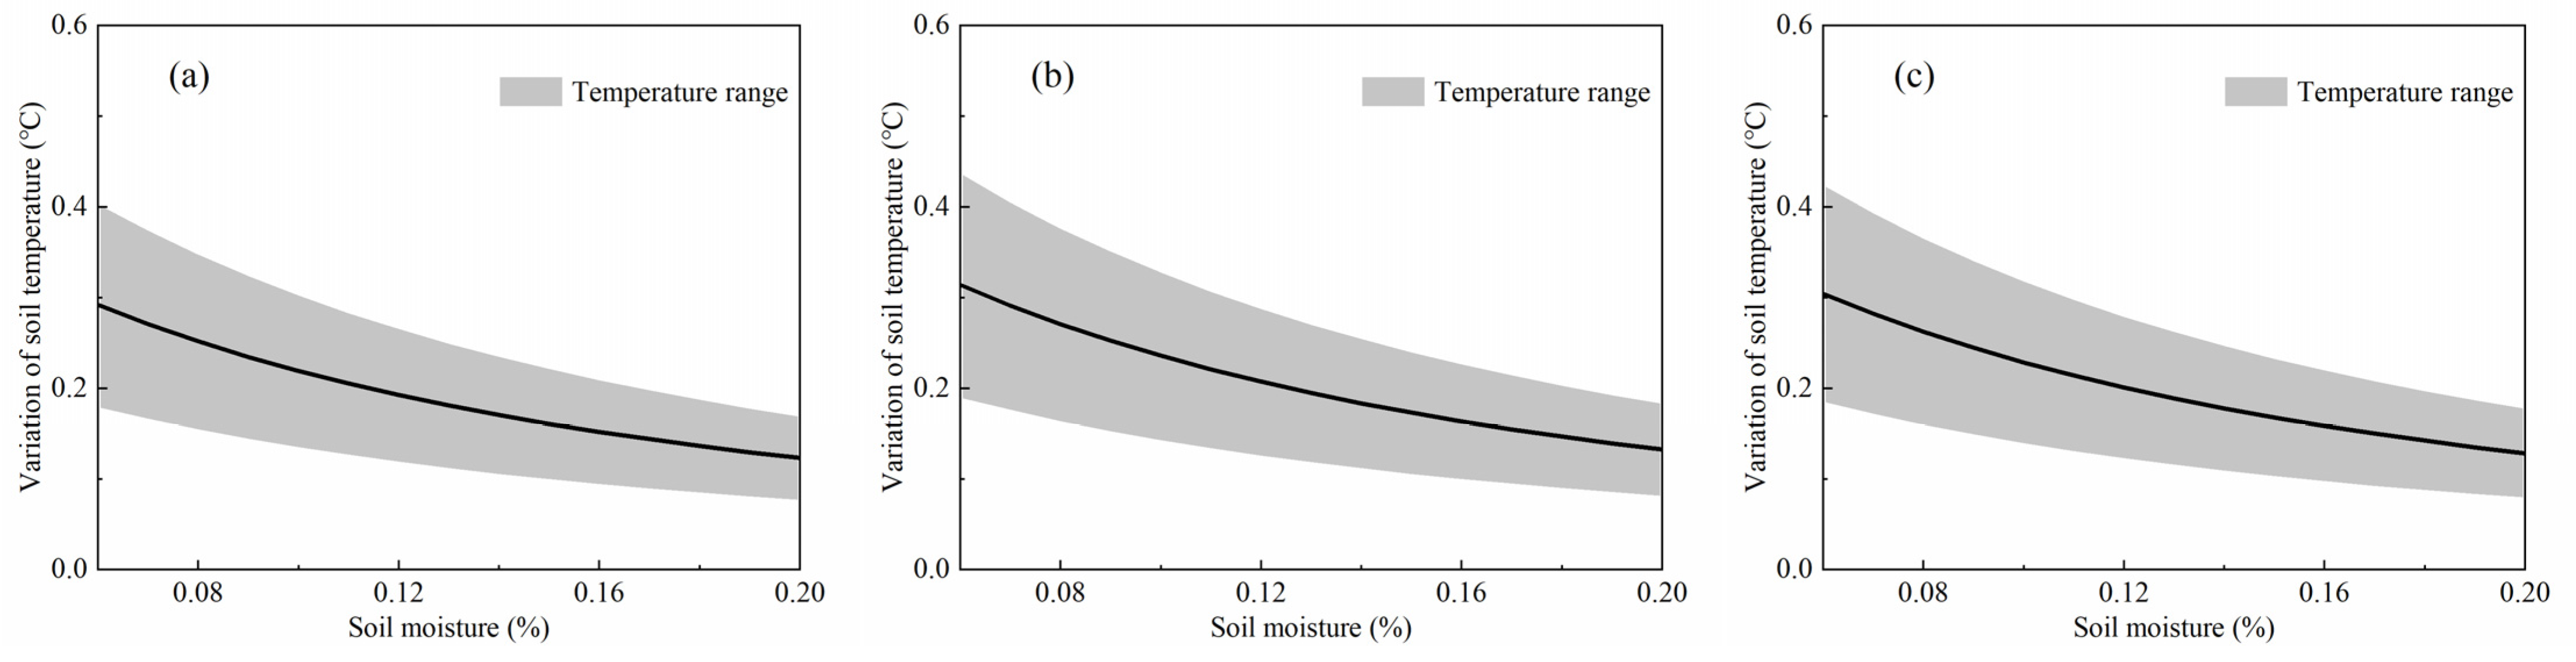
We included the average maximum and minimum temperatures and sunshine hours from May to September in Wuchuan County in the past 30 years (http://data.cma.cn/, accessed on 25 October 2020) into the model, and analyzed the change rate of soil temperature, that is, the extent of the variation in soil temperature with a 1% change in soil moisture.
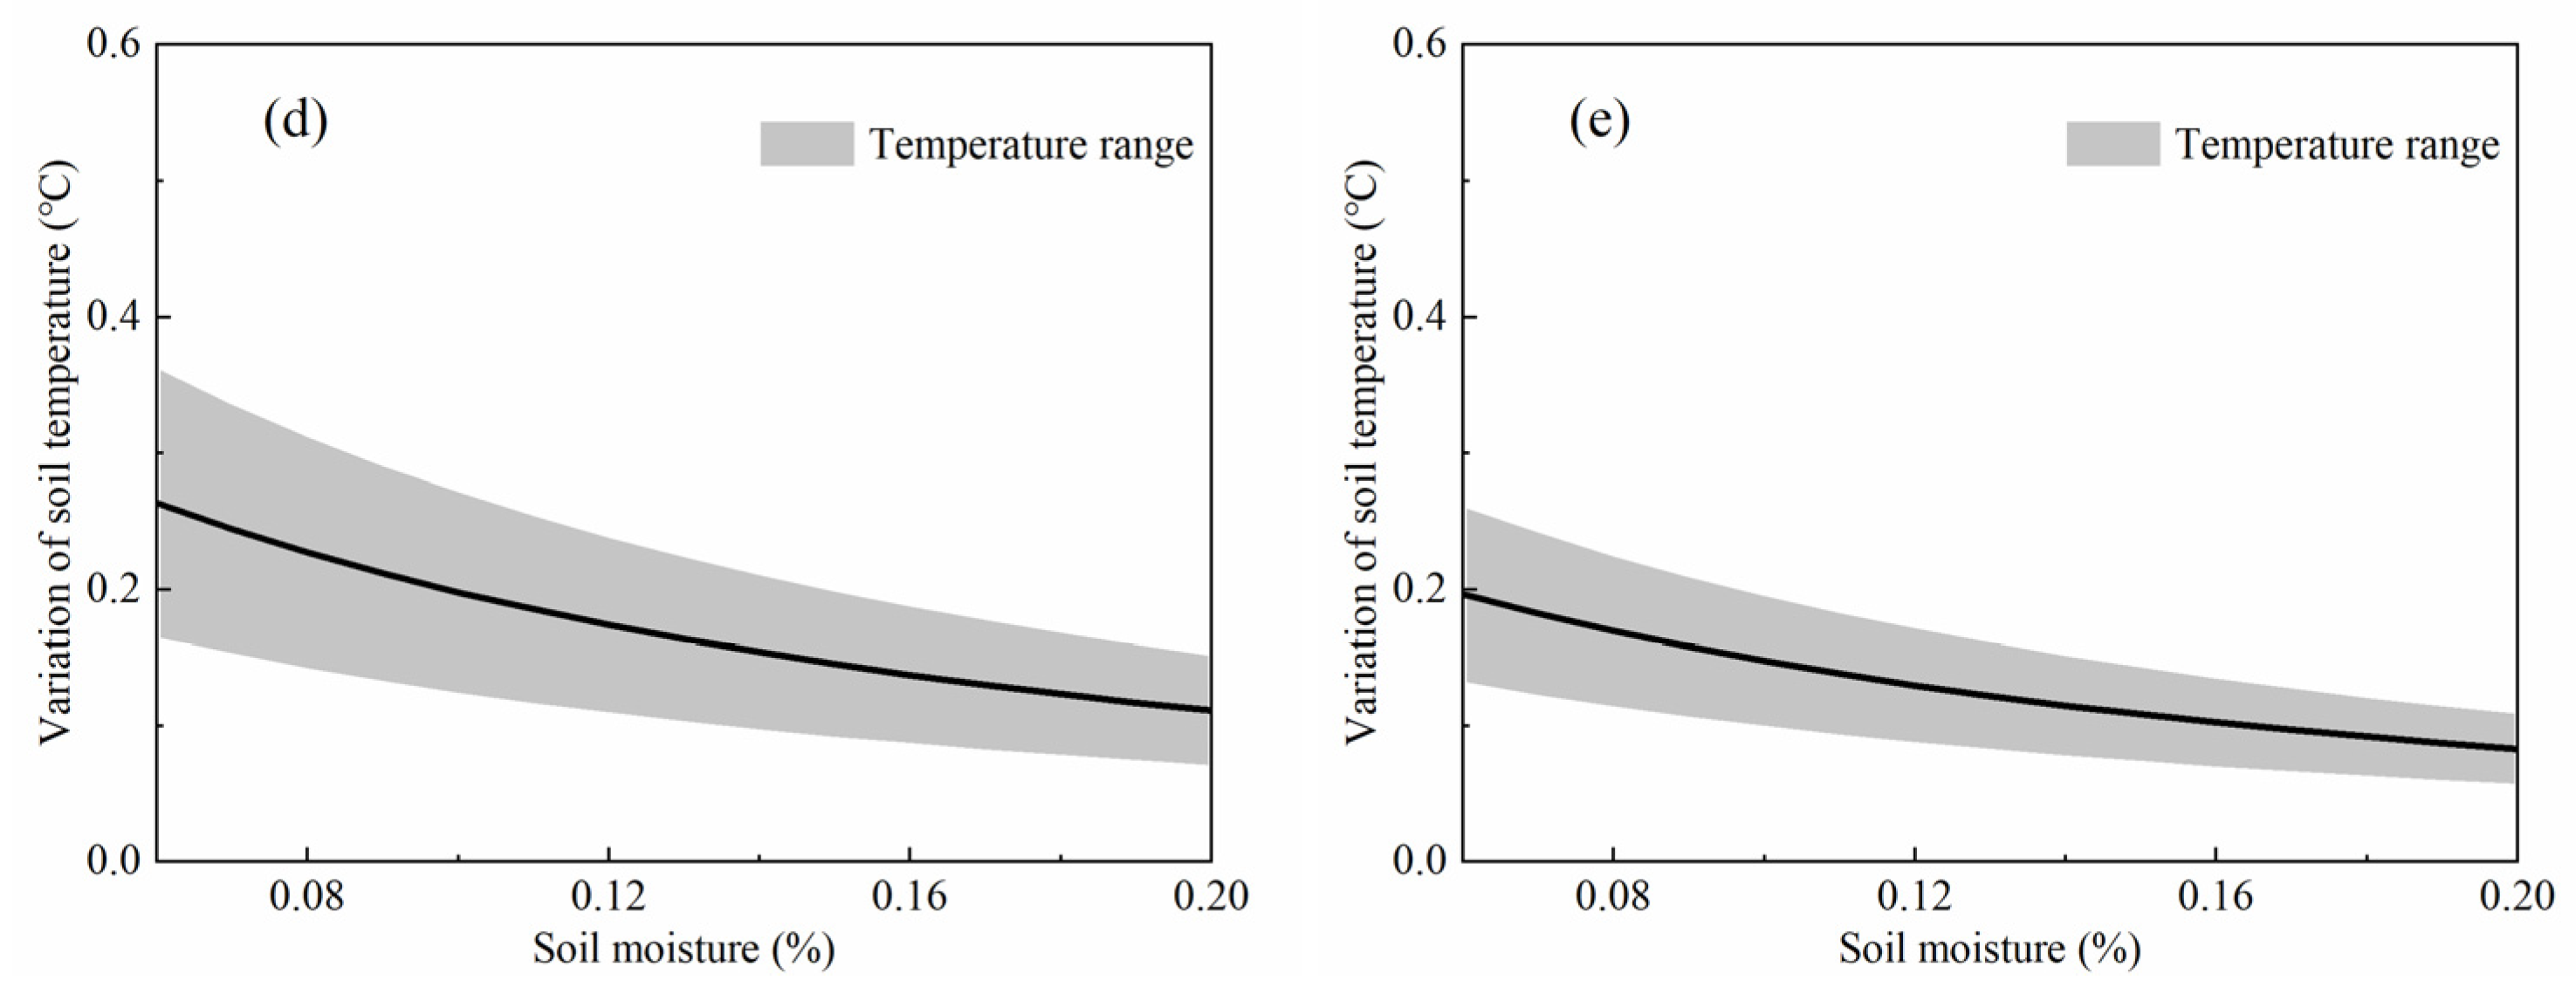
As shown in the figure below, with the increase in soil moisture, the soil temperature change caused by a 1% change in soil moisture gradually decreases, and the rate of change tends to slow down. Under no-sunshine conditions (lower edge of the shaded part), the temperature increased by 0.08–0.19 °C for every 1% decrease in soil moisture, and increased by 0.17–0.43 °C under the condition of maximum sunshine hours (upper edge of the shaded part). The sensitivity of soil temperature to the decrease in soil moisture varied significantly among growth periods, reaching the highest in June–July (Figure 5b,c) and the lowest in September (Figure 5e); the result was consistent with the seasonal variation in solar radiation. With the increase in soil moisture, the temperature change decreases and the change rate tends to slow down.

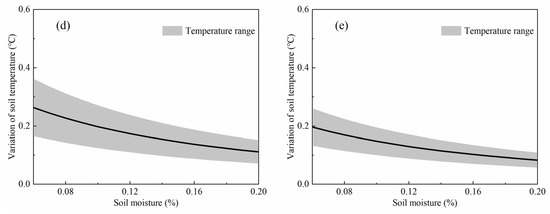
Figure 5.
The sensitivity of soil temperature to the changes in soil moisture in (a) May; (b) June; (c) July; (d) August; (e) September.
3.3. Contribution of Soil Moisture Changes to Soil Surface Temperature Increase under Different Initial Conditions
Through data analysis and simulation, Section 3.1 and Section 3.2 explained that soil moisture had an obvious regulating effect on the temperature, and low soil moisture is more likely to cause rapid changes in the temperature. Therefore, this section continued to analyze other factors that can cause a temperature increase through the soil water and heat coupling model.
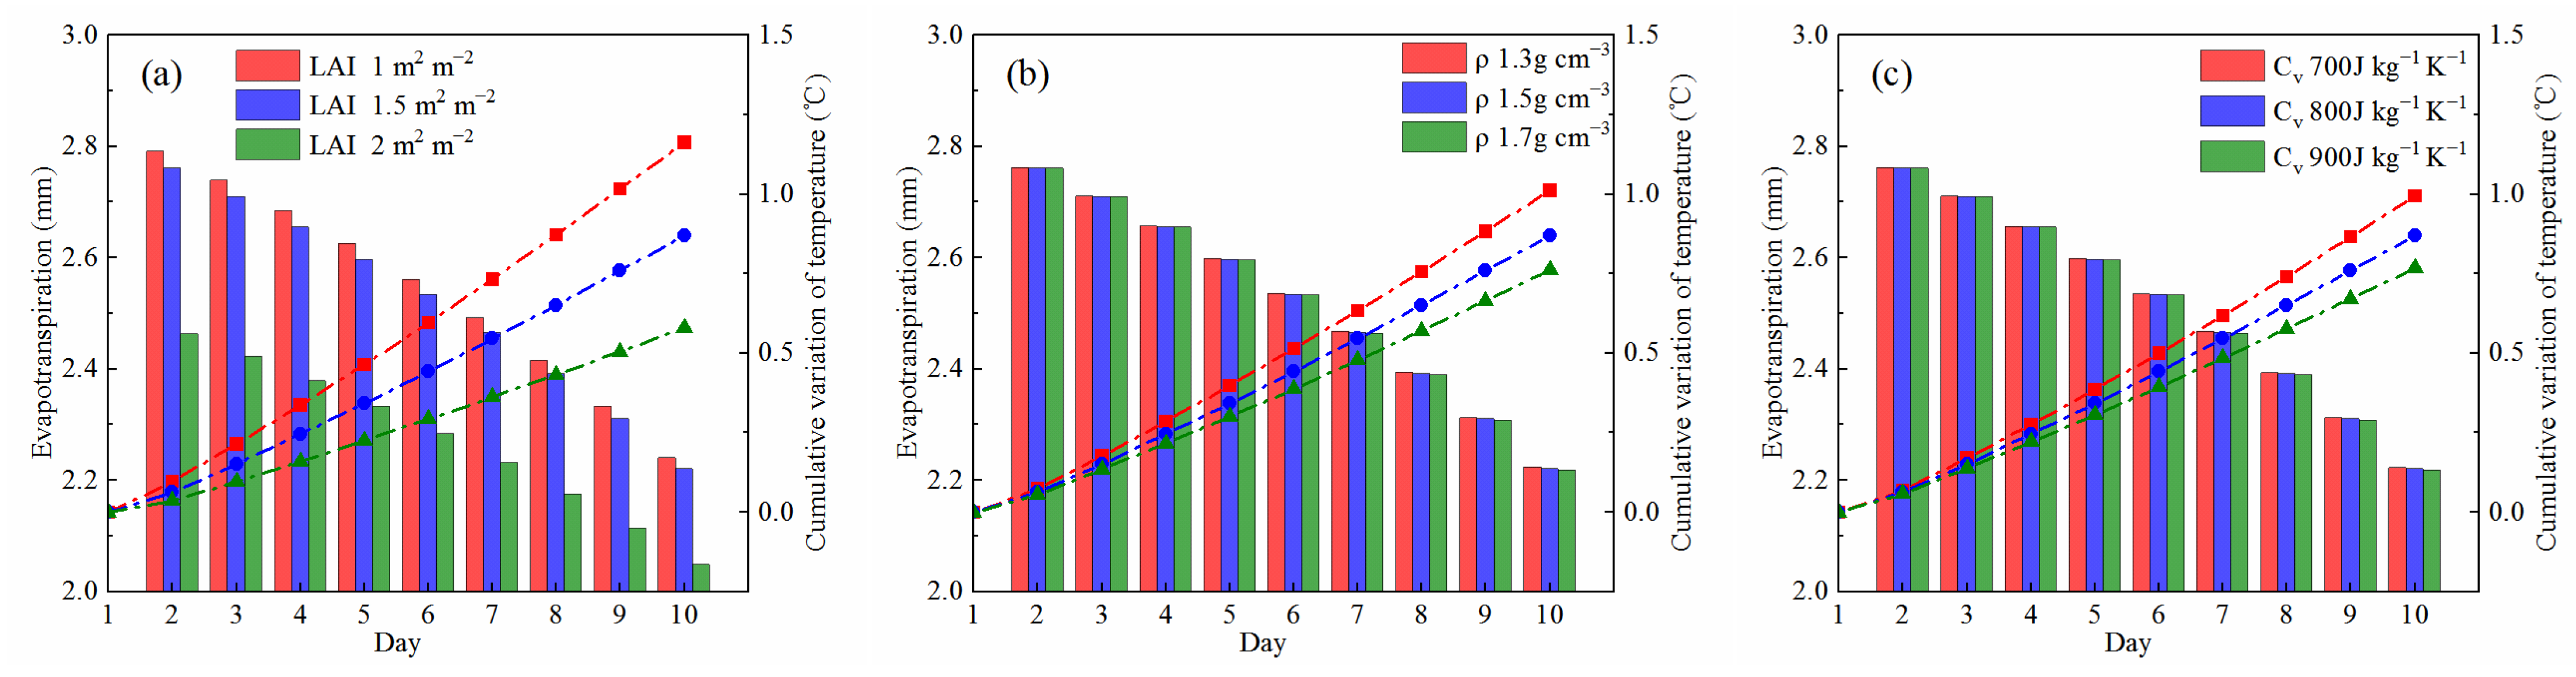
We used the summer of Wuchuan County as an example (mid-June), assuming that the initial soil moisture was 20% and the daily average temperature was 20 °C. On this basis, the evapotranspiration and cumulative changes in and soil surface temperature for 10 consecutive days under different LAIs, soil density, soil heat capacity, sunshine hours and initial daily average temperature were simulated.
Under the conditions of different LAIs (Figure 6a), the higher the LAI, the stronger the shielding effect of the leaves on the net radiation, the less evapotranspiration and the lower the temperature. When LAI = 1, the cumulative increase in temperature caused by the decrease in soil moisture can reach nearly 1.5 °C, and when the LAI = 2, the increase in temperature was only about 0.5 °C. With the increase in the soil density and soil heat capacity, the change in soil temperature decreased, but it did not cause significant changes in evaporation (Figure 6b,c). For different sunshine hours (Figure 6d), the soil surface temperature rapidly increased when the sunshine hours reached its maximum, and evaporation was accelerated. Under different initial daily average temperatures (Figure 6e), obviously, the higher daily average temperature promotes the further increase in temperature, and the cumulative temperature increase at 25 °C was 0.3 °C more than 15 °C.
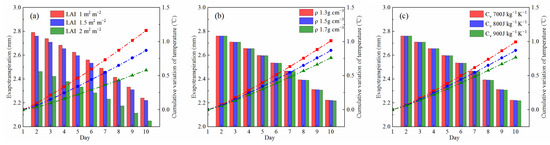

Figure 6.
Simulations of evapotranspiration, cumulative variation in soil surface temperature under different LAIs (a); soil density (b); soil heat capacity (c); sunshine hours (d) and initial daily average temperature (e).
Based on the above, we can conclude that the increase in sunshine hours, initial daily average temperature and decrease in LAI, soil density and soil heat capacity can increase the surface temperature by affecting the sensitivity of soil temperature to soil moisture.
4. Discussion
4.1. The Effects of Soil Moisture in Spring on Soil Temperature in Summer
Soil moisture is a critical contributor to water–heat transfer in land–atmosphere processes. The feedback effect of soil moisture on the atmosphere has "memory” [48]. Precedent low soil moisture has been found to promote the occurrence, maintenance and intensification of heatwaves [7]. The sensitivity experiment conducted by Walker et al. demonstrated that dry soil is beneficial to the increase in air temperature and sensible heat flux in the following period [49]. Therefore, the long-term feedback effects of soil moisture have gained more attention. Some studies have indicated that soil moisture abnormalities in many areas can last for weeks to months. The initial value of soil moisture abnormalities and differences have been proved to affect climate variability, as well as the accuracy of forecasts by adjusting surface sensible and latent heat flux and atmospheric circulation [50,51].
In this section, we simulated the changes in soil temperature under different initial soil moisture conditions in Wuchuan from spring to summer in 2020 to reflect the climate effect of initial soil moisture. In order to explore the influence of soil moisture on soil temperature on a scale of several weeks to months, we artificially simulated a rainfall process in early April and compared it to the actual state (the blue line in the figure represents normal conditions and the initial value of soil moisture is 5%, 5% is the wilting coefficient of the local soil, and the purple line represents the initial situation after the simulated rainfall). On this basis, we simulated the soil temperature changes in the two treatments from April to July (Figure 7). It can be observed that the higher soil moisture in the early stage had a cooling effect on the soil temperature during the entire simulation period. The soil temperature was significantly lower than the treatment with lower soil moisture. The shaded part in the figure reflects the cooling effect of the soil moisture throughout the simulation period; the average soil temperature was about 2 °C lower than the treatment with lower initial soil moisture (Trainfall = 9.6 °C, Tnormal = 11.64 °C).
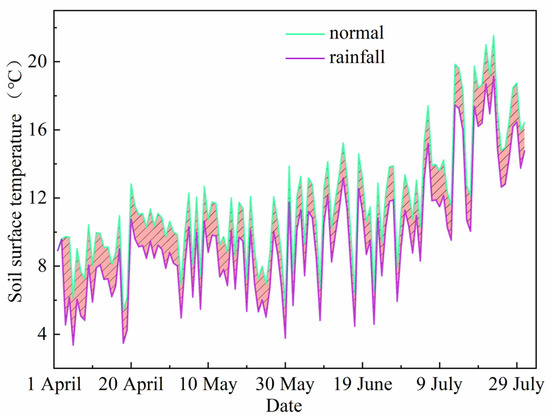
Figure 7.
Simulations of soil surface temperature under different initial soil moisture levels.
4.2. The Positive Feedback Effect of Soil Moisture Decrease and Soil Surface Temperature Increase
Theoretically speaking, the lower the soil moisture, the less evaporation, and accordingly, the sensible heat flux and the surface temperature increases. This theory was also confirmed in the high-temperature event that swept Europe in 2003. It is worth noting that this warm anomaly was combined with a continuous lack of precipitation [52]; the lack of soil moisture was proved to be an important cause of the high-temperature event [12]. In addition, the increase in soil temperature will increase evapotranspiration further and reduce soil moisture. Therefore, in this section, we explored the positive feedback effects of climate warming and the soil moisture decrease and analyzed the climate effects of changes in 1 °C in surface air temperature and 1% soil moisture (take the growth period from May to September in Wuchuan County as an example).
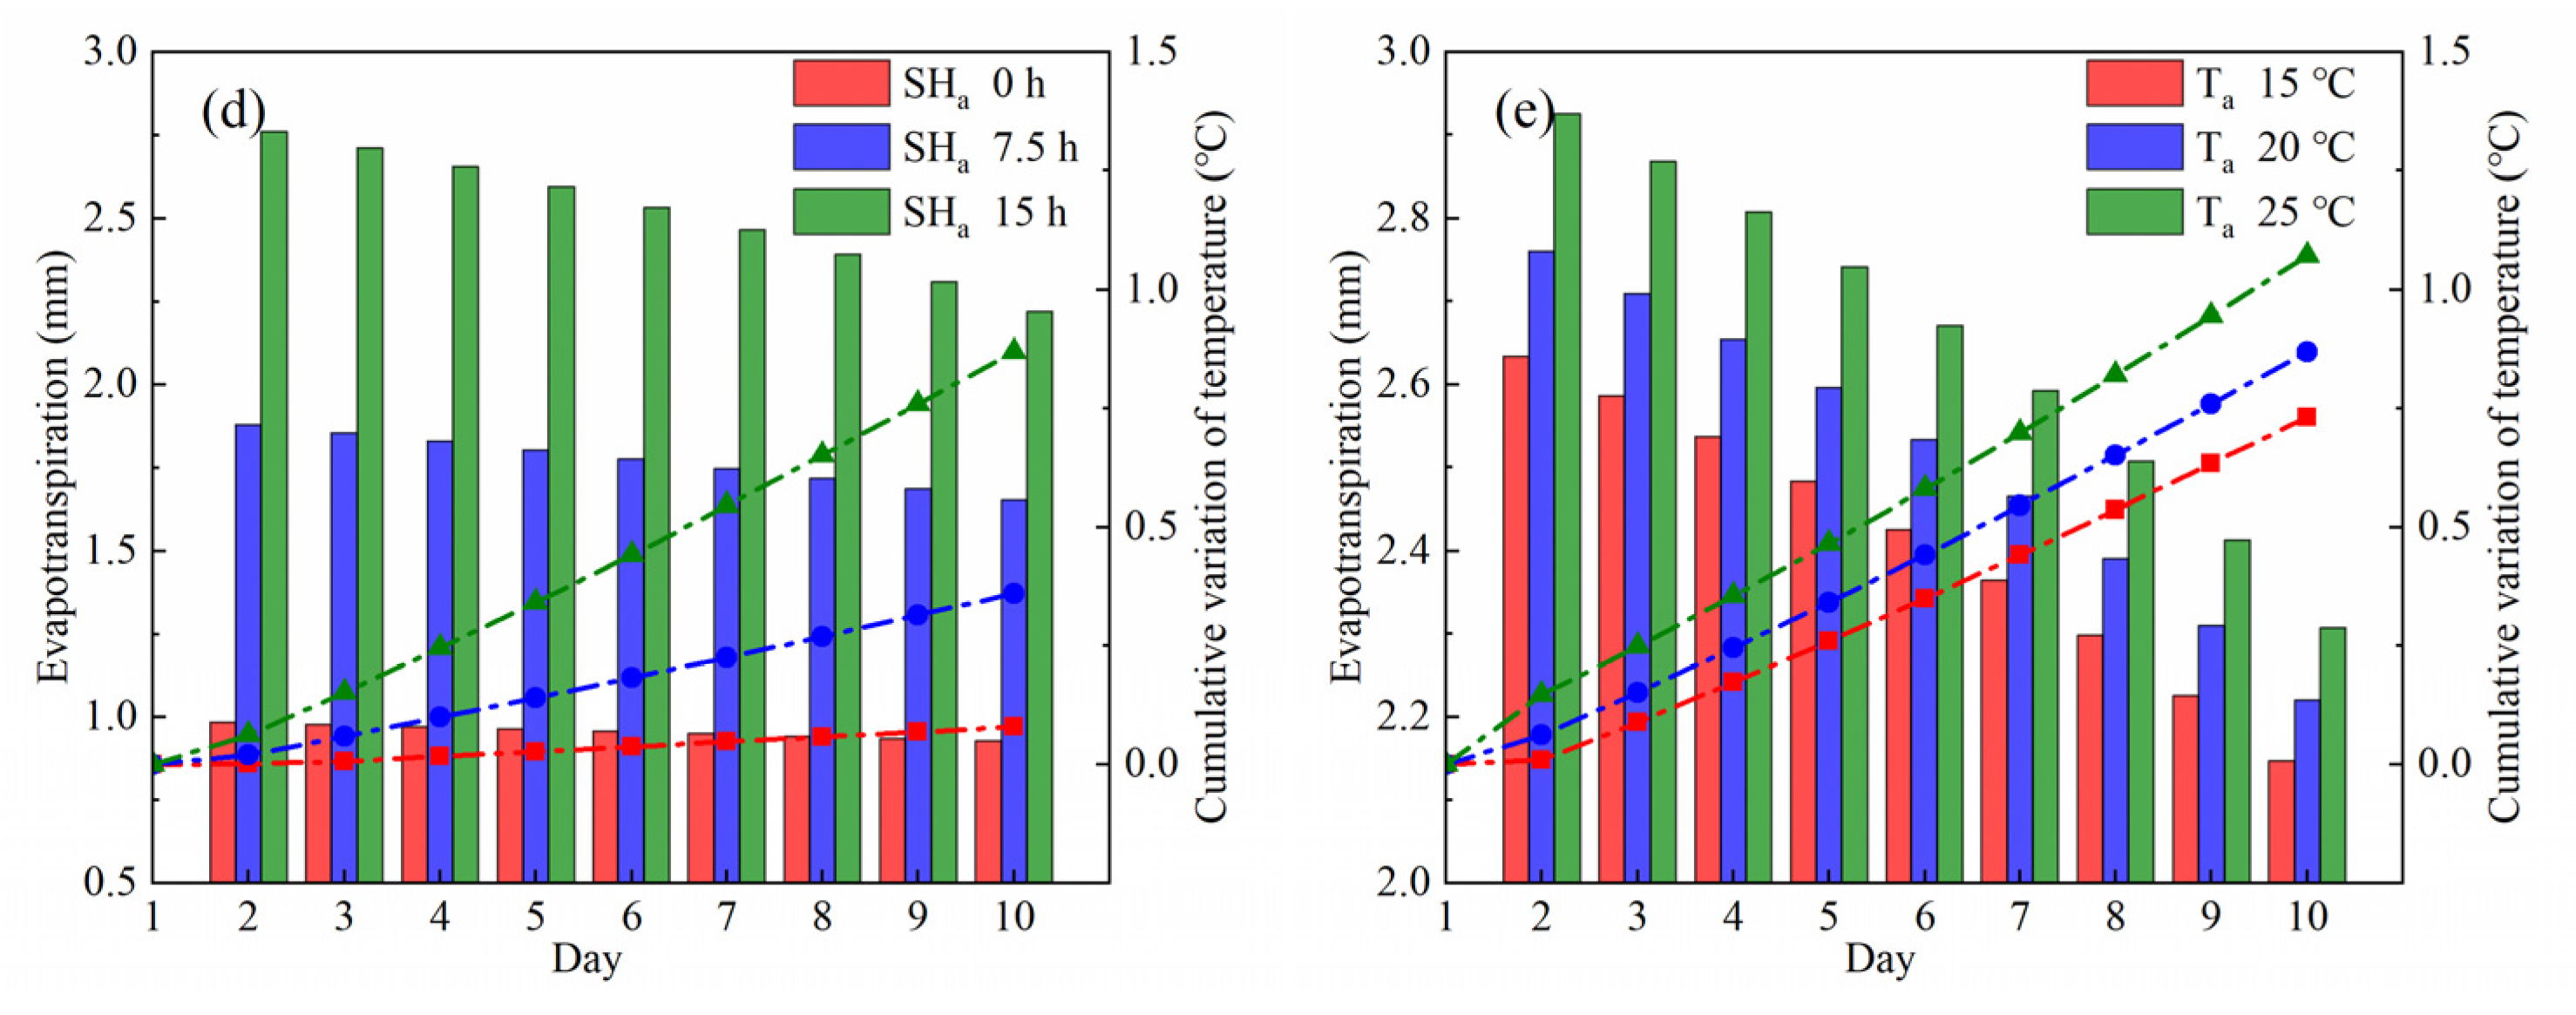
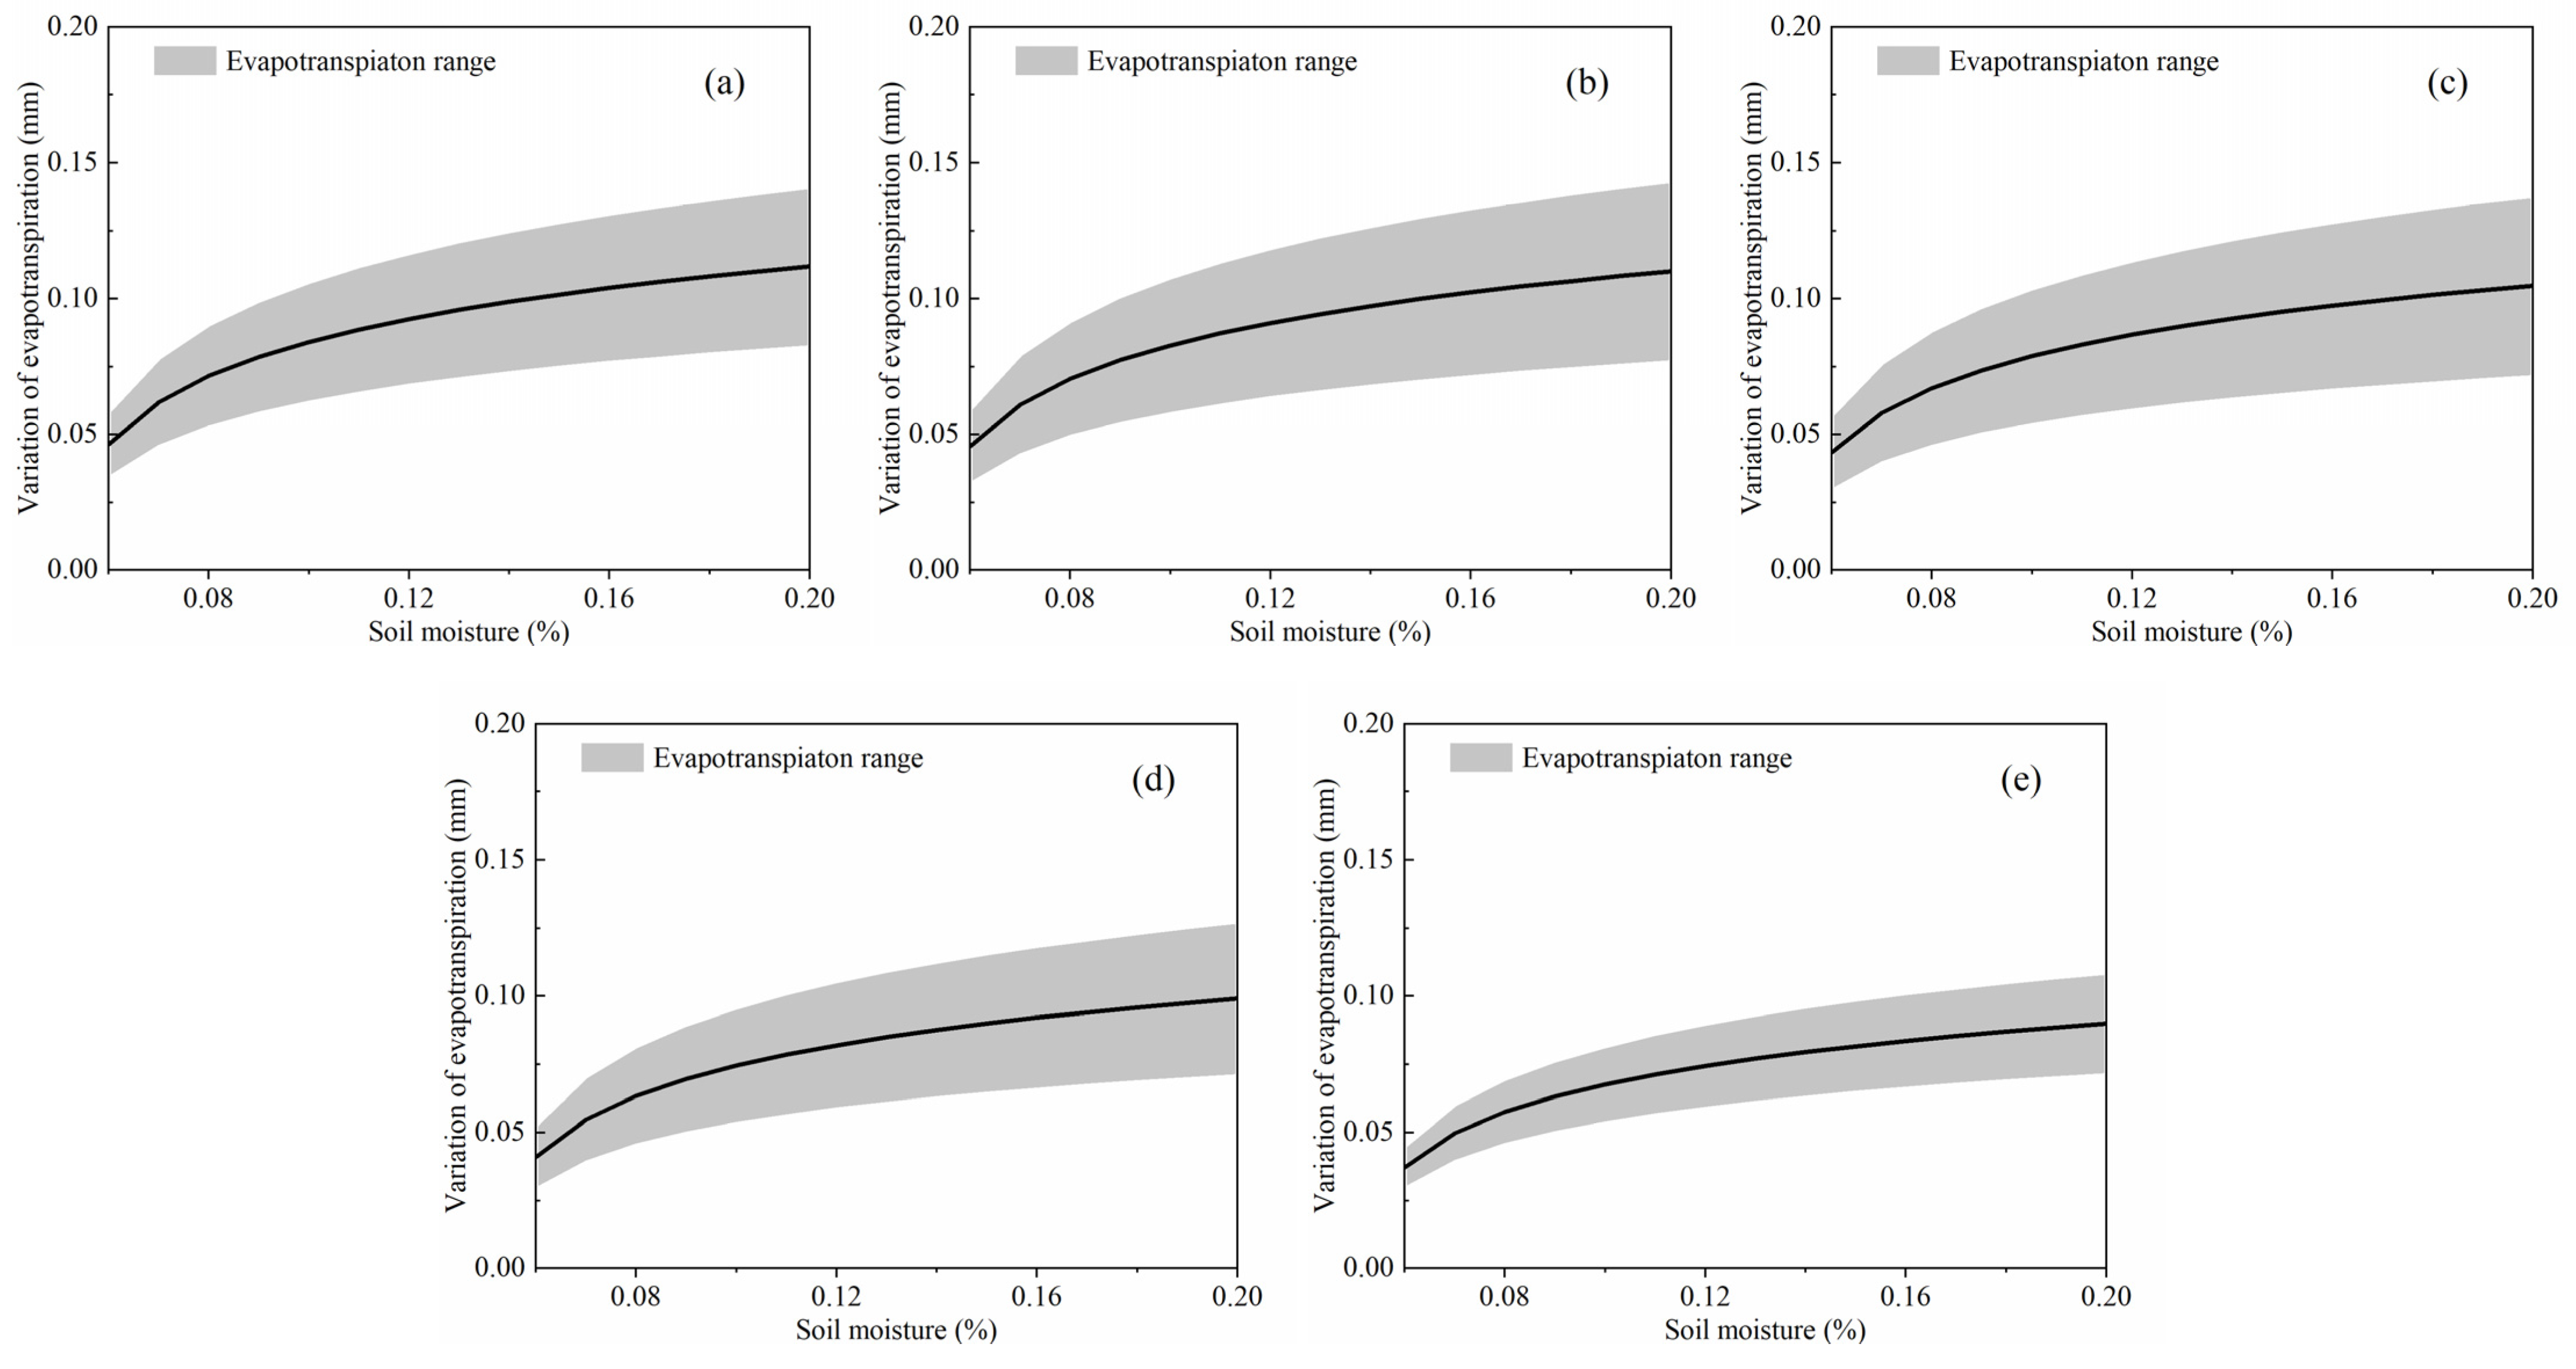
Figure 8 is the sensitivity of evapotranspiration to the changes in soil surface temperature under different months; combined with Figure 5, it can be observed that with the increase in soil moisture, the change in evapotranspiration caused by a 1 °C change in surface temperature increases, but the rate of change tends to slow down. Under the conditions of no sunlight, evapotranspiration increases by 0.03–0.08 mm/day for every 1 °C increase, and by 0.04–0.14 mm/day when the sunshine hours reach the maximum. In different growth periods, the sensitivity of evapotranspiration to temperature increase reached the highest in June and the lowest in September. The change in soil moisture had the opposite effect on temperature (Figure 5). As the soil moisture increased, the temperature change caused by the 1% change in soil moisture decreased, and the change rate also tended to ease.

Figure 8.
The sensitivity of evapotranspiration to the changes in soil surface temperature: (a) May; (b) June; (c) July; (d) August; (e) September.
4.3. Applicability and Limitations of the Model
The soil water and heat model was formulated to calculate the variations in soil temperature and moisture and to estimate the warming effects of soil moisture. The model allowed us to investigate the important mechanisms of the coupling effects of soil water and heat, and it was essential that the model can reflect the connection between agricultural production and hydrothermal processes. Our simulations showed the high accuracy of the model in predicting the changes in soil moisture and temperature, and the indicators used to test the model performed well. Thus, this study was expected to provide a useful approach for the simulation of soil hydrothermal processes, which is beneficial for agricultural production to cope with climate changes.
The research on the moisture–atmosphere interaction and hydrothermal processes has always been a hot topic for scholars. However, limited by the lack of actual observational data on soil moisture [33,53], studies quantifying the effect of soil moisture on soil temperature were relatively scarce [6]. Many studies have shown a good negative correlation between soil moisture and temperature [29,51,54], with the underlying mechanism being that higher temperatures promote soil evaporation and plant transpiration, leading to a decrease in soil moisture. Our results support the claims of the published literature that we mentioned above; they show that the rate of soil temperature change is more significant at low soil moisture levels. The decline in soil moisture clearly had a amplifying effect on climate warming, and our observational data also prove this conclusion.
Numerous studies have reported that soil moisture is closely related to extreme heatwaves [1,12,55]. However, few studies quantified the climate effects of soil moisture. Our study suggested that the decrease in soil moisture had an obvious positive feedback effect with the increase in air temperature. Additionally, under certain constraints, this study proved that climate warming will further aggravate the decline in soil moisture, and estimated the contribution of a 1% change in soil moisture to climate warming. In addition, this study also depicted the role played by other factors in the hydrothermal coupling process, and provided some suggestions for more accurate weather forecasting.
The soil water and heat coupling model is also suitable for the short-term forecasting of dry hot wind and heatwaves, and will be applied further in the future research. However, the application of the model is, at present, limited by the following restrictions:
- The disturbances of the cold and heatwaves have a great influence on the model; therefore, in the future research, it is necessary to quantify the influence of the synoptic process and optimize the model further.
- The model does not take into account the condition when the net radiation is negative and cannot simulate snow cover and frozen soil, to date.
- The model does not consider the water replenishment of groundwater to shallow soil.
- The model performed well in the Wuchuan County, but due to the differences in natural conditions in different regions (such as climate types, land cover and soil texture), the applicability of the model needs to be verified further.
5. Conclusions
Based on the theory of water and heat balance and the data obtained from the field observations conducted in Wuchuan County in 2020, this study established the soil water and heat coupling model, simulated the changes in soil temperature and moisture and quantified the interaction between them. The results indicate that: (1) the simulated values are in good agreement with the actual values, and the model can effectively reflect the variations in soil temperature and moisture. (2) In the process of the soil hydrothermal interaction, with the increase in soil moisture, the change in soil surface temperature caused by a 1% change in soil moisture decreases, but the change rate tends to slow down. (3) Soil texture, weather and crop growth conditions can all affect the sensitivity of soil temperature to soil moisture. (4) The soil moisture in the early stage can regulate the soil temperature for a long time later on, and sufficient soil moisture in spring even has a cooling effect on the soil temperature in summer. (5) The decrease in soil moisture increases the surface temperature, and the increase in temperature intensifies evapotranspiration, resulting in a further decrease in soil moisture. The increase in soil surface temperature and decrease in soil moisture have obvious positive feedback effects.
In summary, the study proposed a method to estimate the warming or cooling effects of soil moisture; it was expected that this model could be used for further applications. In the future research, the model will be calibrated and verified with more regions and field data, and modules, such as synoptic processes, will be added to further optimize the model and they will be applied at a larger scale.
Author Contributions
Conceptualization, Z.Z. (Ziyuan Zhang) and Z.P.; software, X.C.; validation, X.C.; formal analysis, K.J.; investigation, Z.Z. (Ziyuan Zhang); resources, J.Z. (Jun Zhang); data curation, J.Z. (Jiale Zhang); writing—original draft preparation, Z.Z. (Ziyuan Zhang), J.W., Y.S., G.H., N.H., S.M., W.Y., Z.Z. (Zhenzhen Zhang) and J.M.; writing—review and editing, Z.Z. (Ziyuan Zhang); visualization, X.C. and K.J.; supervision, Z.P. and P.Z.; project administration, Z.P.; funding acquisition, Z.P. All authors have read and agreed to the published version of the manuscript.
Funding
This research was funded by the Key R&D Program of Inner Mongolia, China (2020ZD0005) and the National Key Research and Development Plan of China (2018YFA0606300, 2021YFD1901104).
Institutional Review Board Statement
Not applicable.
Informed Consent Statement
Informed consent was obtained from all subjects involved in the study.
Data Availability Statement
The data presented in this study are available upon request from the authors.
Conflicts of Interest
The authors declare no conflict of interest.
References
- Hauser, M.; Orth, R.; Seneviratne, S.I. Role of soil moisture versus recent climate change for the 2010 heat wave in western Russia. Geophys. Res. Lett. 2016, 43, 2819–2826. [Google Scholar] [CrossRef]
- Koster, R.D.; Dirmeyer, P.A.; Guo, Z.C.; Bonan, G.; Chan, E.; Cox, P.; Gordon, C.T.; Kanae, S.; Kowalczyk, E.; Lawrence, D.; et al. Regions of strong coupling between soil moisture and precipitation. Science 2004, 305, 1138–1140. [Google Scholar] [CrossRef] [PubMed]
- Li, R.L.; Bao, H.Y.; Li, K.C.; Wang, C.H. The memory and climate effects of global soil moisture. J. Glaciol. Geocryol. 2016, 38, 1470–1481. (In Chinese) [Google Scholar]
- Zhang, J.; Liu, Z.Y.; Chen, L. Reduced soil moisture contributes to more intense and more frequent heat waves in Northern China. Adv. Atmos. Sci. 2015, 32, 1197–1207. [Google Scholar] [CrossRef]
- Kai, Y.; Zhang, J. Spatiotemporal characteristics of soil temperature memory in China from observation. Theor. Appl. Climatol. 2015, 126, 739–749. [Google Scholar]
- Zhang, Z.Y.; Pan, Z.H.; Pan, F.F.; Zhang, J.; Han, G.L.; Huang, N.; Wang, J.L.; Pan, Y.Y.; Wang, Z.Z.; Peng, R.Q. The Change Characteristics and Interactions of Soil Moisture and Temperature in the Farmland in Wuchuan County, Inner Mongolia, China. Atmosphere 2020, 11, 503. [Google Scholar] [CrossRef]
- Zeng, X.M.; Wang, B.; Zhang, Y.; Song, S.; Huang, X.; Zheng, Y.; Chen, C.; Wang, G. Sensitivity of high-temperature weather to initial soil moisture: A case study using the WRF model. Atmos. Chem. Phys. 2014, 14, 9623–9639. [Google Scholar] [CrossRef]
- Erdenebat, E.; Sato, T. Role of soil moisture-atmosphere feedback during high temperature events in 2002 over Northeast Eurasia. Prog. Earth Planet. Sci. 2018, 5, 37. [Google Scholar] [CrossRef]
- Zaitchik, B.F.; Macalady, A.K.; Bonneau, L.R.; Smith, R.B. Europe’s 2003 heat wave: A satellite view of impacts and land-atmosphere feedbacks. Int. J Climatol. 2006, 26, 743–769. [Google Scholar] [CrossRef]
- Kirien, W.; Jakob, Z.; Rene, O.; Mxolisi, S.; Mohammad, R.; Ernest, O.A.; Sonia, I.S. Impact of soil moisture on extreme maximum temperatures in Europe. Weather Clim. Extrem. 2015, 9, 57–67. [Google Scholar]
- Seneviratne, S.I.; Davin, E.; Hirschi, M. Soil Moisture-Ecosystem-Climate Interactions in a Changing Climate. In Proceedings of the AGU Fall Meeting, San Francisco, CA, USA, 5–9 December 2011. [Google Scholar]
- Fischer, E.M.; Seneviratne, S.I.; Vidale, P.L.; Luthi, D.; Schar, C. Soil Moisture Atmosphere Interactions during the 2003 European Summer Heat Wave. J. Clim. 2007, 20, 5081–5099. [Google Scholar] [CrossRef]
- Deng, Y.H.; Wang, S.J.; Bai, X.Y.; Luo, G.J.; Wu, L.H.; Cao, Y.; Li, H.W.; Li, C.J.; Yang, Y.J.; Hu, Z.Y.; et al. Variation trend of global soil moisture and its cause analysis. Ecol. Indic. 2019, 110, 105939. [Google Scholar] [CrossRef]
- Seneviratne, S.I.; Corti, T.; Davin, E.L.; Hirschi, M.; Jaeger, E.B.; Lehner, I.; Orlowsky, B.; Teuling, J. Investigating soil moisture–climate interactions in a changing climate: A review. Earth Sci. Rev. 2010, 99, 125–161. [Google Scholar] [CrossRef]
- Luterbacher, J.; Dietrich, D.; Xoplaki, E.; Grosjean, M.; Wanner, H. European Seasonal and Annual Temperature Variability, Trends, and Extremes Since 1500. Science 2004, 303, 1499–1503. [Google Scholar] [CrossRef]
- Hui, Y.; Li, C.Y. Diagnostic Study of Serious High Temperature over South China in 2003 Summer. Clim. Environ. Res. 2005, 10, 80–85. (In Chinese) [Google Scholar]
- Zhang, J.Y.; Wu, L.Y. Land-atmosphere coupling amplifies hot extremes over China. Chin. Sci. Bull. 2011, 56, 3328–3332. [Google Scholar] [CrossRef]
- Venkat, L.; Jackson, T.J.; Diane, Z. Soil moisture–temperature relationships: Results from two field experiments. Hydrol. L Processes 2003, 17, 3041–3057. [Google Scholar]
- Douville, H. Relative contribution of soil moisture and snow mass to seasonal climate predictability: A pilot study. Clim. Dyn. 2010, 34, 797–818. [Google Scholar] [CrossRef]
- Khodayar, S.; Sehlinger, A.; Feldmann, H.; Kottmeier, C. Sensitivity of soil moisture initialization for decadal predictions under different regional climatic conditions in Europe. Int. J. Climatol. 2015, 35, 1899–1915. [Google Scholar] [CrossRef]
- Subin, Z.M.; Koven, C.D.; Riley, W.J.; Torn, M.S.; Lawrence, D.M.; Swenson, S.C. Effects of Soil Moisture on the Responses of Soil Temperatures to Climate Change in Cold Regions. J. Clim. 2013, 26, 3139–3158. [Google Scholar] [CrossRef]
- Li, C. A model of nitrous oxide evolution from soil driven by rainfall events: 1. Model structure and sensitivity. J. Geophys. Res. 1992, 97, 9759–9776. [Google Scholar] [CrossRef]
- Tsuji, G.; Uehara, G.; Balas, S. DSSAT Version 3, 3rd ed.; University of Hawaii: Honolulu, HI, USA, 1994. [Google Scholar]
- Bonan, G.B.; Oleson, K.W.; Vertenstein, M.; Levis, S.; Zeng, X.B.; Dai, Y.J.; Dickinson, R.E.; Yang, Z.L. The Land Surface Climatology of the Community Land Model Coupled to the NCAR Community Climate Model. J. Clim. 2002, 15, 3123–3149. [Google Scholar] [CrossRef]
- Neitsch, S.L.; Arnold, J.G.; Kiniry, J.R.; King, K.W. Soil and Water Assessment Tool Theoretical Documentation Version 2000, 3rd ed.; Blackland Research Center: Temple, TX, USA, 2002. [Google Scholar]
- Dai, Y.J.; Ji, D.Y. The Common Land Model (CoLM) Technical User’s Guide, 3rd ed.; Beijing Normal University: Beijing, China, 2008. [Google Scholar]
- Cheng, S.; Guan, X.; Huang, J.; Ji, F.; Guo, R. Long-term trend and variability of soil moisture over East Asia. J. Geophys. Res. Atmos. 2015, 120, 8658–8670. [Google Scholar] [CrossRef]
- Chen, Y.; Li, Z.; Fan, Y.; Wang, H.; Deng, H. Progress and prospects of climate change impacts on hydrology in the arid region of northwest China. Environ. Res. 2015, 139, 11–19. [Google Scholar] [CrossRef]
- Han, G.L.; Wang, J.L.; Pan, Y.Y.; Huang, N.; Zhang, Z.Y.; Peng, R.Q.; Wang, Z.Z.; Sun, G.F.; Liu, C.; Ma, S.Q.; et al. Temporal and Spatial Variation of Soil Moisture and Its Possible Impact on Regional Air Temperature in China. Water 2020, 12, 1807. [Google Scholar] [CrossRef]
- Zhang, J.T.; An, P.l.; Pan, Z.H.; Hao, B.Z.; Wang, L.W.; Dong, Z.Q.; Pan, X.B.; Xue, Q.W. Adaptation to a warming-drying trend through cropping system adjustment over three decades: A case study in the northern agro-pastural ecotone of China. J. Meteorol. Res. 2015, 29, 496–514. [Google Scholar] [CrossRef]
- Dong, Z.Q.; Pan, Z.H.; An, P.L.; Zhang, J.T.; Zhang, J.; Pan, Y.Y.; Huang, L.; Zhao, H.; Han, G.L.; Wu, D.; et al. A quantitative method for risk assessment of agriculture due to climate change. Theor. Appl. Climatol. 2016, 131, 653–659. [Google Scholar] [CrossRef]
- Li, H.X.; Xia, Z.Q.; Ma, G.H. Study on the effect of water content variation on soil temperature and water exchange. J. Hohai Univ. 2007, 35, 172–175. (In Chinese) [Google Scholar]
- Holmes, T.R.H.; Owe, M.; Jeu, R.A.M.D.; Kooi, H. Estimating the soil temperature profile from a single depth observation: A simple empirical heatflow solution. Water Resour. Res. 2008, 440, 103–112. [Google Scholar] [CrossRef]
- Allen, D.G.; Pereira, L.O.; Raes, D.; Smith, M. Crop Evapotranspiration: Guideline for Computing Crop Water Requirements, 3rd ed.; FAO: Rome, Italy, 1998.
- Flerchinger, G.N.; Pierson, F.B. Modeling plant canopy effects on variability of soil temperature and water. Agric. For. Meteorol. 1991, 56, 227–246. [Google Scholar] [CrossRef]
- Goudriaan, J. The bare bones of leaf-angle distribution in radiation models for canopy photosynthesis and energy exchange. Agric. For. Meteorol. 1988, 43, 155–169. [Google Scholar] [CrossRef]
- He, L.M.; Chen, J.M.; Liu, J.; Mo, G.; Joiner, G. Angular normalization of GOME-2 Sun-induced chlorophyll fluorescence observation as a better proxy of vegetation productivity. Geophys. Res. Lett. 2017, 44, 5691–5699. [Google Scholar] [CrossRef]
- Su, Y.X.; Liu, L.Y.; Wu, J.P.; Chen, X.Z.; Shang, J.L.; Ciais, P.; Zhou, J.Y.; Lafortezza, R.; Wang, Y.P.; Yuan, W.P.; et al. Quantifying the biophysical effects of forests on local air temperature using a novel three-layered land surface energy balance model. Environ. Int. 2019, 132, 105080. [Google Scholar] [CrossRef] [PubMed]
- Reginato, R.; Jackson, R.D.; Pinter, P.J. Evapotranspiration calculated from remote multispectral and ground station meteorological data. Remote Sens. Environ. 1985, 18, 75–89. [Google Scholar] [CrossRef]
- Kang, S.Z.; Hu, X.T.; Du, T.S.; Zhang, J.H.; Jerie, P. Transpiration coefficient and ratio of transpiration to evapotranspiration of pear tree (Pyrus communis L.) under alternative partial root-zone drying conditions. Hydrol. Process 2003, 17, 1165–1176. [Google Scholar] [CrossRef]
- Lei, Z.D.; Yang, S.X.; Xie, S.C. Soil hydrodynamics, 3rd ed.; Tsinghua University: Beijing, China, 1988. [Google Scholar]
- Williams, J.R.; Laseur, W.V. Water yield model using SCS curve numbers. Am. Soc. Civ. Eng. 1976, 102, 1241–1253. [Google Scholar] [CrossRef]
- Bosznay, M. Generalization of SCS Curve Number Method. J. Irrig. Drain. Eng. 1989, 115, 139–144. [Google Scholar] [CrossRef]
- Marshall, T.; Holmes, J.; Rose, C. Soil Physics, 3rd ed.; Cambridge University: Cambridge, UK, 1981. [Google Scholar] [CrossRef]
- Nash, J.E.; Sutcliffe, J.V. River flow forecasting through conceptual models part I-A discussion of principles. J. Hydrol. 1970, 10, 282–290. [Google Scholar] [CrossRef]
- Mandeville, A.N.; O’Connell, P.E.; Sutcliffe, J.V.; Nash, J.E. River flow forecasting through conceptual models part III—The Ray catchment at Grendon Underwood. J. Hydrol. 1970, 11, 109–128. [Google Scholar] [CrossRef]
- Peng, Y.; Wang, M.X.; Liu, D.; Zhao, Y.X. Application analysis of runoff curve number model (SCS-CN) in mountain torrent calculation of typical small watershed in desert steppe. Inn. Mong. Water Resour. 2019, 2, 17–18. (In Chinese) [Google Scholar]
- Koster, R.D.; Suarez, M.J. Soil Moisture Memory in Climate Models. J. Hydrometeorol. 2000, 2, 558–570. [Google Scholar] [CrossRef]
- Walker, J.; Rowntree, P.R. The effect of soil moisture on circulation and rainfall in a tropical model. Q. J. R. Meteorol. Soc. 2010, 103, 29–46. [Google Scholar] [CrossRef]
- Vinnikov, K.Y.; Yeserkepova, I.B. Soil Moisture: Empirical Data and Model Results. J. Clim. 1991, 4, 66–79. [Google Scholar] [CrossRef]
- Seneviratne, S.I.; Koster, R.D.; Guo, Z.; Dirmeyer, P.A.; Kowalczyk, E.; Lawrence, D.; Liu, P.; Mocko, D.; Lu, D.H.; Oleson, K.W. Soil moisture memory in AGCM simulations: Analysis of Global Land-Atmosphere Coupling Experiment (GLACE) data. J. Hydrometeorol. 2006, 7, 1090–1112. [Google Scholar] [CrossRef]
- Andreas, H.F.; Tim, B.; Andreas, K.; Gregor, C.L.; Joaquim, G.P.; Uwe, U. The 2003 European summer heatwaves and drought-synoptic diagnosis and impacts. Weather 2010, 59, 209–216. [Google Scholar]
- Vereecken, H.; Huisman, J.A.; Bogena, H.; Vanderborght, J.; Vrugt, J.A.; Hopmans, J.W. On the value of soil moisture measurements in vadose zone hydrology: A review. Water Resour. Res. 2008, 44, 1–21. [Google Scholar] [CrossRef]
- Cho, E.; Choi, M. Regional scale spatio-temporal variability of soil moisture and its relationship with meteorological factors over the Korean peninsula. J. Hydrol. 2014, 516, 317–329. [Google Scholar] [CrossRef]
- Hirschi, M.; Seneviratne, S.I.; Alexandrov, V.; Boberg, F.; Boroneant, C.; Christensen, O.B.; Formayer, H.; Orlowsky, B.; Stepanek, P. Observational evidence for soil-moisture impact on hot extremes in southeastern Europe. Nat. Geosci. 2011, 4, 17–21. [Google Scholar] [CrossRef]

Publisher’s Note: MDPI stays neutral with regard to jurisdictional claims in published maps and institutional affiliations. |
© 2022 by the authors. Licensee MDPI, Basel, Switzerland. This article is an open access article distributed under the terms and conditions of the Creative Commons Attribution (CC BY) license (https://creativecommons.org/licenses/by/4.0/).