Article

Optimization of Open-Access Optical and Radar Satellite Data in Google Earth Engine for Oil Palm Mapping in the Muda River Basin, Malaysia

1
GeoInformatic Unit, Geography Section, School of Humanities, Universiti Sains Malaysia, Penang 11800, Malaysia
2
College of Geography and Land Engineering, Yuxi Normal University, Yuxi 653100, China
3
College of Geography and Remote Sensing Sciences, Xinjiang University, Urumqi 830017, China
4
Department of Earth Sciences and Environment, Faculty of Science and Technology, Universiti Kebangsaan Malaysia, Bangi 43600, Malaysia
5
Centre for Environmental Sustainability and Water Security (IPASA), Universiti Teknologi Malaysia (UTM), Johor Bharu 81310, Malaysia
*
Author to whom correspondence should be addressed.
Agriculture 2022, 12(9), 1435; https://doi.org/10.3390/agriculture12091435
Submission received: 2 August 2022 / Revised: 3 September 2022 / Accepted: 5 September 2022 / Published: 10 September 2022

Abstract

:
Continuous oil palm distribution maps are essential for effective agricultural planning and management. Due to the significant cloud cover issue in tropical regions, the identification of oil palm from other crops using only optical satellites is difficult. Based on the Google Earth Engine (GEE), this study aims to evaluate the best combination of open-source optical and microwave satellite data in oil palm mapping by utilizing the C-band Sentinel-1, L-band PALSAR-2, Landsat 8, Sentinel-2, and topographic images, with the Muda River Basin (MRB) as the test site. The results show that the land use land cover maps generated from the combined images have accuracies from 95 to 97%; the best combination goes to Sentinel-1 and Sentinel-2 for the overall classification. Meanwhile, the best combination for oil palm classification is C5 (PALSAR-2 + Landsat 8), with the highest producer accuracy (96%) and consumer accuracy (100%) values. The combination of C-band radar images can improve the classification accuracy of oil palm, but compared with the combination of L-band images, the oil palm area was underestimated. The oil palm area had increased from 2015 to 2020, ranging from 10% to 60% across all combinations. This shows that the selection of optimal images is important for oil palm mapping.

1. Introduction

Global exports of oil palm products now exceed USD 30 billion per year [1]. In 2020, Malaysia exported about 17.40 Mt of oil palm to other countries, bringing about an export revenue of approximately USD 15 billion [2]. The oil palm industry contributes significantly to the GDP of Malaysia, but it has also led to widespread deforestation, which is considered a major threat to global warming and climate change. Accurate oil palm distribution maps are important sources for understanding oil palm plantation expansion trends, developing landscape-level planning [3], and assessing the impact of land-use shifts on basins. The increase in the oil palm planting area in the basin and the change in land use in the basin have significant impacts on water resources and climate [4,5]. Oil palm management has become the focus of local government departments, but traditional methods based on field surveys are uneconomical in terms of manpower and time. Using remote sensing technology to monitor and collect large-scale oil palm information is an effective means.
From the point of view of image selection, remote sensing technology has been used to monitor oil palm since the 1990s [6]. Many scholars have employed multi-source remote sensing data to construct oil palm distribution maps from different times, spaces, and resolutions [6,7,8]. To address the obstacle of poor image quality caused by frequent cloudiness in the tropics, combining optical images with SAR images for oil palm mapping is a common effective way to make the accuracy of oil palm mapping better in the humid tropics [7,8,9,10]. In Malaysia, Cheng et al. [11] used Landsat and PALSAR to map oil palm, focusing on evaluating the impacts of different classifiers, locations, and assessment methods. Mohd Najib et al. [9] used Landsat and ALOS images to generate an oil palm map in Malaysia and found that the extracted area of oil palm was slightly higher than the statistical data. Oon et al. [10] showed that L-band and C-band radar images outperformed other sensors in the tropics to effectively distinguish between large oil palm plantations and small farm oil palms in the peatland region of Peninsular Malaysia. However, the effects of different optical and radar imagery combinations on oil palm mapping, particularly open-source data within the Google Earth Engine (GEE) platform, were less considered in previous studies. In fact, comprehensive monitoring of oil palm expansion requires data from multiple satellite sensors [12].
GEE is a cloud-based computing platform that integrates enormous geospatial data with corresponding visualization and analysis-computing capabilities. The platform provides multi-source remote sensing, such as Landsat TM/OLI, Sentinel-1/2, and MODIS on a global scale (at different scales). The data reach petabyte-level capacities, with more than 200 public datasets and over 5 million remote sensing images [13]. Compared with local operations, it is easier to perform large-scale and global-level analyses [14]. Researchers have applied GEE to various fields, mainly monitoring the changes in forests [15], aridity [16], surface water [17], floods [18,19], crops [20], and aquaculture ponds [21].
Using open-source satellite image data and powerful computing power provided by the GEE platform [13,22], acquiring more accurate oil palm coverage at low costs in developing countries has become possible [23,24,25]. Some scholars have utilized the GEE platform to combine multi-source images into one image as the input data to obtain the oil palm distribution map. For example, Sarzynski et al. [7] used GEE to integrate radar and optical images to obtain oil palm in Sumatra, and the findings revealed that the combination of optical and radar data was superior to using optical only or radar data. Considering the characteristics of different ground objects in multi-source images, some scholars combined multi-source image data to obtain more information on the oil palm estates. Danylo et al. [3] used Sentinel-1 data to acquire the oil palm farm location but the age of the oil palm plantation was calculated using Landsat images. To tackle the problem of missing data, some scholars have used the sensor data emitted from different periods to study long-term oil palm changes. De Alban et al. [26] combined Landsat and L-Band SAR data to map tropical landscapes for land cover classification and change detection. The results showed that, compared to single sensor imagery precision, the combined imagery could obtain from 92.96 to 93.83% of the overall classification. Because different factors and purposes can affect the accuracies of oil palm classification results, there are no single types of data applicable to all oil palm regions [27].
The Muda River Basin (MRB) is an important source of freshwater supply for the northern states in Malaysia; hence, it is critical to study the influence of land use changes, including oil palm expansion on the climate and environment. There are few literature studies on oil palm identification and extraction in tropical river basins, i.e., Tan et al. [5] improved the European Space Agency (ESA) land cover products to research the influence of oil palm expansion on the hydrological cycle in the MRB, whereas Kang and Kanniah [4] utilized GEE to analyze the impact of land use land cover (LULC) on river morphology in the Johor River Basin in the southern part of Peninsular Malaysia. However, the assessment of the synergistic effects of different types of satellite images within GEE in oil palm mapping is limited; hence this study aimed to evaluate the effects of the L-band radar image, C-band radar image, and optical image combinations on the LULC classification, focusing on the oil palm distribution. This study considered the MRB as the research object and used GEE to identify oil palm plantation areas within the basin. It was selected due to its important role in serving ecological protection, flood control, and food security in northern Peninsular Malaysia. The research findings can be helpful to researchers or oil palm managers from other tropical countries to produce better oil palm distribution maps for their estate planning and management.

2. Materials and Methods
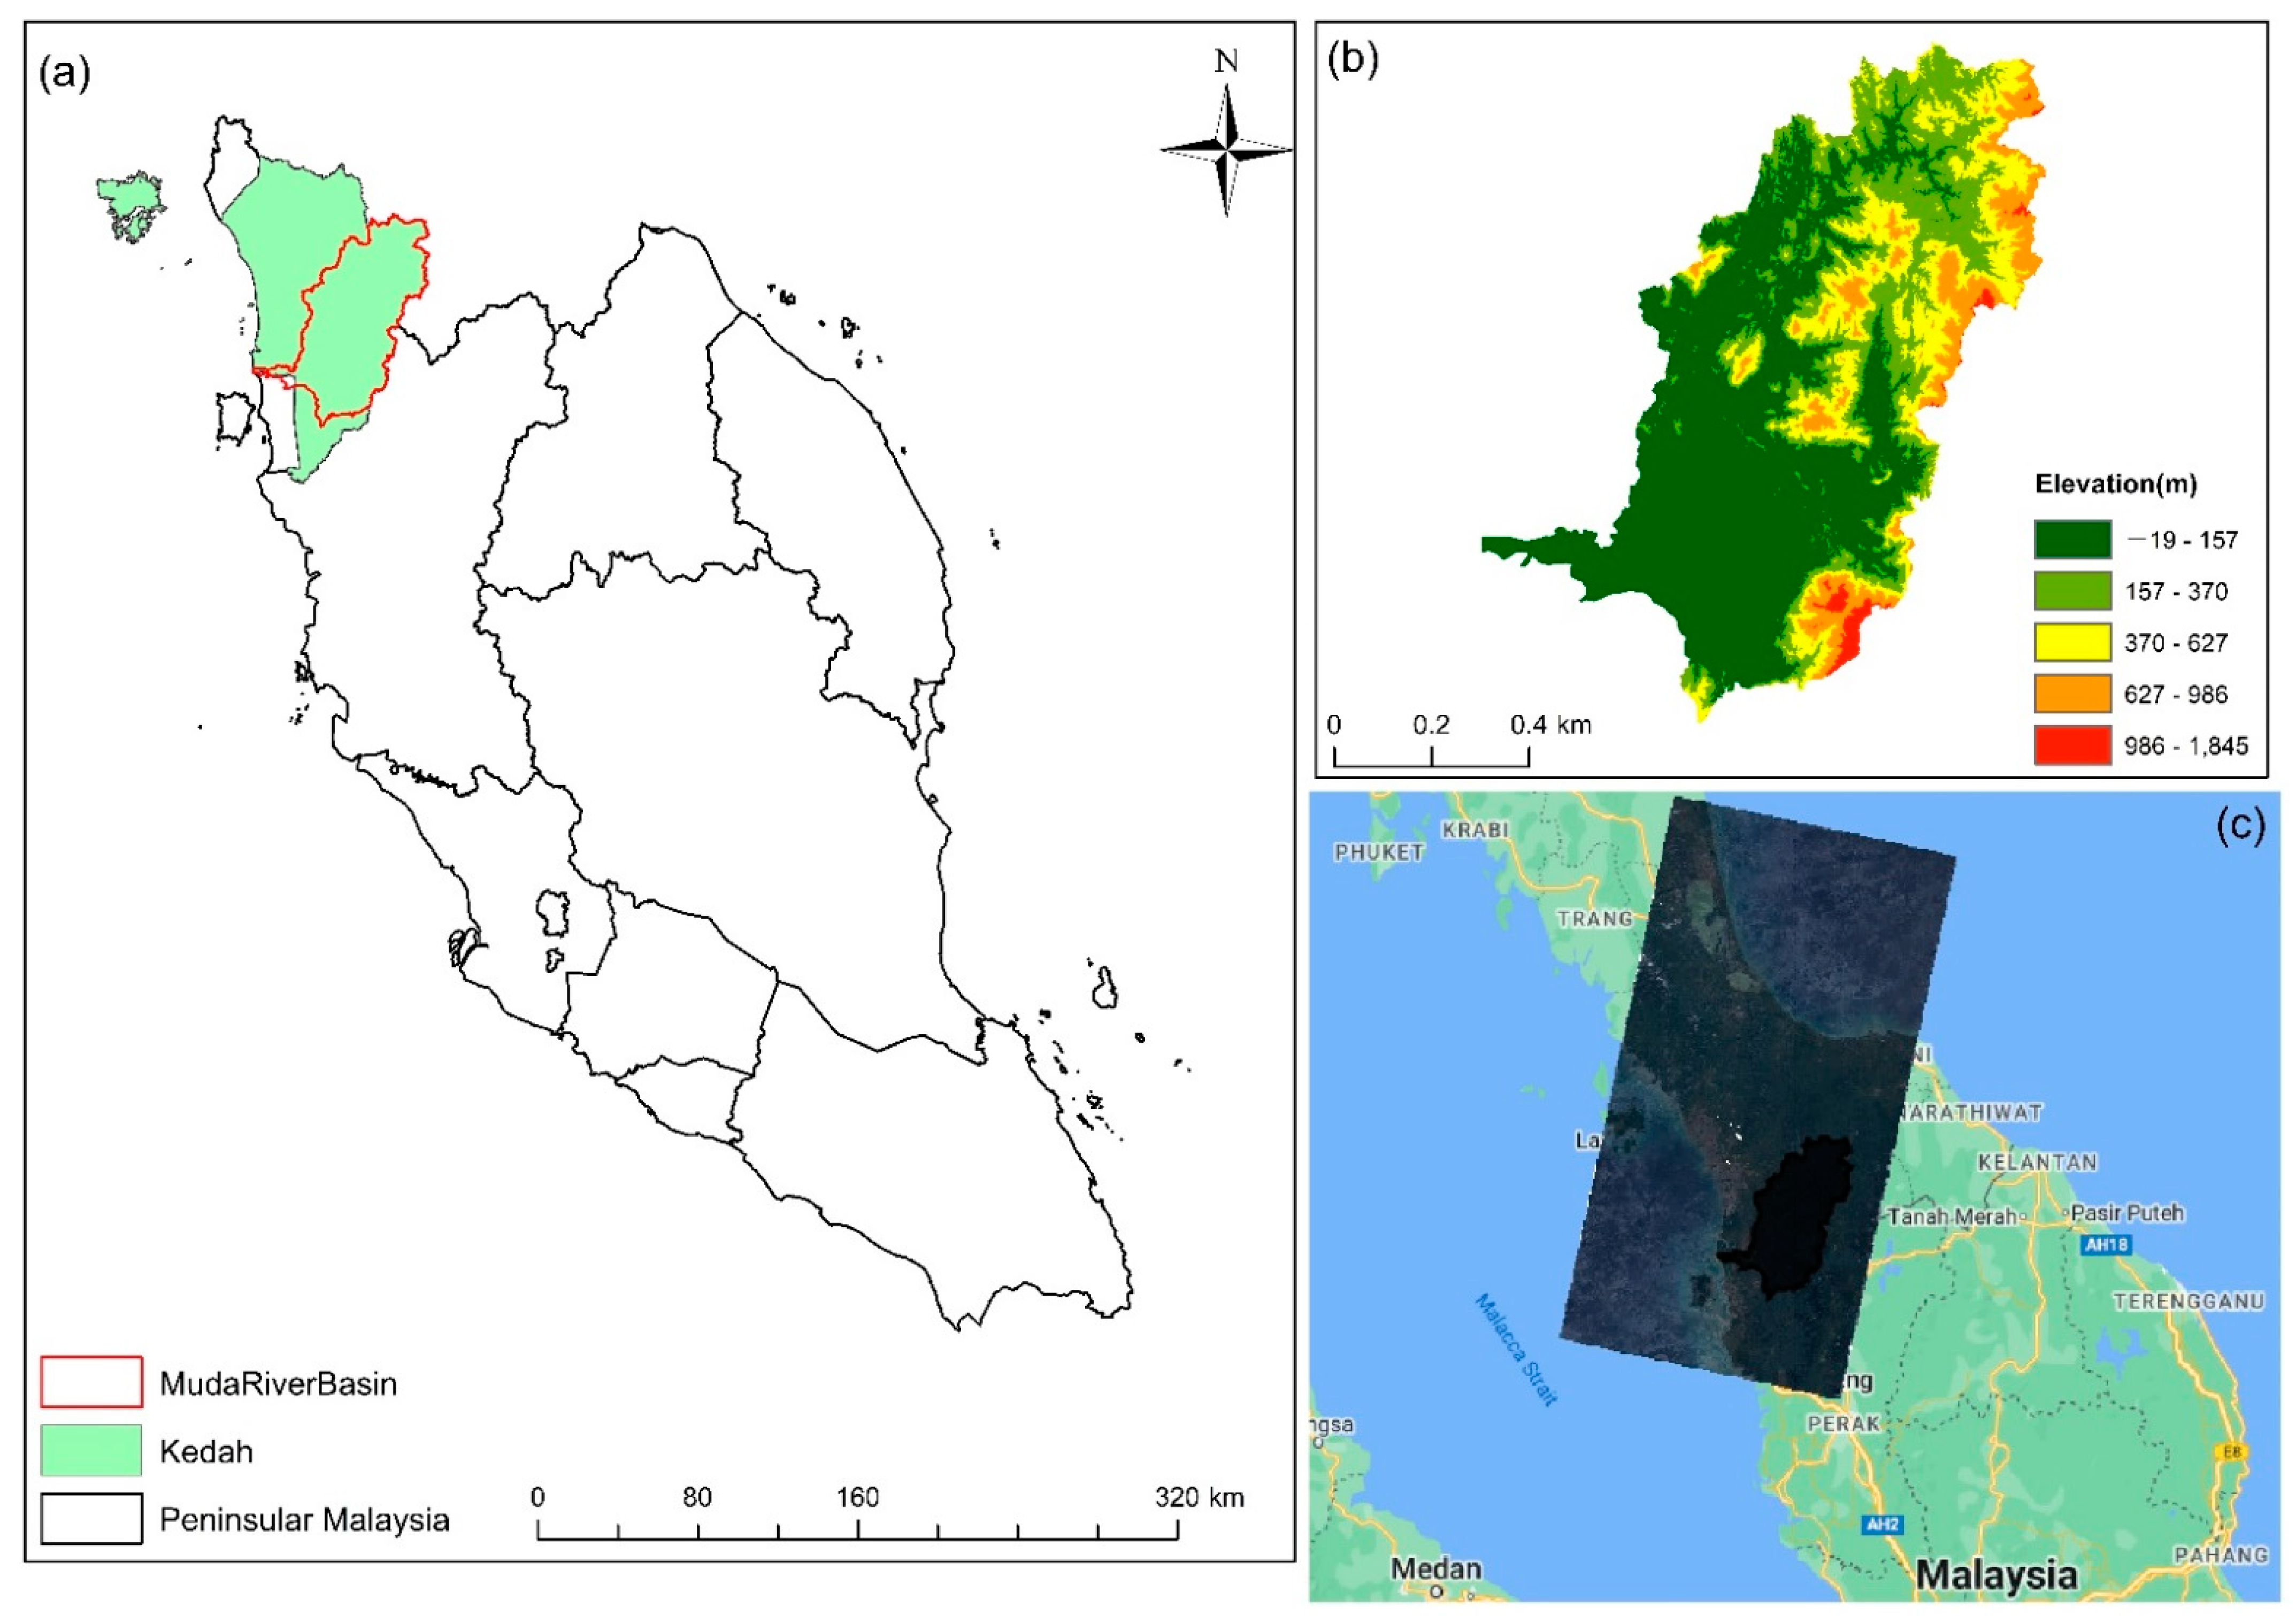
2.1. Study Area

The Muda River is located between 5°20′–6°20′ latitude and 100°20′–101°20′ longitude, its drainage area is about 4111 square kilometers, and its elevation range is −19–1845 m (Figure 1). The Muda River is the main river in Kedah, providing Kedah and Penang with fresh water for domestic, industrial, and agricultural uses [5]. The basin is dominated by forest, followed by rubber and oil palm plantations, and is the main rice-growing area in Malaysia [5]. The area of oil palm in the basin has altered considerably during the previous two decades. Taking the basin as the study object, it may better represent the applicability and application potential of the combined image method in the basins with large differences in land cover types. Figure 1 shows the location of the basin.

2.2. Satellite Data

Landsat 8 imagery, Sentinel-2 imagery, Sentinel-1 imagery, ALOS PALSAR-2 imageries that are available in the GEE platform were used to classify and evaluate the oil palm changes of MRB from 2015 to 2020. The Landsat imagery, developed by NASA and USGS, images the whole Earth at a resolution of 30 m approximately every two weeks [28]. Sentinel-2 is a European Space Agency (ESA) multispectral imaging satellite that was launched in 2015. It consists of two satellites, 2A and 2B, with ground resolutions of 10, 20, and 60 m, respectively [29]. The PALSAR-2 yearly mosaic data were seamless global SAR images, 25 m resolution, created by stitching PALSAR-2 SAR images [30], and calling the HH and HV bands. The Sentinel-1 satellite with 10 m resolution was also obtained from the ESA and provided SAR images with high temporal and spatial resolutions. The 30 m spatial resolution Space Shuttle Radar Topographic Mapping Mission (STRM) elevation data [31] were imported. Through the GEE code editing platform, the 223 Sentinel-2, 29 Sentinel-1, and 43 Landsat 8 satellite images of the MRB in 2020 were aggregated into one image, respectively, and re-encoded to a resolution of 30 m. The aggregated imagery was used to generate the MRB 2020 LULC map. The image property values are displayed in Table 1.

2.3. Preprocessing of Data

2.3.1. Preprocessing of Landsat 8 and Sentinel-2

First, the 2015 and 2020 Landsat 8 imagery were directly selected through the GEE platform. We selected six bands for analysis, including blue (B2), green (B3), red (B4), near-infrared (B5), shortwave infrared 1 (B6), short infrared 2 (B7), and thermal infrared 2 (B11) with a resolution of 30 m. We modified the code from Sarzynski et al. [7] to perform cloud detection, cloud masking, and cloud shadow pre-processing on the Landsat 8 images to build a simple cloud-free Landsat composite image. A simple composite method (used to select a subset of the scene at each location) converted it to top-of-atmosphere (TOA) reflectance. Lastly, a simple cloud score was used to obtain the median of the fewest cloud pixels.
Sentinel-2 images available on the GEE platform included both surface reflection and TOA products. We employed TOA, multispectral instrumentation, and Level-1C images to reduce the radiometric differences between Landsat 8 and Sentinel-2 images. Sentinel-2 has many spatial resolutions. Four 10 m resolution bands (blue B2, green B3, red B4, and near-infrared B8), and six 20 m resolution bands, comprising four red edges (B5, B6, B7, and B8A), two short-wave infra-red (B11 and B12), were chosen for this study.

2.3.2. Preprocessing of PALSAR-2 and Sentinel-1

The phased array L-band synthetic aperture radar - 2 (PALSAR-2) images were obtained from the Japan Aerospace Exploration Agency (JAXA) through the GEE platform. These data have been successfully used in previous studies [7,32]. The HH and HV channels of the raw SAR images were first smoothed using a 3 × 3 refined Lee filter, which also helped to reduce the scatter effect. Digital numbers (DN) of the HH and HV images were then converted to normalized radar backscattered coefficients ( σ ° in decibels (dB)), following Equation [33]:   σ ° = 10 × log 10 ( DN 2 ) + CF , where CF stands for the absolute calibration factor of −83 dB.
The Sentinel-1 images for this study were preprocessed by the Google Earth team, which included the removal of the thermal noise, radiometric calibration, and terrain correction [34]. The backscatter coefficient ( σ °) of the image is in decibels (dB). We utilized the ground range detected (GRD) product. Vertical transmit–vertical receive (VV) and horizontal receive (VH) dual bands are explicitly referred to as the available polarization bands; the interferometric wide swath acquisition mode was selected.

2.4. Spectral and SAR Indices

Normalized difference vegetation index (NDVI) [24,35], normalized difference water index (NDWI) [24,36], and enhanced vegetation index (EVI) [7,8] are common spectral indices used to improve oil palm classification in optical images. These three indices mainly enhance the ability to discriminate between vegetation and non-vegetation. NDVI has the benefit of being sensitive to chlorophyll concentration and green leaf density and can be used to extract information on ground green vegetation. NDWI and EVI enhanced the identification of deciduous rubber plantations, oil palm, and forests [36,37,38]. We calculated these three optical indices using the pre-processed optical images Landsat 8 and Sentinel-2 images, then merged them with the images to participate in the subsequent classification.
Textural information, such as canopy shape and size, plays an important role in oil palm classification due to the unique plant texture [3,39]. Complementing the information obtained from the SAR channel [3,40], texture measurements were performed in GEE using gray-level co-occurrence matrix (GLCM) texture functions from the average directional bands inside a 3 × 3 neighborhood range. Texture measurements add information to distinguish land cover and improve the classification accuracy for broad land cover types [41]. GLCM texture metrics include arc second moment (ASM), average (AVG), contrast (CON), correlation (COR), dissimilarity (DIS), entropy (ENT), inverse difference moment (IDM), and variance (VAR). Using raw SAR backscatter coefficients, four metrics were calculated to increase the level of information and enhance classification, including average (AVE), difference (DIF), and a simple ratio of HH and HV channels (RAT1 and RAT2). These four indicators have good accuracy in distinguishing the forest from non-forest, coconut trees, oil palm, and rubber trees [26]. Furthermore, they improved the mapping of a broad range of land cover types, including farmland, forests, built-up areas, and water [42,43]. Oil palm, rubber, and other plantations can be distinguished well by DIF [44]. In this work, these 12 indices were computed from the pre-processed SAR images (PALSAR-2 and Sentinel-1) using GEE, as supplemental information for the oil palm classification. Table 2 displays the specific formulas.

2.5. Training and Validation Sample Data

As indicated in Figure 2, the land cover in the study area was classified into six categories: forest (FRSE), urban (URBN), water (WATR), oil palm (OILP), rubber (RUBR), and rice (RICE). A total of 30–50 training samples were chosen for each class for the land cover classification [45]. The time axes of image browsing on the Google Earth Pro platform were set to 2015 and 2020, respectively. A total of 840 samples were randomly selected from the high-definition images and field experiences on the crop characteristics for both 2015 (420 samples) and 2020 (420 samples) [46,47]. We randomly selected 70% to train the classifier and 30% to validate the classification map from the total samples. The distributions of sample data of the basins in 2015 and 2020 are illustrated in Figure 2.

2.6. Methods

2.6.1. Land Cover Land Use Mapping

Optical and radar satellite imageries were used to produce (1) a detailed 30 m resolution LULC map in 2020 corresponding to eight data combinations for producing six LULC categories, and (2) a LULC map from 2015 using the best combination identified from the 2020 map to study the oil palm expansion. The overall workflow consists of four main stages—data source selection, data combination optimization, accuracy assessment, and variation analysis.
The Landsat 8 and Sentinel-2, Sentinel-1 images were first analyzed to select suitable images for analysis and preprocessing. Second, this study adopted pixel-based supervised classification, i.e., random forest (RF), as the classifier, to classify the chosen images. To build the final training and validation samples, we selected training samples based on the Google Earth Pro map visualization interface and on-site sampling. Third, the classification outcomes of diverse data combinations were assessed using the accuracy assessment criteria. Accuracy assessment approaches included three prominent metrics, overall accuracy (OA), producer accuracy (PA), and consumer accuracy (CA), retrieved from confusion matrix reports, as well as kappa coefficients from statistical methods [48]. Finally, the various radar images and optical images provided by GEE for oil palm classification were analyzed. The specific research process is shown in Figure 3.
The RF algorithm is a multi-decision tree classification method that uses an ensemble [49], in which boosting and bagging are the two major techniques used for resolving the classification issue of satellite image pixels. The random forest decision tree model is built by randomly extracting sample data and feature quantities [26]. RF algorithms, due to their high classification accuracies and good anti-noise performances, are frequently utilized in remote sensing image classification [50]. The accuracy of RF classification is determined by two parameters: the number of trees (Ntree) and the number of features (Mtry) [4].
Typically, a sensitivity test is used to determine the size of the Ntree, which may be made as big as possible to successfully prevent overfitting [4]. The Ntree for the RF classifier of this study was fixed to 30 after referring to the study by Shaharum et al. [24], the number of samples in MRB, and the comparison between 30 and 100. Basically, the classification results between 30 and 100 Ntree did not show much difference. The Mtry is more sensitive to classification accuracy than the Ntree; a smaller Mtry will increase speed but decrease classification accuracy [50]. The maximum Mtry in the 8 combined datasets in this study was 36, and the number of variables per split was set to the default value, which was based on the square root of the total number of features.
Previous studies have shown that OA, PA, and CA are often used to assess the accuracy [26,51], and the magnitude directly reflects the classification accuracy. Kappa statistics may also be used to assess the accuracy of classification results [49,52]. In our study, two evaluation methods were used simultaneously [34,52,53].

2.6.2. Image Composition Creation

Based on the literature review on oil palm mapping using the GEE platform, several commonly used optical and radar images were selected to create eight datasets on these images. For example, topographic data, such as slope, aspect, and elevation, provide rich features for oil palm classification to increase the probability of extracting oil palm from forest distributions [36,54]. Therefore, the terrain information elevation was added to all combined images.
Eight combinations, as listed in Table 3, were formed to analyze the accuracy of oil palm extraction. C1 is composed of the PALSAR-2 image and the derived exponential band, C2 is composed of the Sentinel-1 image and the derived exponential band, and C3 and C4 represent Sentinel-2 and Landsat 8 and their derived exponential bands, respectively. C5 and C6 represent the combination of radar image PALSAR-2 and optical images (Landsat 8 and Sentinel-2) and derived exponential bands, respectively. C7 and C8 represent the combination of radar image Sentinel-1 and optical image (Landsat 8 and Sentinel-2) and derived exponential bands, respectively. The GEE codes are available as Supplementary Material Code S1.

2.6.3. Oil Palm Area Change

The LULC maps generated from different combinations of images in 2015 and 2020 were post-processed, and the isolated pixel values were smoothed using the reduced neighborhood function in the 3 × 3 model in GEE. Then, we compared the difference between the local detailed map with the best classification effect and the high-definition base map image in ArcGIS. Finally, the LULC maps were divided into oil palm and non-oil palm in ArcGIS software and compared with the oil palm area of the basin generated by Xu et al. [6].

3. Results

3.1. Accuracy Assessment

Table 4 shows the results of optical, SAR, and combined classification for 2020. The differences between the OA and kappa coefficients of the radar image combinations C1(PLSAR2) and C1(S1) were 10 and 12%, which were much larger than the difference in the OA and kappa coefficient of the optical image combination of C3(S2) and C4 (L8) (1%). When radar information was added to the optical image, the OA and kappa coefficients of the combined radar and optical maps were higher than those of the single image combination, and the OA and kappa coefficients increased to more than 90% (C5—C8). C7 (S1 + S2) obtained the highest OA and kappa coefficient values, 97% and 97%, respectively, and the highest oil palm classifications were PA at 96% (C4, C5, C6, and C7) and CA at 100% (C5) (Table 4 and Figure 4).
Combined with 148 validation samples, including FRSE, URBN, WATR, OILP, RICE, and RUBR, we calculated the confusion matrix for eight combinations (Figure 5). There were misclassifications in all land categories in individual image dataset combinations (C1–C4). In the combined image dataset combinations (C5–C8), the error matrix of the C5 classification images showed that there were no misclassifications of FRSE, URBN, and WATR, and the three land types of OILP, RICE, and RUBR were misclassified into other land types. Rubber was mainly misclassified as FRSE and URBN, and a few oil palm pixels were misclassified into forest and rubber land cover categories.
The importance levels of the combining image variables in the random forest classifier are shown in Figure 6. Elevation was not only the most important variable in the classification of single-sensor composite images, but also ranked first in multi-sensor composite images, where it ranked fourth in C5 and C7, fifth in C6, and third in C8. Optical image band indices occupied important positions in the multi-sensor combinations; the three important variables in the C5 and C8 combinations were NDWI, B6, and B7. Meanwhile, B11, B12, NDVI, and NDWI were the four most important variables in the C6 and C7 combinations. Some variables, including DIF, HH_asm, HH_ent, RT1, RT2, HV_ent, and HV_asm only played minor roles in the combinations in which PALSAR-2 was involved.
Figure 7 illustrates in detail the LULC maps of MRB generated by different schemes. The C1, C2, C3, C4, C7, and C8 combinations show consistent land cover type patterns across all classifications, with the forest being the most dominant land cover type in the basin, followed by rubber. Forest patches are widely found in the upper reaches of the basin, rubber patches are largely dispersed in the center and west of the basin, and oil palm patches are distributed in the southwest of the basin.
The 2020 LULC detail map of MRB generated according to the C7 combination was enlarged and compared with the high-definition image of the same position (as shown in the rectangular box in Figure 8) to verify the classification effect. In Figure 8b, the boundaries of oil palm, forest, and rubber can be seen, in which a small amount of rubber and urban are mixed. However, in general, the forest, oil palm, and rubber areas have good coherence, and the boundaries between ground objects are clear, reflecting the better separation of ground objects. Figure 8d shows a very heterogeneous urban zone with mixed water, paddy fields, rubber, and oil palm, but the oil palm and rubber zones have good internal coherence and can also better reflect the boundaries of oil palm and rubber.

3.2. Oil Palm Area Changes

The 2015 and 2020 oil palm areas of the MRB generated by the eight combined images are shown in Table 5. The oil palm areas showed an increasing trend between 2015 and 2020, ranging from 10 to 60% across all combinations. For 2015, C6 (PALSAR-2 + S2) had the highest oil palm area at 475.81 km2, while for 2020, the image combination C4 (L8) had the highest oil palm area at 602. 9 1 km2. Comparing the oil palm area in 2015 and 2020 in the combination C7 (S1 + S2) with the highest classification accuracy, it was found that the oil palm area increased from 323.25 km2 to 465.73 km2 in the MRB, which was about 44%.
From Table 5, it is found that the oil palm area of the MRB in 2015 in the C7 (S1 + S2) combined map was 323.25 (km2), which underestimates the value reported by Xu et al. [6] of 598 km2. Compared with the LULC map generated in the same period [5], the distribution of various land types was consistent in terms of spatial distribution, but the oil palm area was underestimated by 8% when compared in terms of area.
Figure 9 shows the difference between the C7 (S1 + S2) LULC map and the oil palm distribution map generated by Xu et al. [6]. There were four cases in which (1) both were considered oil palm, (2) only the C7 combination was oil palm, (3) only the XU2020 was oil palm, and (4) both were considered a non-oil palm, respectively, as represented by agreement OILP, C7 OILP, XU OILP, and agreement NO OILP. In the MRB, the C7 LULC map was oil palm, but in XU2020 it was a non-oil palm, accounting for 1.81%, while the C7 LULC map was a non-oil palm, but in XU2020, oil palm accounted for 8.89%.

4. Discussion

In tropical regions, where frequent cloud cover results in poor image quality, the open-source data provided by the GEE platform (Landsat series, Sentinel series, and PALSAR yearly mosaic products) help to create high-quality LULC maps [39]. OA ranged from 73 to 97% across the eight combinations. Combination 1 (PALSAR-2) showed the lowest OA, while the other image combinations had accuracies higher than 80%. The possible reason is that the land cover classification system in this research belongs to the coarse classification system and only has six categories. Li et al. [55] compared ALOS PALSAR L-band and RADARSAT-2 C-band data for land cover classification in tropical regions and found that (whether it was L-band or C-band images) using a coarse classification system could improve the classification accuracy.
Due to the noise in radar imagery, together with the pixel confusion between oil palm and many other land cover types (bare ground, agricultural land), Cheng et al. [56] recommended not using the PALSAR images alone to distinguish oil palm from other LULC. The single radar image combination 1 (PALSAR-2) obtained the lowest classification accuracy (75%), which was close to other similar studies [7,55]. Li et al. [55] found that the L-band data were 72.2% accurate, while the C-band only provided 54.7%. In this study, the C-band radar image combination (C2) obtained a higher classification accuracy than the L-band radar image combination (C1). The possible reason is that the 10 m resolution S1 image increases the resolution of ground objects and improves the classification accuracy.
The appropriate choice of variables has a large impact on classification accuracy. Elevation was one of the most important variables in all of the data sets in this study. As elevation and land cover types are uniformly distributed, with most oil palms growing on flat and low elevation sites [57], elevation helps to distinguish oil palms from bare ground and agricultural land. Elevation in combination with other data can be effective in detecting oil palms [54]. C1 and C2 have the same number of variables, but the classification accuracy varies greatly. The possible reason for this is that there is interference between the redundant variables, which reduces the classification accuracy.
Textural features have strong additional roles in distinguishing oil palm, rubber, and forest while improving the overall classification accuracy. According to Torbick et al. [27], textural information can effectively capture the differences between plantation and natural forest based on canopy, spacing, and structure, which helps distinguish oil palm and rubber plantations from other forms of LULC. Rakwatin et al. [40] found that adding textural information to radar imagery increased the classification accuracy of forest mapping in tropical forests in central Sumatra, Indonesia, by 10%. However, this study also found that the accuracy improvement of the combined image (by texture features) was smaller than that of the SAR image, which was similar to the findings reported by De Alban et al. [26].
Sentinel-2 images and Landsat 8 have similar spectral bands, with the former having four red-edge bands. Generally, the OA obtained from Sentinel-2 is higher than Landsat 8 due to its higher spatial resolution and smaller cloud percentage [58,59]. Nurmasari et al. [58] compared Sentinel-2 and Landsat 8 optical images in the detection of oil palm plantations in Indonesia and found that Sentinel-2 had a higher classification accuracy than Landsat 8. Zeng et al. [59] used Sentinel-2 and Landsat 8 images to obtain land use maps of the Johor River Basin in Malaysia, they found that the classification accuracy of Sentinel-2 was 3% higher than that of Landsat 8. In this study, the accuracy of Sentinel 2 was only 1% higher than that of Landsat 8 images. One possible reason might be due to the high cloud coverage in tropical regions, where cloud removal will cause poor image quality for both Sentinel-2 and Landsat 8 images.
GEE provides thousands of data types, including data from different sensor types, different resolutions, and different characteristic themes. For specific species in specific regions, it is crucial to choose the appropriate combination of images. Our results showed that the classification accuracy of the multi-source imagery combination (C5–C8) is higher than that of the single radar imagery combination (C1 and C2) and the single optical imagery combination (C3 and C4), which is consistent with [7,8,26]. Radar images provide images through their radiation (which can penetrate clouds), and provide information through backscattered energy, which has a bigger influence on the identification accuracy of oil palm.
The detection accuracy rate for oil palm plantations has been maintained at about 90% [60]. The OA of the multi-source image combination (C5–C8) in this study was greater than 90%, mainly because the optical image could identify different land cover categories through the reflected energy and spectral characteristics of the band, and the increase of the near-infrared and spectral index improved the contrast. Distinguishing oil palm from the background is consistent with [36,61]. The combination of radar imagery and optical imagery can overcome the cloudy obstacles in tropical regions where oil palm is mainly grown; this combination technique can improve the classification accuracy (Table 4), which is similar to previous studies [7,9].
The classification accuracies for C5, C6, C7, and C8 only have slight differences. The C-band radar image and optical image combinations (C7, C8) all have higher classification accuracies than the combination of the L-band radar image and optical image. In tropical climate regions, owing to cloudy conditions, the accuracy of radar contributes more than that of optical. Although the best combination was Sentinel-1 and Sentinel-2, the best combination for oil palm classification was C5 (PALSAR-2 + Landsat 8) to obtain the best PA (96%) and CA (100%). The OA was consistent between C5 and C8, but the difference in classification accuracy was greater for oil palm. L-band radar is regarded as the most effective method for mapping forest vegetation and oil palm because it can penetrate the tree canopy and provide information on the structure under the tree canopy [62].
Compared with Xu et al. [6], our combined map has higher resolution and classification accuracy. All radar images were resampled to 30 m to match the resolution of Landsat 8. To match MODIS data, Xu et al. [6] generated an oil palm area with a 100 m resolution dataset (AOPD) with an accuracy of 86.61%. The oil palm area was underestimated in all four combined maps compared to Xu et al. [6]. The main reason is that the effectiveness of SAR data for the detection of mature oil palms was confirmed using a combination of optical and radar image data [44], but the backscatter characteristics of some young oil palms (similar to the bare ground) were misjudged as bare land [63], so the area of urban increased, thus underestimating the area of oil palm. Combination 6 (S2 + P LSAR-2) and Xu2020 had the closest oil palm area in this study, as both used L-band radar images. With the advent of high-resolution C-band radar images, Dong et al. [42] discovered that the complementarity of C-band and L-band radar images enhanced the classification accuracy. In this study, S1 images were used for combination 7 (S1 + L8) and combination 8 (S1 + S2); the oil palm areas generated by these two combination maps were closer in 2020.
When the same classification method and data combination are used in basins with large differences in land coverage, the rational selection of samples plays a key role in the classification results, and a good sample selection method can improve the accuracy of land classification [64,65]. Poortinga et al. [8] mapped the Myanmar plantations with systematic error quantification by combining Landsat-8, Sentinel-2, and Sentinel-1 images; filtering the validation points, the classification accuracy could reach 91% from 84%. In this study, 420 samples were selected in 2015 and 2020 from the basin, respectively, as shown in Figure 2. The samples were all from Google Earth Pro high-definition images (2015) and field surveys (2020), which ensured the quality of the samples. However, because the spectral characteristics of the rubber and forests are close to those of oil palm, and some newly planted oil palms and paddy fields have similar spectral characteristics, the area of rubber and paddy fields increased in the LULC maps of the basin.

5. Conclusions

This paper presents an attempt to map oil palm in a tropical river basin using open-source data within Google Earth Engine (GEE). Based on the open-source satellite images, i.e., 30-m Landsat 8 imagery, 20-m Sentinel-2 imagery, 10-m Sentinel-1, and PLSAR2 radar data, we obtained a series of oil palm distribution maps with over 90% accuracy. The same conclusion was reached as with most studies; that is, the accuracy of LULC maps obtained by a single image combination in this study was lower than that of a multi-source data combination. The combination of Sentinel-1 and Sentinel-2 achieved the greatest OA (97%) and kappa (97%), although the extracted oil palm area was the lowest among all multi-source imagery combinations.
The L-band radar image (PLSAR2) played a different role in the oil palm classification process than the C-band radar image (Sentinel-1), according to the accuracy analysis of the classification results. The homogeneity of the classification map obtained by the combination of L-band radar images was better, and the oil palm area was nearest to the oil palm area obtained from [6]. The growth rate of the oil palm area extracted by each combination varied greatly between 2015 and 2020, ranging from 10 to 60%. There is a trend in multi-source remote sensing imagery (in oil palm mapping) to better understand the differences in oil palm extraction from multi-source remote sensing image combinations, to select the most optimal data combination to generate the oil palm distribution map, which will lead to a rational analysis of oil palm in the basin (as an effective means of changing trends).

Supplementary Materials

Code S1: Link to Google Earth Engine repository https://code.earthengine.google.com/?accept_repo=users/zengju926/MUDA_OIL_PALM (accessed on 1 September 2021).

Author Contributions

Conceptualization, M.L.T. and J.Z.; methodology, J.Z. and Y.L.T.; validation, J.Z. and Y.L.T.; formal analysis, J.Z. and Y.L.T.; resources, M.L.T.; writing—original draft preparation, J.Z.; Writing—review and editing, M.L.T., F.Z., T.W., N.S., F.T. and Z.Y.; supervision, M.L.T. and N.S.; project administration, M.L.T.; funding acquisition, M.L.T., T.W. and F.T. All authors have read and agreed to the published version of the manuscript.

Funding

This study was supported by the Ministry of Higher Education Malaysia under the long-term research grant scheme project 2, grant number LRGS/1/2020/UKM-USM/01/6/2, which is under the program of LRGS/1/2020/UKM/01/6. This study was supported in part by the Special Basic Cooperative Research Programs of Yunnan Provincial Undergraduate Universities’ Association under grant 202001BA07001-109.

Institutional Review Board Statement

Not applicable.

Data Availability Statement

The final land use products are available upon request from the corresponding author.

Acknowledgments

The authors would like to thank the developers of GEE, Sentinel, Landsat, PALSAR, and SRTM for offering a free cloud computing platform and satellite data to the general public.

Conflicts of Interest

The authors declare no conflict of interest.

References

  1. FAO. Food and Agriculture Organization of the UN. Available online: https://www.fao.org/faostat/en/#data (accessed on 1 May 2022).
  2. MPOB. Malaysian Palm Oil Board (MPOB). Available online: https://bepi.mpob.gov.my/index.php/en/ (accessed on 1 May 2022).
  3. Danylo, O.; Pirker, J.; Lemoine, G.; Ceccherini, G.; See, L.; McCallum, I.; Hadi; Kraxner, F.; Achard, F.; Fritz, S. A map of the extent and year of detection of oil palm plantations in Indonesia, Malaysia and Thailand. Sci. Data 2021, 8, 96. [Google Scholar] [CrossRef]
  4. Kang, C.S.; Kanniah, K.D. Land use and land cover change and its impact on river morphology in Johor River Basin, Malaysia. J. Hydrol. Reg. Stud. 2022, 41, 101072. [Google Scholar] [CrossRef]
  5. Tan, M.L.; Tew, Y.L.; Chun, K.P.; Samat, N.; Shaharudin, S.M.; Mahamud, M.A.; Tangang, F.T. Improvement of the ESA CCI Land cover maps for water balance analysis in tropical regions: A case study in the Muda River Basin, Malaysia. J. Hydrol. Reg. Stud. 2021, 36, 100837. [Google Scholar] [CrossRef]
  6. Xu, Y.; Yu, L.; Li, W.; Ciais, P.; Cheng, Y.; Gong, P. Annual oil palm plantation maps in Malaysia and Indonesia from 2001 to 2016. Earth Syst. Sci. Data 2020, 12, 847–867. [Google Scholar] [CrossRef]
  7. Sarzynski, T.; Giam, X.; Carrasco, L.; Lee, J.S.H. Combining Radar and Optical Imagery to Map Oil Palm Plantations in Sumatra, Indonesia, Using the Google Earth Engine. Remote Sens. 2020, 12, 1220. [Google Scholar] [CrossRef]
  8. Poortinga, A.; Tenneson, K.; Shapiro, A.; Nquyen, Q.; San Aung, K.; Chishtie, F.; Saah, D. Mapping Plantations in Myanmar by Fusing Landsat-8, Sentinel-2 and Sentinel-1 Data along with Systematic Error Quantification. Remote Sens. 2019, 11, 831. [Google Scholar] [CrossRef]
  9. Mohd Najib, N.E.; Kanniah, K.D.; Cracknell, A.P.; Yu, L. Synergy of Active and Passive Remote Sensing Data for Effective Mapping of Oil Palm Plantation in Malaysia. Forests 2020, 11, 858. [Google Scholar] [CrossRef]
  10. Oon, A.; Ngo, K.D.; Azhar, R.; Ashton-Butt, A.; Lechner, A.M.; Azhar, B. Assessment of ALOS-2 PALSAR-2L-band and Sentinel-1 C-band SAR backscatter for discriminating between large-scale oil palm plantations and smallholdings on tropical peatlands. Remote Sens. Appl. Soc. Environ. 2019, 13, 183–190. [Google Scholar] [CrossRef]
  11. Cheng, Y.; Yu, L.; Cracknell, A.P.; Gong, P. Oil palm mapping using Landsat and PALSAR: A case study in Malaysia. Int. J. Remote Sens. 2016, 37, 5431–5442. [Google Scholar] [CrossRef]
  12. Gutiérrez-Vélez, V.H.; DeFries, R. Annual multi-resolution detection of land cover conversion to oil palm in the Peruvian Amazon. Remote Sens. Environ. 2013, 129, 154–167. [Google Scholar] [CrossRef]
  13. Gorelick, N.; Hancher, M.; Dixon, M.; Ilyushchenko, S.; Thau, D.; Moore, R. Google Earth Engine: Planetary-scale geospatial analysis for everyone. Remote Sens. Environ. 2017, 202, 18–27. [Google Scholar] [CrossRef]
  14. Tamiminia, H.; Salehi, B.; Mahdianpari, M.; Quackenbush, L.; Adeli, S.; Brisco, B. Google Earth Engine for geo-big data applications: A meta-analysis and systematic review. ISPRS J. Photogramm. Remote Sens. 2020, 164, 152–170. [Google Scholar] [CrossRef]
  15. Chen, B.; Xiao, X.; Li, X.; Pan, L.; Doughty, R.; Ma, J.; Dong, J.; Qin, Y.; Zhao, B.; Wu, Z. A mangrove forest map of China in 2015: Analysis of time series Landsat 7/8 and Sentinel-1A imagery in Google Earth Engine cloud computing platform. ISPRS J. Photogramm. Remote Sens. 2017, 131, 104–120. [Google Scholar] [CrossRef]
  16. Rembold, F.; Meroni, M.; Urbano, F.; Csak, G.; Kerdiles, H.; Perez-Hoyos, A.; Lemoine, G.; Leo, O.; Negre, T. ASAP: A new global early warning system to detect anomaly hot spots of agricultural production for food security analysis. Agric. Syst. 2019, 168, 247–257. [Google Scholar] [CrossRef]
  17. Pickens, A.H.; Hansen, M.C.; Hancher, M.; Stehman, S.V.; Tyukavina, A.; Potapov, P.; Marroquin, B.; Sherani, Z. Mapping and sampling to characterize global inland water dynamics from 1999 to 2018 with full Landsat time-series. Remote Sens. Environ. 2020, 243, 111792. [Google Scholar] [CrossRef]
  18. Coltin, B.; McMichael, S.; Smith, T.; Fong, T. Automatic boosted flood mapping from satellite data. Int. J. Remote Sens. 2016, 37, 993–1015. [Google Scholar] [CrossRef]
  19. Tew, Y.L.; Tan, M.L.; Juneng, L.; Chun, K.P.; Hassan, M.H.b.; Osman, S.b.; Samat, N.; Chang, C.K.; Kabir, M.H. Rapid Extreme Tropical Precipitation and Flood Inundation Mapping Framework (RETRACE): Initial Testing for the 2021–2022 Malaysia Flood. ISPRS Int. J. Geo-Inf. 2022, 11, 378. [Google Scholar] [CrossRef]
  20. Dong, J.; Xiao, X.; Menarguez, M.A.; Zhang, G.; Qin, Y.; Thau, D.; Biradar, C.; Moore, B., 3rd. Mapping paddy rice planting area in northeastern Asia with Landsat 8 images, phenology-based algorithm and Google Earth Engine. Remote Sens Env. 2016, 185, 142–154. [Google Scholar] [CrossRef]
  21. Tew, Y.L.; Tan, M.L.; Samat, N.; Chan, N.W.; Mahamud, M.A.; Sabjan, M.A.; Lee, L.K.; See, K.F.; Wee, S.T. Comparison of Three Water Indices for Tropical Aquaculture Ponds Extraction using Google Earth Engine. Sains Malays. 2022, 51, 369–378. [Google Scholar] [CrossRef]
  22. Amani, M.; Ghorbanian, A.; Ahmadi, S.A.; Kakooei, M.; Moghimi, A.; Mirmazloumi, S.M.; Moghaddam, S.H.A.; Mahdavi, S.; Ghahremanloo, M.; Parsian, S.; et al. Google Earth Engine Cloud Computing Platform for Remote Sensing Big Data Applications: A Comprehensive Review. IEEE J. Sel. Top. Appl. Earth Obs. Remote Sens. 2020, 13, 5326–5350. [Google Scholar] [CrossRef]
  23. Lee, J.S.H.; Wich, S.; Widayati, A.; Koh, L.P. Detecting industrial oil palm plantations on Landsat images with Google Earth Engine. Remote Sens. Appl. Soc. Environ. 2016, 4, 219–224. [Google Scholar] [CrossRef]
  24. Shaharum, N.S.N.; Shafri, H.Z.M.; Ghani, W.A.W.A.K.; Samsatli, S.; Al-Habshi, M.M.A.; Yusuf, B. Oil palm mapping over Peninsular Malaysia using Google Earth Engine and machine learning algorithms. Remote Sens. Appl. Soc. Environ. 2020, 17, 100287. [Google Scholar] [CrossRef]
  25. Puttinaovarat, S.; Horkaew, P. Oil-Palm Plantation Identification from Satellite Images Using Google Earth Engine. Int. J. Adv. Sci. Eng. Inf. Technol. 2018, 8, 720–726. [Google Scholar] [CrossRef]
  26. De Alban, J.; Connette, G.; Oswald, P.; Webb, E. Combined Landsat and L-Band SAR Data Improves Land Cover Classification and Change Detection in Dynamic Tropical Landscapes. Remote Sens. 2018, 10, 306. [Google Scholar] [CrossRef]
  27. Torbick, N.; Ledoux, L.; Salas, W.; Zhao, M. Regional Mapping of Plantation Extent Using Multisensor Imagery. Remote Sens. 2016, 8, 236. [Google Scholar] [CrossRef]
  28. Roy, D.P.; Wulder, M.A.; Loveland, T.R.; Woodcock, C.E.; Allen, R.G.; Anderson, M.C.; Helder, D.; Irons, J.R.; Johnson, D.M.; Kennedy, R.; et al. Landsat-8: Science and product vision for terrestrial global change research. Remote Sens. Environ. 2014, 145, 154–172. [Google Scholar] [CrossRef]
  29. van der Meer, F.D.; van der Werff, H.M.A.; van Ruitenbeek, F.J.A. Potential of ESA’s Sentinel-2 for geological applications. Remote Sens. Environ. 2014, 148, 124–133. [Google Scholar] [CrossRef]
  30. Shimada, M.; Itoh, T.; Motooka, T.; Watanabe, M.; Shiraishi, T.; Thapa, R.; Lucas, R. New global forest/non-forest maps from ALOS PALSAR data (2007–2010). Remote Sens. Environ. 2014, 155, 13–31. [Google Scholar] [CrossRef]
  31. Farr, T.G.; Rosen, P.A.; Caro, E.; Crippen, R.; Duren, R.; Hensley, S.; Kobrick, M.; Paller, M.; Rodriguez, E.; Roth, L.; et al. The Shuttle Radar Topography Mission. Rev. Geophys. 2007, 45, RG2004. [Google Scholar] [CrossRef]
  32. Miettinen, J.; Shi, C.; Liew, S.C. Towards automated 10–30 m resolution land cover mapping in insular South-East Asia. Geocarto Int. 2017, 34, 443–457. [Google Scholar] [CrossRef]
  33. Rosenqvist, A.; Shimada, M.; Ito, N.; Watanabe, M. ALOS PALSAR: A Pathfinder Mission for Global-Scale Monitoring of the Environment. IEEE Trans. Geosci. Remote Sens. 2007, 45, 3307–3316. [Google Scholar] [CrossRef]
  34. Carrasco, L.; O’Neil, A.; Morton, R.; Rowland, C. Evaluating Combinations of Temporally Aggregated Sentinel-1, Sentinel-2 and Landsat 8 for Land Cover Mapping with Google Earth Engine. Remote Sens. 2019, 11, 288. [Google Scholar] [CrossRef]
  35. Nomura, K.; Mitchard, E. More Than Meets the Eye: Using Sentinel-2 to Map Small Plantations in Complex Forest Landscapes. Remote Sens. 2018, 10, 1693. [Google Scholar] [CrossRef]
  36. Li, W.; Fu, D.; Su, F.; Xiao, Y. Spatial–Temporal Evolution and Analysis of the Driving Force of Oil Palm Patterns in Malaysia from 2000 to 2018. ISPRS Int. J. Geo-Inf. 2020, 9, 280. [Google Scholar] [CrossRef]
  37. Kou, W.; Xiao, X.; Dong, J.; Gan, S.; Zhai, D.; Zhang, G.; Qin, Y.; Li, L. Mapping Deciduous Rubber Plantation Areas and Stand Ages with PALSAR and Landsat Images. Remote Sens. 2015, 7, 1048–1073. [Google Scholar] [CrossRef]
  38. Chen, B.; Li, X.; Xiao, X.; Zhao, B.; Dong, J.; Kou, W.; Qin, Y.; Yang, C.; Wu, Z.; Sun, R.; et al. Mapping tropical forests and deciduous rubber plantations in Hainan Island, China by integrating PALSAR 25-m and multi-temporal Landsat images. Int. J. Appl. Earth Obs. Geoinf. 2016, 50, 117–130. [Google Scholar] [CrossRef]
  39. Chong, K.L.; Kanniah, K.D.; Pohl, C.; Tan, K.P. A review of remote sensing applications for oil palm studies. Geo-Spat. Inf. Sci. 2017, 20, 184–200. [Google Scholar] [CrossRef]
  40. Rakwatin, P.; Longépé, N.; Isoguchi, O.; Shimada, M.; Uryu, Y.; Takeuchi, W. Using multiscale texture information from ALOS PALSAR to map tropical forest. Int. J. Remote Sens. 2012, 33, 7727–7746. [Google Scholar] [CrossRef]
  41. Haralick, R.M.; Shanmugam, K.; Dinstein, I.H. Textural features for image classification. IEEE Trans. Syst. Man Cybern. 1973, 6, 610–621. [Google Scholar] [CrossRef]
  42. Dong, X.; Quegan, S.; Yumiko, U.; Hu, C.; Zeng, T. Feasibility Study of C- and L-band SAR Time Series Data in Tracking Indonesian Plantation and Natural Forest Cover Changes. IEEE J. Sel. Top. Appl. Earth Obs. Remote Sens. 2015, 8, 3692–3699. [Google Scholar] [CrossRef]
  43. Dong, J.; Xiao, X.; Sheldon, S.; Biradar, C.; Xie, G. Mapping tropical forests and rubber plantations in complex landscapes by integrating PALSAR and MODIS imagery. ISPRS J. Photogramm. Remote Sens. 2012, 74, 20–33. [Google Scholar] [CrossRef]
  44. Miettinen, J.; Liew, S.C. Separability of insular Southeast Asian woody plantation species in the 50 m resolution ALOS PALSAR mosaic product. Remote Sens. Lett. 2010, 2, 299–307. [Google Scholar] [CrossRef]
  45. Wulder, M.A.; Franklin, S.E.; White, J.C.; Linke, J.; Magnussen, S. An accuracy assessment framework for large-area land cover classification products derived from medium-resolution satellite data. Int. J. Remote Sens. 2007, 27, 663–683. [Google Scholar] [CrossRef]
  46. Praticò, S.; Solano, F.; Di Fazio, S.; Modica, G. Machine Learning Classification of Mediterranean Forest Habitats in Google Earth Engine Based on Seasonal Sentinel-2 Time-Series and Input Image Composition Optimisation. Remote Sens. 2021, 13, 586. [Google Scholar] [CrossRef]
  47. de Sousa, C.; Fatoyinbo, L.; Neigh, C.; Boucka, F.; Angoue, V.; Larsen, T. Cloud-computing and machine learning in support of country-level land cover and ecosystem extent mapping in Liberia and Gabon. PLoS ONE 2020, 15, e0227438. [Google Scholar] [CrossRef]
  48. Gyamfi-Ampadu, E.; Gebreslasie, M.; Mendoza-Ponce, A. Mapping natural forest cover using satellite imagery of Nkandla forest reserve, KwaZulu-Natal, South Africa. Remote Sens. Appl. Soc. Environ. 2020, 18, 100302. [Google Scholar] [CrossRef]
  49. Jin, Y.; Liu, X.; Chen, Y.; Liang, X. Land-cover mapping using Random Forest classification and incorporating NDVI time-series and texture: A case study of central Shandong. Int. J. Remote Sens. 2018, 39, 8703–8723. [Google Scholar] [CrossRef]
  50. Belgiu, M.; Drăguţ, L. Random forest in remote sensing: A review of applications and future directions. ISPRS J. Photogramm. Remote Sens. 2016, 114, 24–31. [Google Scholar] [CrossRef]
  51. Johnson, B.A.; Iizuka, K. Integrating OpenStreetMap crowdsourced data and Landsat time-series imagery for rapid land use/land cover (LULC) mapping: Case study of the Laguna de Bay area of the Philippines. Appl. Geogr. 2016, 67, 140–149. [Google Scholar] [CrossRef]
  52. Phan, T.N.; Kuch, V.; Lehnert, L.W. Land Cover Classification using Google Earth Engine and Random Forest Classifier—The Role of Image Composition. Remote Sens. 2020, 12, 2411. [Google Scholar] [CrossRef]
  53. Forkuor, G.; Dimobe, K.; Serme, I.; Tondoh, J.E. Landsat-8 vs. Sentinel-2: Examining the added value of sentinel-2’s red-edge bands to land-use and land-cover mapping in Burkina Faso. GIScience Remote Sens. 2017, 55, 331–354. [Google Scholar] [CrossRef]
  54. Muhadi, N.A.; Mohd Kassim, M.S.; Abdullah, A.F. Improvement of Digital Elevation Model (DEM) using data fusion technique for oil palm replanting phase. Int. J. Image Data Fusion 2018, 10, 232–243. [Google Scholar] [CrossRef]
  55. Li, G.; Lu, D.; Moran, E.; Dutra, L.; Batistella, M. A comparative analysis of ALOS PALSAR L-band and RADARSAT-2 C-band data for land-cover classification in a tropical moist region. ISPRS J. Photogramm. Remote Sens. 2012, 70, 26–38. [Google Scholar] [CrossRef]
  56. Cheng, Y.; Yu, L.; Zhao, Y.; Xu, Y.; Hackman, K.; Cracknell, A.P.; Gong, P. Towards a global oil palm sample database: Design and implications. Int. J. Remote Sens. 2017, 38, 4022–4032. [Google Scholar] [CrossRef]
  57. Cheng, Y.; Yu, L.; Xu, Y.; Liu, X.; Lu, H.; Cracknell, A.P.; Kanniah, K.; Gong, P. Towards global oil palm plantation mapping using remote-sensing data. Int. J. Remote Sens. 2018, 39, 5891–5906. [Google Scholar] [CrossRef]
  58. Nurmasari, Y.; Wijayanto, A.W. Oil Palm Plantation Detection in Indonesia Using Sentinel-2 and Landsat-8 Optical Satellite Imagery (Case Study: Rokan Hulu Regency, Riau Province). Int. J. Remote Sens. Earth Sci. (IJReSES) 2021, 18, 1. [Google Scholar] [CrossRef]
  59. Ju, Z.; Leong Tan, M.; Samat, N.; Kiat Chang, C. Comparison of Landsat 8, Sentinel-2 and spectral indices combinations for Google Earth Engine-based land use mapping in the Johor River Basin, Malaysia. Malays. J. Soc. Space 2021, 17, 30–46. [Google Scholar] [CrossRef]
  60. Descals, A.; Szantoi, Z.; Meijaard, E.; Sutikno, H.; Rindanata, G.; Wich, S. Oil Palm (Elaeis guineensis) Mapping with Details: Smallholder versus Industrial Plantations and their Extent in Riau, Sumatra. Remote Sens. 2019, 11, 2590. [Google Scholar] [CrossRef]
  61. Shafri, H.Z.; Anuar, M.I.; Seman, I.A.; Noor, N.M. Spectral discrimination of healthy and Ganoderma-infected oil palms from hyperspectral data. Int. J. Remote Sens. 2011, 32, 7111–7129. [Google Scholar] [CrossRef]
  62. Teng, K.C.; Koay, J.Y.; Tey, S.H.; Lim, K.S.; Ewe, H.T.; Chuah, H.T. A dense medium microwave backscattering model for the remote sensing of oil palm. IEEE Trans. Geosci. Remote Sens. 2014, 53, 3250–3259. [Google Scholar] [CrossRef]
  63. Li, L.; Dong, J.; Njeudeng Tenku, S.; Xiao, X. Mapping Oil Palm Plantations in Cameroon Using PALSAR 50-m Orthorectified Mosaic Images. Remote Sens. 2015, 7, 1206–1224. [Google Scholar] [CrossRef]
  64. Olofsson, P.; Foody, G.M.; Herold, M.; Stehman, S.V.; Woodcock, C.E.; Wulder, M.A. Good practices for estimating area and assessing accuracy of land change. Remote Sens. Environ. 2014, 148, 42–57. [Google Scholar] [CrossRef]
  65. Bai, Y.; Feng, M.; Jiang, H.; Wang, J.; Liu, Y. Validation of Land Cover Maps in China Using a Sampling-Based Labeling Approach. Remote Sens. 2015, 7, 10589–10606. [Google Scholar] [CrossRef] [Green Version]
Figure 1. Study area. (a) location map of MRB in Peninsular Malaysia; (b) elevation map of MRB; (c) Landsat 8 image covering MRB.
Agriculture 12 01435 g001
Figure 2. Samples of (a) 2015 and (b) 2020 collected from Google Earth Pro imagery and the field trip.
Agriculture 12 01435 g002
Figure 3. Methodology flow chart of this study. Xu et al. [6].
Agriculture 12 01435 g003
Figure 4. Producer accuracy and consumer accuracy for oil palm in 2020.
Agriculture 12 01435 g004
Figure 5. Confusion matrix plot for (a) C1—PALSAR2, (b) C2—Sentinel-1, (c) C3—Sentinel-2A, (d) C4—Landsat 8, (e) C5—Landsat 8 + PALSAR2, (f) C6—PALSAR-2 +Sentinel-2, (g) C7—Sentinel-1 +Sentinel-2 and (h) C8—Sentinel-1 + Landsat 8 combinations.
Agriculture 12 01435 g005
Figure 6. Random forest (RF) variable importance in eight combinations.
Agriculture 12 01435 g006
Figure 7. The 2020 MRB land use–land cover map produced from the combinations of (a) C1, (b) C2, (c) C3, (d) C4, (e) C5, (f) C6, (g) C7, and (h) C8.
Agriculture 12 01435 g007
Figure 8. Comparison of the 2020 MRB LULC maps (a,b,d) and the high-definition images (Source: Esri, Maxar, GeoEye, Earthstar Geographics, CNES/Airbus DS, USDA, USGS, AeroGRID, IGN, and the GIS User Community) of the basin (c,e).
Agriculture 12 01435 g008
Figure 9. Classification map after binarization by (a) the combination 7, (b) XU2020, and (c) difference maps of combination 7 and XU2020 classification maps.
Agriculture 12 01435 g009
Table 1. Parameters of remote sensing images required for mapping in the current study.
DataSensorBandsPixel SizeThe Time of Images
(Year)
(m)
Optical
image
Landsat 8Blue, green, red, near-infrared (NIR), Short-wave infrared 1(SWIR1), short-wave infrared 2(SWIR2)302015–2020
Sentinel-2Blue, green, red, near-infrared (NIR), Short-wave infrared 1(SWIR1), short-wave infrared 2(SWIR2), Red Edge1, Red Edge2, Red Edge3, Red Edge410,202015–2016,
2020
SAR
image
Global PALSAR-2/PALSAR yearly mosaicHH, HV252015–2020
Sentinel-1GRDVV, VH102015–2020
Topographic dataNASA SRTM
digital elevation
Elevation302000
Table 2. Spectral and SAR Indices.
IndicesFormula
Spectral IndicesNDVINDVI = (NIR − RED)/(NIR + RED)
NDWINDWI = (NIR − SWIR)/(NIR + SWIR1)
EVIEVI = 2.5 × (NIR − RED)/
(NIR + 6.0× RED − 7.5 × BLUE + 1.0)
SAR IndicesAVE(HH + HV)/2; (VV + VH)/2
DIFHH − HV; VV − VH
RAT1HH/HV; VH/VV
RAT2HV/HH; VV/VH
ASM A S M = i j { p ( i , j ) } ²
AVG A V G = i = 2 2 N g ( i p ( x + y ) ( i ) )
CON C O N = n = 0 N g 1 n 2 { i = 1 N g j = 1 N g p ( i , j ) } , | i j | = n
COR C O R = i j ( i , j ) p ( i , j ) u x u y σ x σ y
DIS D I S = n = 1 N g 1 n { i = 1 N g j = 1 N g p ( i , j ) 2 } , | i j | = n
ENT E N T = i j P ( i , j ) log ( p ( i , j ) )
IDM I D M = i j ( 1 1 + ( i j ) 2 ) · p ( i , j )
VAR V A R = i j ( i u ) 2 · p ( i , j )
Table 3. Image combination information.
YearSymbolNameDescriptionBand
2015,
2020
C1 PALSAR-2 SAR data, SAR indices, and topographic data23
C2Sentinel-1SAR data, SAR indices, and topographic data23
C3Sentinel-2Optical data, spectral indices, and topographic data14
C4Landsat 8Optical data, spectral indices, and topographic data10
C5PALSAR-2 +Landsat 8Optical and SAR data, spectral and SAR indices, and Topographic data32
C6PALSAR-2 +Sentinel-2Optical and SAR data, spectral and SAR indices, and topographic data36
C7Sentinel-1 + Sentinel-2Optical and SAR data, spectral and SAR indices, and topographic data36
C8Sentinel-1 + Landsat 8Optical and SAR data, spectral and SAR indices, and topographic data 32
Table 4. Accuracy assessment of land use–land cover classification in 2020.
Class SAROpticalSAR + Optical
C1C2C3C4C5C6C7C8
FRSEPA96%84%96%96%100%96%96%96%
CA92%95%96%100%100%100%100%96%
URBNPA70%65%100%91%91%100%100%95%
CA57%83%96%88%100%96%96%96%
WATRPA92%96%100%96%96%92%96%96%
CA80%81%90%89%83%92%96%89%
OILPPA46%88%92%96%96%96%96%92%
CA67%74%96%93%100%96%96%92%
RICEPA68%92%92%88%88%96%96%88%
CA81%92%100%100%92%100%96%100%
RUBRPA65%69%97%100%100%96%100%100%
CA60%76%100%100%100%92%100%95%
Overall accuracy73%83%96%95%95%96%97%95%
Kappa statistic68%80%95%94%94%95%97%94%
Table 5. Accuracy assessment of LULC classification.
SymbolArea of OPIL (km²)Data
20152020
C1406.26528.8SAR
C2319.43382.67
C3363.55583.12Optical
C4463.49602.91
C5377.45529.78Optical + SAR
C6475.81522.99
C7323.25465.73
C8418.03496.92
Xu et al. [6]598
Publisher’s Note: MDPI stays neutral with regard to jurisdictional claims in published maps and institutional affiliations.

