Article

Calcium Lignosulfonate Can Mitigate the Impact of Salt Stress on Growth, Physiological, and Yield Characteristics of Two Barley Cultivars (Hordeum vulgare L.)

1
Seed Technology Department, Field Crops Research Institute, Agriculture Research Center (ARC), Giza 12619, Egypt
2
Department of Biology, College of Science, Princess Nourah bint Abdulrahman University, P.O. Box 84428, Riyadh 11671, Saudi Arabia
3
Graduate School of Integrated Sciences for Life, Hiroshima University, Higashi-Hiroshima 739-8528, Japan
4
Center of Excellence in Biotechnology Research, King Saud University, P.O. Box 2455, Riyadh 11451, Saudi Arabia
5
Rice Biotechnology Lab, Rice Department, Field Crops Research Institute, ARC, Sakha 33717, Egypt
6
Excellence Center (EPCRS), Plant Pathology and Biotechnology Laboratory, Faculty of Agriculture, Kafrelsheikh University, Kafr Elsheikh 33516, Egypt
*
Author to whom correspondence should be addressed.
Agriculture 2022, 12(9), 1459; https://doi.org/10.3390/agriculture12091459
Submission received: 30 August 2022 / Revised: 4 September 2022 / Accepted: 7 September 2022 / Published: 13 September 2022
(This article belongs to the Special Issue Biosaline Agriculture and Salt Tolerance of Plants)

Abstract

:
The current study was conducted in a pot experiment with sand bed soil for two winter seasons (2019/20, 2020/21) to illuminate the impact of calcium lignosulfonate (Ca-LIGN) (100 mg/L) in alleviating various levels of NaCl (0, 100, 200, and 300 mM) on two barley cultivars, Giza132 and Giza133. Giza133 outgrew Giza132 under salinity stress by accumulating less Na+ content and retaining more K+ content. Surprisingly, Ca-LIGN was shown to be involved in both cultivars’ capacity to efflux Na+ in return for greater K+ influx under 100 and 200 mM NaCl, resulting in an increased dry weight of shoots and roots as well as leaf area compared with the untreated salinity levels. Physiological parameters were measured as relative water content (RWC), electrolyte leakage rate (ELR), peroxidase activity (POD) in leaf and root and grain yield, and grain protein content were evaluated. Adding Ca-LIGN ameliorated both cultivars’ growth in all the recorded characteristics. Under salinity stress, Ca-LIGN induced a higher RWC in both cultivars compared to those without Ca-LIGN. Although the ELR increased significantly in Giza132 leaves under the different NaCl concentrations compared to in Giza133 leaves, applying Ca-LIGN for both cultivars reduced the deterioration in their leaf and root by significantly lowering the ELR. As a result, applying Ca-LIGN to the salinity-affected plants (Giza133 and Giza132) under (100 and 200 mM NaCl), respectively, inhibited POD activity by about (10-fold, 6-fold, and 3-fold, 5-fold). The impact of Ca-LIGN on grain yield was more effective in Giza133 than in Giza132, with (61.46, 35.04, 29.21% and 46.02, 24.16, 21.96%) at various salinity levels. Moreover, while both cultivars recorded similar protein content under normal conditions, adding Ca-LIGN increased protein accumulation by raising salinity concentration until it reached 3% and 2% increases in both cultivars, Giza133 and Giza132, respectively, under 300 mM NaCl. It can be concluded that applying Ca-LIGN on barley can help to alleviate the ionic stress by excluding the harmful ions, resulting in higher grain yield and protein content.

1. Introduction

Salinity stress is one of the most harmful abiotic stress factors limiting crop growth, development, and yield [1,2,3,4]. Accumulation of sodium (Na+) excessively causes ion toxicity and ion imbalance by restricting the competitive absorption of some mineral nutrients such as potassium (K+) [5].
Salinity affects practically every part of plant morphology, physiology, and biochemistry, resulting in considerable agricultural production loss. A greater salt content in the soil limits plant roots’ ability to absorb water and critical nutrients. The greater ion concentration (Na+) in the root produces osmotic stress, reduces water potential, and disrupts nutritional balance. A larger Na+ concentration outside the plant cell also has a detrimental influence on intracellular K+ influx, which is necessary for plant development [6].
Under salinity conditions, there are many osmolytes and osmoprotectants, such as proline and jasmonic acid, which are already used to improve crop growth in calendula and faba bean plants [2,7]. Application of these osmoprotectants led to improved leaf number, chlorophyll content, relative water content, and yield characteristics [2,7].
Under salt stress, salt-tolerant plant species and genotypes must maintain decreased Na+ accumulation in shoots. Shoot Na+ exclusion or vascular compartmentalization are both responsible for lower shoot accumulative Na+ in plants [8]. The ability of plants to exclude the damaging Na+ ions is one of the greatest strategies to resist salt stress, as Na+ sequestration in plant tissues is thought to be the major cause of plant deterioration under salinity stress conditions. Low leaf Na+ concentration and K+/Na+ discrimination is important for salinity tolerance in barley under mild salt stress. Both leaf and root Na+ contents are negatively linked with plant dry matter during long-term salt stress [9,10,11].
Nowadays, a decrease in fresh water sources poses a threat to modern agriculture, which faces a number of issues as the world’s population continues to expand while the available land that is suitable for food production continues to decline [12]. Hence, one of the issues encountered in barley farming in newly recovered regions, especially in Egypt, is salinity [13]. The characteristics most affected by salinity stress were number of leaves and stem height [14], chlorophyll content, RWC%, and yield [14,15,16,17]. So, identifying saline limits requires research on salt tolerance throughout the vegetative growth phase of plants [18] and also at harvest time. In the newly reclaimed lands, barley is regarded as a desirable crop to sow due to its ability to grow under stress, and some studies have been carried out to increase its grain yield under various stress conditions [19,20,21,22,23] because it is one of the most indispensable crops in covering the gap in access to food due to insufficient cereal production [24].
According to Kanbar and El-Drussi, [25] rising salt levels reduced barley seed germination considerably. Even though one of the examined cultivars benefited from salinity stress at 25 mM in terms of shoot–root length and weight, all cultivars were salt-sensitive at 50, 75, and 100 mM in terms of all features studied. Moreover, Allel et al. [26] and El-Wakeel et al. [27] indicated that a salinity stress of 200 mM NaCl had a detrimental effect on the parameters studied in barley. However, some wild barley cultivars can be grown under more than 500 mM NaCl; glycophytic species such as Hordeum vulgare can tolerate more than 200 mM NaCl [28]. Therefore, treating barley plants with substances that enhance its growth under high levels of salinity is now a crucial method.
Lignosulfonates (low-cost LIGNs) are byproducts from the paper industry; these complex polymers are formed by the solubilization of lignin under alkaline conditions, and numerous chelated forms, such as Fe-, Ca-, or K-chelated lignosulfonates, have been identified depending on the nature of the base involved during this chemical process (Fe-LIGN, Ca-LIGN, K-LIGN). Investigations in the laboratory, glasshouse, and field have also shown their stimulating effects on both vegetative and reproductive growth, as well as on fructification; their favorable influence on the root system development was particularly apparent [29,30]. Calcium lignosulfonate (Ca-LIGN), as a plant biostimulant, positively affects plant growth and fruit-fixed expression, plant pigments, shoot and root development, nutritional efficiency, crop production, rhizospheric and soil microorganisms, general soil health, and plant–environment interactions. Biostimulants are obtained from natural sources and can assist in decreasing the consumption of chemical imports while also reducing the negative environmental effects of hazardous substances [31]. Biostimulants have recently been utilized to help stressed plants and enhance their growth and production [32], and these biostimulants are not nutrients in and of themselves; rather, they aid in the absorption of nutrients or advantageously promote growth or stress resistance [33].
The application of Ca lignosulfonate compounds has the potential to promote agricultural yield [34]; in addition, lignosulfonate has been demonstrated to promote plant development in maize [35] and rice [35] because their hydrophilic parts have negative charges, and Ca lignosulfonate surfactant has a short-chain structure that makes reactions with salt simpler, has good water solubility and promotes root and leaf development, and boosts chlorophyll content and crop yield [36].
Approximately 30 crop plant species currently produce 90% of plant-based human nourishment, and the majority of the essential glycophytic crops have 50–80% lower average yields when grown under salinity conditions [37]. Because of the changing climate, problems related to soil salinity are expected to develop in many areas, and to deal with such effects, a variety of adaptations and mitigation methods are necessary. Therefore, lignosulfonate is used to ameliorate plant growth, while there has not been any research conducted on the use of calcium lignosulfonate as a mitigating substance to alleviate the salinity stress. Hence, the objective of this study was to elucidate the indispensable role of adding Ca lignosulfonate to two barley cultivars, Giza132 and Giza133, in alleviating the detrimental effects of different salinity stress levels.

2. Materials and Methods

2.1. Plant Materials and Growth Conditions

The current experiment was conducted in the greenhouse of the Seed Technology Research Department at Sakha Agriculture Research Station, ARC, Kafr Elsheikh, Egypt, under the environmental conditions shown in (Table 1). Two barley cultivars (Giza133 and Giza132) were obtained from the Agricultural Research Center, Egypt, based on their behavior under salinity stress conditions; the Giza133 cultivar is more tolerant than the Giza132 cultivar.
Over two productive seasons (2019/2020 and 2020/2021), seeds were sown and grown in acid-washed quartz sand (saturation percent 20 percent). A total of 6 kg of sand was placed inside the 25 cm-diameter, 7 L plastic pots, which also included a bottom vent for free drainage. Full-strength nutrient solution (75 g/L ZnSO4·H2O, 45 g/L MnSO4·H2O, 100 g/L FeSO4·5H2O, 55 g/L CuSO4·7H2O, 25 g/L MgSO4·5H2O, 5 g/L, potassium fulvate, 5 g/L citric acid, and 20 g/L potassium alginate) in addition to the recommended NPK fertilization was used as a source of nitrogen and phosphorous for the plants. After germination, 10 days later, seedlings were thinned to 6 plants per pot and watered with either nutritional solution with 0 mM NaCl (control) or nutrient solution with 100 mM, 200 mM, and 300 mM NaCl. The pots of the plants that were irrigated with salty solutions were later divided into two groups, and one of them was provided with calcium lignosulfonate (Saigo Ligno Sal compound) (100 mg/L) (Ca-LIGN + salt treatments) due to the symptoms of salinity stress impact on the plants after 20 days of those three salinity treatments. Without using calcium lignosulfonate throughout the vegetative stage, the other group continued to be watered as needed with various salt solution treatments (100, 200, and 300 mM NaCl), and each treatment was replicated 4 times. The environmental conditions of the experiment are recorded in Table 1.

2.2. Preparation of Calcium Lignosulfonate (Ca-LIGN) Solution and Applying the Salt Treatments

The calcium lignosulfonate substance used in the current study was purchased from (Saigo chemical company, Kafr Elsheikh, Egypt) as an active ingredient in a commercial compound (Saigo Ligno Sal). The chemical compositions in this compound are (10% CaO, 11% N, 10% potassium fulvate, 10% calcium lignosulfonate, 30% organic acids, 2% zeolite, and 1% MgO). The calcium lignosulfonate (Ca-LIGN) was prepared by adding (100 mg/L) to salt solutions for each salinity concentration (100 mM NaCl, 200 mM NaCl, and 300 mM NaCl). In addition, salinity solution treatments (NaCl treatments) were applied gradually (25, 50, 75, and finally 100 mM) for the first salinity level (25, 50, 75, 100, and finally 200 mM) for the second salinity level, and (25, 50, 75, 100, 200, and finally 300 mM) for the third salinity level over 2-day intervals to avoid causing osmotic shock to the plants.

2.3. Growth Parameters

After 30 days of applying Ca lignosulfonate, the plants were taken and divided into 2 parts (roots and shoots (sheaths and leaves)), and two sets of samples were prepared. The dry weights (DWs) were recorded for each plant part from the first set of samples after oven drying at 70 °C for 3 days, and the other set was kept at −80 °C for peroxidase enzyme activity analysis. Leaf area (LA) was measured using a leaf area meter (Model: LI-3000A Portable leaf area meter, LI-COR Biosciences, Lincoln, NE, USA), and plant height was measured. To determine the yield characteristics, a different set of plants was allowed to develop till harvest.

2.4. Plant Pigment Content Determination

Chlorophyll a, chlorophyll b, and total chlorophyll as well as carotenoid contents were extracted from 0.5 g of fresh leaves samples in 10 mL of 100% N,N-dimethyl formamide, and then the concentration was determined with a spectrophotometer using the methods of Porra et al. [26] and Porra [38].

2.5. Relative Water Content (RWC)

Leaf samples were placed in vials and weighed (FW); after the sample had been weighed, the piece of leaf was transferred to a 1.5 mL Eppendorff tube containing deionized water. Then, tubes were placed for 4 h in a fridge to allow the tissue to take up water. The sample was instantly transferred and reweighed to measure the fully turgid fresh weight (TW). The samples oven-dried at 80 °C for 72 h and then reweighed to determine the dry weight (DW). The relative water content was calculated according to Gonzalez and Gonzalez-Vilar [39] as follows:
RWC (%) = [(FW − DW)/(TW − DW)] × 100
where FW (fresh weight), TW (turgid weight), and DW (dry weight).

2.6. Electrolyte Leakage Rate (ELR)

The electrolyte leakage rate (ELR) was measured in the third leaf from the top of each plant (0.5 g), and 0.5 g roots were well-washed using the method of Murray et al. [40] with some modifications. The leaf and root samples were soaked in distilled water and shaken for 12 h. Electrical conductivity EC (EC1) was measured with a portable EC meter (9V-1AmP, Thermo Electron Corporation, USA). The samples were later autoclaved and cooled to determine total EC (EC2). The ELR was calculated as follows: ELR (%) = (EC1/EC2) × 100.

2.7. Determination of Peroxidase Activity (POD)

The extraction was carried out using 0.5 g fresh samples according to the method of Takagi et al. [41]. Fresh (leaf and root) samples were ground in liquid nitrogen with adding phosphate buffer (pH 7.0). The homogenate was centrifuged, and then sPOD activity was determined in the supernatant. The 1 mL of reaction mixture contained 15 mM guaiacol, 10 mM H2O2, 73 mM phosphate buffer, and 2% enzyme extract. The absorbance was observed at 470 nm for 1 min, and the activity of sPOD was calculated according to Chance and Maehly, [42], and one-unit sPOD activity was defined as µmol tetraguaiacol/min.

2.8. Na+ and K+ Concentrations

The selected leaves and roots samples were oven-dried and fine-grounded. The fine powder was digested with a mixture of HNO3 and HClO4 (5:1, v/v), and the Na+ and K+ concentrations in the extracts were measured using an atomic absorption spectrophotometer (Shimadzu, Kyoto, Japan) according to Rahman et al. [43].

2.9. Post-Harvest Measurements

At harvest time, plant height (cm) was measured. The remained spikes were harvested and threshed to obtain grains. Length of spike (cm), grain number/spike, 1000-grain weight (gm), and grain yield/pot (gm) were measured.

2.10. Crude Protein Content

The known weight of the fine-ground seeds (ca. 0.1 g) was digested using a micro Kjeldahl apparatus by (98% H2SO4) and (30% H2O2). The crude protein was calculated by multiplying the total nitrogen by 5.85 [44].

2.11. Statistical Analysis

The collected data of the two seasons were subjected to combined analysis of variance (ANOVA) for the completely randomized block design of each experiment (n = 4), as mentioned by Gomez and Gomez [45] using (MSTAT-C 1990) computer software, and the means of genotypes were compared using Fisher’s protected LSD at a 0.05 probability level. The physiological data are shown as means, and the means were separated using the Duncan’s Multiple Range Test at p = 0.05 [46].

3. Results

After two months of various treatments, it was clear that they had different aesthetic impacts on the cultivars Giza133 and Giza132. The combined analysis revealed that there was no significant difference between the two seasons in root length, Na+ concentrations, or peroxide enzyme activity in either tissue (leaf or root), but there was a significant difference between the two seasons in shoot length, shoot, and root dry weights (Table 2).
In addition, there was no significant effect of these seasons on the relative water content (RWC) and electrolyte leakage rate (ELR) of either tissue (leaf and root) or total leaf area (TLA) (Table 3). Nevertheless, all the post-harvest investigated parameters (Table 4) and the remaining physiological and growth characteristics were significantly impacted by both seasons (Table 2 and Table 3). According to the influence of the cultivars, both cultivars, Giza133 and Giza132, performed quite differently in all the studied characteristics that are shown in Table 4 and Table 2, with the exception of shoot and root lengths (Table 2), TLA (Table 2), and the number of grains/spike (Table 4). Furthermore, the various salinity treatments, whether they involved the addition of Ca lignosulfonate or not, had a significant impact on all the examined features (Table 2, Table 3 and Table 4).

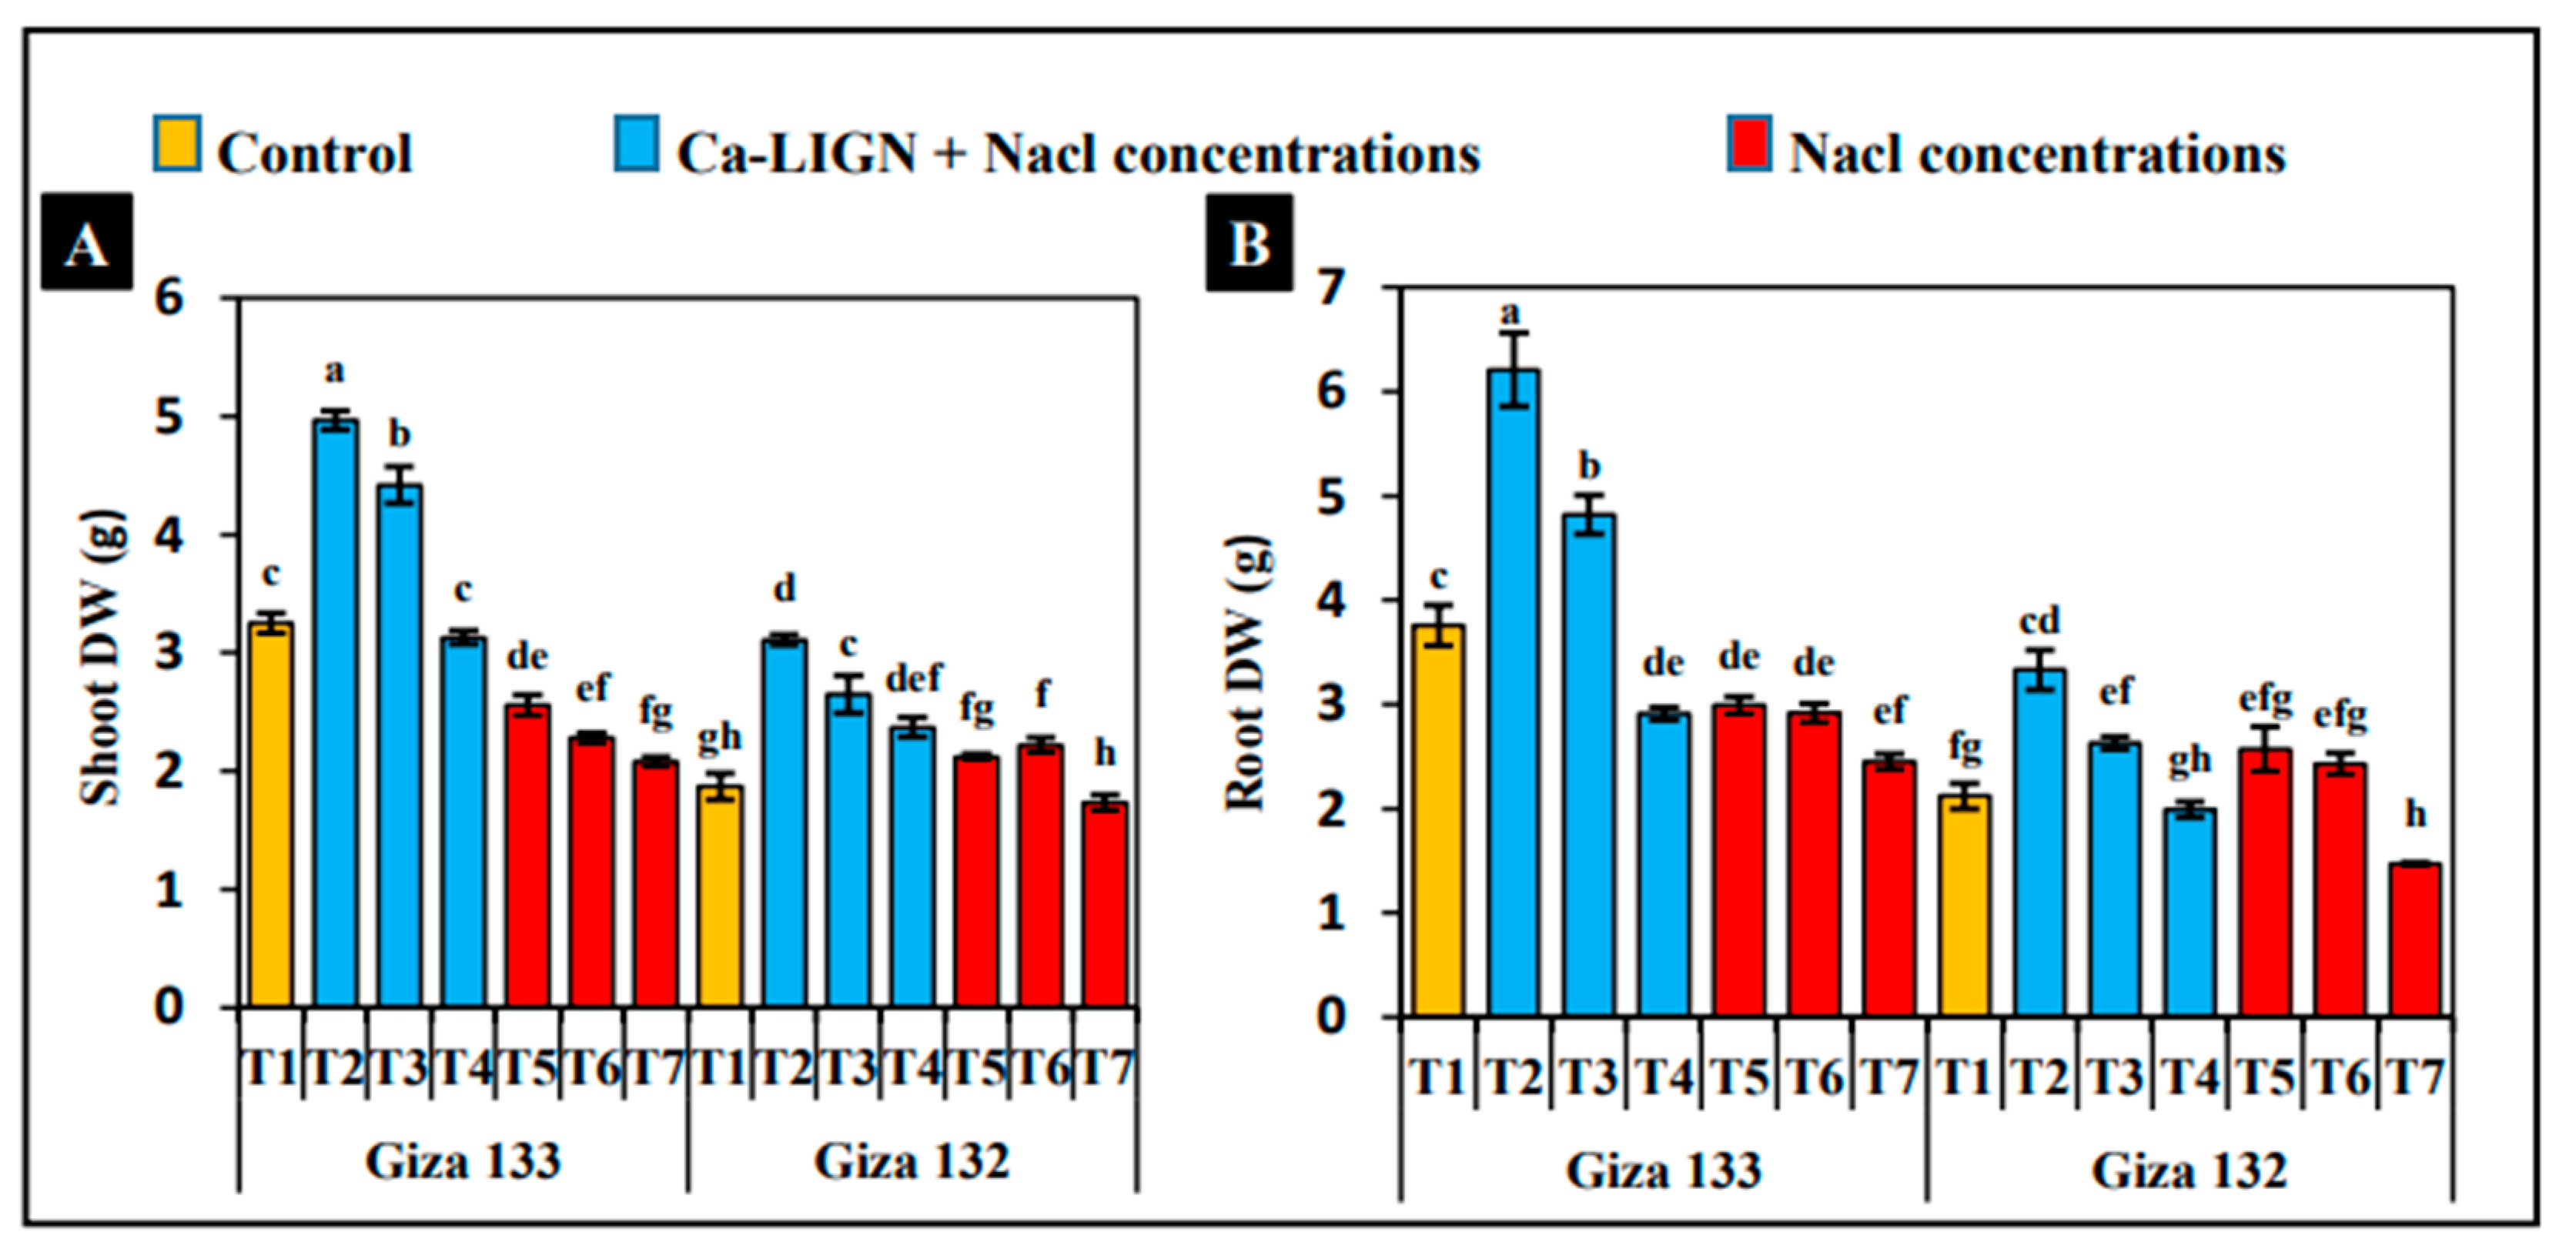
3.1. Effect of the Treatments on Plant Growth and Biomass

In both genotypes, there was a rise in NaCl concentration accompanied by a reduction in growth (Figure 1, Figure 2, Figure 3 and Figure 4). By adding Ca lignosulfonate (Ca-LIGN) to salty solutions, the second treatment, which consisted of applying Ca-LIGN to 100 mM NaCl followed by adding it to 200 mM NaCl, produced the greatest shoot and root lengths (Figure 2), leaf area (LA), and total leaf area (TLA) (Figure 2) and increased the production of shoot and root dry weights (DWs) (Figure 1), outperforming the control treatment. When comparing the three salinity levels with the same levels of Ca-LIGN, both cultivars recorded a significant increase in all the growth features, especially in shoot DW, by (52.8%, 49.3%, 33.5% and 31.8%, 16.2%, and 27.0%) in Giza133 and Giza132 with the three salinity levels 100, 200, and 300 mM NaCl, respectively (Figure 1A). The same trend was recorded in root DW in both cultivars; however, a slight increase in DW was shown with the highest salinity level, 300 mM, using the Ca-LIGN substance (Figure 1B). The shoot height decreased slightly in both cultivars under the first salinity level, 100 mM NaCl, compared to control conditions (Figure 2A); however, in the other salinity levels, 200 mM NaCl and 300 mM NaCl, Giza133 decreased more than Giza132 than when under control conditions. The results in Figure 3 show that applying the Ca-LIGN substance induced an upsurge in both shoot and root lengths in the Giza133 cultivar by (22.7%,17.2%) and (22.3%,15.17%) under both salinity levels (100 mM and 200 mM NaCl), respectively. Giza132 cultivar did not have significantly altered shoot and root lengths when Ca-LIGN was added (Figure 2). We examined the leaf area for both cultivars under the different studied treatments, noting the Ca-LIGN substance prompted an elongation in the leaf tissues, which was observed in both cultivars compared with control and salinity stress without adding the Ca-LIGN substance (Figure 3A). The Giza133 cultivar recorded an increase of about 50% in LA when Ca-LIGN was added to 100 mM NaCl compared to the control and also 100 mM NaCl when that substance was not added; additionally, the LA increased by 23.5% and 34.2% when the Ca-LIGN substance was added to 200 mM NaCl and 300 mM NaCl, respectively, compared to these salt levels when it was not added (Figure 3A). Adding Ca-LIGN to 100 mM NaCl in Giza132 increased the LA significantly by 17.7% and 21.9% compared to the control conditions and 100 mM NaCl without that substance, respectively; however, adding Ca-LIGN did not significantly affect its LA under the highest salinity level, 300 mM NaCl (Figure 3A).

3.2. Relative Water Content (RWC)

Under various levels of salt stress, the RWC of leaves declined significantly by around 10% and 15% in Giza133 and Giza132, respectively. Calcium lignosulfonate’s treatments enhanced the RWC of stressed seedlings of both cultivars, which was particularly noticeable at the stress levels of 100 and 200 mM NaCl, more so than in the 300 mM NaCl level (Figure 4).

3.3. Electrolyte Leakage Rate (ELR)

Since salt stress elevated the abundance of free radicals in plants, the damage to membranes was examined by measuring the electrolyte leakage in both cultivars’ leaf and root tissues (Figure 5). Electrolyte leakage was found in both cultivars’ leaves, and according to the findings, was inhibited when the Ca-LIGN substance was added to all the studied salinity levels in both cultivars (Figure 5A). Although adding the Ca-LIGN substance to the salinity levels (100 mM and 200 mM NaCl) did not significantly reduce the leakage of root cells in Giza133, under the highest salinity level, 300 mM NaCl, Ca-LIGN maintained its root cell membrane stability by decreasing the ELR by 18.79% (Figure 5B). Additionally, application of Ca-LIGN led to alleviated salinity stress effects due to the decline in the ELR’s root tissues by (8.18%, 11.32%, and 19.46%) under salinity levels of (100 mM, 200 mM, and 300 mM NaCl), respectively (Figure 5B).

3.4. Peroxidase Enzyme Activity (POD)

The aforementioned features are supported by our findings on peroxidase (POD) activity, an enzyme implicated in antioxidative defense systems (Figure 6). The salinity stress levels increased the POD enzyme activity under the three levels (100 mM NaCl, 200 mM NaCl, and 300 mM NaCl) by (7.7-, 4.1-, 1.5-fold, and 4.2-, 2.5-, 1.4-fold) compared to under the control conditions in both cultivars of the leaves, Giza133 and Giza132, correspondingly (Figure 6A). Adding the Ca-LIGN substance to the different salinity levels did not alter the POD activity in either cultivar’s leaves, except the Giza133 leaf under 300 mM NaCl-induced POD activity, which increased about 2.4 times compared to the control (Figure 6A). With regard to the root tissues, the activity of POD enzyme increased when the salinity level in the Giza133 cultivar was increased; however, its activity decreased when the salinity levels were increased in Giza132 cultivar root tissues (Figure 6B), and applying Ca-LIGN to salinity concentrations did not induce the POD activity in Giza133 root.

3.5. Different Photosynthetic Pigments

Salinity stress resulted in declined pigment production in the leaf tissues of both cultivars, Giza133 and Giza132, which was more pronounced in the Giza132 cultivar (Table 5). The different salinity levels (100 mM NaCl, 200 mM NaCl, and 300 mM NaCl) led to a significant decrease in the different pigments (Chl a, Chl b, total chlorophyll, and total carotenoids contents) by around (1.2, 3.38, and 3.8 times), respectively, compared with control conditions in Giza133. In the presence of sodium chloride stress, adding Ca-LIGN increased the Chl a, Chl b, total chlorophyll, and total carotenoids contents by gradually decreasing the salinity levels from 300 mM NaCl to 200 mM NaCl until reaching 100 mM NaCl in both cultivars (Table 5).

3.6. Na+ and K+ Concentrations

It is illustrated in (Figure 7A,B) that under salinity levels, the Giza133 cultivar accumulated less Na+ content in its leaf and root tissues than the Giza132 cultivar. Simultaneously, Giza133 cultivar’s K+ content was higher than that of Giza132 in both leaf and root tissues (Figure 7C,D). Moreover, under the increase in NaCl levels, sodium content increased in the leaves and roots of both barley cultivars. The opposite results for K+ content was obtained. Ca-LIGN application dropped dramatically the levels of Na+ in the two organs of barley cultivar stressed seedlings (Figure 7A,B). Oppositely, applying Ca-LIGN increased the K+ content in both tissues of both cultivars compared with the untreated tissues (Figure 7C,D)

3.7. Post-Harvest Characteristics

In both cultivars, irrigating barley with varied salt levels (100, 200, and 300 mM NaCl) dissolved in the nutrient solution reduced plant height (cm), spike length (cm), 1000-grain weight (gm), and grain yield (gm pot−1) at harvest as compared to the control (Table 6). The results also reveal that watering the salinized barley plants with Ca-LIGN improved the values of those properties substantially. In the Giza133 cultivar, the reduction in plant height by salinity stressors was (5.6, 6.9, and 21.3%); however, this decrease was much higher in Giza132, for which these values declined by (11.18, 21.63 and 32.14%) under the salinity levels (100, 200, and 300 mM NaCl), respectively. Surprisingly, applying Ca-LIGN increased the plant height of both cultivars significantly under the three salinity levels, showing a gradual increase from the highest concentration to the lowest one, with plants being (8.6%, 3.1%) taller under these conditions than under control conditions in Giza133 and Giza132, respectively (Table 6). Overall, while the increasing salinity stress concentrations reduced grain yield and its components (spike length, no. grains spike-1, and 1000-grain weight), salt treatment with Ca-LIGN increased the aforesaid characteristics, particularly grain yield, in both cultivars. The effect of adding Ca-LIGN on grain yield was more evident in Giza133 than in Giza132, with increases of (61.46, 35.04, 29.21%, and 46.02, 24.16, 21.96%), respectively, at the corresponding salinity levels (100, 200, and 300 mM NaCl).

3.8. Grain Protein Content

Similarly to grain protein content, which increased the quality of the grains, salinity levels induced steadily increasing protein content by increasing the concentration of NaCl in both cultivars compared to control conditions (Table 5). In addition, there was a significant increase in the grain protein content of both cultivars, Giza133 and Giza132, when the salinity stress levels with Ca-LIGN reached (21.27% and 14.95%) increases in the Giza133 cultivar and Giza132 cultivar, respectively, under the highest concentration, 300 mM NaCl (Table 6).

4. Discussion

Our results indicate that both cultivars clearly exhibited much tolerance to salinity stress levels when treated with calcium lignosulfonate (Ca-LIGN), as evidenced by increased dry mass, shoot and root length, LA, RWC, grain yield, and its components, with higher grain protein content as well as lower ELR and POD activity due to lower ROS production [36]. Otherwise, under salinity stress, the shot-gun approach, which includes the use of biostimulants as Ca-LIGN, would be a viable option for a variety of crops, including sunflower [47], barley [48], and corn [49]. The calcium element in calcium lignosulfonate (Ca-LIGN) is chemically active and can extrude sodium atoms that have been adsorbed to soil particles close to where roots are growing. Additionally, it contains an active alkyl group that binds to a sodium element and converts it to an organic form without harming the plant, similar to the results of Kang et al. [50]. The organic Ca-LIGN substance is utilized as a biostimulant for root growth and plant development since it also contains a sulfur element, which is crucial for protecting roots from salt stress.
For the above reasons, it was observed that salts in irrigation water can cause an inhibition in plant growth; however, applying Ca-LIGN was seen to alleviate diverse salt stress levels in both cultivars, Giza132 and Giza133.
When excessively salt enters the plant through the transpiration stream, it will harm the cells in the transpiring leaves, causing further growth reduction [7]. It was illustrated in our study that there was a negative effect of salinity stress levels on the plant DWs (Figure 1), shoot and root lengths (Figure 2), LA, and total TLA (Figure 3). This negative effect of salinity stress was recorded in many plants [51,52,53]; nevertheless, Ca-LIGN mitigates this negative impact on these growth characteristics. Lignin’s efficient provision of the necessary ions required for plant growth results in such good impacts on plant growth. Our findings are also consistent with earlier research that has shown the benefits of lignin in stimulating in vitro plant development of rice [54]. It can be observed in Figure 4A that the LA was much higher in salt-stressed plants when Ca-LIGN was added than in the untreated stressed plants. Sulfur (S) is an essential element for the growth and development of crop plants; it is one of the main components in Ca-LIGN, which plays an important role in the normal functioning of plant chlorophyll and important proteins [55]. Chlorophyll a, chlorophyll b, total chlorophyll, and total carotenoids content in both cultivars on average for the two seasons increased significantly when Ca-LIGN was applied to NaCl concentrations compared with untreated stressed plants (Table 5). Sulfur in Ca-LIGN can help barley to cope with unfavorable environmental stressors; however, the effectiveness of Sulfur varies [56]. Our results indicate that Ca-LIGN acts as a source of sulfur, which improves the photosynthesis pigment content under salt stress levels (Table 5), leads to the plant’s ability to store high dry mass (Figure 1), and increases the elongation of the leaf tissue, which was observed when expanding the LA under salinity levels (Figure 4).
Alternatively, by its function in lignin production, the peroxidase enzyme contributes to ROS detoxification under salinity stress in the tolerant cultivar Giza133 more than in the sensitive cultivar Giza132 under the different salt levels (Figure 6). However, the activity of the POD enzyme dramatically plummeted with Ca-LIGN application in both the leaf and root of both cultivars except under 300 mM NaCl, which means a low amount of ROS in plant cells and decreased oxidative stress are indicated by peroxidase activity in both leaf and root tissues. A decline in peroxidase activity when adding Ca-LIGN was found to significantly decrease the electrolyte leakage ratio (ELR) (Figure 5), which protects leaf and root tissues against the damage that often results from the stress. Adding Ca-LIGN during salinity stress helped both cultivars to maintain their leaf tissues’ cell membrane stability (Figure 5A). According to the turgidity of leaves, we found the relative water content (RWC), which was exhibited by a massive increase in leaf turgor with the application of Ca-LIGN due to its ability to take up water in contrast to its lack of water uptake under salinity stress levels, especially under 300 mM NaCl and particularly in the sensitive cultivar Giza132 (Figure 4). The high salt stress level impact on RWC was observed to be much weaker in Giza133 (which retained as much as 100% of its leaf water on average for both seasons when grown in 100 mM NaCl) than in Giza132, in which it decreased to 95.25% (Figure 4). Earlier studies similarly established that the usage of exogenous biostimulants such as Ca-LIGN counteracted adverse salt-induced effects on RWC [57]. Nevertheless, our results indicate that this result is highly cultivar-dependent; for instance, Giza133 RWC seedlings were largely dependent on the salt concentration for the two seasons, independently of Ca-LIGN treatment; however, applying Ca-LIGN on different NaCl concentrations affected the leaf RWC of Giza132 seedlings, with by a noticeable upsurge. Salt stress tolerance in many crops is linked to a low Na+ content in the shoots, particularly in leaves [58,59]. Ca-LIGN is a lignin-derived amorphous substance; it chelates the minerals from the soil and changes its charge so the plant does not absorb excessive harmful minerals such as Na+ [60], which explained the declining Na+ content in both leaf and root tissues in both cultivars treated with the Ca-LIGN substance (Figure 7A,B). Additionally, recent studies revealed that the intracellular K+ plays an important role in the salinity tolerance mechanism. To sustain high intracellular K+ concentrations, plasma membranes contain very negative internal potentials [9]. Excessive Na+ influx under salinity stress depolarizes the membrane, allowing K+ to be effluxed via depolarization-activated channels such NSCCs and GORK [61]. In contrast, the Ca-LIGN substance, which increases the efflux of Na+ by connecting to the negatively charged alkali group of lignosulfonates, then changes into a neutral compound, and, when washed with the irrigated water in soil, it leads to an Na+ exchange with a K+ influx through the plant cells. This was crystal clear in both cultivars when Ca-LIGNO was applied under different salinity levels, which enhanced the K+ content compared to untreated salinity levels and the control conditions (Figure 7B). Different previous studies concluded that salinity stress reduces the grain yield and its components of crop plants [62], which is in line with our results. Applying Ca-LIGNO stimulated the plant growth and caused an increase in the grain yield by increasing its components, which was obvious in our results (Table 6). Ca-LIGNO enhanced the plant height in both cultivars and increased their grain yield under 100mM NaCl more than under control conditions. Despite the fact that salinity stress increased the protein content in the grains, Ca-LIGN enhanced the protein content under salinity stress compared to under control conditions, in particular, for the Giza133 cultivar (Table 6). Applying Ca-LIGN helps plant to absorb many nutrients and increases nitrogen content, which is responsible for the protein in the grains under salinity levels.

5. Conclusions

In conclusion, our results indicate that superior tolerance was recorded for genotype Giza133 when Ca-LIGN was added, which enhanced its ability to tolerate the salinity stress levels. Moreover, applying Ca-LIGN improved cultivar Giza132’s behavior under salinity stress levels. Calcium lignosulgonate application minimized the deleterious effects of salt stress in both cultivars. Physiological parameters analysis revealed that the difference in growth caused by adding Ca lignisulfonate was primarily due to higher antioxidant enzyme POD in the leaves and roots of barley cultivars Giza133 and Giza132 grown under control conditions and different NaCl stresses. The reluctance of extrusion would result in cytosolic Na+ accumulation, which might injure plant tissues (as demonstrated in Giza132), producing in K+ efflux and perhaps significant growth retardation under salt stress. Furthermore, adding Ca lignosulfonate to barley plants under various salinity levels boosted chlorophyll a,b content, relative water content, and the grain yield production as well as protein content; however, ELR was decreased in barley plants treated with Ca lignosulfonate. By using our findings in this work, we may be able to develop a breeding program for barely crop in the future. Overall, utilizing Ca-LIGN as an active and cost-effective component for farmers of Saigo-sal as a remedy for salt stress I’m plant crops improves development and allows them to tolerate salinity stress. Now, we are conducting new study on a variety of crops to determine how this compound may affect them.

Author Contributions

Conceptualization, H.I.A.E., A.M.M.M. and A.M.E.A.S.; methodology, H.I.A.E., K.A. (Khadiga Alharbi), A.M.M.M., A.U., M.A., L.A., K.A.A., K.A. (Khaled Abdelaal) and A.M.E.A.S.; software, H.I.A.E., K.A. (Khadiga Alharbi), A.M.M.M., A.U., M.A., L.A., K.A.A., K.A. (Khaled Abdelaal) and A.M.E.A.S.; validation, H.I.A.E., A.M.M.M., A.U. and A.M.E.A.S.; formal analysis, H.I.A.E., A.M.M.M., A.U., K.A.A., K.A. (Khaled Abdelaal) and A.M.E.A.S.; investigation, H.I.A.E., K.A. (Khadiga Alharbi), A.M.M.M., A.U., M.A., L.A., K.A.A., K.A. (Khaled Abdelaal) and A.M.E.A.S.; resources, H.I.A.E., A.M.M.M., A.U., K.A. (Khaled Abdelaal) and A.M.E.A.S.; data curation, H.I.A.E., A.M.M.M., A.U. and A.M.E.A.S.; writing—original draft preparation, H.I.A.E., K.A. (Khadiga Alharbi), A.M.M.M., A.U., K.A.A., K.A. (Khaled Abdelaal) and A.M.E.A.S.; writing—review and editing, H.I.A.E., K.A. (Khadiga Alharbi), A.M.M.M., A.U., M.A., L.A., K.A.A., K.A. (Khaled Abdelaal) and A.M.E.A.S.; supervision, H.I.A.E. and A.M.E.A.S.; funding acquisition, H.I.A.E., K.A. (Khadiga Alharbi), A.M.M.M., M.A., L.A., K.A.A., K.A. (Khaled Abdelaal) and A.M.E.A.S. All authors have read and agreed to the published version of the manuscript.

Funding

This research was funded by Princess Nourah bint Abdulrahman University Researchers Supporting Project Number (PNURSP2022R188), Princess Nourah bint Abdulrahman University, Riyadh, Saudi Arabia.

Institutional Review Board Statement

Not applicable.

Data Availability Statement

Not applicable.

Acknowledgments

The authors would like to thank Princess Nourah bint Abdulrahman University Researchers Supporting Project Number (PNURSP2022R188), Princess Nourah bint Abdulrahman University, Riyadh, Saudi Arabia. Additionally, the authors would like to thank Sherif Mohamed Abdeldayem, an associate professor at Kafrelshikh University, Egypt, for his support and for providing the chemicals and some materials for our experiment. Many thanks to Saigo chemical company for providing products and chemicals. Many thanks to the field crops research institute, Agricultural Research Center (ARC). Additionally, many thanks to all members of PPB Lab., and the EPCRS Excellence Centre (certified according to ISO/9001, ISO/14001, and OHSAS/18001), Department of Agricultural Botany, Faculty of Agriculture, Kafrelsheikh University, Kafr-Elsheikh, Egypt.

Conflicts of Interest

The authors declare no conflict of interest.

References

  1. Abdelaal, K.A.; Mazrou, Y.S.; Hafez, Y.M. Silicon Foliar Application Mitigates Salt Stress in Sweet Pepper Plants by Enhancing Water Status, Photosynthesis, Antioxidant Enzyme Activity and Fruit Yield. Plants 2020, 9, 733. [Google Scholar] [CrossRef]
  2. El-Shawa, G.M.R.; Rashwan, E.M.; Abdelaal, K.A.A. Mitigating salt stress effects by exogenous application of proline and yeast extract on morphophysiological, biochemical and anatomical characters of calendula plants. Sci. J. Flowers Ornam. Plants 2020, 7, 461–482. [Google Scholar] [CrossRef]
  3. Abdelaal, K.A.A.; EL-Maghraby, L.M.; Elansary, H.; Hafez, Y.M.; Ibrahim, E.I.; El-Banna, M.; El-Esawi, M.; Elkelish, A. Treatment of Sweet Pepper with Stress Tolerance-Inducing Compounds Alleviates Salinity Stress Oxidative Damage by Mediating the Physio-Biochemical Activities and Antioxidant Systems. Agronomy 2020, 10, 26. [Google Scholar] [CrossRef]
  4. El-Banna, M.F.; Abdelaal, K.A.A. Response of Strawberry Plants Grown in the Hydroponic System to Pretreatment with H2O2 before Exposure to Salinity Stress. J. Plant Prot. Mansoura Univ. 2018, 9, 989–1001. [Google Scholar] [CrossRef]
  5. Shen, Q.; Fu, L.; Dai, F.; Jiang, L.; Zhang, G.; Wu, D. Multi-omics analysis reveals molecular mechanisms of shoot adaption to salt stress in Tibetan wild barley. BMC Genom. 2016, 17, 889. [Google Scholar] [CrossRef]
  6. Akhilesh, K.; Singh, S.; Gaurav, A.K.; Srivastava, S. Plant Growth-Promoting Bacteria: Biological Tools for the Mitigation of Salinity Stress in Plants. Front. Microbiol. 2020, 11, 1216. [Google Scholar] [CrossRef]
  7. El Nahhas, N.; AlKahtani, M.; Abdelaal, K.A.A.; Al Husnain, L.; AlGwaiz, H.; Hafez, Y.M.; Attia, K.; El-Esawi, M.; Ibrahim, M.; Elkelish, A. Biochar and jasmonic acid application attenuates antioxidative systems and improves growth, physiology, nutrient uptake and productivity of faba bean (Vicia faba L.) irrigated with saline water. Plant Physiol. Biochem. 2021, 166, 807–817. [Google Scholar] [CrossRef]
  8. Shen, Q.; Fu, L.; Su, T.; Ye, L.; Huang, L.; Kuang, L.; Wu, L.; Wu, D.; Chen, Z.H.; Zhang, G. Calmodulin HvCaM1 negatively regulates salt tolerance via modulation of HvHKT1s and HvCAMTA41[OPEN]. Plant Physiol. 2020, 183, 1650–1662. [Google Scholar] [CrossRef]
  9. Elsawy, H.I.A.; Mekawy, A.M.; Elhity, M.A.; Abdel-dayem, S.M.; Abdelaziz, M.N.; Assaha, D.V.M.; Ueda, A.; Saneoka, H. Differential responses of two Egyptian barley (Hordeum vulgare L.) cultivars to salt stress. Plant Physiol. Biochem. 2018, 127, 425–435. [Google Scholar] [CrossRef]
  10. Munns, R. Genes and salt tolerance: Bringing them together. New Phytol. 2005, 167, 645–663. [Google Scholar] [CrossRef]
  11. Munns, R.; Tester, M. Mechanisms of salinity tolerance. Annu. Rev. Plant Biol. 2008, 59, 651–681. [Google Scholar] [CrossRef] [PubMed]
  12. Stadnik, B.; Tobiasz-Salach, R.; Mazurek, M. Physiological and Epigenetic Reaction of Barley (Hordeum vulgare L.) to the Foliar Application of Silicon under Soil Salinity Conditions. Int. J. Mol. Sci. 2022, 23, 1149. [Google Scholar] [CrossRef] [PubMed]
  13. Khalil, S.R.M.; Ashoub, A.; Hussein, B.A.; Brüggemann, W.; Hussein, E.H.A.; Tawfik, M.S. Physiological and molecular evaluation of ten Egyptian barley cultivars under salt stress conditions. J. Crop Sci. Biotechnol. 2021, 20, 9669–9681. [Google Scholar] [CrossRef]
  14. Abdelaal, K.; Mazrou, Y.; Hafez, Y. Effect of slicon and carrot extract on morphophysiological characters of pea (Pisum sativum L.) under salinity stress conditions. Fresenius Environ. Bull. 2022, 31, 608–615. [Google Scholar]
  15. Alnusairi, G.S.H.; Mazrou, Y.S.A.; Qari, S.H.; Elkelish, A.A.; Soliman, M.H.; Eweis, M.; Abdelaal, K.; El-Samad, G.A.; Ibrahim, M.F.M.; ElNahhas, N. Exogenous Nitric Oxide Reinforces Photosynthetic Efficiency, Osmolyte, Mineral Uptake, Antioxidant, Expression of Stress-Responsive Genes and Ameliorates the Effects of Salinity Stress in Wheat. Plants 2021, 10, 1693. [Google Scholar] [CrossRef]
  16. El-Flaah, R.F.; El-Said, R.A.R.; Nassar, M.A.; Hassan, M.; Abdelaal, K.A.A. Effect of rhizobium, nano silica and ascorbic acid on morpho-physiological characters and gene expression of POX and PPO in faba bean (Vicia faba L.) Under salinity stress conditions. Fresenius Environ. Bull. 2021, 30, 5751–5764. [Google Scholar]
  17. Helaly, M.N.; Mohammed, Z.; El-Shaeery, N.I.; Abdelaal, K.A.; Nofal, I.E. Cucumber grafting onto pumpkin can represent an interesting tool to minimize salinity stress. Physiological and anatomical studies. Middle East J. Agric. Res. 2017, 6, 953–975. [Google Scholar]
  18. Arzani, A. Improving salinity tolerance in crop plants: A biotechnological view. In Vitro Cell. Dev. Biol. Plant 2008, 44, 373–383. [Google Scholar] [CrossRef]
  19. Hafez, Y.M.; Attia, K.A.; Alamery, S.; Ghazy, A.; Al-Dosse, A.; Ibrahim, E.; Rashwan, E.; El-Maghraby, L.; Awad, A.; Abdelaal, K.A.A. Beneficial Effects of Biochar and Chitosan on Antioxidative Capacity, Osmolytes Accumulation, and Anatomical Characters of Water-Stressed Barley Plants. Agronomy 2020, 10, 630. [Google Scholar] [CrossRef]
  20. Abdelaal, K.A.A.; Attia, K.A.; Alamery, S.F.; El-Afry, M.M.; Ghazy, A.I.; Tantawy, D.S.; Al-Doss, A.A.; El-Shawy, E.-S.E.; Abu-Elsaoud, A.M.; Hafez, Y.M. Exogenous Application of Proline and Salicylic Acid can Mitigate the Injurious Impacts of Drought Stress on Barley Plants Associated with Physiological and Histological Characters. Sustainability 2020, 12, 1736. [Google Scholar] [CrossRef]
  21. Abdelaal, K.A.A.; EL-Shawy, E.A.; Hafez, Y.M.; Abdel-Dayem, S.M.; Chidya, R.C.G.; Saneoka, H.; EL Sabagh, A. Nano-Silver and non-traditional compounds mitigate the adverse effects of net blotch disease of barley in correlation with up-regulation of antioxidant enzymes. Pak. J. Bot. 2020, 52, 1065–1072. [Google Scholar] [CrossRef]
  22. El-Nashaar, F.; Hafez, Y.M.; Abdelaal, K.A.A.; Abdelfatah, A.; Badr, M.; El-Kady, S.; Yousef, A. Assessment of host reaction and yield losses of commercial barley cultivars to Drechslera teres the causal agent of net blotch disease in Egypt. Fresenius Environ. Bull. 2020, 29, 2371–2377. [Google Scholar]
  23. Abdelaal, K.A.; Hafez, Y.M.; El-Afry, M.M.; Tantawy, D.S.; Alshaal, T. Effect of some osmoregulators on photosynthesis, lipid peroxidation, antioxidative capacity and productivity of barley (Hordeum vulgare L.) under water deficit stress. Environ. Sci. Pollut. Res. 2018, 25, 30199–30211. [Google Scholar] [CrossRef] [PubMed]
  24. FAO. The State of Food Agriculture Overcoming Water Challenges in Agriculture; Food and Agriculture Organization: Rome, Italy, 2020. [Google Scholar]
  25. Kanbar, A.; El drussi, I. Effect of Salinity Stress on Germination and Seedling Growth of Barley (Hordeum vulgare L.) Varieties. Adv. Environ. Biol. 2014, 244–248. Available online: https://link.gale.com/apps/doc/A375184626/AONE?u=anon~ed580df7&sid=googleScholar&xid=8bd31daa (accessed on 9 September 2022).
  26. Porra, R.J.; Thompson, W.A.; Kriedemann, P.E. Determination of accurate extinction coefficients and simultaneous equations for assaying chlorophylls a and b extracted with four different solvents: Verification of the concentration of chlorophyll standards by atomic absorption spectrometry. Biochem. Biophys. Acta 1989, 975, 384–394. [Google Scholar] [CrossRef]
  27. El- Wakeel, S.; Abdel-Azeem, A.; Mostafa, E. Assessment of salinity stress tolerance in some barley genotypes. Alex. J. Agric. Sci. 2019, 64, 195–206. [Google Scholar]
  28. Maršálová, L.; Vítámvás, P.; Hynek, R.; Prášil, I.T.; Kosová, K. Proteomic Response of Hordeum vulgare cv. Tadmor and Hordeum marinum to Salinity Stress: Similarities and Differences between a Glycophyte and a Halophyte. Front. Plant Sci. 2016, 7, 1154. [Google Scholar] [CrossRef]
  29. Docquier, S.; Kevers, C.; Lambé, P.; Gaspar, T.; Dommes, J. Beneficial use of lignosulfonates in in vitro plant cultures: Stimulation of growth, of multiplication and of rooting. Plant Cell Tissue Organ Cult. 2007, 90, 285–291. [Google Scholar] [CrossRef]
  30. Gupta, B.; Huang, B. Mechanism of salinity tolerance in plants: Physiological, biochemical, and molecular characterization. Int. J. Genom. 2014, 2014, 701596. [Google Scholar] [CrossRef]
  31. Gupta, S.; Manoj, G.; Kulkarni, J.; White, F.; Wendy, A.; Stirk, H.; Papenfus, B.; Karel, D.; Vince, Ö.; Jeffrey, N.; et al. Chapter 1—Categories of Various Plant Biostimulants—Mode of Application and Shelf-Life, Biostimulants for Crops from Seed Germination to Plant Development; Academic Press: Cambridge, MA, USA, 2021; pp. 1–60. ISBN 9780128230480. [Google Scholar]
  32. Desoky, E.S.M.; Elrys, A.S.; Mansour, E.; Eid, R.S.M.; Selem, E.; Rady, M.M.; Ali, E.F.; Mersal, G.A.M.; Semida, W.M. Application of biostimulants promotes growth and productivity by fortifying the antioxidant machinery and suppressing oxidative stress in faba bean under various abiotic stresses. Sci. Hortic. 2021, 288, 110340. [Google Scholar] [CrossRef]
  33. Van Oosten, M.J.; Pepe, O.; De Pascale, S.; Silletti, S.; Maggi, A. The Role of Biostimulants and Bioeffectors as Alleviators of Abiotic Stress in Crop Plants. Chem. Biol. Technol. Agric. 2017, 4, 5. [Google Scholar] [CrossRef]
  34. Gul, S.; Yanni, S.F.; Whalen, J.K. Lignin controls on soil ecosystem services: Implications for biotechnological advances. Biochem. Res. Trends Nova Sci. Publ. 2014, 978, 375–416. [Google Scholar]
  35. Ertani, A.; Nardi, S.; Francioso, O.; Pizzeghello, D.; Tinti, A. Metabolite-Targeted Analysis and Physiological Traits of Zea mays L. in Response to Application of a Products for Their Evaluation as Potential Biostimulants. Agronomy 2019, 9, 445. [Google Scholar] [CrossRef]
  36. Kok, A.D.; Wan, W.M.A.N.; Tang, C.N. Sodium lignosulfonate improves shoot growth of Oryza sativa via enhancement of photosynthetic activity and reduced accumulation of reactive oxygen species. Sci. Rep. 2021, 11, 13226. [Google Scholar] [CrossRef] [PubMed]
  37. Zörb, C.; Geilfus, C.M.; Dietz, K.J. Salinity and crop yield. Plant Biol. 2019, 21, 31–38. [Google Scholar] [CrossRef]
  38. Porra, R.J. The chequered history of the development and use of simultaneous equations for the accurate determination of chlorophylls a and b. Photosynth. Res. 2002, 73, 149–156. [Google Scholar] [CrossRef]
  39. Gonzalez, L.; Gonzalez-Vilar, M. Determination of relative water content. In Handbook of Plant Ecophysiology Techniques; Springer: Dordrecht, The Netherlands, 2001; pp. 207–212. [Google Scholar]
  40. Murray, B.Y.M.B.; Cape, J.N.; Fowler, D. Quantification of frost damage in plant tissues by rates of electrolyte leakage. New Phytol. 1989, 113, 307–311. [Google Scholar] [CrossRef]
  41. Takagi, H.; Yamada, S.; Takagi, H.; Yamada, S. Soil Science and Plant Nutrition Roles of enzymes in anti-oxidative response system on three species of chenopodiaceous halophytes under NaCl-stress condition Roles of enzymes in anti-oxidative response system on three species of chenopodiaceous halophyte. Soil Sci. Plant Nutr. 2013, 59, 603–611. [Google Scholar] [CrossRef]
  42. Chance, B.; Meahly, A.C. Catalase Assay by Disappearance of Peroxide. Methods Enzymol. 1955, 2, 764–775. [Google Scholar]
  43. Rahman, A.; Nahar, K.; Hasanuzzaman, M.; Fujita, M. Calcium supplementation improves Na+/K+ ratio, antioxidant defense and glyoxalase systems in salt-stressed rice seedlings. Front. Plant Sci. 2016, 7, 609. [Google Scholar] [CrossRef]
  44. Sanful, R.E.; Darko, S. Utilization of soybean flour in the production of bread. Pak. J. Nutr. 2010, 9, 815–818. [Google Scholar] [CrossRef]
  45. Gomez, K.A.; Gomez, A.A. Statistical Procedures for Agricultural Research; John Wiley and Sons, Inc.: New York, NY, USA, 1984. [Google Scholar]
  46. Duncan, D.B. Multiple range and multiple F tset. Biometrics 1955, 11, 1–42. [Google Scholar] [CrossRef]
  47. Noreen, S.; Faiz, S.; Akhter, M.S.; Shah, K.H. Influence of foliar application of osmoprotectants to ameliorate salt stress in sunflower (Helianthus annuus L.). Sarhad J. Agric. 2019, 34, 1316–1325. [Google Scholar] [CrossRef]
  48. Fayez, K.A.; Bazaid, S.A. Improving drought and salinity tolerance in barley by application of salicylic acid and potassium nitrate. J. Saudi Soc. Agric. Sci. 2014, 13, 45–55. [Google Scholar] [CrossRef]
  49. Fahad, S.; Bano, A. Effect of salicylic acid on physiological and biochemical characterization of maize grown in saline area. Pak. J. Bot. 2012, 44, 1433–1438. [Google Scholar]
  50. Kang, F.; Lv, Q.l.; Liu, J.; Meng, Y.-S.; Wang, Z.-H.; Ren, X.-Q.; Hu, S.-W. Organic–inorganic calcium lignosulfonate compounds for soil acidity amelioration. Environ. Sci Pollut Res. 2022. [Google Scholar] [CrossRef]
  51. Hafez, Y.; Elkohby, W.; Mazrou, Y.S.A.; Ghazy, M.; Elgamal, A.; Abdelaal, K.A.A. Alleviating the detrimental impacts of salt stress on morpho-hpysiological and yield characters of rice plants (Oryza sativa L.) using actosol, Nano-Zn and Nano-Si. Fresenius Environ. Bull. 2020, 29, 6882–6897. [Google Scholar]
  52. Abdelaal, K.A.A.; El-Afry, M.; Metwaly, M.; Zidan, M.; Rashwan, E. Salt tolerance activation in faba bean plants using proline and salicylic acid associated with physio-biochemical and yield characters’ improvement. Fresenius Environ. Bull. 2021, 30, 3175–3186. [Google Scholar]
  53. AlKahtani, M.D.F.; Hafez, Y.M.; Attia, K.; Al-Ateeq, T.; Ali, M.A.M.; Hasanuzzaman, M.; Abdelaal, K.A.A. Bacillus thuringiensis and Silicon Modulate Antioxidant Metabolism and Improve the Physiological Traits to Confer Salt Tolerance in Lettuce. Plants 2021, 10, 1025. [Google Scholar] [CrossRef]
  54. Peanparkdee, M.; Iwamoto, S. Bioactive compounds from by-products of rice cultivation and rice processing: Extraction and application in the food and pharmaceutical industries. Trends Food Sci. Technol. 2019, 86, 109–117. [Google Scholar] [CrossRef]
  55. Duncan, E.G.; O’Sullivan, C.A.; Roper, M.M.; Biggs, J.S.; Peoples, M.B. Influence of co-application of nitrogen with phosphorus, potassium and sulphur on the apparent efficiency of nitrogen fertilizer use, grain yield and protein content of wheat: Review. Field Crops Res. 2018, 226, 56–65. [Google Scholar] [CrossRef]
  56. Liu, J.; Hou, H.; Zhao, L.; Sun, Z.; Li, H. Protective Effect of foliar application of sulfur on photosynthesis and antioxidative defense system of rice under the stress of Cd. Sci. Total Environ. 2020, 710, 136230. [Google Scholar] [CrossRef] [PubMed]
  57. Torun, H. Arbuscular Mycorrhizal Fungi and K-Humate Combined as Biostimulants: Changes in Antioxidant Defense System and Radical Scavenging Capacity in Elaeagnus angustifolia. J. Soil Sci. Plant Nutr. 2020, 20, 2379–2393. [Google Scholar] [CrossRef]
  58. Zhu, J.K. Plant salt tolerance. Trends Plant Sci. 2001, 6, 66–71. [Google Scholar] [CrossRef]
  59. Assaha, D.V.M.; Mekawy, A.M.; Ueda, A.; Saneoka, H. Erratum: Salinity-induced expression of HKT may be crucial for Na+ exclusion in the leaf blade of huckleberry (Solanum scabrum Mill.), but not of eggplant (Solanum melongena L.). Biochem. Biophys. Res. Commun. 2015, 463, 1342. [Google Scholar] [CrossRef]
  60. Landlin, G.; Soundarya, M.K.; Bhuvaneshwari, S. Behavior of Lignosulphonate Amended Expansive Soil. In Sustainable Practices and Innovations in Civil Engineering. Lecture Notes in Civil Engineering; Ramanagopal, S., Gali, M., Venkataraman, K., Eds.; Springer: Singapore, 2021; Volume 79, pp. 151–162. [Google Scholar] [CrossRef]
  61. Dave, A.; Agarwal, P.; Agarwal, P.K. Mechanism of high affinity potassium transporter (HKT) towards improved crop productivity in saline agricultural lands. 3 Biotech 2022, 12, 51. [Google Scholar] [CrossRef]
  62. Ikkonen, E.N.; Jurkevich, M.G. Effect of lignosulfonate application to sandy soil on plant nutrition and physiological traits. IOP Conf. Ser. Earth Environ. Sci. 2021, 862, 012079. [Google Scholar] [CrossRef]
Figure 1. Effect of different treatments: (T1) control, (T2) 100 mM NaCl + Ca-LIGNO, (T3) 200 mM NaCl + Ca-LIGNO, (T4) 300 mM NaCl + Ca-LIGNO, (T5) 100 mM NaCl, (T6) 200 mM NaCl, and (T7) 300 mM NaCl on the average (A) shoot dry weight (DW)and (B) root dry weight (DW) of the two barley cultivars, Giza133 and Giza132, during two seasons, 2019/2020 and 2020/2021. Data represent the mean ± SE (n = 4). The same letter indicates no significant difference (p ≤ 0.05).
Agriculture 12 01459 g001
Figure 2. Effect of different treatments: (T1) control, (T2) 100 mM NaCl + Ca-LIGNO, (T3) 200 mM NaCl + Ca-LIGNO, (T4) 300 mM NaCl + Ca-LIGNO, (T5) 100 mM NaCl, (T6) 200 mM NaCl, and (T7) 300 mM NaCl on the average (A) shoot length and (B) root length of the two barley cultivars, Giza133 and Giza132, during two seasons, 2019/2020 and 2020/2021. Data represent the mean ± SE (n = 4). The same letter indicates no significant difference (p ≤ 0.05).
Agriculture 12 01459 g002
Figure 3. Effect of different treatments: (T1) control, (T2) 100 mM NaCl + Ca-LIGNO, (T3) 200 mM NaCl + Ca-LIGNO, (T4) 300 mM NaCl + Ca-LIGNO, (T5) 100 mM NaCl, (T6) 200 mM NaCl, and (T7) 300 mM NaCl on the average (A) leaf area (LA) and (B) total leaf area (TLA) of the two barley cultivars, Giza133 and Giza132, during two seasons, 2019/2020 and 2020/2021. Data represent the mean ± SE (n = 4). The same letter indicates no significant difference (p ≤ 0.05).
Agriculture 12 01459 g003
Figure 4. Effect of different treatments: (T1) control, (T2) 100 mM NaCl + Ca-LIGNO, (T3) 200 mM NaCl + Ca-LIGNO, (T4) 300 mM NaCl + Ca-LIGNO, (T5) 100 mM NaCl, (T6) 200 mM NaCl, and (T7) 300 mM NaCl on the average relative water content (RWC) of the two barley cultivars, Giza133 and Giza132, during two seasons, 2019/2020 and 2020/2021. Data represent the mean ± SE (n = 4). The same letter indicates no significant difference (p ≤ 0.05).
Agriculture 12 01459 g004
Figure 5. Effect of different treatments: (T1) control, (T2) 100 mM NaCl + Ca-LIGNO, (T3) 200 mM NaCl + Ca-LIGNO, (T4) 300 mM NaCl + Ca-LIGNO, (T5) 100 mM NaCl, (T6) 200 mM NaCl, and (T7) 300 mM NaCl on the average electrolyte leakage ratio (ELR) in (A) leaf and (B) root of the two barley cultivars, Giza133 and Giza132, during two seasons, 2019/2020 and 2020/2021. Data represent the mean ± SE (n = 4). The same letter indicates no significant difference (p ≤ 0.05).
Agriculture 12 01459 g005
Figure 6. Effect of different treatments: (T1) control, (T2) 100 mM NaCl + Ca-LIGNO, (T3) 200 mM NaCl + Ca- LIGNO, (T4) 300 mM NaCl + Ca-LIGNO, (T5) 100 mM NaCl, (T6) 200 mM NaCl, and (T7) 300 mM NaCl on the average peroxide enzyme activity (POD) in (A) leaf and (B) root of the two barley cultivars, Giza133 and Giza132, during two seasons, 2019/2020 and 2020/2021. Data represent the mean ± SE (n = 4). The same letter indicates no significant difference (p ≤ 0.05).
Agriculture 12 01459 g006
Figure 7. Effect of different treatments: (T1) control, (T2) 100 mM NaCl + Ca−LIGNO, (T3) 200 mM NaCl + Ca−LIGNO, (T4) 300 mM NaCl + Ca−LIGNO, (T5) 100 mM NaCl, (T6) 200 mM NaCl, and (T7) 300 mM NaCl on the average Na+ concentrations in leaf (A) and root (B) and K+ concentrations in leaf (C) and root (D) of the two barley cultivars, Giza133 and Giza132, during two seasons, 2019/2020 and 2020/2021.
Agriculture 12 01459 g007
Table 1. The environmental conditions of the experiment during both seasons 2019/2020 and 2020/2021.
YearMonthsTemperature
(°C)
Relative Humidity
(RH%)
Wind Velocity (km/24 h)
Min.Max.7:30 a.m.13:30 p.m.
2019November25.127.482.848.336.6
December13.421.486.958.938.5
2020January11.818.486.762.730.0
February12.720.484.656.551.0
March15.622.681.153.980.1
April18.926.080.045.198.8
May23.831.068.938.414.4
November17.525.080.756.846.9
December13.722.987.755.744.9
2021January13.521.086.759.539.2
February12.521.587.555.958.3
March16.523.883.655.281.5
April19.527.678.642.095.9
May25.132.165.333.812.4
Max.: maximum, Min.: minimum (these numbers are calculated as the grand mean of 30 days of data).
Table 2. Means of shoot and root lengths, shoot and root dry weights, Na+ and K+ concentrations, and peroxide enzyme activity in both leaf and root tissues of Giza133 and Giza132 barley cultivars under different treatments (control, NaCl concentrations, and NaCl concentrations + Ca-LIGNO) during two seasons 2019/2020 and 2020/2021.
Characteristics
Treatments
Shoot Length (cm)Root Length (cm)Shoot Dry Weight (gm)Root Dry Weight (gm)Na+
Concentration
(mg gm−1 DW)
K+
Concentration
(mg gm−1 DW)
POD Enzyme Activity in (µmol gm−1 min−1)
LeafRootLeafRootLeafRoot
Seasons
First (2019/2020)40.6842.093.863.1367.1843.6521.2116.048.957.85
Second (2020/2021)42.9043.864.674.9568.2344.6522.3117.009.708.51
F. Test*N.S**N.SN.SN.SN.S****
Cultivars
Giza13341.6742.303.243.7254.2433.8223.4218.2712.337.20
Giza13241.9043.652.292.3680.1353.4919.0113.806.329.15
F. TestN.SN.S****************
Treatments
Control41.1948.062.562.940.700.2535.9623.364.104.01
100 mM NaCl + Ca-LIGNO47.2547.383.814.7736.9113.7129.7520.902.846.23
200 mM NaCl + Ca-LIGNO44.2842.103.763.7243.9435.2327.3718.673.827.31
300 mM NaCl + Ca-LIGNO44.0944.442.752.4558.7143.7021.3714.999.419.93
100 mM NaCl40.6041.392.342.7562.6435.7514.1014.1611.376.68
200 mM NaCl38.0937.212.252.4479.0261.5111.1311.7013.826.83
300 mM NaCl37.0040.251.902.23188.36115.428.838.5019.9316.23
F. Test********************
L.S.D 2.7826.0330.23340.435612.0217.556.3432.9273.3673.778
L.S. D0.05, least significant differences at 0.05 probability level and *, ** and N.S state the significant, highly significant and not significant respectively.
Table 3. Means of relative water content (RWC), leaf and root electrolyte leakage rate (ELR), leaf area (LA), and total leaf area (TLA), and different pigments concentrations (chlorophyll a, chlorophyll b, total chlorophyll, and total carotenoids) in the leaves of Giza133 and Giza132 barley cultivars under different treatments (control, NaCl concentrations, and NaCl concentrations + Ca-LIGNO) during two seasons, 2019/2020 and 2020/2021.
Characteristics
Treatments
Relative Water Content
(RWC)
(%)
Electrolyte Leakage Rate
(ELR)
(%)
Leaf Area (LA)
(cm2 Plant−1)
Total Leaf Area (TLA) (cm2 Plant−1)Chlorophyll a
(Chll a)
(µg mg−1 FW)
Chlorophyll b (Chll b)
(µg mg−1 FW)
Total Chlorophyll Content
(µg mg−1 FW)
Total Carotenoids Content
(µg mg−1 FW)
LeafRoot
Seasons
First (2019/2020)92.1178.4978.2530.08270.751.201.221.421.05
Second (2020/2021)91.1177.4676.4332.22264.072.412.422.622.26
F. TestN.SN.SN.S*N.S********
Cultivars
Giza13392.8661.2885.6132.16290.612.292.332.532.14
Giza13290.3694.6670.0730.14250.210.320.310.510.18
F. Test*******N.S********
Treatment
Control98.1746.3480.2930.76267.591.531.511.711.39
100 mM NaCl + Ca-LIGNO97.6527.0257.9140.94326.082.302.352.562.16
200 mM NaCl + Ca-LIGNO96.8648.6376.2235.92224.471.992.012.201.84
300 mM NaCl + Ca-LIGNO92.4872.7973.0931.35379.011.501.521.711.35
100 mM NaCl87.21100.9975.5426.77200.030.760.770.980.61
200 mM NaCl88.58113.1677.9228.50219.850.550.590.790.41
300 mM NaCl80.33136.88103.9023.80275.850.490.500.690.36
F. Test******************
L.S.D4.17111.4510.502.86793.890.02230.02230.02240.0315
L.S.D0.05, least significant differences at 0.05 probability level and *, ** and N.S state the significant, highly significant and not significant respectively.
Table 4. Means of plant height, spike length, number of grains spike−1, grain yield pot−1, 1000-grain weight, and grain protein content of Giza133 and Giza132 barley cultivars under different treatments (control, NaCl concentrations, and NaCl concentrations + Ca-LIGNO) during, two seasons 2019/2020 and 2020/2021.
Characteristics
Treatments
Plant Height (cm)Spike Length (cm)No. Grains Spike−1Grain Yield Pot−1
(gm)
1000-Grain
Weight (gm)
Grain Protein Content (%)
Seasons
First (2019/2020)48.396.707.7315.5329.9710.78
Second (2020/2021)52.168.689.2818.0831.9410.87
F. Test******
Cultivars
Giza13351.828.199.8118.3533.1311.70
Giza13248.739.1810.1913.2624.7710.59
F. Test****N.S*****
Treatments
Control56.429.1110.0515.4137.39.38
100 mM NaCl + Ca-LIGNO59.969.9110.2829.1544.311.20
200 mM NaCl + Ca-LIGNO46.579.1310.6917.6429.711.90
300 mM NaCl + Ca-LIGNO47.267.578.8313.3022.113.06
100 mM NaCl51.928.4910.0912.9624.39.54
200 mM NaCl48.728.6610.3512.1921.510.08
300 mM NaCl41.077.939.739.9823.610.67
F. Test************
L.S.D 2.9240.36230.53512.3654.1440.224
L.S.D0.05, least significant differences at 0.05 probability level and *, ** and N.S state the significant, highly significant and not significant respectively.
Table 5. Different pigments’ concentrations (chlorophyll a, chlorophyll b, total chlorophyll content, total carotenoids) in the leaf tissues of Giza133 and Giza132 barley cultivars under various treatments (control, NaCl concentrations, and NaCl concentrations + Ca-LIGNO) during two seasons, 2019/2020 and 2020/2021, in combined analysis.
CultivarsTreatmentsChlorophyll a (Chll a) (µg mg−1 FW)Chlorophyll b (Chll b)
(µg mg−1 FW)
Total Chlorophyll Content
(µg mg−1 FW)
Total Carotenoids Content
(µg mg−1 FW)
Giza133Control2.71 ± 0.002.67 ± 0.012.88 ± 0.012.56 ± 0.00
100 mM NaCl + Ca-LIGNO4.20 ± 0.004.28 ± 0.014.49 ± 0.014.05 ± 0.00
200 mM NaCl + Ca-LIGNO3.70 ± 0.003.81 ± 0.004.01 ± 0.003.54 ± 0.00
300 mM NaCl + Ca-LIGNO2.70 ± 0.002.74 ± 0.002.94 ± 0.012.55 ± 0.00
100 mM NaCl1.21 ± 0.001.25 ± 0.011.47 ± 0.011.06 ± 0.00
200 mM NaCl0.80 ± 0.000.86 ± 0.011.06 ± 0.010.66 ± 0.00
300 mM NaCl0.70 ± 0.000.72 ± 0.000.92 ± 0.000.56 ± 0.00
Giza132Control0.36 ± 0.000.34 ± 0.010.55 ± 0.010.21 ± 0.00
100 mM NaCl + Ca-LIGNO0.40 ± 0.000.42 ± 0.010.63 ± 0.020.26 ± 0.00
200 mM NaCl + Ca-LIGNO0.29 ± 0.000.21 ± 0.000.40 ± 0.020.15 ± 0.00
300 mM NaCl + Ca-LIGNO0.29 ± 0.000.29 ± 0.000.48 ± 0.000.16 ± 0.00
100 mM NaCl0.31 ± 0.000.29 ± 0.010.49 ± 0.010.16 ± 0.00
200 mM NaCl0.30 ± 0.000.32 ± 0.020.52 ± 0.000.16 ± 0.00
300 mM NaCl0.29 ± 0.000.28 ± 0.020.47 ± 0.020.16 ± 0.00
F. Test********
L.S.D0.03140.03160.03150.0445
L.S.D0.05, least significant differences at 0.05 probability level and ** and N.S state the significant, highly significant and not significant respectively. Values are means ± SE of 4 replicates.
Table 6. Plant height, spike length, number of grains spike-1, grain yield pot-1, 1000-grain weight, and grain protein content of Giza133 and Giza132 barley cultivars under various treatments: (control, NaCl concentrations, and NaCl concentrations + Ca-LIGNO) during two seasons, 2019/2020 and 2020/2021, in combined analysis.
CultivarsTreatmentsPlant Height
(cm)
Spike Lengths (cm)No. Grains Spike−11000-Grain Weight (gm)Grain Yield Pot−1 (gm)Grain Protein Content (%)
Giza133Control55.42 ± 2.058.46 ± 0.1510.20 ± 0.2542.50 ± 1.7914.65 ± 0.519.48 ± 0.01
100 mM NaCl + Ca-LIGNO60.67 ± 1.779.88 ± 0.128.95 ± 0.0950.00 ± 2.1835.92 ± 2.1511.36 ± 0.01
200 mM NaCl + Ca-LIGNO48.48 ± 0.978.80 ± 0.1410.40 ± 0.1933.38 ± 0.2621.83 ± 1.1812.13 ± 0.01
300 mM NaCl + Ca-LIGNO51.17 ± 0.757.15 ± 0.128.40 ± 0.1423.38 ± 1.1715.75 ± 0.7713.82 ± 0.01
100 mM NaCl52.29 ± 0.467.61 ± 0.0210.18 ± 0.2726.68 ± 3.7413.84 ± 0.089.65 ± 0.04
200 mM NaCl51.55 ± 0.538.13 ± 0.0710.88 ± 0.1726.13 ± 3.5014.18 ± 0.3310.23 ± 0.02
300 mM NaCl43.20 ± 0.687.33 ± 0.269.68 ± 0.0629.86 ± 4.2512.29 ± 0.4410.88 ± 0.02
Giza132Control57.42 ± 1.409.77 ± 0.299.90 ± 0.3032.00 ± 0.8316.18 ± 0.679.27 ± 0.03
100 mM NaCl + Ca-LIGNO59.25 ± 0.449.95 ± 0.1111.60 ± 0.1538.50 ± 1.1522.38 ± 1.0411.04 ± 0.03
200 mM NaCl + Ca-LIGNO44.67 ± 0.619.45 ± 0.1510.98 ± 0.2126.00 ± 0.7513.45 ± 0.2111.66 ± 0.04
300 mM NaCl + Ca-LIGNO43.35 ± 0.388.00 ± 0.239.25 ± 0.3520.75 ± 0.6310.85 ± 0.9912.30 ± 0.02
100 mM NaCl51.55 ± 1.209.38 ± 0.1610.00 ± 0.0222.00 ± 0.4812.08 ± 0.109.44 ± 0.02
200 mM NaCl45.89 ± 1.039.20 ± 0.059.83 ± 0.2816.88 ± 0.1210.20 ± 0.159.95 ± 0.62
300 mM NaCl38.95 ± 0.408.54 ± 0.139.78 ± 0.2117.28 ± 0.977.68 ± 0.4210.46 ± 0.02
F. Test **********
L.S.D 4.1350.51240.75685.8613.3450.3164
LSD0.05, least significant differences at 0.05 probability level and *, ** and N.S state the significant, highly significant and not significant respectively. Values are means ± SE of 4 replicates.
Publisher’s Note: MDPI stays neutral with regard to jurisdictional claims in published maps and institutional affiliations.

