Article

Detection of Wheat Lodging by Binocular Cameras during Harvesting Operation

1
School of Mechanical Engineering, Beijing Institute of Technology, Beijing 100081, China
2
Beijing Research Center of Intelligent Equipment for Agriculture, Beijing Academy of Agriculture and Forestry Sciences, Beijing 100097, China
3
National Research Center of Intelligent Equipment for Agriculture, Beijing 100097, China
4
College of Engineering, China Agricultural University, Beijing 100083, China
*
Author to whom correspondence should be addressed.
Agriculture 2023, 13(1), 120; https://doi.org/10.3390/agriculture13010120
Submission received: 29 October 2022 / Revised: 6 December 2022 / Accepted: 22 December 2022 / Published: 31 December 2022
(This article belongs to the Section Agricultural Technology)

Abstract

:
Wheat lodging provides important reference information for self-adaptive header control of a combine harvester. Aimed at real-time detection of wheat lodging, this paper proposed a detection method of wheat lodging location and area based on binocular vision. In this method, the angle relationship between the stem and vertical direction when wheat is upright, inclined, and lodging was determined by mechanical analysis. The discrimination condition of the wheat lodging degree was proposed based on the height of the visual point cloud on the surface of wheat crops. The binocular camera was used to obtain the image parallax of wheat within the harvesting region. The binocular camera optical axis parallel model was used to calculate the three-dimensional coordinate of wheat. Then, the height of the wheat stem was obtained by further analysis and calculation. According to the wheat stem height detected by vision, the location and area of wheat lodging within the combine harvester’s harvesting region were analyzed. A field experiment showed that the detection error of the wheat stem height was 5.5 cm and the algorithm speed was under 2000 milliseconds, which enabled the analysis and calculation of the wheat lodging location, contour, and area within the combine harvester’s harvesting region. This study provides key information for adaptive header control of combine harvesters.

1. Introduction

Wheat lodging is one of the most common agriculture disasters. It negatively affects wheat production and brings great difficulties to mechanical grain harvest [1,2,3]. In order to improve harvesting efficiency, the header height of a combine harvester needs to be adjusted properly according to real-time wheat lodging information. The adjustment of header height is largely by hand in China, which seriously affects harvesting efficiency and greatly increases a driver’s labor intensity. With the development of intelligent control technology, the adaptive control of a combine harvester’s header height has become the main development trend [4,5,6,7,8]. Wheat lodging detection is an essential trait for maintaining reference information for changing the header height and harvest direction [9].
Wheat lodging detection mainly adopts the remote sensing platform to obtain multispectral images. The Unmanned Aerial Vehicle (UAV) equipped with various cameras, as one of the most common methods, is used to collect crop images or spectral information [10,11,12,13,14,15,16]. Zhang acquired aerial images from unmanned aerial systems (UAS) and evaluated and compared the classification accuracy and standard deviation of traditional machine learning and deep learning [17]. Their study explained that GoogLeNet machine learning algorithm can effectively detect wheat lodging with an average accuracy of 93%. Koh, Spangenberg, and Kant collected images of wheat lodging by UAV, and compared the performance of the automated machine learning (AutoML) framework with AutoKeras and modern convolutional neural network (CNN) architectures in the above studies [18]. They proposed the potential of AutoML in plant phenotyping detection. In the studies above, wheat lodging detection through remote sensing focuses on analyzing the information difference between lodging crops and non-lodging crops, further establishing a regression model or image classification model between spectral characteristics and lodging crops, and ultimately analyzing the wheat lodging situation. This method has advantages in agricultural hazard assessment and agricultural insurance claims of large-scale farmland; however, it cannot provide real-time and accurate lodging information for header lifting system of a combine harvester.
With the progress of machine vision technology, vision sensors or LiDAR sensors equipped on a farm robot or mobile platform have been used to real-timely extract crop growth information [19,20,21,22]. Choi proposed a guideline extraction algorithm to improve the tracking accuracy of a rice field weeding robot using a vision camera, and this algorithm was observed to have good performance experimentally with a high accuracy of less than 1° with varying rice plant sizes [23]. He proposed a robust regression least squares method to fit rice rows in a paddy field by machine vision technology, and they effectively eliminate the interference of outliers. The correct recognition rate of fitting lines was 96.32% with a credibility threshold of 40% [24]. Further, Raja, Nguyen, Slaughter, and Fennimore distinguished crops from in-row weeds in complex natural scenarios by crop mapping and decision making technology, and the experimental results showed that crop detection accuracy reached 99.75% [25]. Gené-Mola generated a 3D point cloud of Fuji apples using a mobile terrestrial laser scanner (MTLS) composed of a Velodyne VLP-16 LiDAR sensor synchronized with an RTK-GNSS satellite navigation receiver [26]. On this basis, they proposed a four-step apple detection method that accurately located apples with a success rate of 87.5%. The above studies discussed, installing a vision or lidar sensor on the mobile platform can realize the real-time detection of a specific object such as crops or fruits in the farmland, which is widely used in agricultural robots.
In the previous research, the method of detecting wheat lodging through AutoML, multispectral and aerial images, essentially relies on 2D information collected by monocular camera [27]. The data dimension is insufficient. Although LiDAR can be used to obtain 3D data, LiDAR is expensive. Furthermore, the channels of LiDAR limit the resolution of LiDAR and the application in some cases. However, binocular vision has low cost, simple structure and mature algorithm for obtaining point clouds, which can make up for the above two deficiencies.
In this study, in order to obtain the real-time wheat lodging information during harvesting, a wheat lodging detection method based on binocular vision was proposed in this paper. The collected parallax map was reconstructed in three dimensions to obtain the point cloud on the crop surface. The point cloud height was analyzed and the wheat lodging degree and its proportion in the visual field were analyzed. Then, the lodging location and area of the crop were obtained. The designed monitoring system was verified through experiments. This study provides an important technical support for adaptive adjustment of header height or change speed to avoid the harvester be jammed during harvesting the lodging wheat.

2. Materials and Methods

2.1. Visual Detection Method of Wheat Height

Binocular vision can calculate the spatial coordinates of a 3D object by obtaining the image parallax from two cameras. This study calculated the 3D coordinate of the object based on the binocular camera optical axis parallel model, as shown in Figure 1. In this model, the image planes of two cameras are coplanar (the main optical axis is parallel), and the focal length is the same. Moreover, the projection line coordinate of any point in space on the two image planes is the same.
In the optical axis parallel model, the projection point and image coordinate of the 3D spatial point P on the image plane of the left and right cameras are P l x , y   and P r x , y , respectively. The image coordinates projected by the optical center of the left and right cameras are c x , c y and c x , c y , respectively. In the model, the camera coordinate system of the left camera is used as the world coordinate system. The world coordinate of P is X , Y , Z . The distance between the optical centers of the left and right cameras (the baseline distance) is T x . According to the triangle similarity principle, the following can be deduced:
Z f = Y Y c y = Y Y c y Z f = X x c x Z f = T x X c x x
the equation is solved to obtain:
X = T x x c x d + c x c x Y = T x y c y d + c x c x Z = T x · f d + c x c x
where d = x x is the parallax of matching points. The form of the solution in homogeneous coordinates is:
X Y Z W = 1 0 0 c x 0 1 0 c y 0 0 1 f 0 0 1 / T x c x c x / T x x y d 1 = Q x y d 1
where Q is the re-projection matrix, which can convert the two-dimensional (2D) coordinate of the image into a 3D coordinate. The calculated 3D spatial coordinate is X / W , Y / W , Z / W . Mentioned above is the stereo vision model of the binocular camera with a parallel optical axis, which is also the principle of the binocular camera measuring the location of the 3D spatial object.
According to the binocular camera optical axis parallel model, the camera can be used to perceive the object’s 3D information. If the crop height information in the operation region can be obtained by the binocular camera and compared with the normal crop height, it is possible to distinguish the crop lodging situation in the region and further provide the lodging area information in the visual field. According to this principle, a wheat lodging detection method based on binocular vision was proposed in this study, as shown in Figure 2.
As shown in Figure 2, the binocular camera is installed in front of the grain combine harvester through the camera support. The camera’s visual field is the operation region to be harvested in front of the harvester. Prior to the operation, a calibration plate was placed on the ground within the camera’s visual field. The external parameters of the camera were calibrated through the calibration plate to obtain the position of the camera in the absolute world coordinate system O 0 x 0 y 0 determined by the calibration plate and gain transformation matrix from the camera coordinate system O x y to the absolute world coordinate system O 0 x 0 y 0 . Next, the calibration plate was removed to start harvesting. During the operation, the camera captured the region to be operated in front of the harvester. The 3D coordinate of the front of the crop in the camera coordinate system O x y was obtained through the binocular camera. Presuming that the camera pose relative to the ground remains unchanged during the operation, it can be assumed that there is a coordinate system on the ground every time the camera takes images. The pose of the coordinate system relative to the camera is the same as the absolute world coordinate system, which is called the relative world coordinate system O n x n y n . According to the previously obtained conversion relationship between the camera and the absolute world coordinate system O n x n y n , the 3D coordinate of the crop in the camera coordinate system was converted to the relative world coordinate system O n x n y n so that the 3D coordinate of the crop relative to the ground can be determined. Further, the crop lodging degree was assessed according to the 3D coordinate. The quantitative indicators of the lodging situation were calculated.
For all the 3D coordinates obtained by measuring the crop height within the visual field, the location distribution of a lodging crop in space can be gathered by assessing and marking the data points of the lodging crop through the height distribution. Then, the proportion of the lodging area in the coordinates of all measured wheat can be calculated. The analysis results of the lodging area proportion can be obtained.
As shown in Figure 3, there is an obvious lodging zone from the lower right to the upper left (marked with green) while the rest of the crops are generally upright (marked with red). Lodging wheats usually form a continuous lodging region in which crops push and rely on each other, causing the surface of the region to be basically covered by ear heads, while the stem part is below the surface. Therefore, in this study, the spatial location of the point cloud on the surface of the wheat region obtained by the binocular camera can be approximately regarded as the spatial location of the crop ear heads.

2.2. Discrimination Method of Wheat Lodging State

According to the angle α between the wheat stem and vertical direction, wheat lodging can be divided into three conditions, upright, inclined, and lodging. The standards, Technical Specification for Regional Experiment of Crop Varieties–Wheat, issued by the Ministry of Agriculture of the People’s Republic of China, stipulate the wheat lodging grades shown in Table 1.
According to the classification criteria in Table 1, this study determined grades I and II as wheat in an upright state, grade III as an inclined state, and grades IV and V as the lodging state. According to the above provisions, this study developed a wheat lodging detection method based on the height of the point cloud on the crop surface Z n , as shown in Table 2 [28].
According to the discrimination method of the wheat lodging state in Table 2, the wheat lodging state can be assessed by analyzing and calculating the height of the wheat visual point cloud. Further, the overall crop lodging state in the wheat combine harvester operation region can be obtained.

2.3. Wheat Lodging Image Processing Algorithm

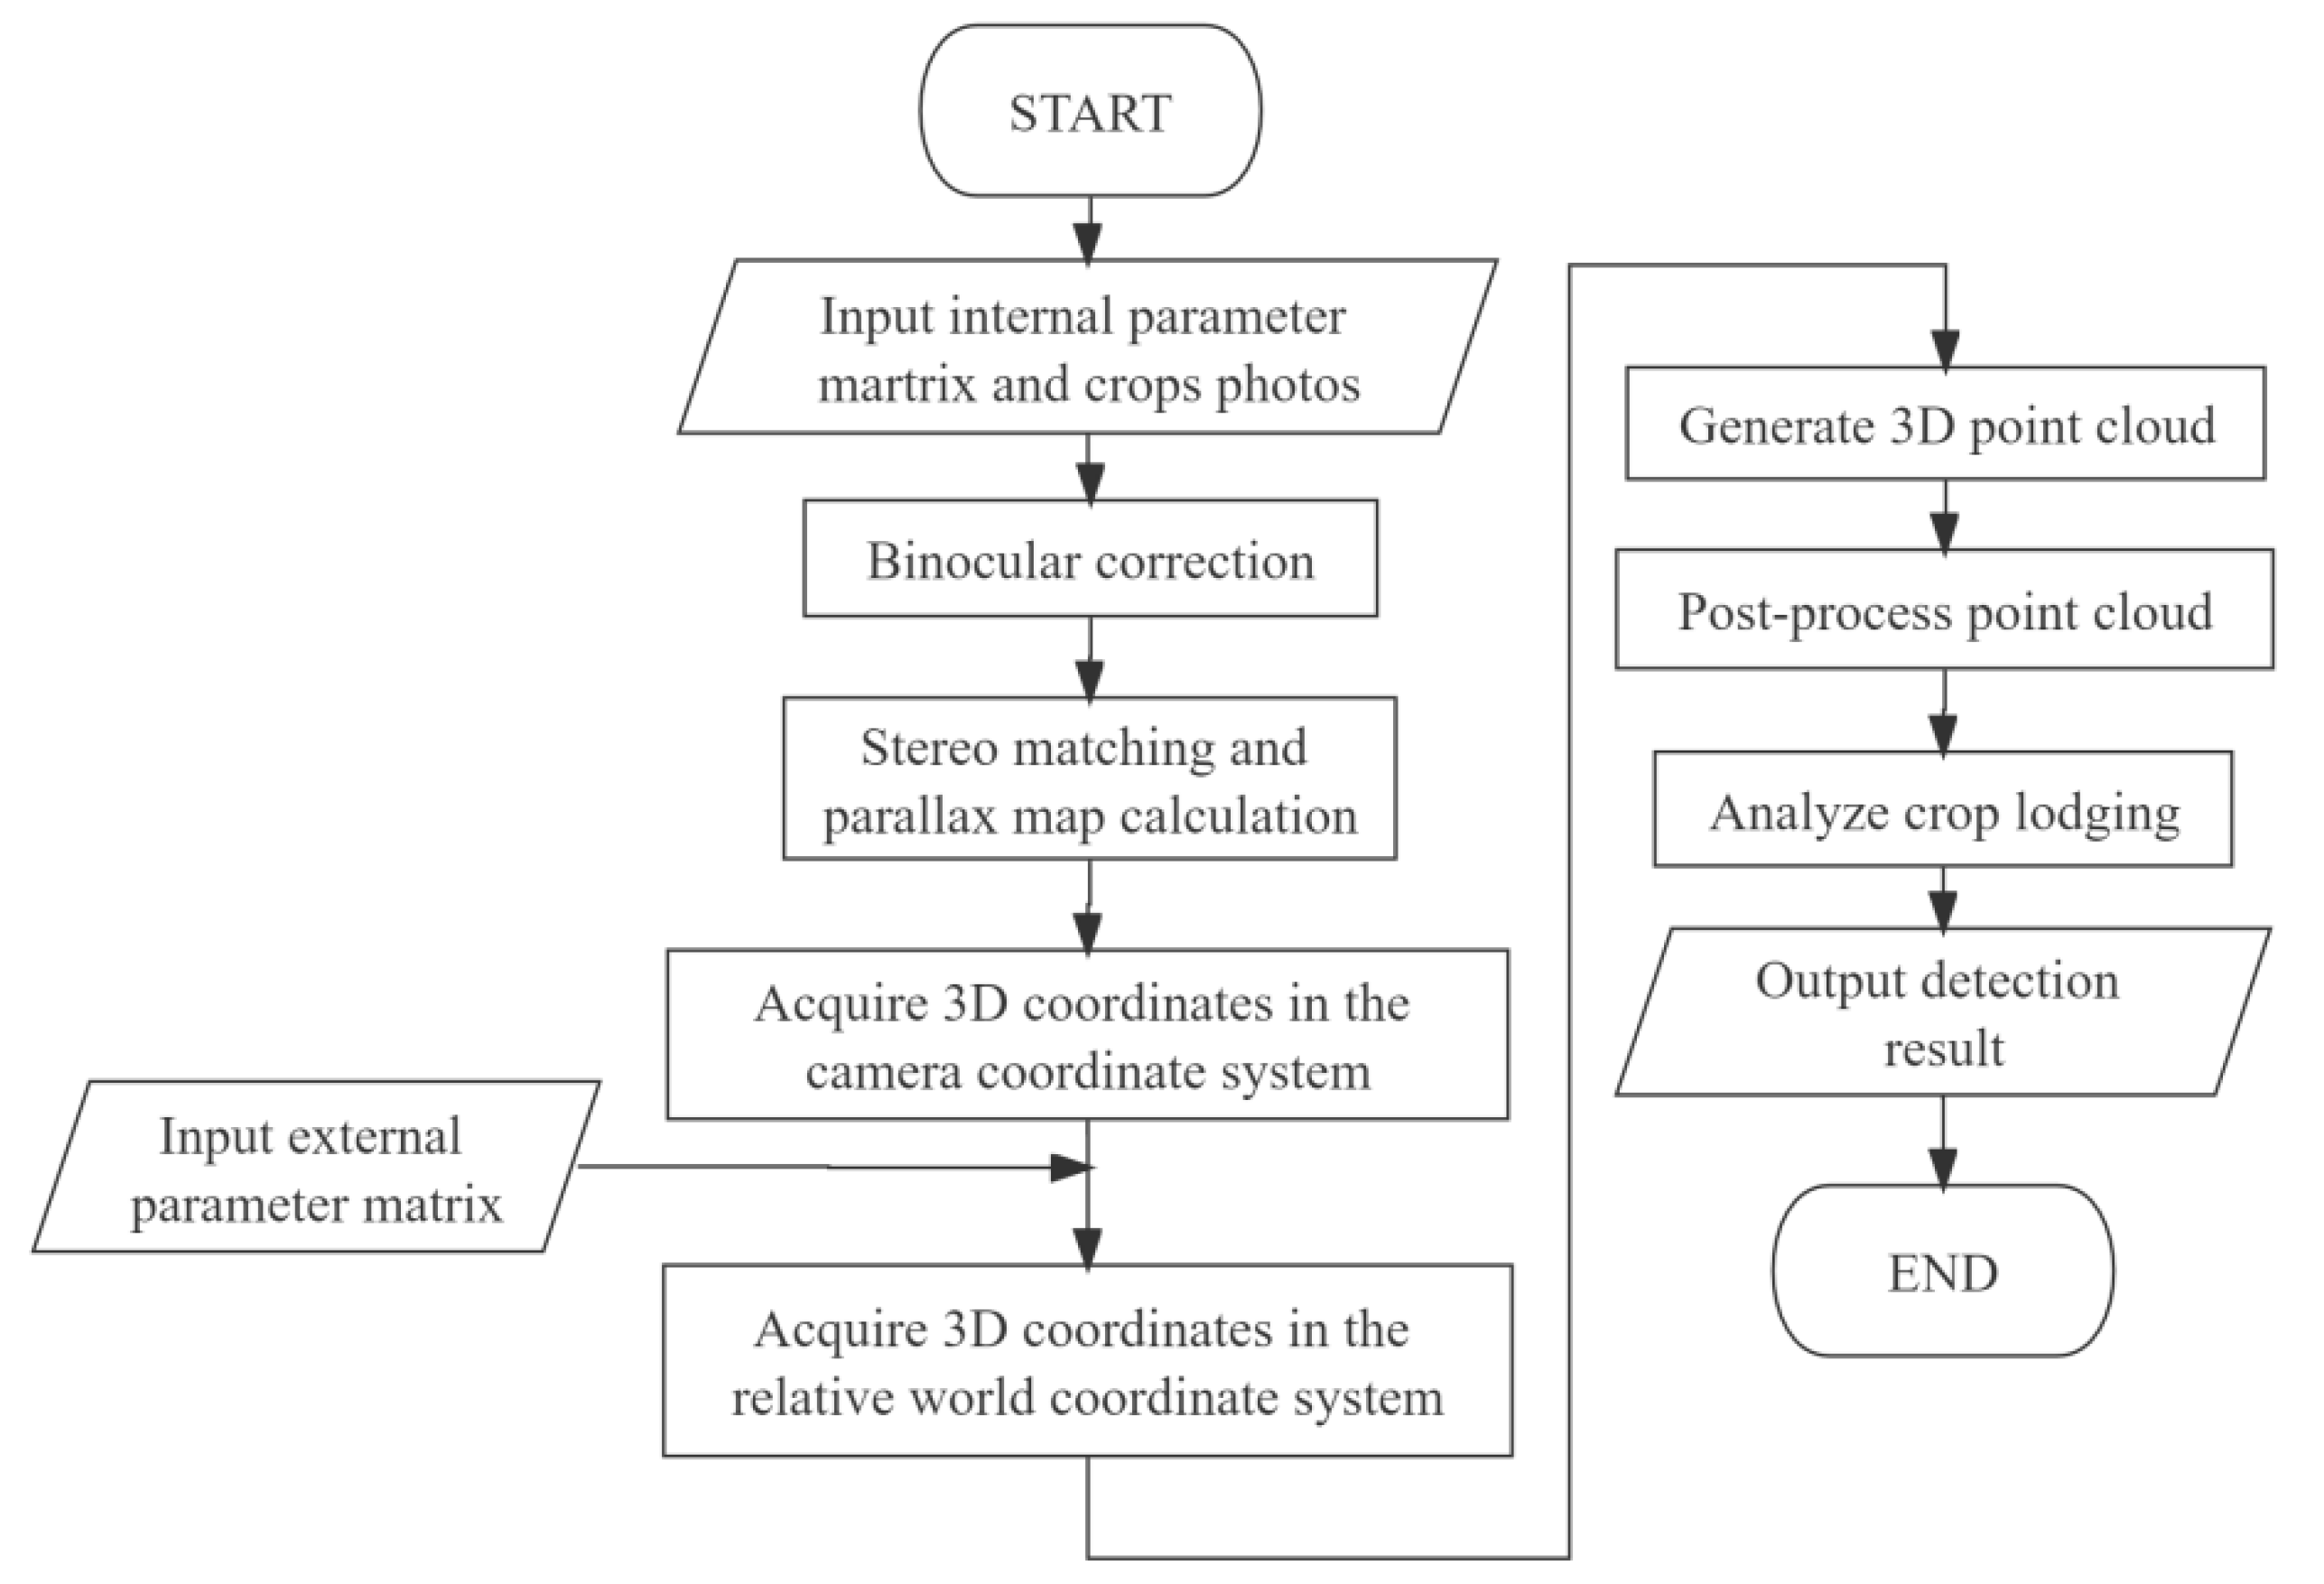
Upon the above algorithm principle, the algorithm was implemented based on C/C++, Opencv, and PCL. First, prior to using the binocular vision lodging detection algorithm, it is necessary to obtain the internal parameters of the binocular camera and the camera pose relative to the absolute world coordinate system. Then, images taken by the left and right cameras are input into the program. Next, according to the input camera internal parameter matrix, distortion parameters, rotation and translation matrix between the left and right cameras, binocular correction is conducted for the two cameras. Binocular correction includes distortion correction and stereo correction. This step can eliminate the distortion error, make the image planes of the left and right cameras coplanar and aligned, and calculate the re-projection matrix. After the correction, the parallax map corresponding to the image is calculated by the binocular stereo matching algorithm. According to the parallax map and re-projection matrix, the 3D coordinate of each pixel point in the camera coordinate system is calculated. Next, the program reads the camera external parameter results obtained at the camera external parameter calibration time, converts the 3D coordinates in the camera coordinate system to the relative world coordinate system, and converts these coordinates into the 3D point cloud. Since the generated initial 3D point cloud has a lot of noise and invalid information, it is necessary to extract the effective point cloud through point cloud post-processing. After the 3D point cloud post-processing, the crop lodging can be analyzed according to the point cloud information. Further, the results can be output. The algorithm flow is shown in Figure 4.
In order to calculate the parallax map and realize binocular dense reconstruction, the SGBM algorithm [29] was adopted in this paper, which is derived from the classical SGM algorithm. The SGM algorithm is a semi-global matching algorithm proposed by Hirschmüller in 2005 [30]. The SGM algorithm is widely used in the field of stereo matching because of its high accuracy, fast operation speed, and excellent comprehensive performance. Based on the SGM algorithm, the SGBM algorithm first selects the parallax of each pixel, initializing a parallax map, then constructs a global energy function related to the parallax of each pixel, as shown below:
E D = p C p , D p + q N p p 1 I D p D q = 1 + q N p p 2 I D p D q > 1
where D is the parallax map obtained by initialization; E D is the global energy function constructed by the parallax map; p is a pixel in the image;   N p is the neighborhood pixel of p ; q is the eight neighborhood pixel of p ; C p , D p refers to the cost of pixel point p when the parallax is D p   in parallax map D ; p 1   and p 1 are penalty coefficients; and I D p D q is a function. If the parameter in the function is true, I D p D q returns 1, otherwise, it returns 0.
The optimal parallax of each pixel is solved by minimizing this global energy function. The re-projection matrix transformation can be used to convert the image pixel coordinate into a 3D spatial coordinate based on the camera coordinate system and further into the relative world coordinate system. In this study, the re-projection matrix transformation is realized by the reprojectImageTo3D function in OpenCV. Combined with the pose matrix obtained from the camera pose calibration, the 3D coordinate in the camera coordinate system can be converted to the relative world coordinate system. The conversion relationship is shown in Equation (5).
x n y n z n = R 1 x c y c z c R 1 T = R 1 X W Y W Z W R 1 T
where x c   y c   z c T is the 3D coordinate in the camera coordinate system; R 1 is the inverse matrix of the camera pose rotation matrix; T is the translation matrix of the binocular camera pose matrix.
To improve the efficiency of subsequent steps, such as point cloud processing, the abnormal value of each 3D coordinate is filtered in the process of converting the 3D coordinate in the camera coordinate system to the relative world coordinate system. If the 3D coordinate in the camera coordinate system has an abnormal value, this 3D coordinate will be eliminated, and no subsequent algorithm processing will be added. The specific processing flow is as follows:
Step one: The original point cloud is downsampled in order to reduce the point cloud, improve the operation efficiency of subsequent processing steps, and retain the information saved by the point cloud. In this algorithm, the voxel filtering algorithm in PCL is used for this step. In other words, small cubes (voxels) are created according to the input point cloud. Then, all point clouds in the voxel are represented by the gravity center of the point cloud within the voxel to realize the point cloud downsampling.
Step two: Outliers are generated in the point cloud due to the noise of the sensor itself and some errors of stereo matching. Statistical filtering can be used in order to eliminate outliers. The mean value d ¯ i of the distance from each point q i   i = 1 , 2 , 3 N in the point cloud to n points in a certain space around it is calculated. Assuming that d ¯ i follows the normal distribution N u , σ 2 , according to the 3 principle, if the mean value d ¯ i of a point q j is outside three standard deviations of this distribution ( d ¯ n u > 3 σ ), the point will be eliminated, otherwise it will be retained. In the statistical filtering algorithm of PCL, the parameters can be set, and the number n of spatial points and the elimination standard can be changed in order to achieve the optimal filtering effect.
Step three: After the above filtering steps, some outliers and noise points are filtered out and the point cloud is reduced, while certain existing holes are also expanded. In order to fill the point cloud at these holes and smooth the reconstructed crop surface, it is necessary to resample the point cloud. Least squares smoothing was used for the resampling in this study. The basic principle of least squares smoothing is to fill the hole without a point cloud with the surrounding point cloud through polynomial interpolation fitting. After least squares smoothing, point cloud holes are filled and the shape fitting of the target crop is more accurate. However, the point cloud scale increases at the same time.
Step four: After the least squares smoothing, not only are the holes filled but some noise points that were not removed are filled. Therefore, it is necessary to remove these noise points by statistical filtering.
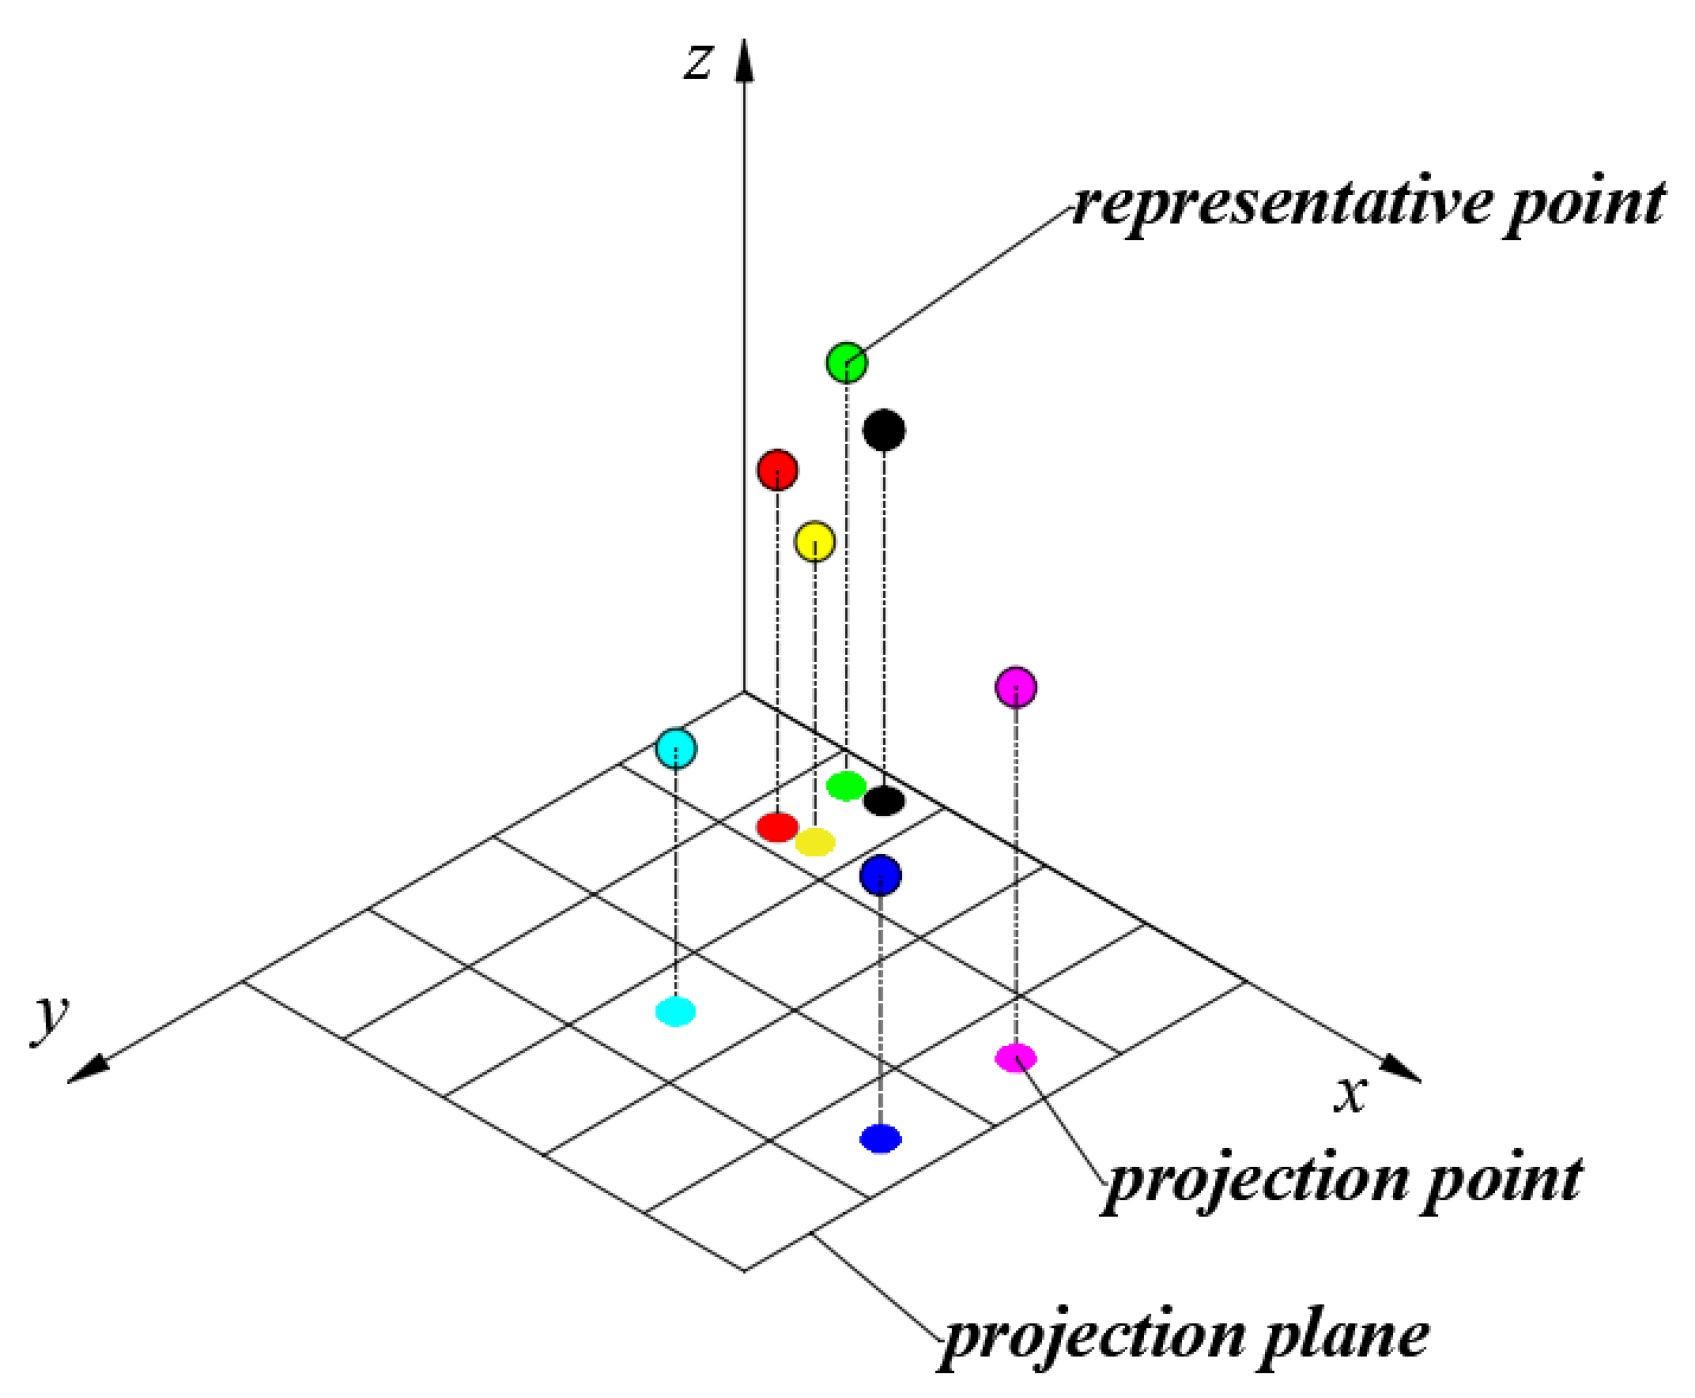
Step five: The crop fluctuation can be basically displayed after the above four steps. Lastly, the point cloud needs to be filtered in order to obtain a point cloud for the crop region surface. Below are the filtering steps. First, the point cloud in 3D space is projected to the xy plane to form a series of 2D points. Next, these 2D points are divided into a square grid with a side length of d. For several 2D points divided into the same grid, the point with the largest z value of the original 3D coordinate among these points is extracted and restored to the 3D space as the representative point in the grid. The point cloud can be downsampled through this operation. It is considered that the extracted representative points are the point cloud on the crop region surface, as shown in Figure 5.

2.4. Field Experiment

With the purpose to verify the effect of the proposed algorithm, the experimental verification was conducted in the comprehensive test base of crop varieties in Zhangjiagang city, Jiangsu Province, China. The experiment date was 5 November 2019. The following figure shows the fixed mode of the binocular camera and combine harvester. The binocular camera is fixed at the upper left corner outside the cab of the combine harvester through camera support. The fixed side view and front view are shown in Figure 6. In this experiment, the MYNT EYE binocular camera is used, which model is D1010-50/Color. Its image resolution is 2560 × 720, the frame rate is 60FPS, IMU is 200 Hz, and depth working distance is 0.49–10 m.
The camera’s visual field is the operation region in front of the harvester reel. The visual field range does not include the harvester mechanisms, such as the header and reel. The distance of the measured object, wheat, is within the effective measurement range of the camera. First, the artificial height of the collected object was calibrated. Then, the host computer controlled the camera to continuously sample and predict the height. Compared with the actual height, the measurement error and effectiveness were verified. The lodging area was further analyzed. The crop height at seven locations in the farmland was measured randomly. The data are shown in Table 3.
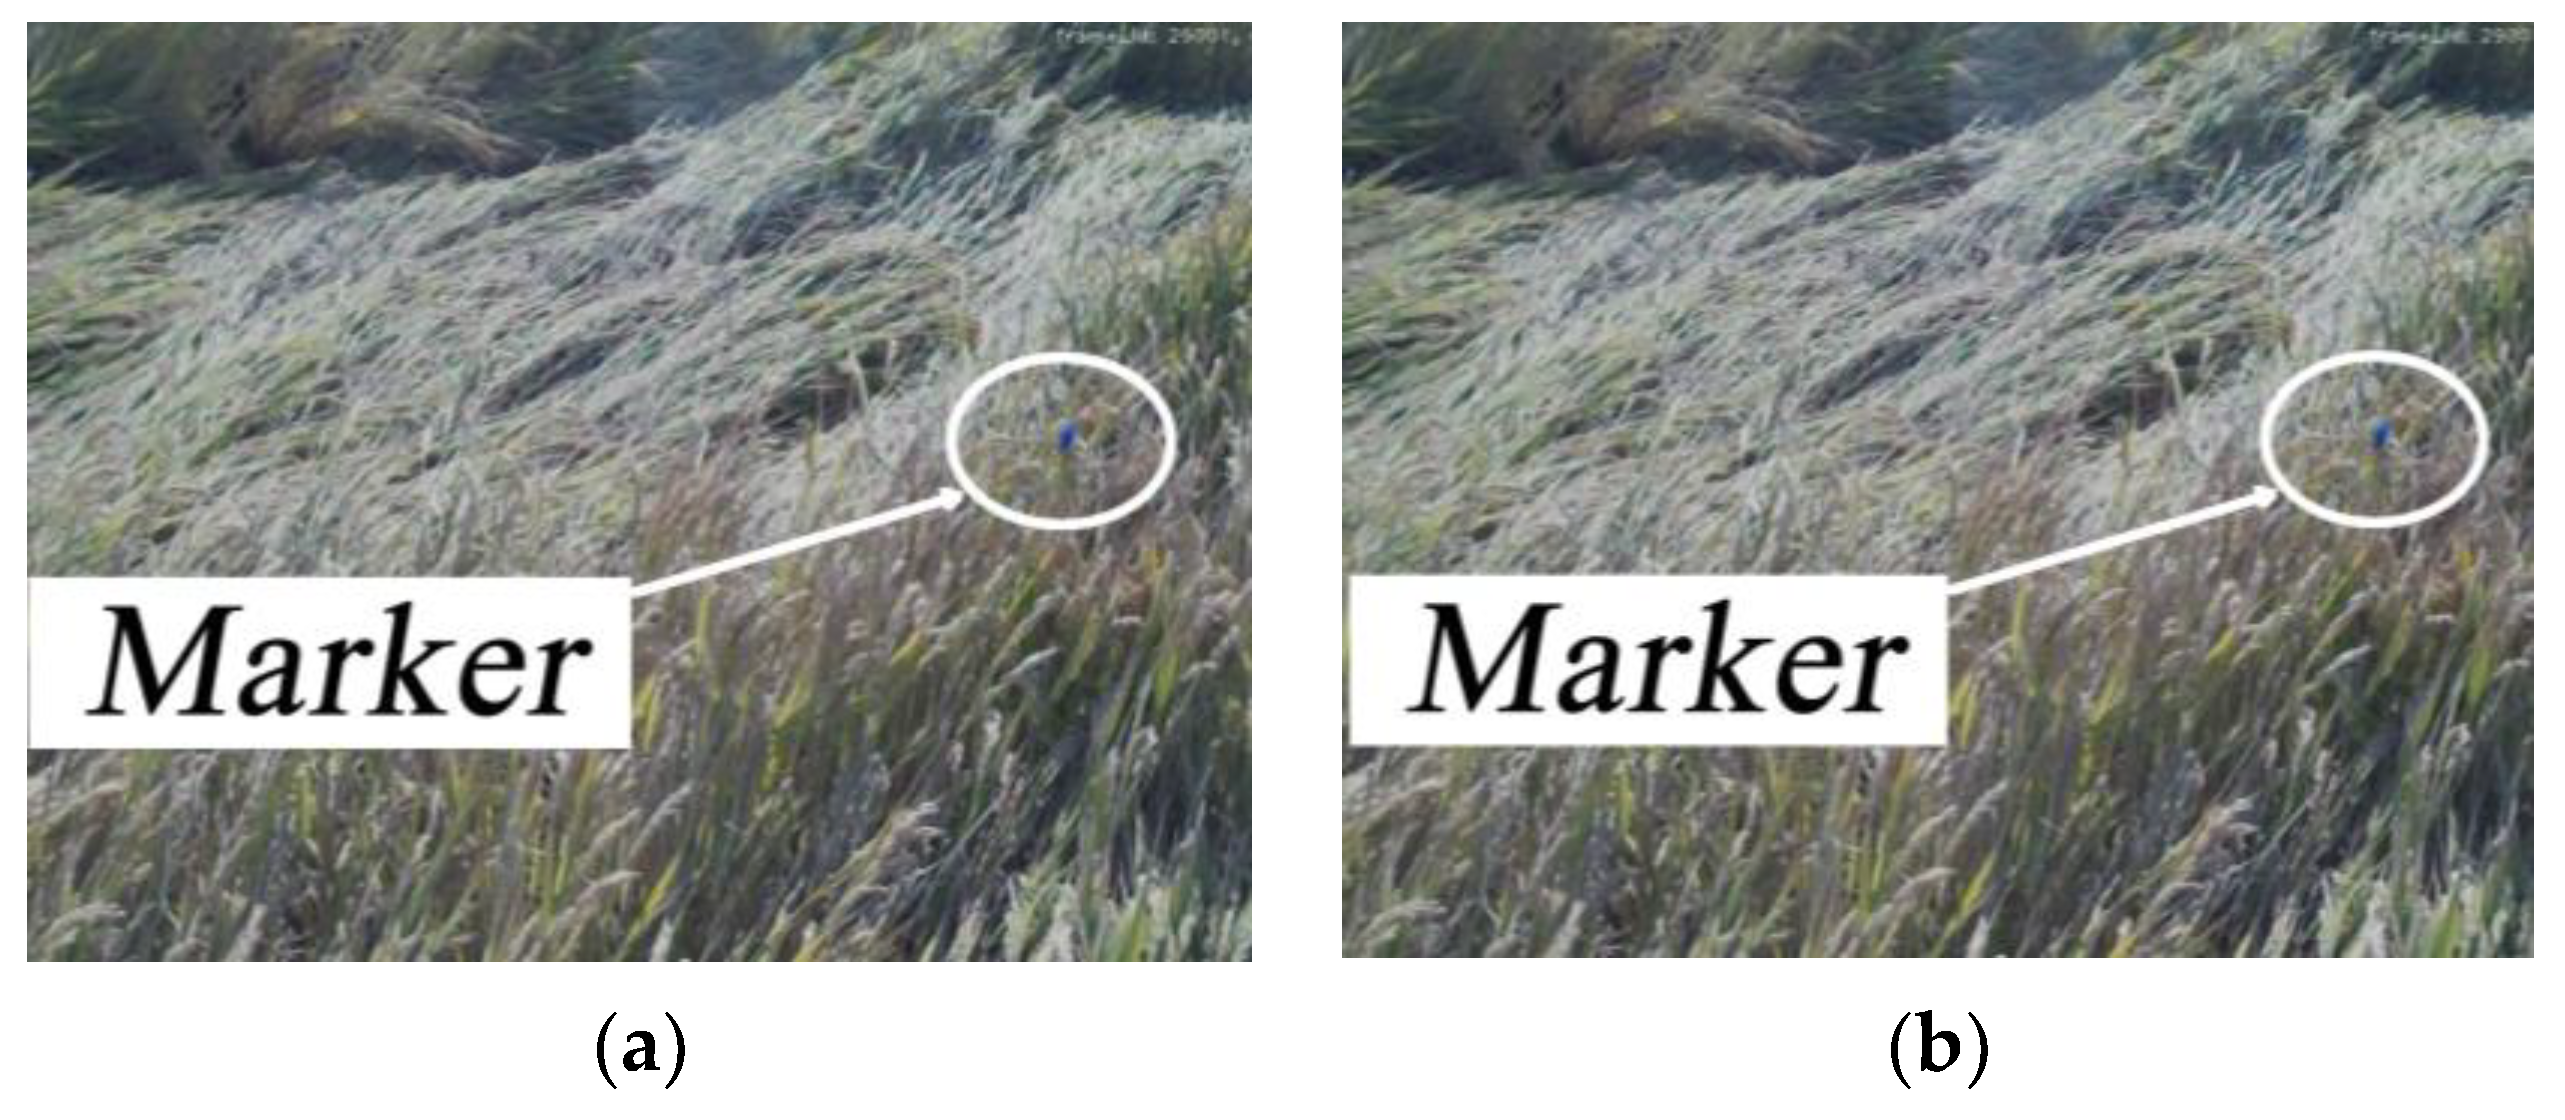
Next, wheat images containing the lodging region were collected. Prior to image collection images, a blue marker was placed on the wheat within the camera’s visual field. The height of the marker to the ground was measured in advance. A total of 13 groups of images containing the marker were collected in the experiment. The following Figure 7 is one of the 13 groups of collected images. Figure 8 is the binocular-corrected image. Figure 9 is Parallax map.
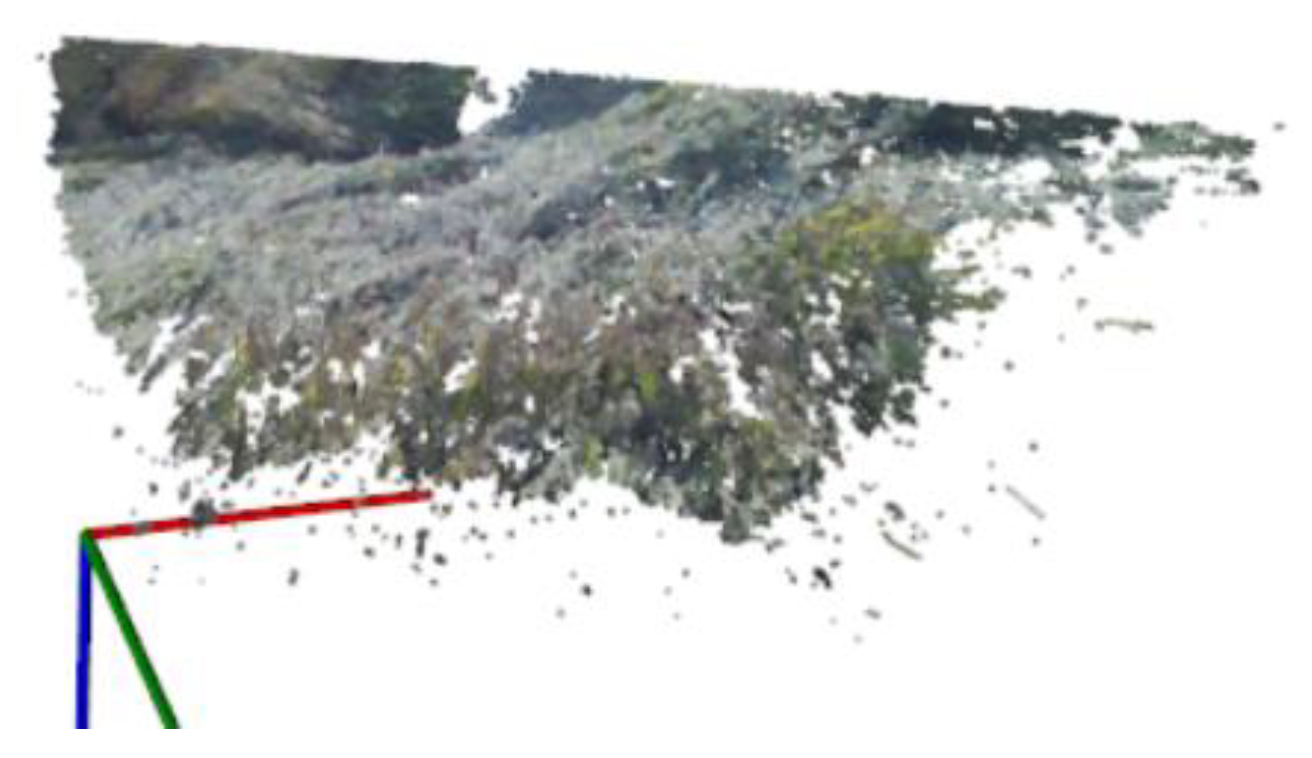
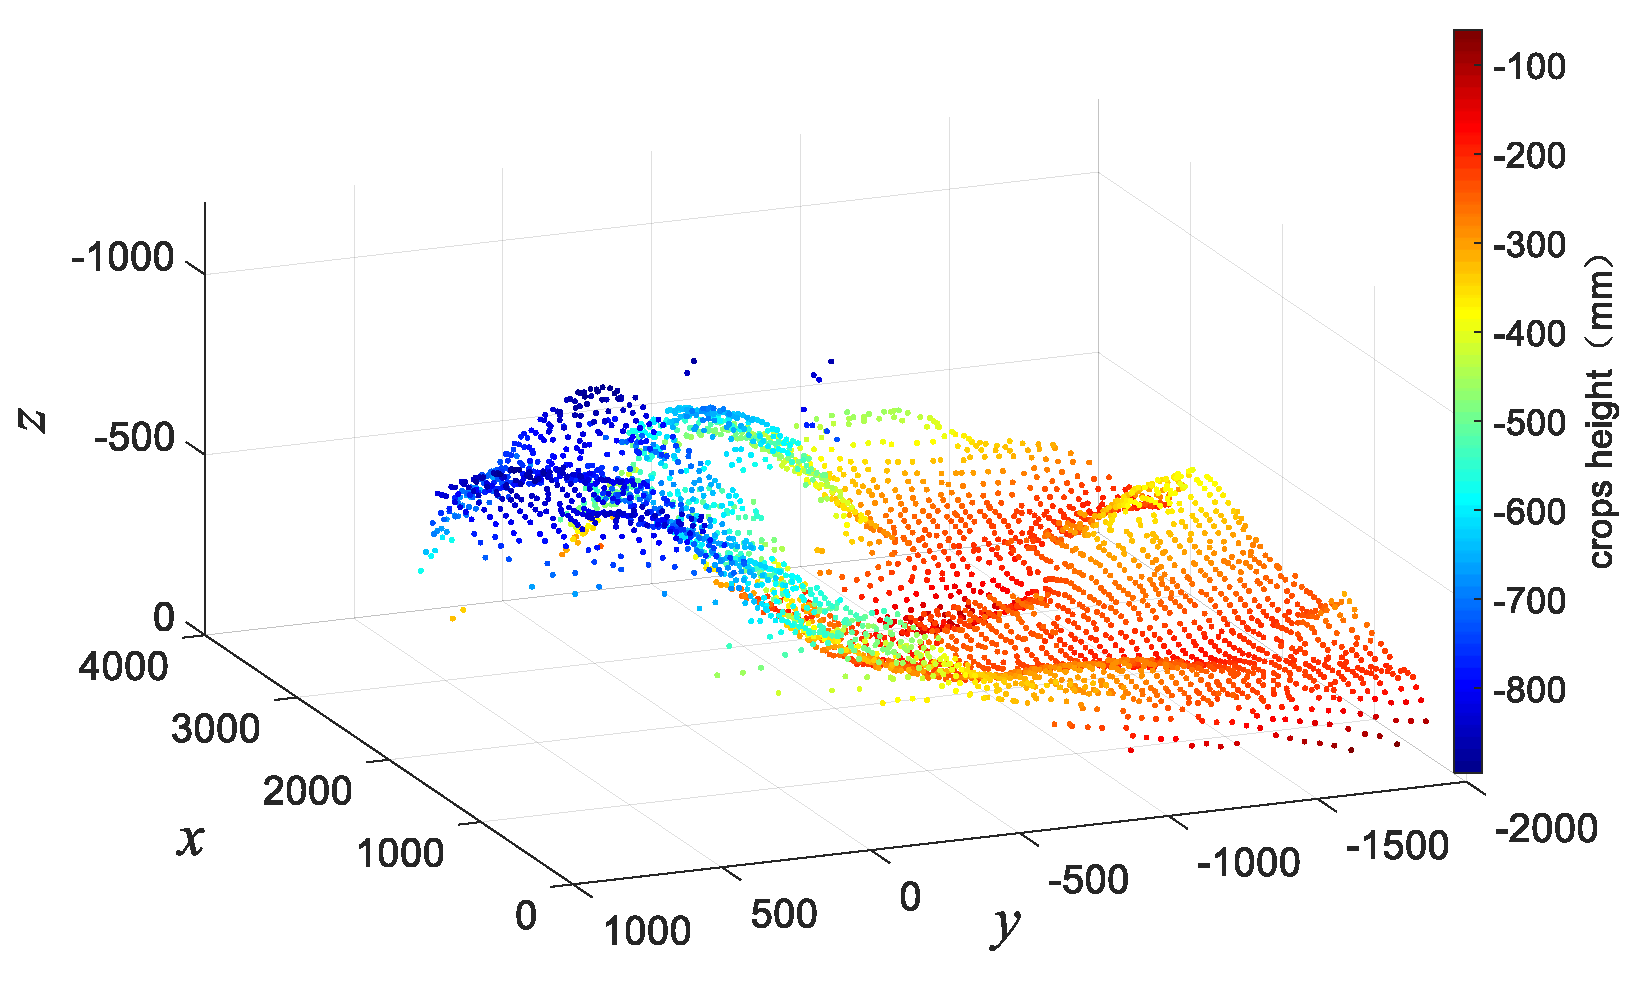
Further, the 2D pixel coordinates were converted into the 3D coordinates of the camera coordinate system, then converted into the 3D coordinates of the relative world coordinate system through the matrix. The initial point cloud was formed, as shown in Figure 10. The coordinate system in Figure 10 is the relative world coordinate system. The red axis is the X axis, the green axis is the Y axis, and the blue axis is the Z axis. Figure 10 shows that the 3D point cloud truly restored the crop’s spatial shape and location, while there was still a lot of noise. Figure 11 is the elevation map of the initial post-processing point cloud rendered according to the z coordinate, which clearly shows that the crop fluctuation can be well reflected even though the number of cloud points is reduced. The overall point cloud appears smoother. Additionally, almost all the original noise is eliminated.

3. Result and Discussion

3.1. Wheat Height Detection Results

In order to verify the accuracy of the final point cloud measuring crop height, the height of the previously placed marker was compared with the marker’s mean value of point cloud Z values. The comparison results are shown in Table 4.
As shown in Figure 12, the height value measured by vision is very close to the actual height measurement. Further calculation showed that the average absolute error between the two was 54.71 mm, and the average relative error was 12.07%. Considering the working environment of farmland, the error is within the acceptable range.

3.2. Lodging Area Detection Results

After verification that the point cloud can accurately measure the height of the crop surface, the point cloud can be used to analyze crop lodging within the visual field range. Taking the wheat in Figure 5 as an example, the wheat groups in the visible region were analyzed. The final analysis results of this region were as follows: the wheat lodging area accounted for 81.48%, the wheat inclined area accounted for 8.31%, and the wheat upright area accounted for 9.48%.
Figure 13 is the point cloud diagram rendered according to the crop lodging situation in this region, where red is the lodging region, green is the inclined region, and blue is the upright region. Combined with the images taken, Figure 13 shows the algorithm estimated the crop is in a lodging state in the actual lodging region. The estimation of upright and inclined regions was also consistent with the facts. Although certain covered areas, such as the spotless area in the afternoon red lodging region, cannot directly reveal status information through measurement, the areas with missing information can be filled and eliminated through local information inference. Similarly, the lodging area estimation effect of other measurement groups was obtained with the same processing steps, as shown in Figure 14.
The left field measured map shows obvious upright crop groups from the lower left corner to the center of the image, while there were complex lodging levels around this region, which is difficult for human eyes to distinguish. Moreover, a large area of continuous lodging can be seen on the far right side in the visual field. The measurement results of the algorithm were consistent with this feature. The crop region that is difficult to estimate by human eyes was estimated as the inclined state. In addition, the area proportion of different states was given. Similarly, as for the rightmost actual–estimation group, though there are many data-missing masks in the measured image (the center of the image, the dark black in the lower left corner with a lack of ear rod coverage, and the rear of the upright wheat on the left edge), the actual situation can be inferred from the local crop state information in the detection results. By comparing the three groups of measurement data, a conclusion can be drawn that the area estimation presents a certain robustness to wheat straw lodging direction and sight occlusion.
The overall results showed that the analysis results of the proposed method are similar to the actual situation. In other words, the method can accurately distinguish the proportion of lodging areas under different field crop conditions through binocular vision. This algorithm runs on an industrial computer, which uses Core (TM) i5-8300H CPU (Intel, Santa Clara, CA, USA), with a frequency of 2.30 GHz, running time could reach 1469 milliseconds. As the camera sampling range covers 3 m width and 4 m in front of the machine, the maximum speed should be under 1 m/s to change the harvesting strategy in time, such as reducing the speed, adjudging the reel height, and changing the harvesting direction.

4. Conclusions

This paper proposed a wheat lodging detection method based on a binocular camera. The images of the region to be harvested are collected by a binocular camera. The re-projection matrix is calculated through the internal and external parameter matrix obtained by camera calibration. Combined with a parallax map, the wheat surface 3D information is obtained. After data filtering, the point cloud of wheat surface is constructed in the relative world coordinate system, and the wheat lodging information is obtained through the discrimination criteria of lodging angle.
The experimental results showed that the method described in this paper can effectively detect and estimate crop height. Compared with the actual crop, the absolute error of height detection was 54.71 mm, and the average relative error was 12.07%. The area proportion of wheat with a different growth status in the image’s visual field was described quantitatively. The calculation results of the algorithm can provide a discrimination basis for the harvester to harvest lodging wheat. In the host computer test environment, the algorithm can maintain a stable detection speed of 1500–2000 milliseconds, basically meeting the indicators of real-time detection during field crop harvesting. The algorithm can be effectively applied to the measurement of field crop height and area. Thus, the method of fixing a binocular camera on the combine harvester is simple and universal. Using similar installation methods for the combination of various types of combine harvesters and binocular cameras, the detection task can be performed through the algorithm proposed in this paper, which is enlightening.
There still need some improvements in binocular vision detection, for example, the automatic exposure function of the camera is required to adapt to different light conditions. A special mechanical device needs to be specially developed to remove dust blocked on the camera during operating time. For the interference of shade, dust and color of crops in the field of vision, more optimization on filtering algorithms need to be considered.

Author Contributions

Conceptualization, J.W. and Y.Y.; methodology, Z.P. and Y.F.; data curation, J.W. and Y.F.; writing—original draft preparation, Z.P.; writing—review and editing, Y.Y. and Y.Z. All authors have read and agreed to the published version of the manuscript.

Funding

This research was funded by the National Key Research and Development Project of China, grant number: 2019YFB1312304, and the Agricultural Science and Technology Independent Innovation Fund of Jiangsu Province, grant number: CX (20) 1007.

Institutional Review Board Statement

Not applicable.

Data Availability Statement

All data are presented in this article in the form of figures or tables.

Acknowledgments

We thank LOVOL Inc., China, who had provided the combine harvester for field tests.

Conflicts of Interest

The authors declare no conflict of interest.

References

  1. Cai, T.; Peng, D.; Wang, R.; Jia, X.; Qiao, D.; Liu, T.; Jia, Z.; Wang, Z.; Ren, X. Can intercropping or mixed cropping of two genotypes enhance wheat lodging resistance? Field Crop. Res. 2019, 239, 10–18. [Google Scholar] [CrossRef]
  2. Chauhan, S.; Darvishzadeh, R.; van Delden, S.H.; Boschetti, M.; Nelson, A. Mapping of wheat lodging susceptibility with synthetic aperture radar data. Remote Sens. Environ. 2021, 259, 112427. [Google Scholar] [CrossRef]
  3. Shah, L.; Yahya, M.; Shah, S.M.A.; Nadeem, M.; Ali, A.; Ali, A.; Wang, J.; Riaz, M.W.; Rehman, S.; Wu, W.; et al. Improving Lodging Resistance: Using Wheat and Rice as Classical Examples. Int. J. Mol. Sci. 2019, 20, 4211. [Google Scholar] [CrossRef] [Green Version]
  4. Chen, J.; Wang, S.; Lian, Y. Design and test of header parameter keys electric control adjusting device for rice and wheat combined harvester. Trans. Chin. Soc. Agric. Eng. 2018, 34, 19–26. [Google Scholar] [CrossRef]
  5. Liao, Y.; Xiang, Y.; Wu, M.; Liu, D.; Cheng, Y.; Li, Y. Design and test of the adaptive height adjustment system for header of the combine-harvester. J. Hunan Agric. Univ. Nat. Sci. 2018, 44, 326–329. [Google Scholar] [CrossRef]
  6. Liu, H.; Reibman, A.R.; Ault, A.C.; Krogmeier, J.V. Video-Based Prediction for Header-Height Control of a Combine Harvester. In Proceedings of the 2nd IEEE International Conference on Multimedia Information Processing and Retrieval (MIPR), San Jose, CA, USA, 28–30 March 2019; pp. 310–315. [Google Scholar] [CrossRef]
  7. Wang, H.; Shen, H.; Cao, S.; Xu, X.; Han, T.; Guo, H. Hydraulic System Design of Combined Harvester Header and Simulation of Header Lifting System. IOP Conf. Ser. Earth Environ. Sci. 2019, 233, 032012. [Google Scholar] [CrossRef]
  8. Zhuang, X.; Li, Y. Header Height Control Strategy of Harvester Based on Robust Feedback Linearization. Trans-Actions Chin. Soc. Agric. Mach. 2020, 51, 123–130. [Google Scholar] [CrossRef]
  9. Xue, J.; Dong, P.; Hu, S.; Li, L.; Wang, K.; Gao, S.; Wang, Y.Z.; Li, S. Effect of Lodging on Maize Grain Loss and Loss Reduction Technology in Mechanical Grain Harvest. J. Maize Sci. 2020, 28, 116. [Google Scholar] [CrossRef]
  10. Cao, W.; Qiao, Z.; Gao, Z.; Lu, S.; Tian, F. Use of unmanned aerial vehicle imagery and a hybrid algorithm combining a watershed algorithm and adaptive threshold segmentation to extract wheat lodging. Phys. Chem. Earth Parts A/B/C 2021, 123, 103016. [Google Scholar] [CrossRef]
  11. Du, M.; Noguchi, N. Monitoring of Wheat Growth Status and Mapping of Wheat Yield’s within-Field Spatial Variations Using Color Images Acquired from UAV-camera System. Remote Sens. 2017, 9, 289. [Google Scholar] [CrossRef] [Green Version]
  12. Guan, S.; Fukami, K.; Matsunaka, H.; Okami, M.; Tanaka, R.; Nakano, H.; Sakai, T.; Nakano, K.; Ohdan, H.; Takahashi, K. Assessing Correlation of High-Resolution NDVI with Fertilizer Application Level and Yield of Rice and Wheat Crops Using Small UAVs. Remote Sens. 2019, 11, 112. [Google Scholar] [CrossRef] [Green Version]
  13. Wang, J.-J.; Ge, H.; Dai, Q.; Ahmad, I.; Dai, Q.; Zhou, G.; Qin, M.; Gu, C. Unsupervised discrimination between lodged and non-lodged winter wheat: A case study using a low-cost unmanned aerial vehicle. Int. J. Remote Sens. 2018, 39, 2079–2088. [Google Scholar] [CrossRef]
  14. Xie, T.; Li, J.; Yang, C.; Jiang, Z.; Chen, Y.; Guo, L.; Zhang, J. Crop height estimation based on UAV images: Methods, errors, and strategies. Comput. Electron. Agric. 2021, 185, 106155. [Google Scholar] [CrossRef]
  15. Zhao, B.; Li, J.; Baenziger, P.S.; Belamkar, V.; Ge, Y.; Zhang, J.; Shi, Y. Automatic Wheat Lodging Detection and Mapping in Aerial Imagery to Support High-Throughput Phenotyping and In-Season Crop Management. Agronomy 2020, 10, 1762. [Google Scholar] [CrossRef]
  16. Zhou, L.; Gu, X.; Cheng, S.; Yang, G.; Shu, M.; Sun, Q. Analysis of Plant Height Changes of Lodged Maize Using UAV-LiDAR Data. Agriculture 2020, 10, 146. [Google Scholar] [CrossRef]
  17. Zhang, Z.; Flores, P.; Igathinathane, C.; Naik, D.L.; Kiran, R.; Ransom, J.K. Wheat Lodging Detection from UAS Imagery Using Machine Learning Algorithms. Remote Sens. 2020, 12, 1838. [Google Scholar] [CrossRef]
  18. Koh, J.; Spangenberg, G.; Kant, S. Automated Machine Learning for High-Throughput Image-Based Plant Phenotyping. Remote Sens. 2021, 13, 858. [Google Scholar] [CrossRef]
  19. Han, D.; Yang, H.; Yang, G.; Qiu, C. Monitoring model of maize lodging based on Sentinel-1 radar image. Trans-Actions Chin. Soc. Agric. Eng. 2018, 34, 166–172. [Google Scholar] [CrossRef]
  20. Hua, S.; Xu, M.; Xu, Z.; Ye, H.; Zhou, C.Q. Kinect-Based Real-Time Acquisition Algorithm of Crop Growth Depth Images. Math. Probl. Eng. 2021, 2021, 1–9. [Google Scholar] [CrossRef]
  21. Setyawan, R.A.; Basuki, A.; Wey, C.Y. Machine Vision-Based Urban Farming Growth Monitoring System. In Proceedings of the 10th Electrical Power, Electronics, Communications, Controls and Informatics Seminar (EECCIS), Malang, Indonesia, 26–28 August 2020; pp. 183–187. [Google Scholar] [CrossRef]
  22. Wang, A.; Zhang, W.; Wei, X. A review on weed detection using ground-based machine vision and image processing techniques. Comput. Electron. Agric. 2019, 158, 226–240. [Google Scholar] [CrossRef]
  23. Choi, K.H.; Han, S.K.; Park, K.-H.; Kim, K.-S.; Kim, S. Morphology-based guidance line extraction for an autonomous weeding robot in paddy fields. Comput. Electron. Agric. 2015, 113, 266–274. [Google Scholar] [CrossRef]
  24. He, J.; Zang, Y.; Luo, X.; Zhao, R.; He, J.; Jiao, J. Visual detection of rice rows based on Bayesian decision theory and robust regression least squares method. Int. J. Agric. Biol. Eng. 2021, 14, 199–206. [Google Scholar] [CrossRef]
  25. Raja, R.; Nguyen, T.T.; Slaughter, D.C.; Fennimore, S.A. Real-time weed-crop classification and localisation technique for robotic weed control in lettuce. Biosyst. Eng. 2020, 192, 257–274. [Google Scholar] [CrossRef]
  26. Gené-Mola, J.; Gregorio, E.; Guevara, J.; Auat, F.; Sanz-Cortiella, R.; Escolà, A.; Llorens, J.; Morros, J.-R.; Ruiz-Hidalgo, J.; Vilaplana, V.; et al. Fruit detection in an apple orchard using a mobile terrestrial laser scanner. Biosyst. Eng. 2019, 187, 171–184. [Google Scholar] [CrossRef]
  27. Masuda, R.; Fujimoto, S.; Iida, M.; Suguri, M. A Method to Detect the Occurrence of Rice Plant Lodging Using Wavelet Transform. IFAC Proc. Vol. 2013, 46, 75–80. [Google Scholar] [CrossRef]
  28. Yu-ping, G.; Feng, S. Effect of Lodging Resistance on Yield of Rice and Its Relationship with Stalk Physical Characteristics. J. Jilin Agric. Sci. 2004, 29, 6–11. [Google Scholar] [CrossRef]
  29. Zhang, H.; Li, A.N.; Zhang, Q.; Guo, Y.G.; Song, X.N.; Gao, Q. Sgbm Algorithm and bm Algorithm Analysis and Research. Geomat. Spat. Inf. Technol. 2016, 39, 214–216. [Google Scholar]
  30. Hirschmüller, H. Accurate and Efficient Stereo Processing by Semi-Global Matching and Mutual Information. In Proceedings of the 2005 IEEE Computer Society Conference on Computer Vision and Pattern Recognition, San Diego, CA, USA, 20–25 June 2005. [Google Scholar] [CrossRef]
Figure 1. Binocular camera optical axis parallel model.
Agriculture 13 00120 g001
Figure 2. Wheat height detection method.
Agriculture 13 00120 g002
Figure 3. Wheat lodging regions.
Agriculture 13 00120 g003
Figure 4. Wheat lodging image processing algorithm flowchart.
Agriculture 13 00120 g004
Figure 5. Crop region surface point cloud screening principle schematic.
Agriculture 13 00120 g005
Figure 6. Binocular camera installation diagram. (a) Side view; (b) Front view.
Agriculture 13 00120 g006
Figure 7. Wheat image. (a)Left view with marker; (b) Right view with marker.
Agriculture 13 00120 g007
Figure 8. Binocular-corrected image.
Agriculture 13 00120 g008
Figure 9. Parallax map.
Agriculture 13 00120 g009
Figure 10. Initial point cloud.
Agriculture 13 00120 g010
Figure 11. Processed point cloud elevation map.
Agriculture 13 00120 g011
Figure 12. Difference between measured value and estimated value.
Agriculture 13 00120 g012
Figure 13. Wheat lodging point cloud map (both ends of the arrow indicate the same location).
Agriculture 13 00120 g013
Figure 14. Analysis results of the wheat lodging area. (a) Lodging area proportion: 66.60%, inclined area proportion: 15.91%, upright area proportion: 17.474%; (b) Lodging area proportion: 66.9973%, inclined area proportion: 7.10235%, upright area proportion: 22.9004%; (c) Lodging area proportion: 54.0821%, inclined area proportion: 23.8496%, upright area proportion: 22.0683%.
Agriculture 13 00120 g014
Table 1. Wheat lodging grade classification criteria.
αLodging Grade
α = 0°Grade I
0° < α ≤ 30°Grade II
30° < α ≤ 45°Grade III
45° < α ≤ 60°Grade IV
60° < α ≤ 90°Grade V
Table 2. Wheat lodging detection method.
z n Lodging State
H cos π 4 z n H Upright
H cos π 4 z n H cos π 6 Inclined
0 z n H cos π 4 Lodging
H is the height of wheat in upright state.
Table 3. Manual measured value of wheat height.
No.1234567Mean Value
Height (mm)900850900880850820860865.73
Table 4. Difference between the measured value and estimated value.
No.Actual Height (mm)Measured Height (mm)Absolute Error (mm)Relative Error
1860822.7037.290330.0453
2290336.8446.844670.1391
3590580.449.554330.0165
4770690.0779.922330.1158
5255264.019.012670.0341
6230336.03106.036670.3156
7595500.2494.755330.1894
8690689.530.463330.0007
9770702.7067.292330.0958
10770699.9170.086330.1001
11590533.7856.216330.1053
12390304.2185.790.2820
13510462.0647.9390.1038
Total standard deviation is 32.48 mm.
Disclaimer/Publisher’s Note: The statements, opinions and data contained in all publications are solely those of the individual author(s) and contributor(s) and not of MDPI and/or the editor(s). MDPI and/or the editor(s) disclaim responsibility for any injury to people or property resulting from any ideas, methods, instructions or products referred to in the content.