Article

Research and Analysis on the Influence of Different Speed Measurement Methods on the Monitoring Accuracy of Seed Spacing

1
College of Engineering, China Agricultural University, Beijing 100083, China
2
Key Laboratory of Soil-Machine-Plant System Technology of Ministry of Agriculture, Beijing 100083, China
*
Author to whom correspondence should be addressed.
Agriculture 2023, 13(1), 128; https://doi.org/10.3390/agriculture13010128
Submission received: 4 December 2022 / Revised: 28 December 2022 / Accepted: 29 December 2022 / Published: 3 January 2023
(This article belongs to the Section Agricultural Technology)

Abstract

:
The accuracy and real-time performance of the speed measurement method were important factors influencing the accuracy of the seeding spacing monitoring. In this study, three different speed measurement methods (including GNSS (Global Navigation Satellite System) receiver speed measurement, radar speed measurement, and encoder measurement rotation speed) were used to compare and analyze the monitoring results of seeding spacing. The same monitoring system was used to calculate the seeding spacing under three different speed measurement methods. The encoder directly measured the rotation speed of the seeding disc instead of the traditional method of measuring the rotation speed of the driving wheel. The monitoring results of uniform-speed and variable-speed seeding field tests showed that the three speed measurement methods have extremely high correlations, with a correlation coefficient R > 0.95. There was small difference among the three speed measurement methods, and they all met the needs of field seeding operations. After comprehensively considering the use cost and installation complexity, it was recommended to use GNSS receiver speed measurement to monitor the speed of the seeding operation and the real-time seeding spacing.

1. Introduction

The application of precision seeding technology in agriculture has been promoted year by year, which has benefited from the study and development and application of precision seed metering devices, especially pneumatic seed metering devices [1,2,3]. The seed metering device is the core component of the seeder [4]. The performance of the seed metering device determines the seeding quality of the seeder [5]. To evaluate the seeding quality of the seeder, the calculation of the parameters was based on the standard test method ISO 72561 formulated by the International Standards Organization (ISO, (1984)), which has been adopted by the Chinese National Standard as GBT 6973-2005 (Chinese National Standard, (2005)) [6,7]. The seeding spacing (the spacing between two adjacent seeds in a seeding row) is an important parameter to determine the missed seeding, multiplied seeding, and the coefficient of variation. To accurately calculate the seeding spacing, speed and time must be obtained. Therefore, sensor measurement technology has been more applied.
At present, the application of sensors in seeding monitoring has been gradually increasing. Most seed monitoring sensors were installed on the seed tube, mainly photoelectric sensors [8,9,10]. There were also related studies on capacitive sensors and piezoelectric sensors [11,12]. When the seed continuously passed the sensor, it would generate a pulsed electrical signal. After the controller captured the electrical signal and processed it, the interval time between two adjacent seeds could be obtained. This provided a time basis for the calculation of seeding seed spacing [13,14,15].
The calculation of the seeding spacing is also needed to measure the speed. There are many ways to measure speed, which are mainly divided into two ways: direct measurement and indirect measurement. Direct speed measurement can directly obtain the forward speed. The most representative methods are GNSS (Global Navigation Satellite System) receiver speed measurement and radar speed measurement. The indirect speed measurement is to obtain the rotation speed and then calculate the forward speed; the most representative method is the use of an encoder to measure the rotation speed.
As the production cost of GNSS receiver has decreased, while increasing its advantage of high accuracy, it has been increasingly used in agriculture. Ding [16] et al. designed an electric drive type maize precision seeder control system based on GPS (Global Position System) speed measurement. They used GPS to obtain the forward speed of the seeder. Tests showed that the GPS speed measurement method was more suitable for high-speed operating conditions. Yang [17] et al. used a GPS speed measurement module receiver to obtain the traveling speed of the seeder. The speed measurement calibration test was carried out on the GPS speed measurement module; the average value of the ratio of the actual speed to the monitored speed was 1.20, and the variance was 0.02. Chen [18] et al. used GPS to collect the operating speed of the seeder, combined with a rotary encoder to collect the speed of the seed metering device.
In addition to GNSS receiver, radar can also directly obtain the forward speed, and its application in agriculture has been gradually increasing. Zhang [19] et al. designed an electronically controlled maize metering system, used a radar tachometer to collect the seeding speed, and then obtained the theoretical speed of the seed metering device. Cheng [20] et al. analyzed the application of electric drive for precision seeders and pointed out that the accuracy of radar speed measurement was affected by the scanning ground angle and ground condition reflection.
In addition, the encoder has been more widely used in speed measurement due to its lower cost. When measuring the forward speed of the seeder, the encoder was usually installed on the ground wheel. Sun [21] et al. used an incremental encoder with a resolution of 100 P/R (pulses/round) to measure speed, and calculated the operating speed by outputting 100 pulse signals for one revolution of the ground wheel. Zhao [22] et al. used a 1000 P/R Omron rotary encoder to collect the rotation speed of the seeding shaft and the fertilizer shaft of the seeder. Li [23] et al. used a rotary encoder as the speed detection mechanism of the seeder and designed an anti-skid encoder speed measurement driving wheel to improve the speed measurement accuracy. Yin [24] et al. installed a 600 P/R photoelectric encoder on the nondriving wheel of the planter to avoid errors caused by the slip of the driving wheel. They calculated the pulse signal of the encoder to get the forward speed of the seeder.
In addition, Abdolahzare [25,26] et al. used a high-speed camera system to detect seed falling trajectory to assess seed spacing uniformity. This is different from the method of measuring real-time seed spacing using speed sensors and seed monitoring sensors. The technology of using high-speed camera methods is more complicated, the cost is higher, and it is easily affected by harsh environmental factors such as field dust. Therefore, this method is mostly used in laboratory conditions. In this study, speed sensors and seed monitoring sensors were used to measure real-time seeding spacing in accordance with the requirements of actual seeding operations in the field. With the increase in seeding quality requirements, the operating speed has been gradually increased from low speed to medium and high speed. The accuracy and real-time nature of speed measurement are very important for the calculation of seeding spacing. This study focused on the three main methods currently used in seeder speed measurement: GNSS receiver speed measurement, radar speed measurement, and encoder speed measurement. The seeding spacing was taking as the monitoring object, and the influence and difference of these three speed measurement methods on the monitoring results of the seeding spacing were explored under the conditions of uniform-speed operation and variable-speed operation. Then, the best speed measurement method to achieve accurate and real-time monitoring of the seeding spacing was determined. Whether in the uniform-speed seeding operation or in the variable-speed seeding operation process, the real-time speed and real-time seeding spacing could be accurately measured. An excellent speed measurement method is very important for the precise monitoring of real-time seeding spacing, and it is also very helpful for further improving the monitoring accuracy of seeding quality parameters.

2. Materials and Methods

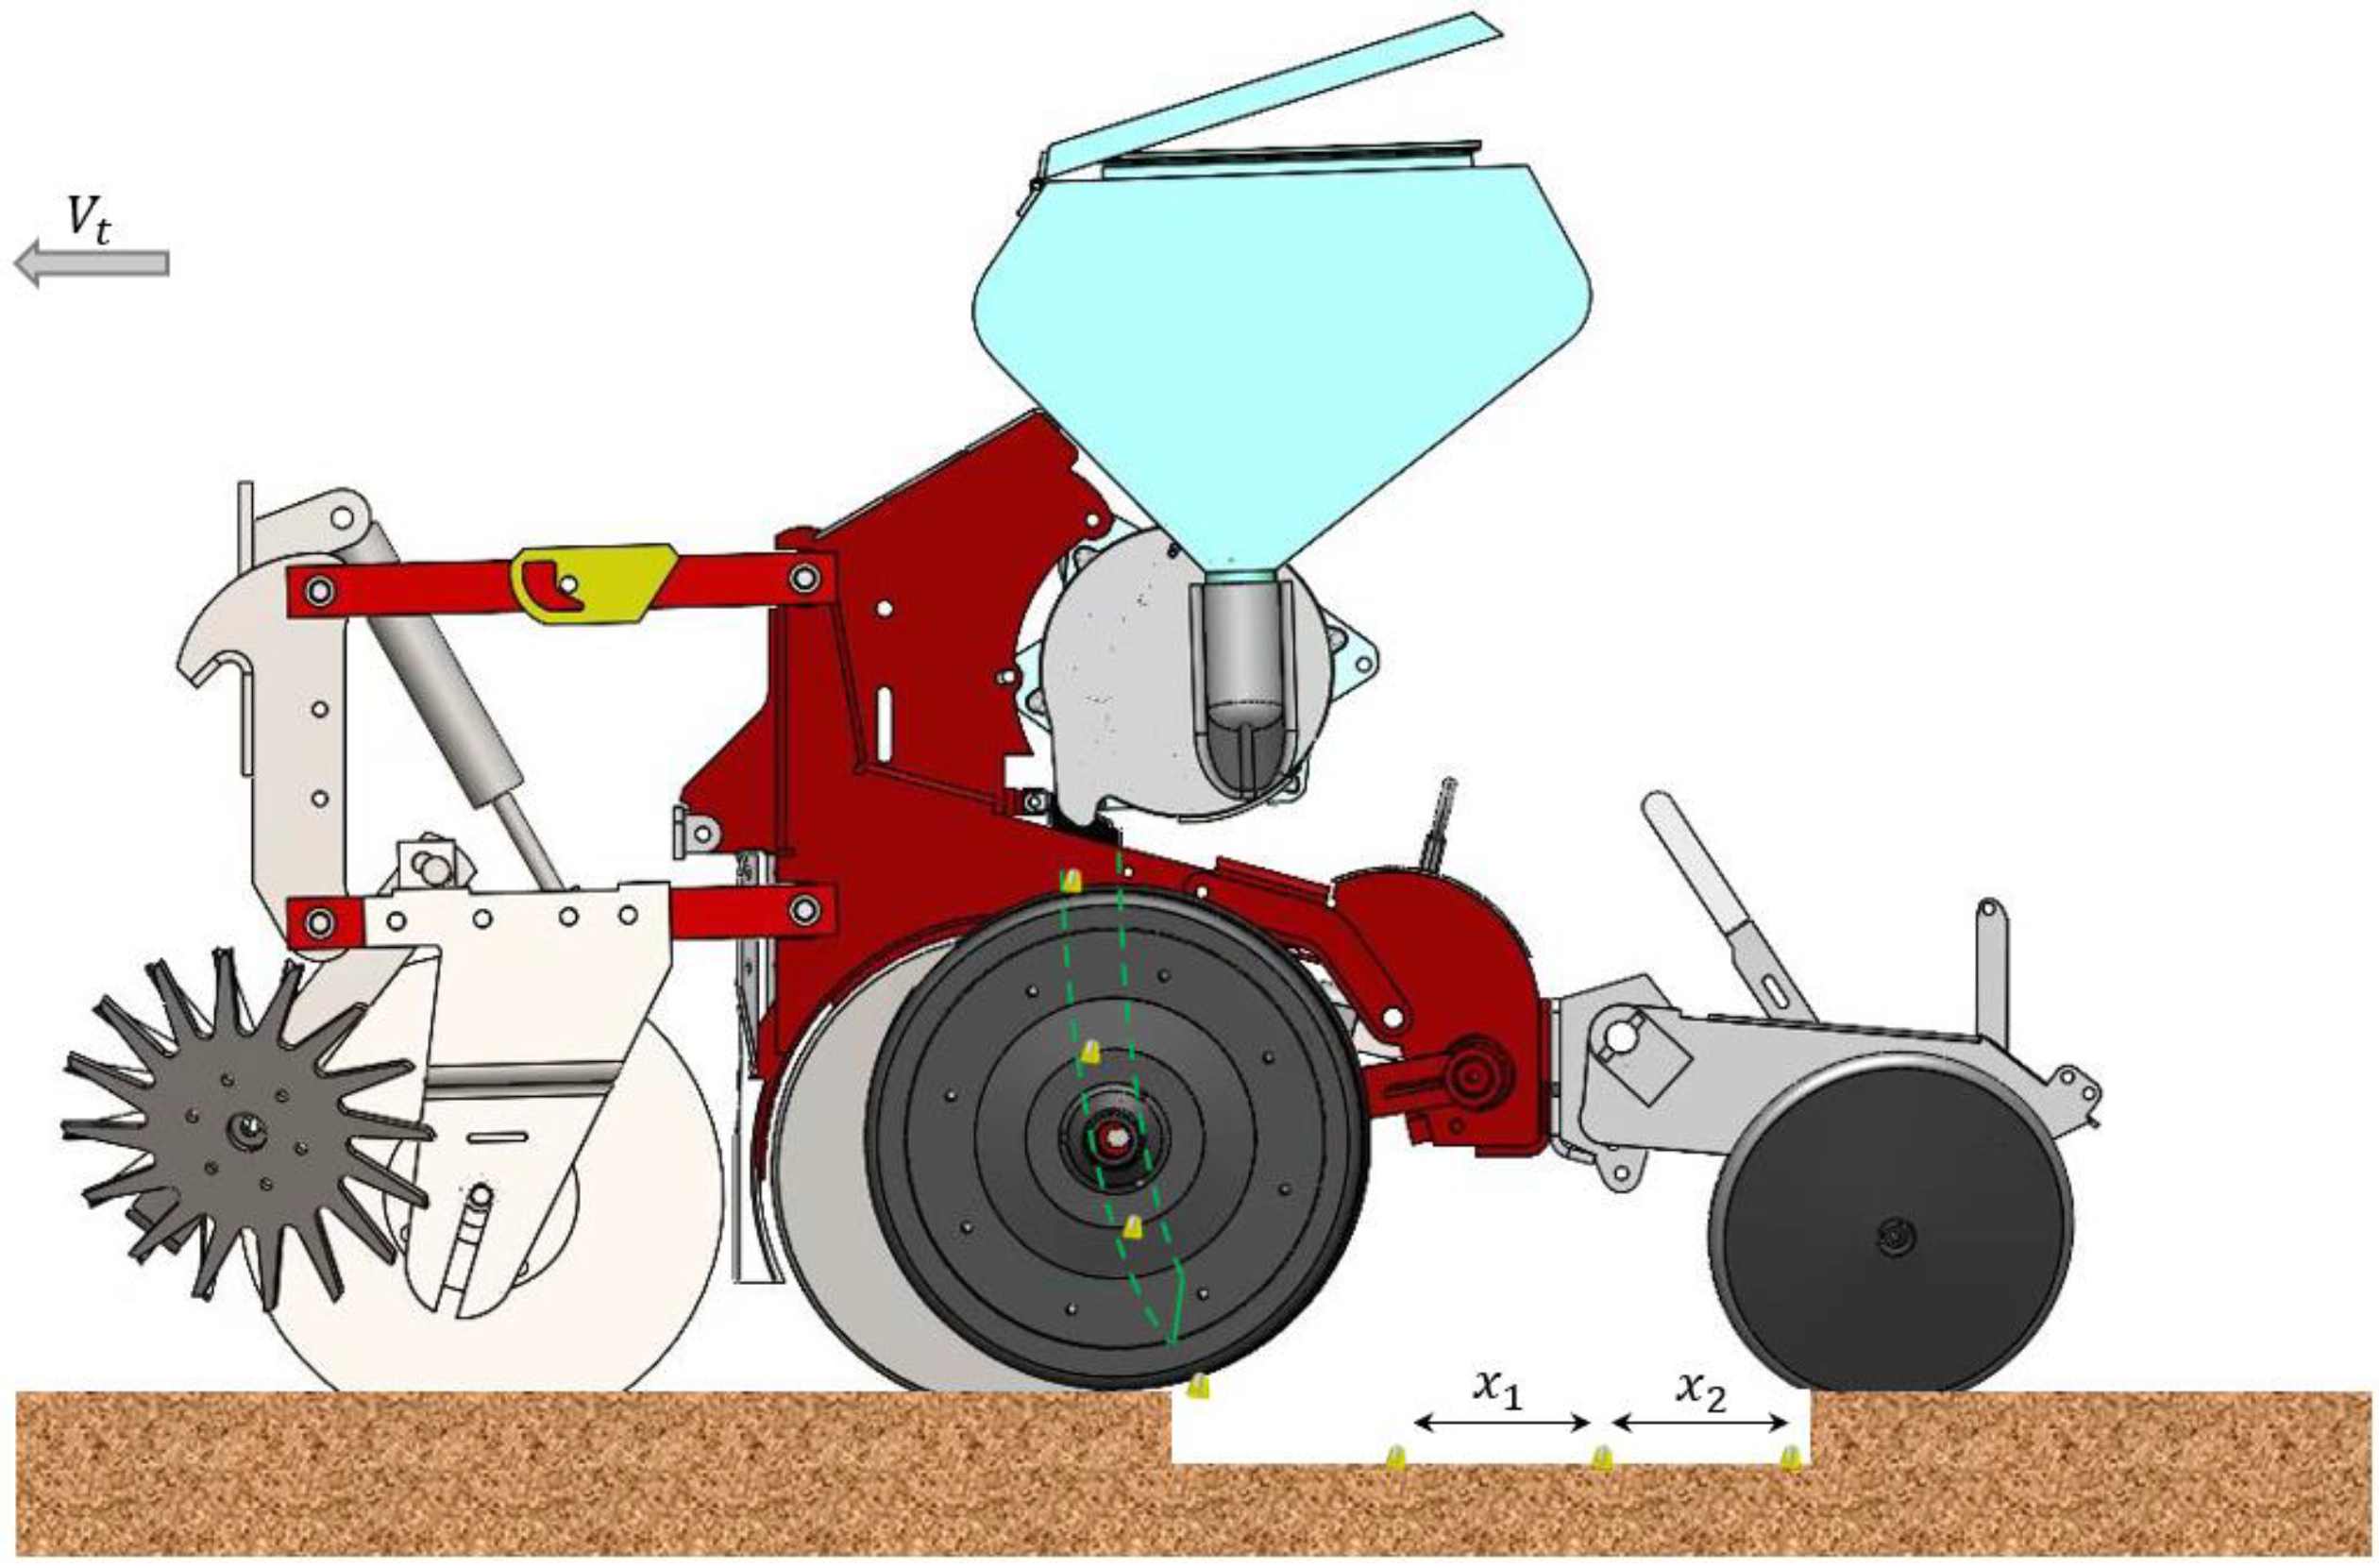
2.1. Calculation of Real-Time Seeding Spacing

Among the seeding operation parameters, the seeding spacing is an important basic parameter, and it is the prerequisite for calculating the qualified rate, missed rate, and other seeding parameters. Therefore, it is necessary to accurately obtain the real-time seeding spacing. The seeding spacing refers to the spacing between two seeds falling in the seed furrow, as shown in x 1 and x 2 in Figure 1.
In order to calculate the real-time seeding spacing, the most direct method is the product of the seeder’s forward speed and the time between two adjacent seeds. After unit conversion, Equation (1) is obtained.
x i = 250 · V t · Δ t 9 ,
where x i is the spacing between any two adjacent seeds (cm), Δ t is the interval time between two adjacent seeds (s), and V t is the forward speed of the seeder (km/h).
The interval time between two adjacent seeds can be measured by a sensor installed on the seed tube. When the seed passes the sensor, an electrical signal is generated. The time interval between two electrical signals is the period Δ t . The forward speed of the seeder can be directly obtained using a GNSS receiver or radar. In addition, since the rotation speed of the seed disc of the seed metering device is related to the forward speed of the seeder, after unit conversion, Equation (2) can be obtained.
V p = 5000 V t 3 X r e f · N p ,
where V p is the rotation speed of the seed disc of the seed metering device (r/min), X r e f is the target seeding spacing (cm), and N p is the number of holes in the seed disc of the seed metering device. Equation (3) can be obtained by combining Equations (1) and (2).
x i = V p · X r e f · N p · Δ t 60 .
At this time, the real-time seeding spacing is related to the rotation speed of the seed disc of the seed metering device. Rotation speed can be measured by the encoder. Therefore, the method of measuring the forward speed by the GNSS receiver and radar, and the method of measuring the rotation speed by the encoder can be used to monitor the seeding spacing of the seeder in real time.

2.2. Speed Measurement Method

2.2.1. GNSS Receiver Speed Measurement Method

GNSS receiver speed measurement has been the most representative speed measurement method for the direct acquisition of speed signals without contact. The GNSS receiver was installed on the seeder to obtain the GNSS signal in real time, and the forward speed of the seeder was calculated and analyzed by the processor. This study used a BD-8953DU GNSS receiver produced by Beitian Communication Co., Ltd (Shenzhen, China). [27]. To improve the accuracy, the GPS + BDS + SBAS + QZSS + GALILEO joint positioning mode was adopted. The GNSS receiver has a speed-accuracy of 0.1 m/s, a maximum signal update frequency of 10 Hz, and an operating temperature of −40 to 80 °C; the output protocol follows the NMEA-0183 protocol. In this study, the RS-232 serial communication method was used to transmit the NMEA sentences collected by the GNSS receiver to the single-chip computer for analysis, and the forward speed V t was finally obtained. The speed analysis method is shown in Figure 2.
In order to verify the accuracy and real-time performance of the GNSS receiver signal analysis calculation program designed in this study, a simulation test was carried out. In the room, the GNSS receiver can be simulated by using AG Leader Technology GPS Simulator. The simulation software can output $GNRMC message information in real time. The accuracy of the program can be verified by comparing the velocity value input by the simulation software with that obtained by the program. At the same time, the relationship between the response speed of the calculation program and the signal output frequency of the GNSS receiver was tested to find the optimal matching relation between signal output frequency and serial port baud rate. The test is shown in Figure 3.
The test results showed that the speed value input by the simulation software was consistent with the speed value calculated by the calculation program. This proved the accuracy of the speed measurement of the calculation program. At the same time, when the output frequency of the speed signal was 5 Hz and the serial port baud rate was 115,200 bps (byte per second), the response speed of the calculation program was the fastest. Therefore, when using a GNSS receiver, its signal output frequency should be set to 5 Hz and the serial port baud rate should be set to 115,200 bps.

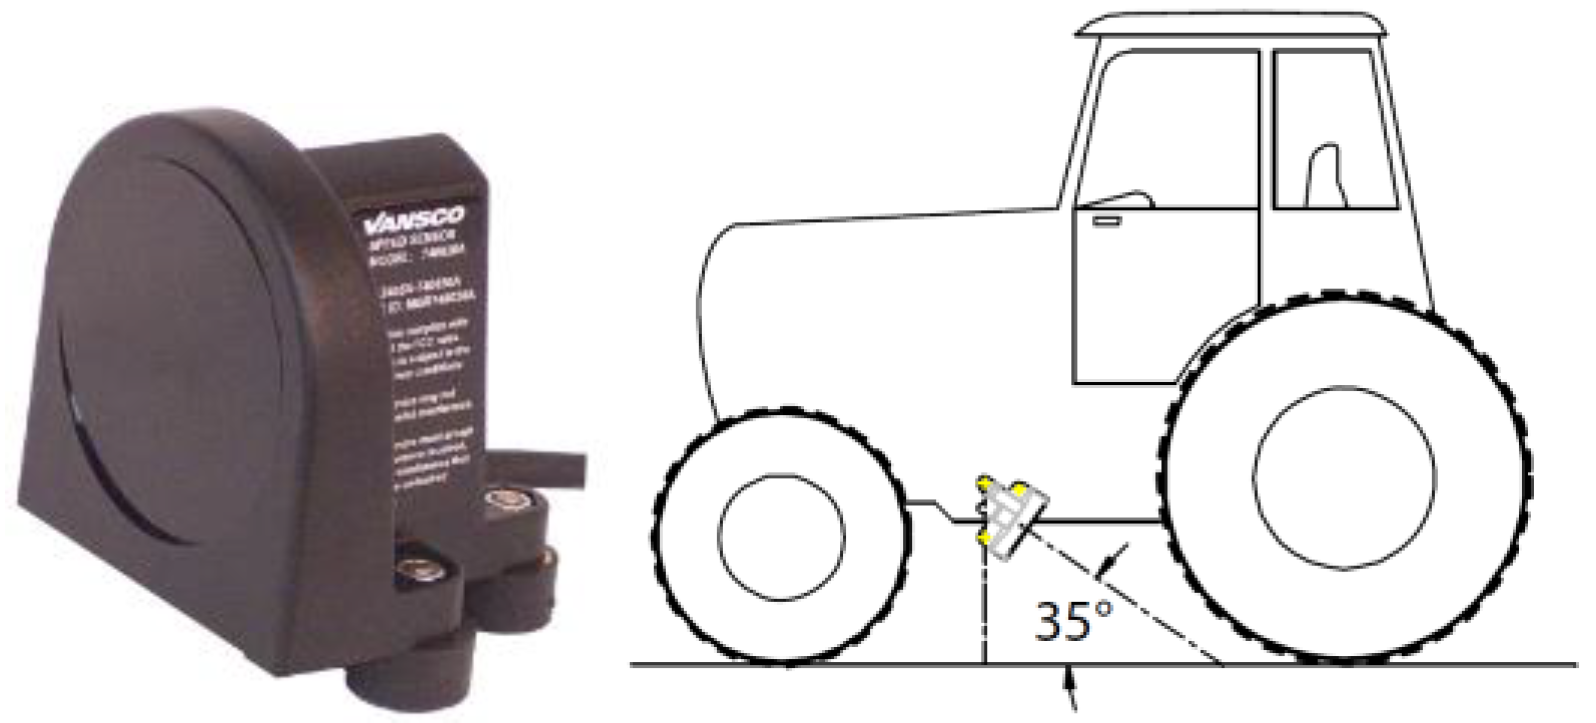
2.2.2. Radar Speed Measurement Method

The principle of radar speed measurement is based on the “Doppler effect”. Radars can emit fixed-frequency radio waves, which are reflected when they encounter objects. The instantaneous velocity of the radar relative to the object can be obtained by measuring the frequency difference between the emitted and reflected radio waves. On the basis of the above principles, radar speed measurement can be calculated according to Equation (4).
f d = 2 V f 0 c cos ϕ ,
where f d is the frequency of the pulse signal output by the speed measuring radar (Hz), V is the speed of the speed radar relative to the ground (mph; 1 mph = 1.609344 km/h), f 0 is the frequency of radio waves sent and received by the speed measuring radar (Hz), c is the speed of light (6.71 × 10⁸ mph), and ϕ is the angle formed by the radio wave emission direction of the speed measuring radar and the object (°).
In this study, the Vansco 740 speed radar produced by Micro-Trak Systems, INC. was selected [28]. The speed range of the radar is 0.5–70 km/h, and the speed measurement accuracy is <±3% (0.5–3 km/h) and <±1% (3–70 km/h). The frequency of sending and receiving radio waves is f 0 = 24.125 GHz. The recommended installation angle is ϕ = 35°. The speed radar photo and installation angle are shown in Figure 4.
Table 1 shows the frequency f d value of the pulse signal output by the speed measuring radar at each target speed calculated according to Equation (4) and the period value between two adjacent pulses.
It can be concluded from Table 1 that the pulse signal frequency output by the speed measuring radar was the largest at a forward speed of 22 km/h, which was 805.27 Hz, and the corresponding period time was 0.001242 s, which was greater than 1 ms. The period time acquisition accuracy of the timer input capture function of the microcontroller is 1 ms. Therefore, the hardware system of the single-chip microcomputer can meet the requirements of monitoring accuracy.
To test the accuracy of the radar speed calculation program, the MeterMax monitor developed by Precision Planting Company and the supporting radar simulator were used for speed measurement comparison tests [29]. The test is shown in Figure 5. The comparative test results showed that the speed values monitored by the two monitoring devices were almost identical. The consistency was over 99%. This proved that the radar speed calculation program designed in this study was feasible.

2.2.3. Encoder Rotation Speed Measurement Method

An encoder is a common sensor for measuring rotation speed, which is mainly composed of a light-emitting element, code disc, and light-receiving element. In this study, a rotary incremental encoder was selected, which generated a pulse signal during rotation to facilitate the calculation of the speed. There are three ways to measure the rotation speed of the encoder: M method rotation speed measurement (measuring the number of pulses generated within a set time), T method rotation speed measurement (measuring the time of two adjacent pulses), and M/T method rotation speed measurement (measuring both the time and the number of pulses within that time). The resolution of the encoder is a very important parameter and usually needs to be selected according to the measured rotation speed. Table 2 shows the target rotation speed of the seed disc of the seed metering device at three target seeding spacings and 10 target speeds (the number of seed disc holes was calculated according to 25 cm spacing).
It can be seen from Table 2 that the minimum target rotation speed of the seed disc was 8.89 r/min and the maximum was 73.33 r/min. The speed was slow, making it suitable for T-method speed measurement. The calculation formula of the encoder T method rotation speed measurement is as follows:
V p 60 = 1 m · t ,
where m is the encoder resolution (P/R), and t is the time of two adjacent pulses (s).
Among them, the pulse period t is calculated by the single-chip timer. To ensure a higher monitoring accuracy, the value of t should preferably not be less than 10 ms. Therefore, from Equation (5),
m 6000 V p .
According to Table 2, the maximum value of V p was 73.33; accordingly, Equation (5) was used to obtain m ≤ 82. Therefore, the resolution of the encoder selected in this study was 60 P/R, the number of pulses per revolution was 60, and the measurement accuracy fully met the requirements.
In addition, this study changed the traditional way that the encoder was installed on the driving wheel to measure the rotational speed, and then adopted the way that the encoder directly measured the rotational speed of the seed disc of the seed metering device. This avoided the influence of the driving wheel slipping on the measurement accuracy; at the same time, it could more directly reflect the real-time rotation speed of the seed disc. This was helpful to improve the accuracy of the seeding spacing monitoring.

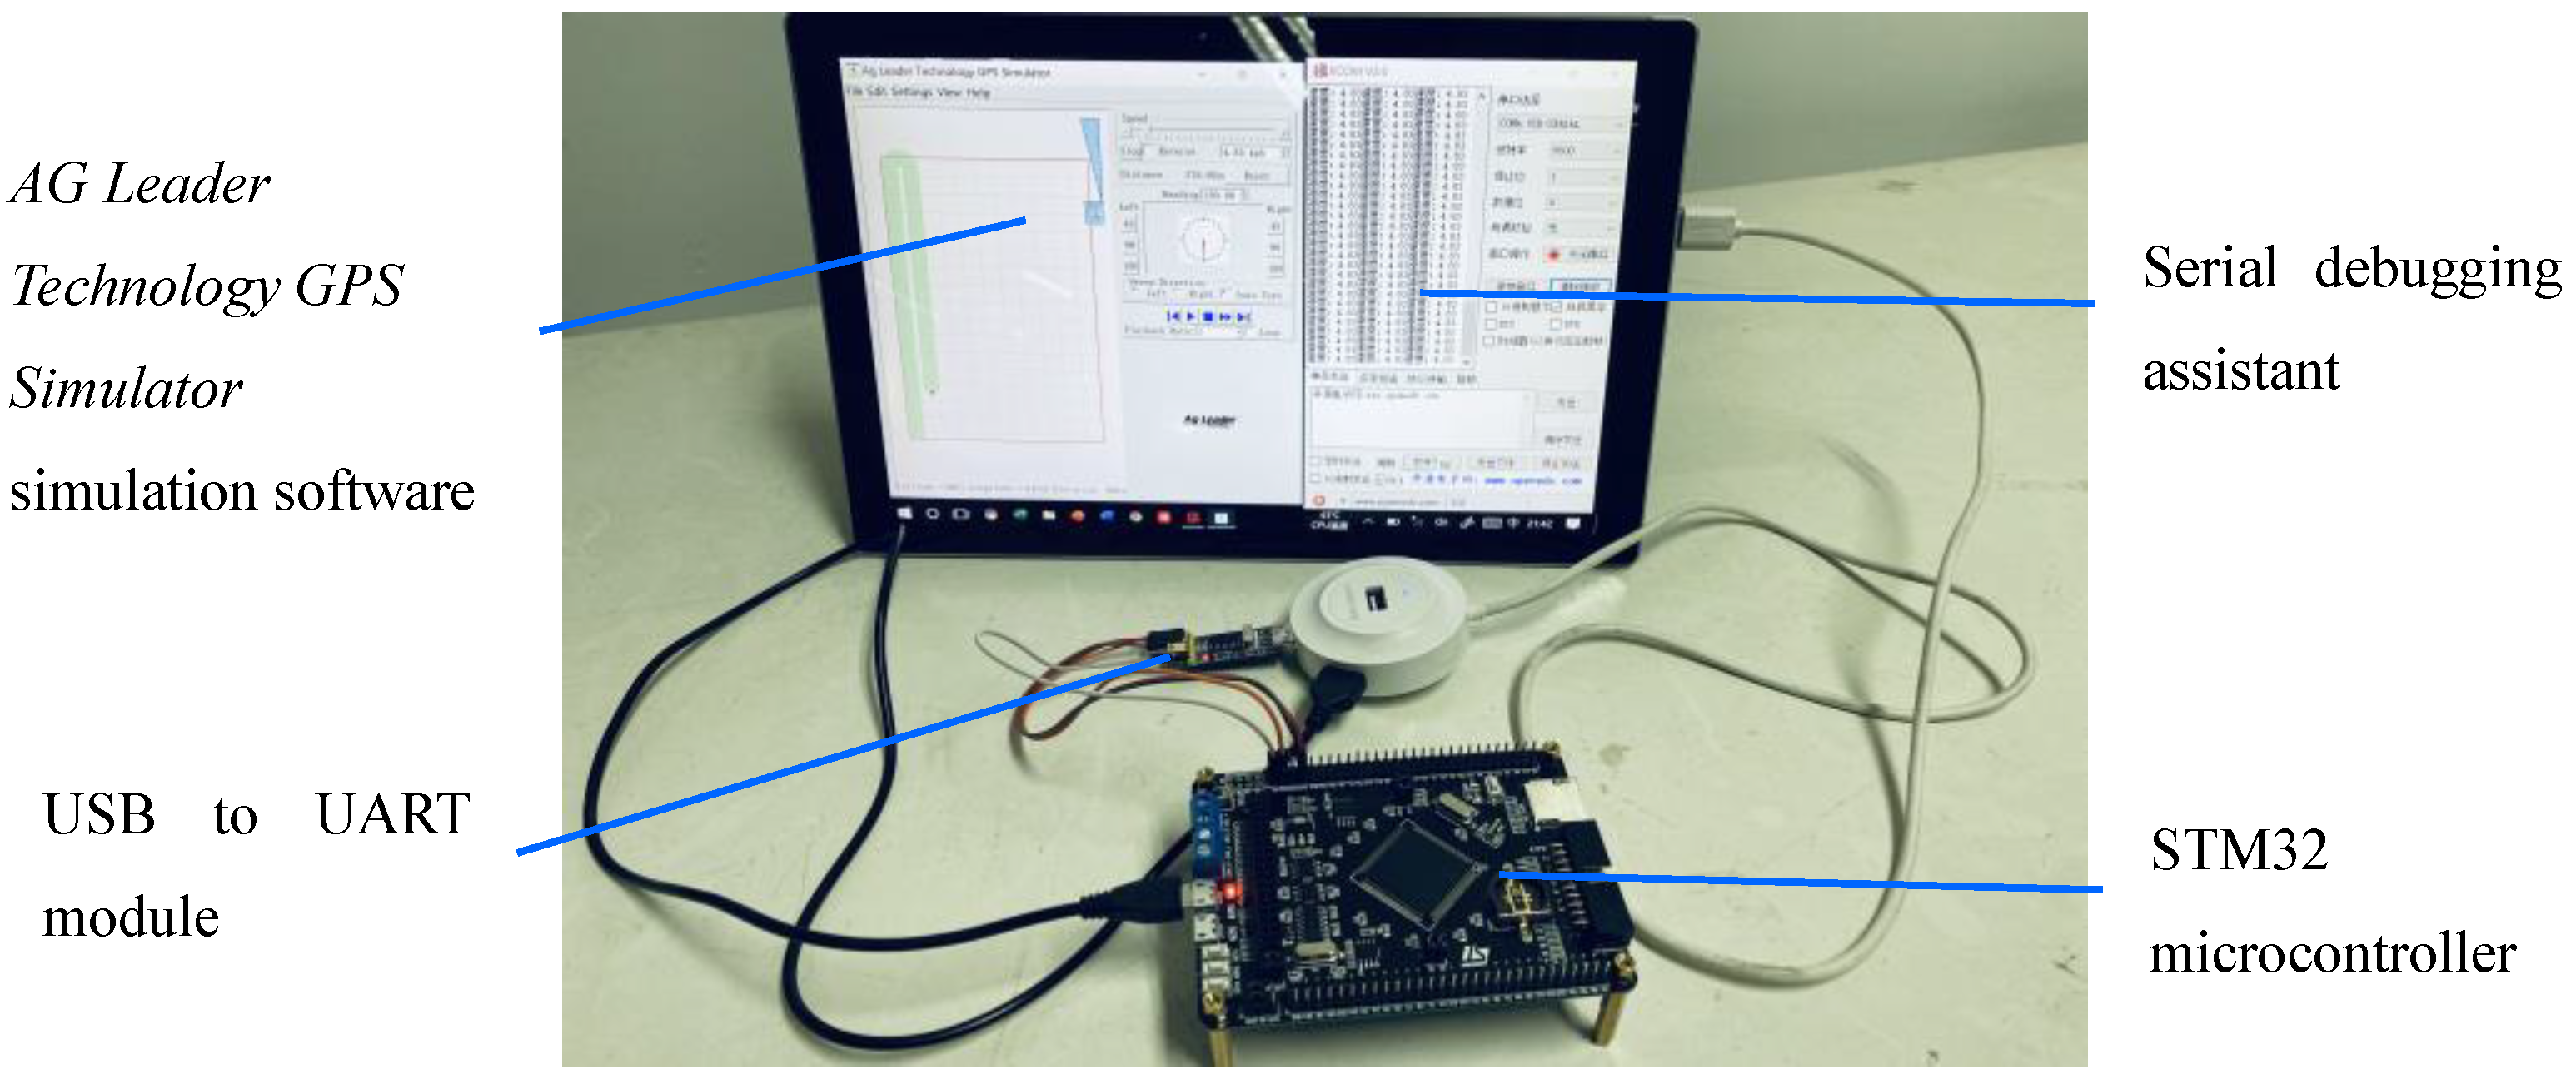
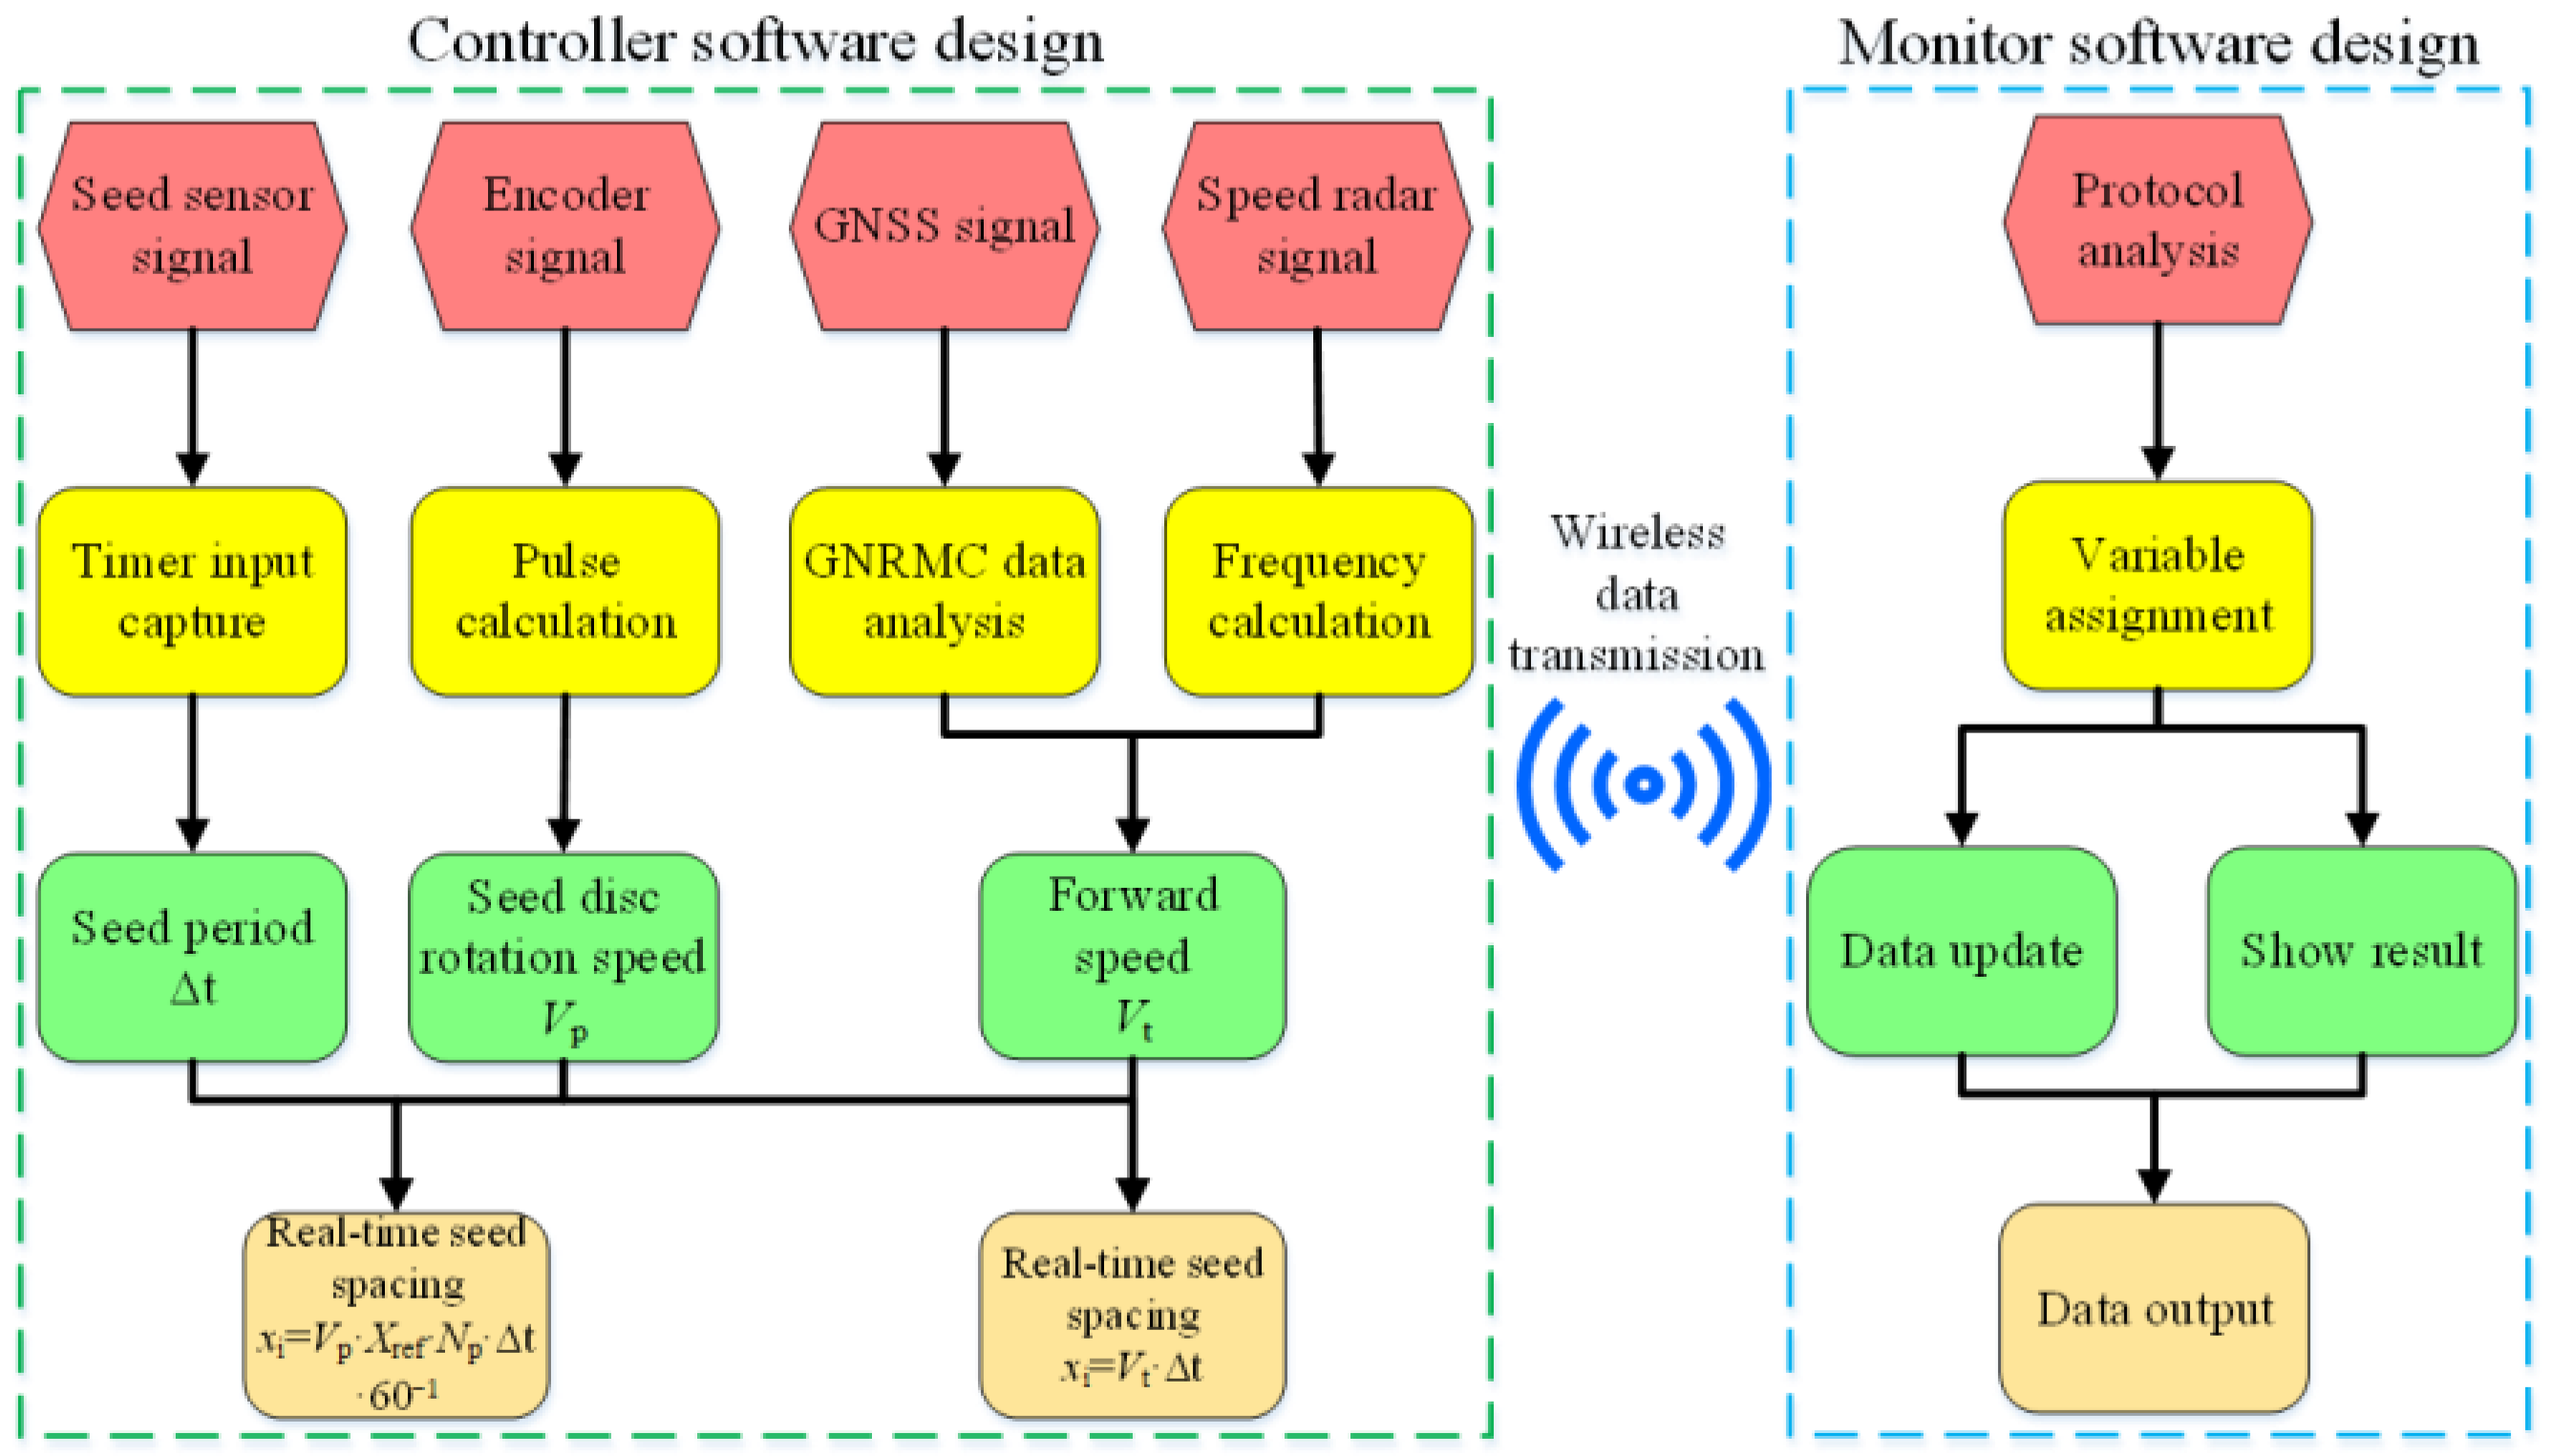
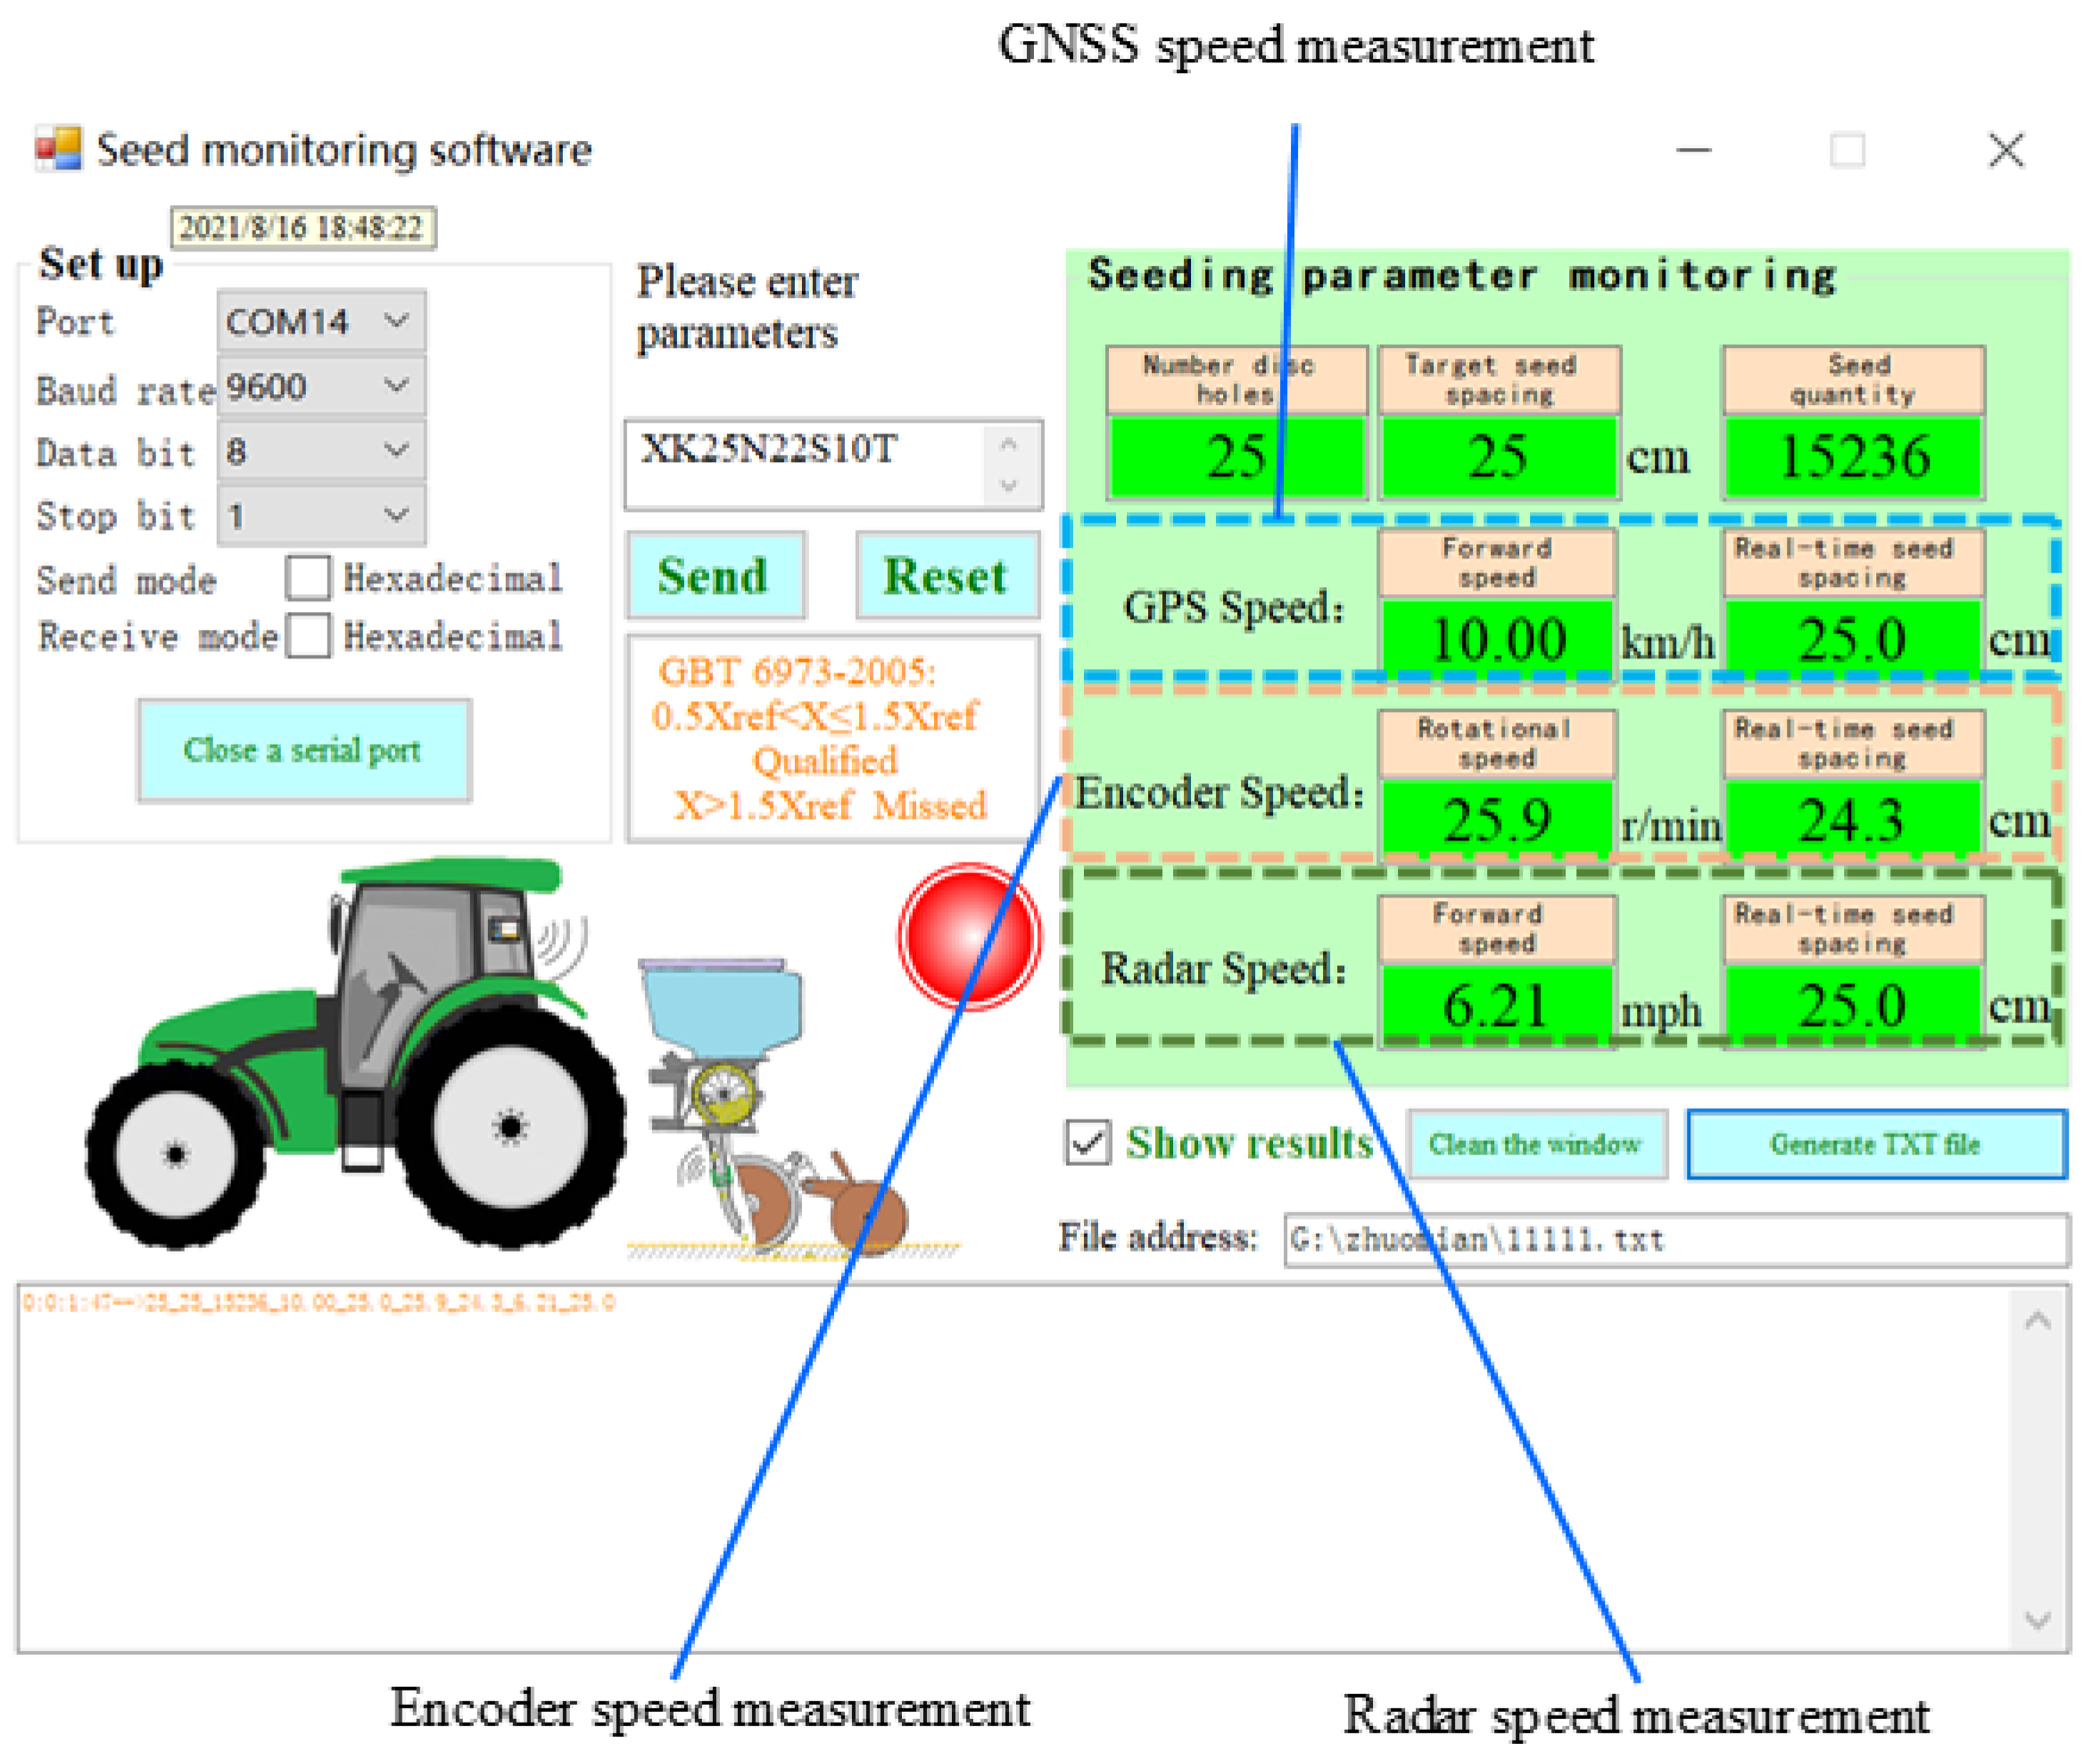
2.3. Monitoring System Software

The monitoring system software included two parts: monitor software and controller software. The monitor software was designed with Windows Forms application and programmed in C# language, mainly featuring functions such as data communication, result display, and data export. The controller software design mainly features functions such as seed sensor signal acquisition, GNSS receiver signal acquisition, speed radar signal acquisition, encoder rotation speed signal acquisition, seeding spacing calculation, and data communication. Figure 6 shows the software function design of the monitoring system.
The input capture function of the single-chip timer was used to acquire seed sensor signal. It could accurately acquire the period of continuous pulses. Table 3 shows the target time between two seeds at three target seeding spacings and 10 target speeds (the number of seed disc holes was calculated according to 25 cm spacing).
It can be seen from Table 3 that the minimum target time between the two seeds was 0.0327 s, and the maximum was 0.2700 s.
To verify the accuracy of the period time calculation algorithm, 30 kinds of PWM waveforms with different period times were simulated. The period time was set to 0.01–0.30 s, and the increment was 0.01 s. One microcontroller was used to output PWM waveforms, while the other microcontroller was used to acquire and calculate the period time. Furthermore, an oscilloscope was used to acquire and calculate the period time. The test is shown in Figure 7.
The results showed that the timer input capture algorithm had high accuracy, which was consistent with the period time value collected by the oscilloscope.
The monitor software interface design is shown in Figure 8. The software used wireless serial port communication to realize real-time data transmission with the controller. The software could input parameters such as the number of seed disc holes and target seeding spacing and send them to the controller. In addition, to compare the differences between the three speed measurement methods more clearly, the software displays the speed values and real-time seeding spacing values measured by the three methods in real time. The data are saved and exported, which is convenient for later processing. The software display data update frequency was set to 10 Hz, with strong real-time performance.

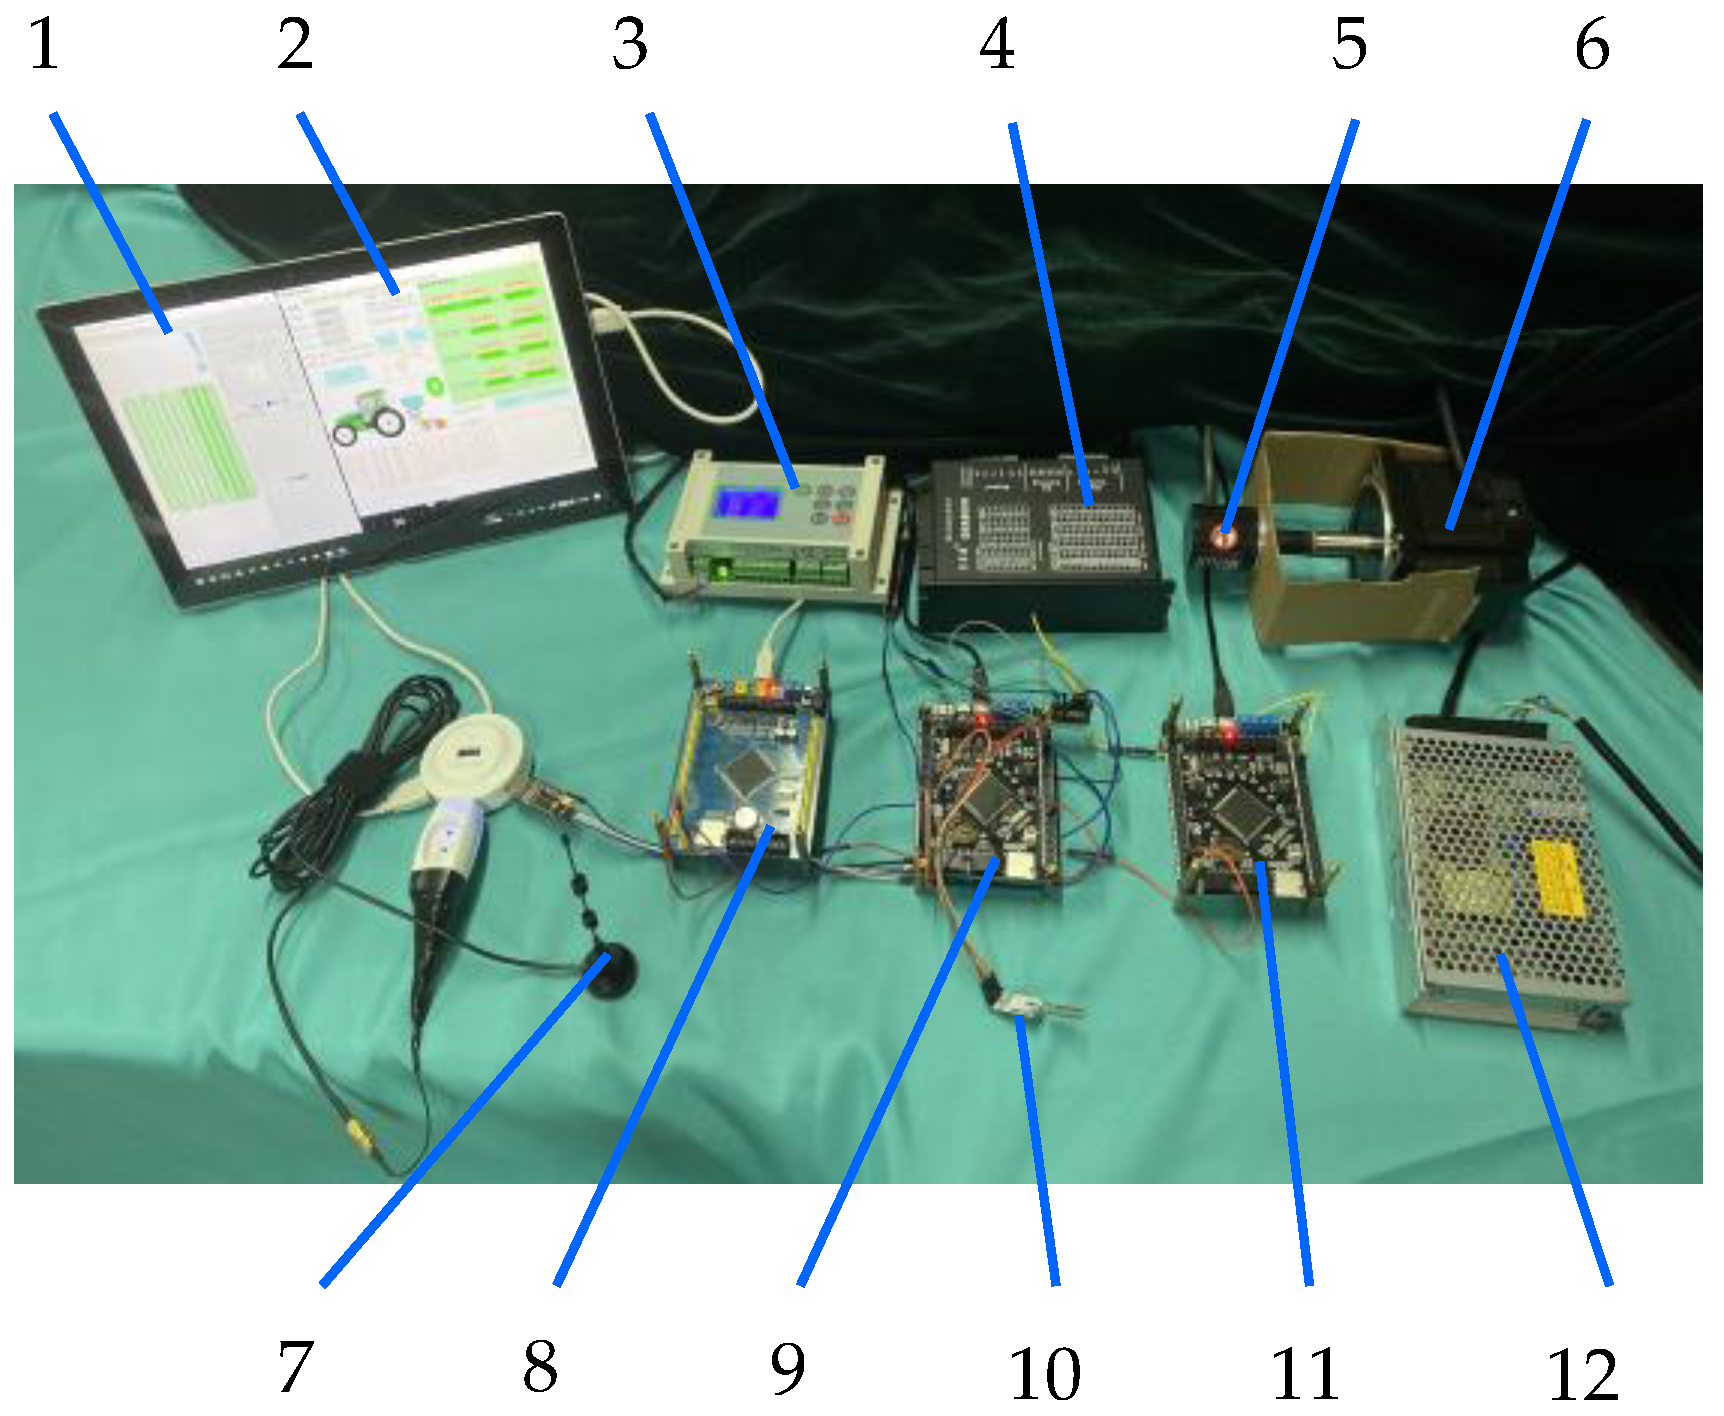
2.4. Bench and Field Tests

2.4.1. Bench and Field Tests

Before the field test, an indoor bench simulation monitoring test was carried out on the entire monitoring system. The simulation test is shown in Figure 9. A microcomputer could simulate the seed signal. Another microcontroller could simulate radar sensor signals. The precision stepper motor could set the speed to simulate the speed of the seeding disc. AG Leader Technology GPS Simulator software could simulate GNSS signals. The monitoring system controller could collect the signals of the other two microcontrollers, the encoder signals, and the analog software signals. The monitoring software could display the monitored data wirelessly in real time.

2.4.2. Field Test

The field test was conducted in Yanzhou City, Shandong Province. A four-row electric drive seeder was used for seeding in the test. The seeder and monitoring system is shown in Figure 10.
The GNSS receiver was the easiest to install, and it could be directly attached to the tractor via a powerful magnet on the base. The rotary shaft of the encoder was connected with the rotary shaft of the seed metering device to realize real-time monitoring of the rotation speed of the seeding disc. The installation of the radar was more complicated, and its electromagnetic wave launch angle needed to be maintained at an angle of 35° with the horizontal plane as best as possible. An electronic angle meter was adopted to adjust the installation angle of the radar such that the angle was maintained around 35° as best as possible.
A total of three uniform-speed seeding tests and three variable-speed seeding tests were designed. The target test plan is shown in Figure 11. The target speeds for the three uniform-speed seeding tests were set at 6, 8, and 10 km/h. Each test in the three variable-speed seeding test was divided into two stages: acceleration and deceleration. The intermediate target speeds were set to 6, 8, and 10 km/h, respectively.

3. Results and Discussion

Through indoor and field tests, the speed monitoring accuracy of the three speed measurement methods was comprehensively and accurately verified. The results of each test are analyzed below.

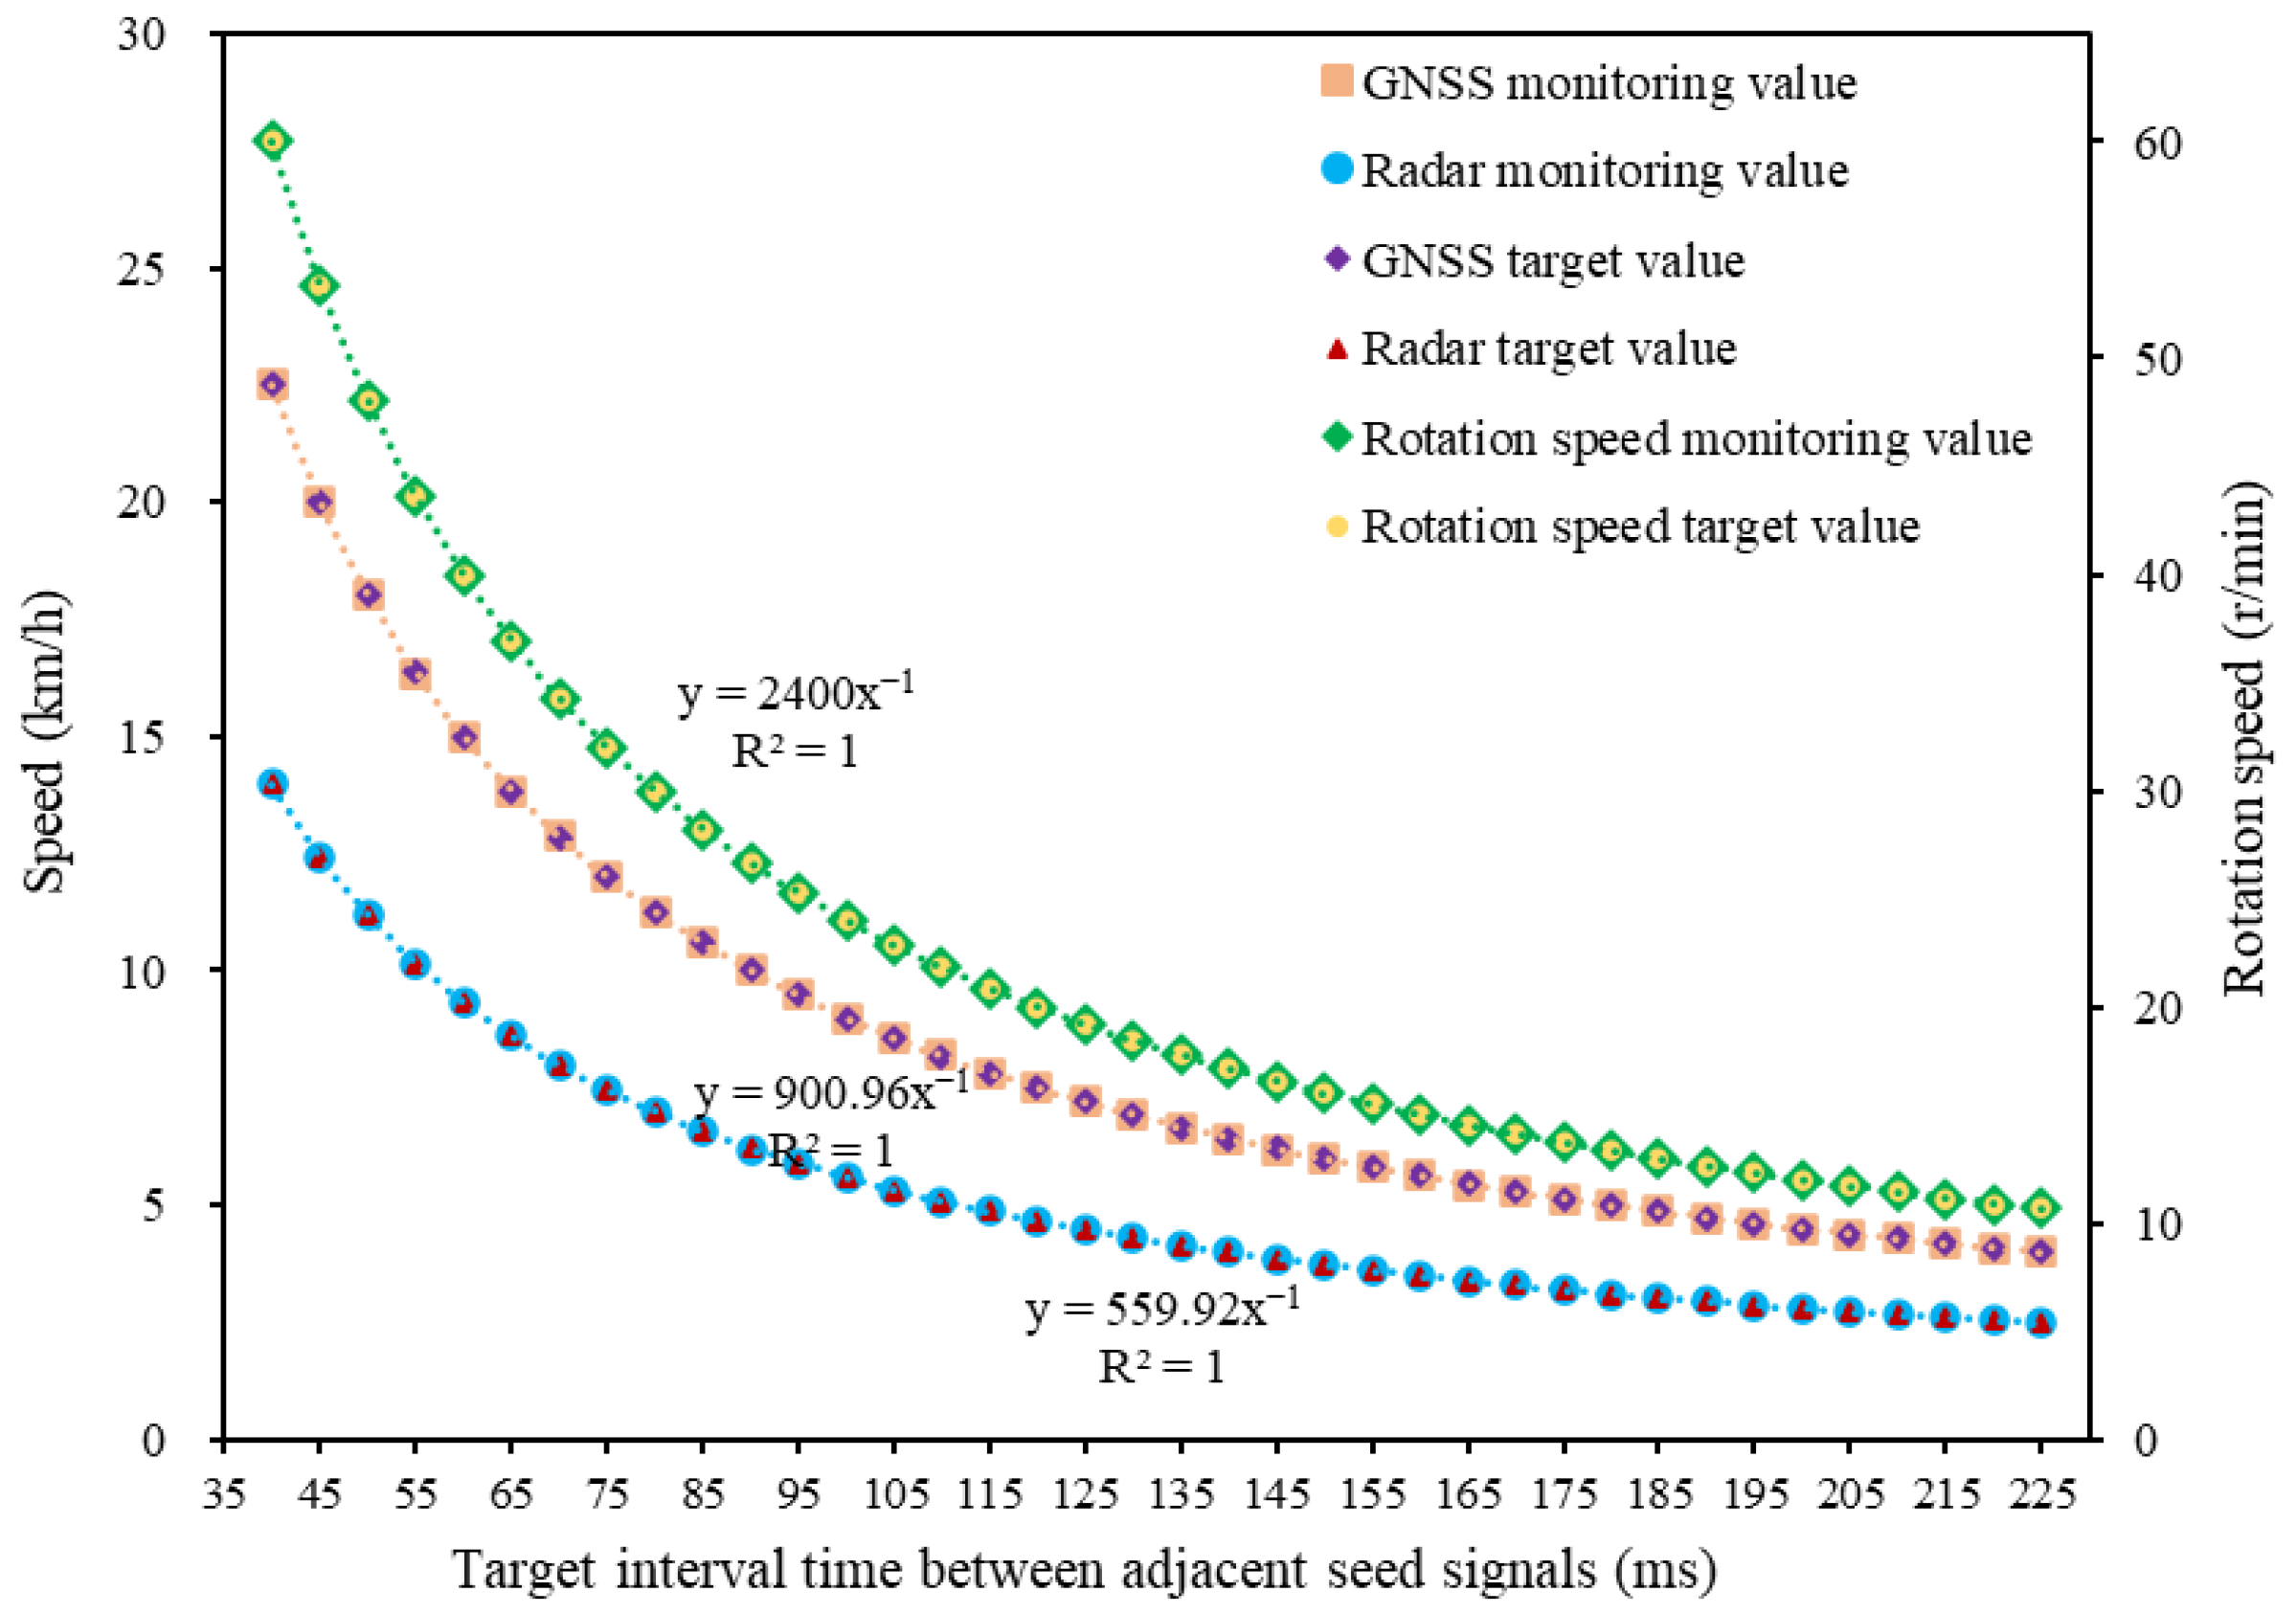
3.1. Analysis of Indoor Bench Simulation Test Results

The monitoring results of the three speed measurement methods when the target seeding spacing was 25 cm are shown in Figure 12. Comparing the monitoring value with the target value, it was found that the monitoring accuracy of the three speed measurement methods was very high, almost consistent with the target value, and the accuracy rate was over 99%.
In addition, through the function curve fitting of the monitoring values of the three speed measurement methods, it was concluded that the monitoring values of the three speed measurement methods all conformed to the model y = k · x 1 . The curve-fitting degree was extremely high, all R 2 = 1 . This explained the accuracy of the three speed measurement methods designed by this study and laid the foundation for the later field testing.

3.2. Analysis of Field Test Results

Due to the complicated field test environment, it was difficult for the tractor and the driver to control the seeding speed to achieve the target plan. However, the test still guaranteed three uniform-speed seeding tests and three variable-speed seeding tests as best as possible.

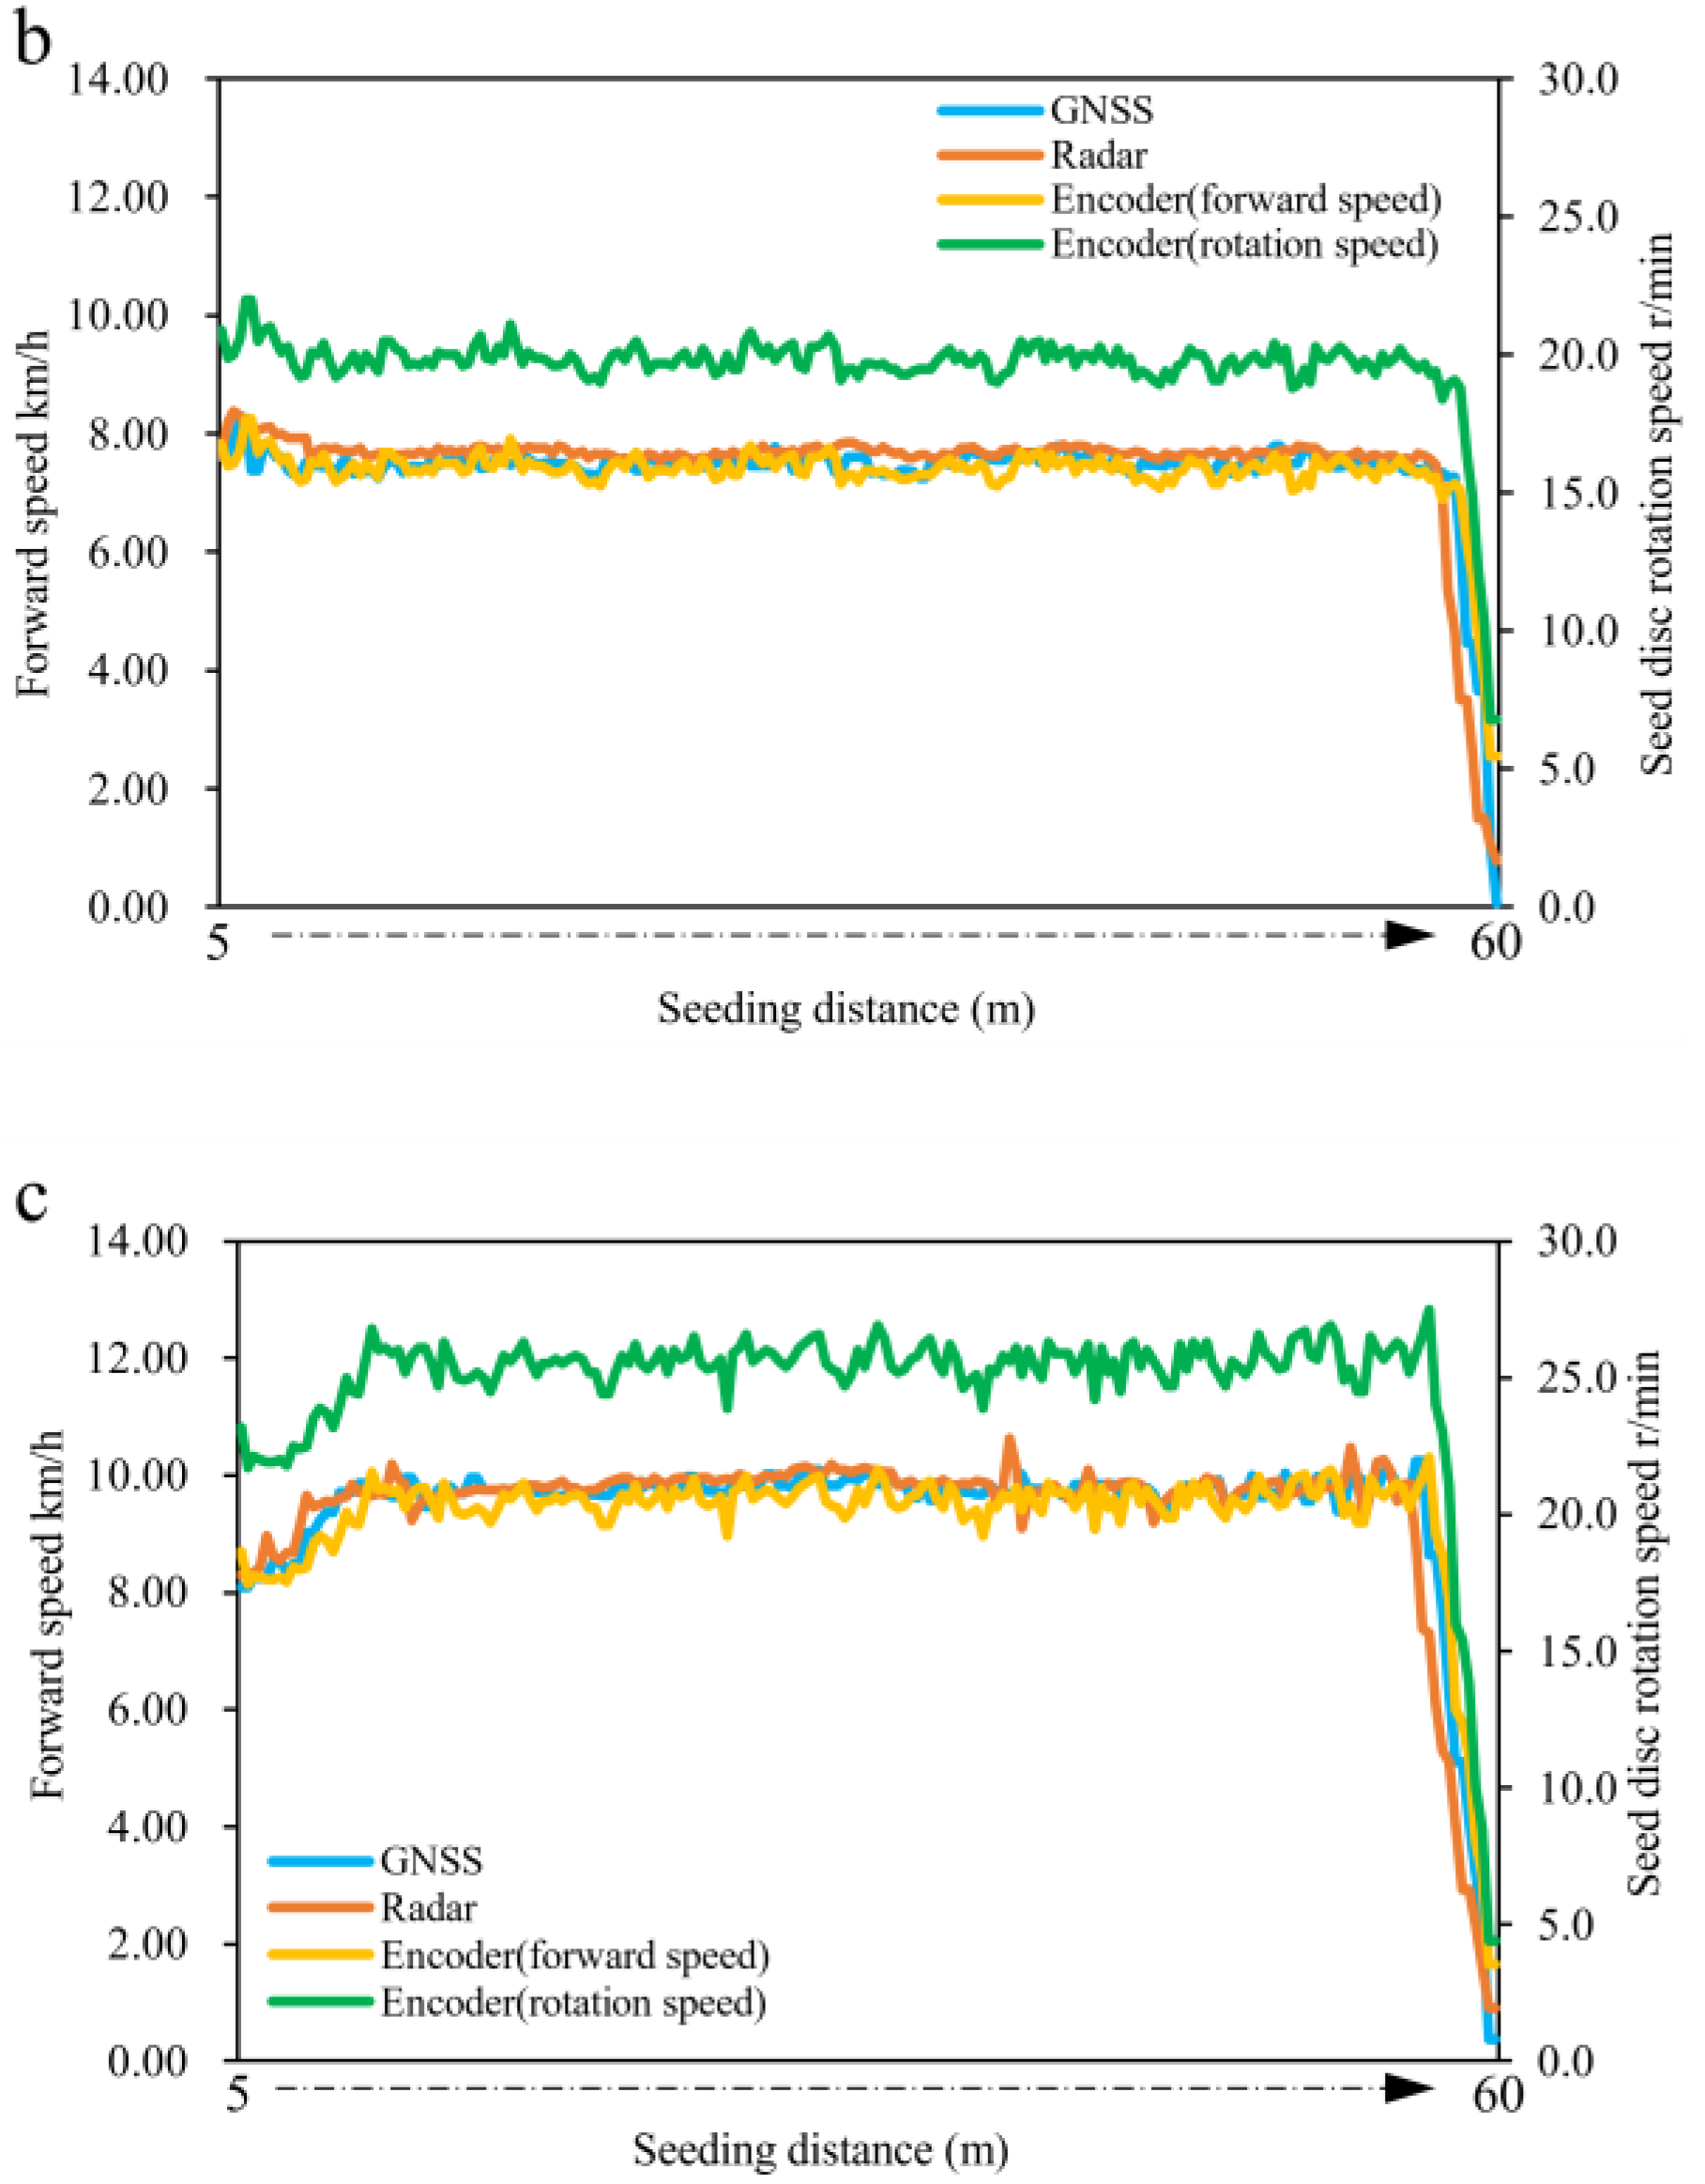
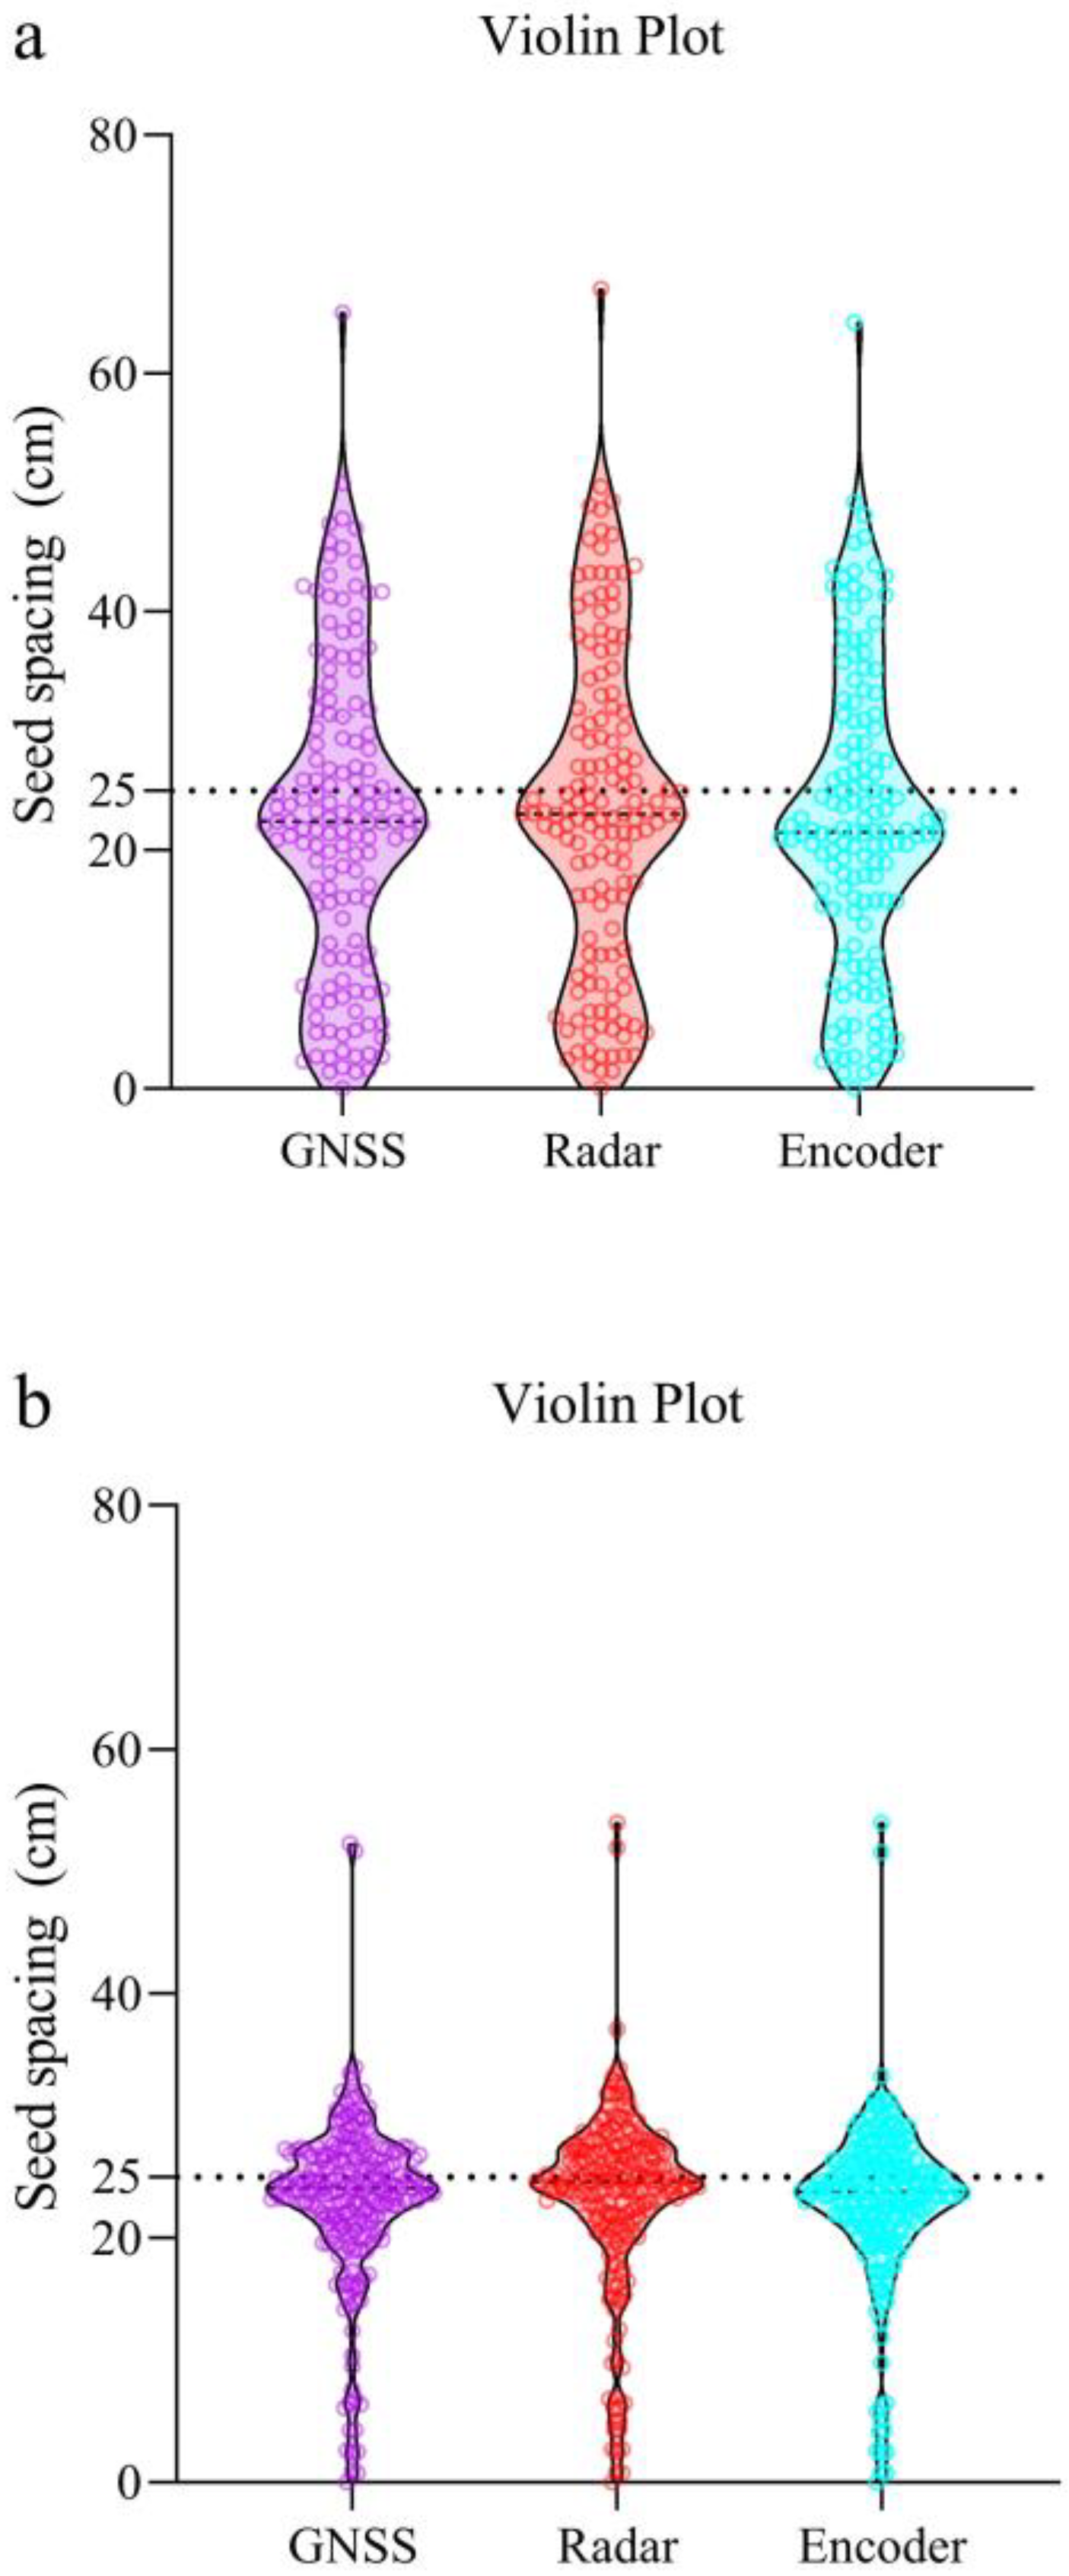
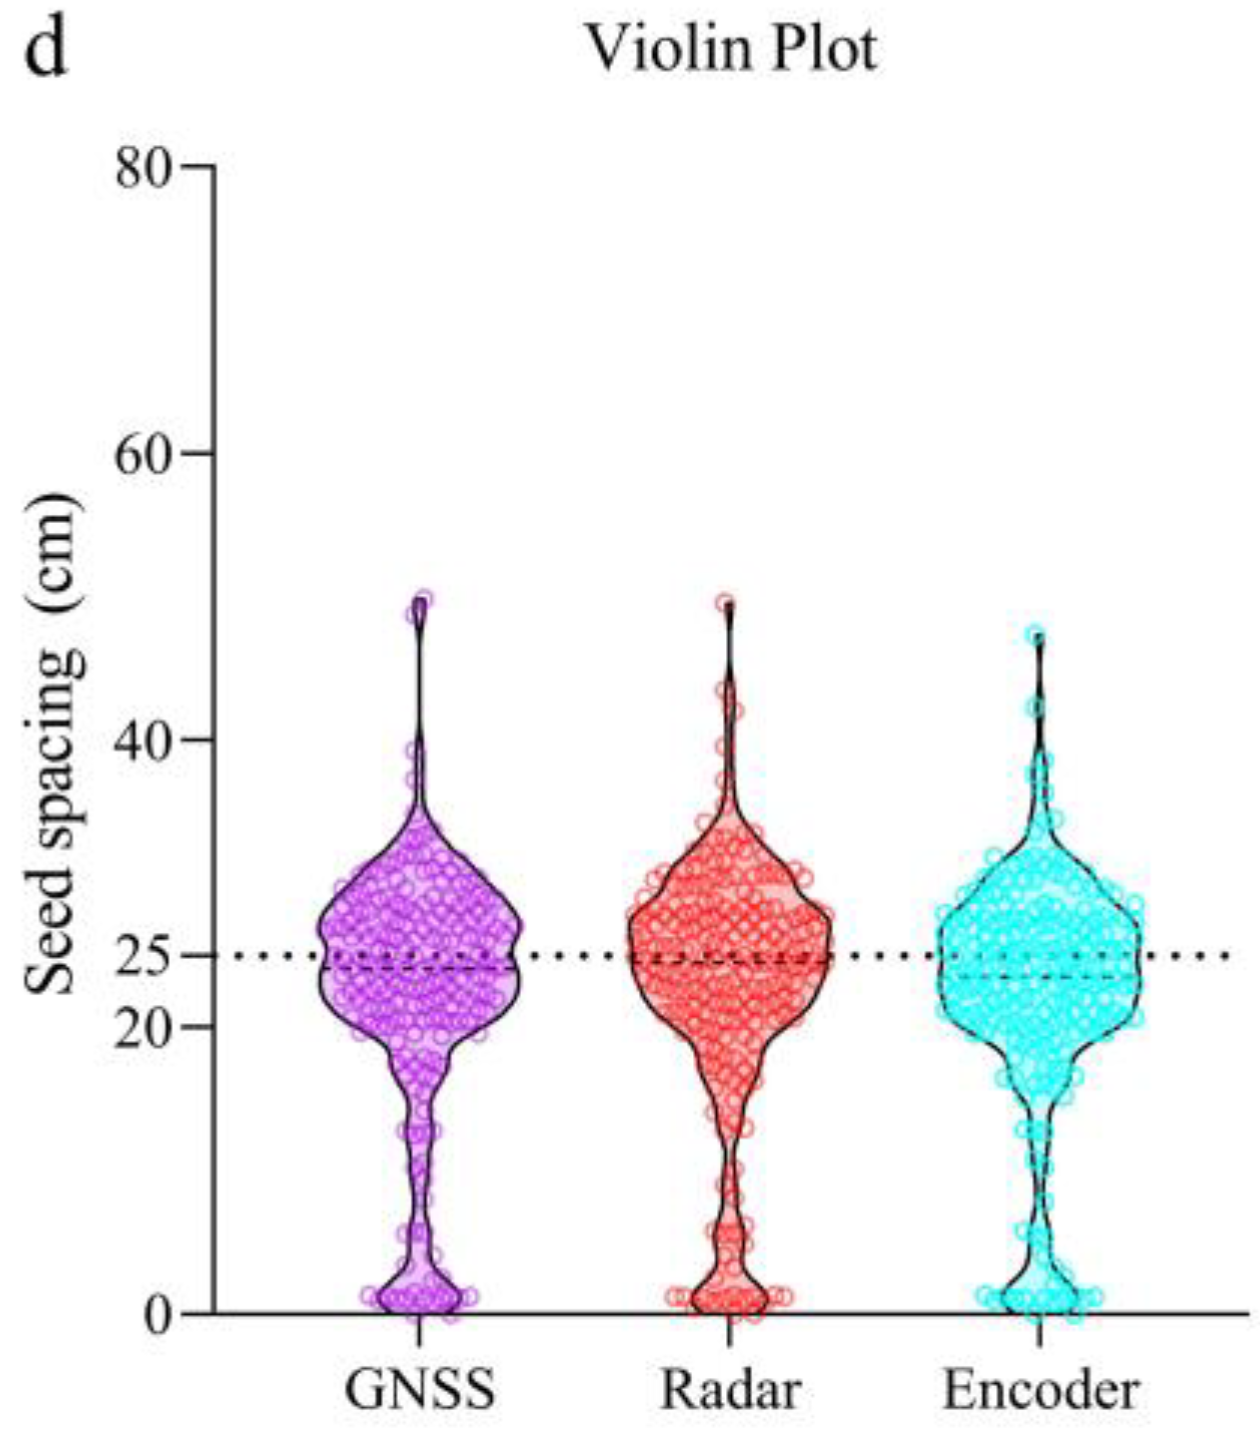
3.2.1. Analysis of Uniform-Speed Seeding Tests Results

The speed value monitoring results of the three uniform-speed seeding tests are shown in Figure 13. The rotation speed was converted to forward speed according to Equation (2).
It can be seen from Figure 13 that the speed monitoring results of the three speed measurement methods of GNSS, radar, and encoder were close, and the overall change trend was also consistent. To further analyze the correlation between the speed monitoring values of the three speed measurement methods, the mathematical analysis software IBM SPSS Statistics was used to analyze the data. The Pearson correlation analysis method was used to process the data. Table 4 shows the Pearson correlation analysis results of the speed monitoring values of the three speed measurement methods.
From Table 4, it can be concluded that R m a x = 0.969 and R m i n = 0.887 . On the whole, R > 0.90 and p < 0.01 . This showed that the correlation was very strong. In the uniform-speed seeding operation, the speed monitoring values of the three speed measurement methods of GNSS, radar, and encoder had a very good linear correlation. This further proved the similarity of the monitoring accuracy of the three speed measurement methods.
Similarly, the real-time seeding spacing monitoring values under the three speed measurement methods were analyzed. Figure 14 shows the violin plot of the real-time seeding spacing monitoring values of three uniform-speed seeding operations.
It can be seen from Figure 14 that, in each uniform-speed test, the distribution range and probability value of the seeding spacing values monitored under the three speed measurement methods were very similar, and there was no obvious difference. Similarly, the Pearson correlation analysis method was used to process the data. Table 5 shows the Pearson correlation analysis results of the real-time seeding spacing monitoring values of the three speed measurement methods.
From Table 5, it can be concluded that R m a x = 0.995 and R m i n = 0.951 . On the whole, R > 0.98 and p < 0.01 . This showed that the correlation was very strong.
Through the analysis of the speed monitoring values of GNSS, radar, and encoder three speed measurement methods and the real-time seeding spacing monitoring value, it was found that the monitoring values of the three speed measurement methods were very close during the uniform-speed seeding operation. The monitoring accuracy of the three speed measurement methods had a high similarity.

3.2.2. Analysis of Variable-Speed Seeding Tests Results

The speed value monitoring results of the three variable-speed seeding tests are shown in Figure 15.
It can be seen from Figure 15 that the speed monitoring results of the three speed measurement methods of GNSS, radar, and encoder were close, and the overall change trend was also consistent. This was similar to the result of the uniform-speed seeding test. The mathematical analysis software IBM SPSS Statistics was used to analyze the data. The Pearson correlation analysis method was used to process the data. Table 6 shows the Pearson correlation analysis results of the speed monitoring values of the three speed measurement methods.
From Table 6, it can be concluded that R m a x = 0.978 and R m i n = 0.920 . On the whole, R > 0.95 and p < 0.01 . This showed that the correlation was very strong. This further proved the similarity of the monitoring accuracy of the three speed measurement methods.
The real-time seeding spacing monitoring values under the three speed measurement methods were analyzed. Figure 16 shows the Violin Plot of the real-time seeding spacing monitoring values of three variable-speed seeding operations.
It can be seen from Figure 16 that, in each variable-speed test, the distribution range and probability value of the seeding spacing values monitored under the three speed measurement methods were very similar, and there was no obvious difference. Similarly, the Pearson correlation analysis method was used to process the data. Table 7 shows the Pearson correlation analysis results of the real-time seeding spacing monitoring values of the three speed measurement methods.
From Table 7, it can be concluded that R m a x = 0.991 and R m i n = 0.960 . On the whole, R > 0.97 and p < 0.01 . This showed that the correlation was very strong.
Just like the uniform-speed seeding test, it was found that the monitoring values of the three speed measurement methods were very close during the variable-speed seeding operation. The monitoring accuracy of the three speed measurement methods had a high similarity.

3.3. Comprehensive Analysis

Through the above analysis, it could be found that, whether it was uniform-speed seeding or variable-speed seeding, the speed monitoring values of the three speed measurement methods of GNSS, radar, and encoder had extremely high correlation, with an average correlation coefficient R > 0.95. Moreover, there was no significant difference in the distribution range and probability value of the monitoring values of the seeding spacing among the three speed measuring methods. This showed that the monitoring accuracy of the three speed measurement methods was very similar, and there was no significant difference. Therefore, all three speed measurement methods are suitable for current field planting operation monitoring.
In addition, it could be found from the three uniform-speed seeding test results that, when the speed was low (<6 km/h), the stability of the seeding spacing was poor, and the distribution of the seeding spacing value was relatively discrete. The difference between the monitoring value and the target value of the seeding spacing was obvious. This showed that the stability of the three speed measurement methods at lower speeds was not as stable as at higher speeds. Variable-speed seeding had little effect on the speed monitoring accuracy and seeding spacing monitoring accuracy.
Table 8 shows the comparison of the three speeds measurement equipment used in this study. It can be seen from Table 8 that the encoder was the cheapest at only 88 RMB; the radar had the highest price at 4000 RMB. GNSS receiver was the easiest to use, and the price was relatively low. Radar was the most difficult to use, with high requirements for the flatness of the ground. In summary, the GNSS receiver was preferred for speed measurement, which could directly obtain the forward speed of the seeder.
This system is mainly used to measure the real-time seeding spacing of a single seed. Because the seed monitoring sensor can only identify a single seed, if the seeds overlap, the sensor will only generate one signal instead of two signals. Real-time seeding spacing will, thus, miss a value measured, recording it as 0. However, in general, this would not affect the measurement of real-time seeding spacing, because this is rarely the case for single-seed precision seeders. The method of measuring real-time seeding spacing in this system is more direct, the anti-interference ability of the complex environment in the fields is stronger, and the cost is lower. Therefore, it is more in line with the actual operation requirements. The test verified that the measurement accuracy of the system is higher and reliable.

4. Conclusions

This study designed and compared three different speed measurement methods, including GNSS speed measurement, radar speed measurement, and encoder speed measurement. The same monitoring system was used; the speed monitoring value of different speed measurement equipment and the real-time seeding spacing monitoring value were tested by bench test and field test. After analysis, some conclusions could be drawn as follows:
(1)
According to the bench test results, the monitoring system designed on the basis of the three speed measurement methods of GNSS, radar, and encoder had high monitoring accuracy. Compared with analog equipment, the monitored value was the same as the target value, and the accuracy rate was above 99%.
(2)
According to the field test results, it was found that the speed monitoring values of the three speed measurement methods and the real-time seeding spacing monitoring values had extremely high correlation, with a correlation coefficient R > 0.95. This further showed that the three speed measurement methods had little impact on the monitoring results and did not cause large errors. Therefore, these three speed measurement methods were suitable for the requirements of current field seeding operations.
(3)
After comprehensive consideration of the price and installation complexity of the three types of speed measurement equipment, the GNSS receiver is primarily recommended for speed measurement. Because of its relatively low price, it is very easy to install and use, and its monitoring accuracy and real-time performance fully meet the needs. An excellent speed measurement method is very important for the precise monitoring of real-time seeding spacing in the future, and it is also very helpful for further improving the monitoring accuracy of seeding quality parameters.

Author Contributions

Conceptualization, C.X., Z.D. and T.X.; methodology, C.X. and Z.D.; validation, D.Z., L.Y., X.H. and T.C.; formal analysis, C.X., Z.D. and T.X.; investigation, T.X.; resources, T.C.; data curation, C.X.; writing—original draft preparation, C.X.; writing—review and editing, D.Z., L.Y., X.H. and T.C.; visualization, C.X. and Z.D.; supervision, L.Y.; project administration, L.Y.; funding acquisition, L.Y. All authors read and agreed to the published version of the manuscript.

Funding

This research was funded by the National Natural Science Foundation of China, China (Grant No. 32071915), and the National Industry System of Corn Technology of China (CARS-02).

Institutional Review Board Statement

Not applicable.

Data Availability Statement

The data used in this study were self-tested and self-collected. As the control method designed in this paper is still being further improved, data cannot be shared at present.

Conflicts of Interest

The authors declare no conflict of interest.

References

  1. Gao, X.; Xu, Y.; Zhang, D.; Yang, L.; Lu, B.; Su, Y.; Xia, G.; Cui, T. Design and experiment of air-assisted high speed precision maize seed metering device. Trans. CSAE 2019, 35, 9–20. [Google Scholar] [CrossRef]
  2. Ding, L.; Yang, L.; Zhang, D.; Cui, T.; Gao, X. Design and experiment of seed plate of corn air suction seed metering device based on DEM-CFD. Trans. Chin. Soc. Agric. Mach. 2019, 50, 50–60. [Google Scholar] [CrossRef]
  3. Ding, L.; Yang, L.; Liu, S.; Yan, B.; He, X.; Zhang, D. Design of air suction high speed precision maize seed metering device with assistant seed filling plate. Trans. CSAE 2018, 34, 1–11. [Google Scholar] [CrossRef]
  4. Yang, L.; Yan, B.; Zhang, D.; Zhang, T.; Wang, Y.; Cui, T. Research progress on precision planting technology of maize. Trans. Chin. Soc. Agric. Mach. 2016, 47, 38–48. [Google Scholar] [CrossRef]
  5. Yuan, Y.; Bai, H.; Fang, X.; Wang, D.; Zhou, L.; Niu, K. Research progress on maize seeding and its measurement and control technology. Trans. Chin. Soc. Agric. Mach. 2018, 49, 1–18. [Google Scholar] [CrossRef]
  6. ISO Standard 7256/1-1984(E); Sowing Equipment-Test Methods Part 1: Single Seed Drills (Precision Drills). International Organization for Standardization: Geneva, Switzerland, 1984.
  7. GB/T 6973-2005; Standardization Administration of the PR China and General Administration of Quality Supervision, Inspection and Quarantine of the PR China. Testing Methods of Single Seed Drills (Precision Drills). China Machinery Industry Federation: Beijing, China, 2005.
  8. Xie, C.; Yang, L.; Zhang, D.; Cui, T.; Zhang, K. Seeding parameter monitoring method based on laser sensors. Trans. CSAE 2021, 37, 140–146. [Google Scholar] [CrossRef]
  9. Karimi, H.; Navid, H.; Besharati, B.; Behfar, H.; Eskandari, I. A practical approach to comparative design of non-contact sensing techniques for seed flow rate detection. Comput. Electron. Agric. 2017, 142, 165–172. [Google Scholar] [CrossRef]
  10. Che, Y.; Wei, L.; Liu, X.; Li, Z.; Wang, F. Design and experiment of seeding quality infrared monitoring system for no-tillage seeder. Trans. CSAE 2017, 33, 11–16. [Google Scholar] [CrossRef]
  11. Tian, L.; Yi, S.; Yao, L.; Li, Y.; Li, A.; Liu, K.; Liu, Y.; Xu, C. Kind of monitoring system based on capacitance signal research. J. Agric. Mech. Res. 2018, 40, 189–194. [Google Scholar] [CrossRef]
  12. Zhao, B.; Fan, X.; Zhou, L.; Li, Y.; Che, Y.; Niu, K. Design and test of piezoelectric flow sensor for pneumatic seeder. Trans. Chin. Soc. Agric. Mach. 2020, 51, 55–61. [Google Scholar] [CrossRef]
  13. He, X.; Hao, Y.; Zhao, D.; Zhang, D.; Cui, T.; Yang, L. Design and experiment of testing instrument for maize precision seed meter’s performance detection. Trans. Chin. Soc. Agric. Mach. 2016, 47, 19–27. [Google Scholar] [CrossRef]
  14. Yang, S.; Wang, X.; Gao, Y.; Chen, L.; Zhai, C.; Dou, H. Design of on-line seed spacing monitoring and miss seeding warning system for maize precision planting. Trans. Chin. Soc. Agric. Mach. 2021, 52, 17–24+35. [Google Scholar] [CrossRef]
  15. Hao, Y.; Cui, T.; Bora, G.; Zhang, D.; Wei, J.; He, X.; Wang, M.; Yang, L. Development of an instrument to measure planter seed meter performance. Appl. Eng. Agric. 2018, 33, 31–40. [Google Scholar] [CrossRef]
  16. Ding, Y.; Yang, L.; Zhang, D.; Cui, T.; He, X.; Zhong, X. Control system of motor-driving maize precision planter based on GPS speed measurement. Trans. Chin. Soc. Agric. Mach. 2018, 49, 43–49. [Google Scholar] [CrossRef]
  17. Yang, S.; Wang, X.; Zhai, C.; Dou, H.; Gao, Y.; Zhao, C. Design and test on variable rate fertilization system supporting seeding and fertilizing monitoring. Trans. Chin. Soc. Agric. Mach. 2018, 49, 145–153. [Google Scholar] [CrossRef]
  18. Chen, L.; Xie, B.; Li, Z.; Yang, L.; Chen, Y. Design of control system of maize precision seeding based on double closed loop PID fuzzy algorithm. Trans. CSAE 2018, 34, 33–41. [Google Scholar] [CrossRef]
  19. Zhang, C.; Wu, R.; Chen, L. Design and test of electronic control seeding system for maize. Trans. Chin. Soc. Agric. Mach. 2017, 48, 51–59. [Google Scholar] [CrossRef]
  20. Cheng, W.; Zhang, G.; Ruan, P.; Diao, P.; Jin, C. Application review on electric-driven seed metering device of domestic precision seeder for maize or soybean. J. Chin. Agric. Mech. 2017, 38, 13–16. [Google Scholar] [CrossRef]
  21. Sun, Y.; Shen, J.; Dou, Q.; Li, Q.; Chen, G.; Sun, Y. Design and test of monitoring system of no-tillage planter based on Cortex-M3 processor. Trans. Chin. Soc. Agric. Mach. 2018, 49, 50–58. [Google Scholar] [CrossRef]
  22. Zhao, L.; Zhang, Z.; Wang, C.; Jian, S.; Liu, T.; Cui, D. Design of monitoring system for wheat precision seeding-fertilizing machine based on variable distance photoelectric sensor. Trans. CSAE 2018, 34, 27–34. [Google Scholar] [CrossRef]
  23. Li, Z.; Ren, Z.; Wang, Y. Design of corn precision seeding control system based on PLC. J. Agric. Mech. Res. 2020, 42, 70–74. [Google Scholar] [CrossRef]
  24. Yin, X.; Yang, T.; Jin, C.; Du, J. Development of an intelligent control system for precision corn seeding. J. Agric. Mech. Res. 2018, 40, 125–133. [Google Scholar] [CrossRef]
  25. Abdolahzare, Z.; Mehdizadeh, S.A. Real time laboratory and field monitoring of the effect of the operational parameters on seed falling speed and trajectory of pneumatic planter. Comput. Electron. Agric. 2018, 145, 187–198. [Google Scholar] [CrossRef]
  26. Abdolahzare, Z.; Mehdizadeh, S.A. Nonlinear mathematical modeling of seed spacing uniformity of a pneumatic planter using genetic programming and image processing. Neural Comput. Appl. 2018, 29, 363–375. [Google Scholar] [CrossRef]
  27. Beitian Communication Co., Ltd. BD-8953DU GNSS Receiver. Available online: http://www.sz-beitian.com/ProductsDetail?product_id=1391 (accessed on 4 June 2021).
  28. Micro-Trak Systems, Inc. USA, Vansco 740 Speed Radar. Available online: https://micro-trak.com/product/vansco-speed-sensor/ (accessed on 4 June 2021).
  29. Precision Planting Co., Ltd. MeterMax Monitor. Available online: https://cloud.precisionplanting.com/products (accessed on 4 June 2021).
Figure 1. Real-time seeding spacing measurement for seeder seeding. “ V t “: forward speed of the seeder, km/h.
Agriculture 13 00128 g001
Figure 2. GNSS NMEA protocol analysis process.
Agriculture 13 00128 g002
Figure 3. GNSS receiver speed signal simulation.
Agriculture 13 00128 g003
Figure 4. Speed radar and installation angle.
Agriculture 13 00128 g004
Figure 5. Radar speed monitoring comparison test.
Agriculture 13 00128 g005
Figure 6. The design of the software function of the monitoring system.
Agriculture 13 00128 g006
Figure 7. The verification test of the accuracy of the period time calculate algorithm.
Agriculture 13 00128 g007
Figure 8. The design of the monitor software.
Agriculture 13 00128 g008
Figure 9. Bench test equipment. Components: 1. AG Leader Technology GPS Simulator simulation software. 2. Monitoring software. 3. Stepper motor controller. 4. Stepper motor driver. 5. Encoder. 6. Stepper motor. 7. Data communication antenna. 8. Seed signal simulation microcomputer. 9. Monitoring system controller. 10. Wireless serial communication module. 11. Radar sensor signal simulation microcomputer. 12. 24 V DC power supply.
Agriculture 13 00128 g009
Figure 10. Seeder and monitoring system.
Agriculture 13 00128 g010
Figure 11. Target plan for field testing.
Agriculture 13 00128 g011
Figure 12. Simulation test monitoring results of three speed measurement methods.
Agriculture 13 00128 g012
Figure 13. The speed monitoring value of three uniform-speed seeding tests (ac): three uniform-speed seeding tests).
Agriculture 13 00128 g013aAgriculture 13 00128 g013b
Figure 14. Violin plot of monitoring values of real-time seeding spacing (ac): three uniform-speed seeding tests).
Agriculture 13 00128 g014aAgriculture 13 00128 g014b
Figure 15. The speed monitoring value of three variable-speed seeding tests (df): three variable-speed seeding tests).
Agriculture 13 00128 g015
Figure 16. Violin plot of monitoring values of real-time seeding spacing (df): three variable-speed seeding tests).
Agriculture 13 00128 g016aAgriculture 13 00128 g016b
Table 1. The frequency and period of the output signal of the speed radar at the target speed.
Speed
(km·h−1)
Fd (Hz)Time Period (s)Speed
(km·h−1)
Fd (Hz)Time Period (s)
4146.410.00683014512.450.001951
6219.620.00455316585.650.001708
8292.830.00341518658.860.001518
10366.030.00273220732.060.001366
12439.240.00227722805.270.001242
Table 2. The calculation result of the target rotation speed of the seed disc of the seed metering device.
Speed
(km·h−1)
Target   Rotation   Speed   of   Seed   Disc   ( V p ) (r·min−1)
20 cm 25 cm30 cm
413.3310.678.89
620.0016.0013.33
826.6721.3317.78
1033.3326.6722.22
1240.0032.0026.67
1446.6737.3331.11
1653.3342.6735.56
1860.0048.0040.00
2066.6753.3344.44
2273.3358.6748.89
Note: 20 cm, 25 cm, and 30 cm are three common seeding spacings.
Table 3. The calculation result of the target time between two seeds.
Speed
(km·h−1)
Target Time between Two Seeds (s)
20 cm 25 cm30 cm
40.18000.22500.2700
60.12000.15000.1800
80.09000.11250.1350
100.07200.09000.1080
120.06000.07500.0900
140.05140.06430.0771
160.04500.05630.0675
180.04000.05000.0600
200.03600.04500.0540
220.03270.04090.0491
Note: 20 cm, 25 cm, and 30 cm are three common seeding spacings.
Table 4. Pearson correlation analysis results of the speed monitoring values of the three speed measurement methods.
TestSpeed Measurement MethodGNSSRadarEncoder
RPRPRP
aGNSS1*0.956<0.010.958<0.01
Radar0.956<0.011*0.916<0.01
Encoder0.958<0.010.916<0.011*
bGNSS1*0.921<0.010.944<0.01
Radar0.921<0.011*0.887<0.01
Encoder0.944<0.010.887<0.011*
cGNSS1*0.953<0.010.969<0.01
Radar0.953<0.011*0.910<0.01
Encoder0.969<0.010.910<0.011*
Note: a, b, and c: three uniform-speed seeding tests; R: correlation coefficient; P: p-value. * Vacancy.
Table 5. Pearson correlation analysis results of the real-time seeding spacing monitoring values of the three speed measurement methods.
TestSpeed Measurement MethodGNSSRadarEncoder
RPRPRP
aGNSS1*0.995<0.010.990<0.01
Radar0.995<0.011*0.988<0.01
Encoder0.990<0.010.988<0.011*
bGNSS1*0.980<0.010.985<0.01
Radar0.980<0.011*0.951<0.01
Encoder0.985<0.010.951<0.011*
cGNSS1*0.989<0.010.994<0.01
Radar0.989<0.011*0.983<0.01
Encoder0.994<0.010.983<0.011*
Note: a, b, and c: three uniform-speed seeding tests; R: correlation coefficient; P: p-value. * Vacancy.
Table 6. Pearson correlation analysis results of the speed monitoring values of the three speed measurement methods.
TestSpeed Measurement MethodGNSSRadarEncoder
RPRPRP
aGNSS1*0.973<0.010.978<0.01
Radar0.973<0.011*0.953<0.01
Encoder0.978<0.010.953<0.011*
bGNSS1*0.959<0.010.955<0.01
Radar0.959<0.011*0.920<0.01
Encoder0.955<0.010.920<0.011*
cGNSS1*0.975<0.010.976<0.01
Radar0.975<0.011*0.946<0.01
Encoder0.976<0.010.946<0.011*
Note: a, b, and c: three variable-speed seeding tests; R, correlation coefficient; P, p-value. * Vacancy.
Table 7. Pearson correlation analysis results of the real-time seeding spacing monitoring values of the three speed measurement methods.
TestSpeed Measurement MethodGNSSRadarEncoder
RPRPRP
aGNSS1*0.988<0.010.981<0.01
Radar0.988<0.011*0.973<0.01
Encoder0.981<0.010.973<0.011*
bGNSS1*0.974<0.010.990<0.01
Radar0.974<0.011*0.960<0.01
Encoder0.990<0.010.960<0.011*
cGNSS1*0.987<0.010.991<0.01
Radar0.987<0.011*0.973<0.01
Encoder <0.01 <0.011*
Note: a, b, and c: three variable-speed seeding tests; R, correlation coefficient; P, p-value. * Vacancy.
Table 8. Information about three kinds of speed measuring equipment.
Speed Measuring EquipmentModelPurchase Price (RMB)Complexity of Use
GNSS receiverBD-8953U295Easy to install
RadarVansco 7404000Difficult to install
EncoderE6B2-CWZ3E88Relatively easy to install
Disclaimer/Publisher’s Note: The statements, opinions and data contained in all publications are solely those of the individual author(s) and contributor(s) and not of MDPI and/or the editor(s). MDPI and/or the editor(s) disclaim responsibility for any injury to people or property resulting from any ideas, methods, instructions or products referred to in the content.

