Abstract
Common bean is typically cultivated in the Mediterranean basin, an area where water scarcity could limit yield. This species has a broad range of food uses (seed or pod) and very diverse growth patterns (indeterminate or determinate), which hinders any deficit irrigation strategy. The aim of this work was to evaluate the response of the vegetative and reproductive growth stages to water stress in beans of indeterminate habit. During two consecutive Autumn seasons (2020 and 2021), two cultivars of green bean were grown in a greenhouse in Seville (Spain). The experimental design was a split plot with four replications. One of the factors considered was the cultivars Helda, and Perfección Blanca; and the other was the irrigation strategy: a control treatment, which received 100% of crop evapotranspiration, and a regulated deficit irrigation (RDI) treatment, with 30% of the water applied to the control. In both seasons, significant differences were found between cultivars, but irrigation only reduced branch development around 50%. Reproductive growth was not markedly affected, although a clear diminishing trend of approximately 25% was measured in P. Pod length and the number of non-commercial pods were not importantly impacted by irrigation in any of the cultivars. Moderate water stress conditions did not reduce the quality and quantity of the yield. Therefore, the current irrigation strategy could increase water savings with low or no yield reduction.
1. Introduction
Common bean (Phaseolus vulgaris L.) is the most important source of proteins in developing countries of the Mediterranean basin for human and animal consumption. Morocco and Turkey were among the five greatest world producers of this species in the 2020 season [1]. These countries, and others with an important production, such as Egypt or Jordan, are limited by their arid and semi-arid conditions. In addition, this species is very important for crop rotation in farms and greenhouses [2] because of its capacity to fix nitrogen and reduce the use of fertilizers. There are three main groups of common beans according to their final food uses [3]: Dry bean (seeds harvested when completely ripe), green bean (pods harvested with little or no seed development) and green-shelled beans (immature seeds). In addition, the growth pattern could also be used to establish two main groups: Indeterminate (fresh consumption) and determinate (canning use) patterns.
This species was considered drought sensitive [4,5,6], although different responses to water stress between cultivars suggested a certain drought tolerance pattern under some conditions [7]. The latter author reported changes in the partitioning of dry matter under water stress conditions, with an increase in leaves and shoots, and a decrease in pods and seeds. Drought-resistant cultivars increased the starch content in the leaves during the water stress period and the sucrose levels in the seeds at harvest [8]. However, [9] suggested that the osmotic adjustment in the bean leaves and roots did not improve the growth under water stress conditions. Irrigation strategies are commonly based on sustained deficit irrigation scheduling. Yield and biomass were usually reduced in deficit irrigation scheduling (among others: in pots experiment [3], in field experiments [5,7,10,11]), but some research in field conditions indicated that deficit irrigation produced a similar yield in fully irrigated crops, even though the vegetative growth was lower [3,12,13,14]. The results differ when the phenological stage at the timepoint when the water stress is applied was considered. Several authors reported that the yield was not reduced when a moderate water stress was applied during vegetative growth [15,16,17]. In an experiment with pots, [4] observed that the outcome was the same when the water deficit was applied at flowering and at ripening stages, although the yield diminished in both phenological stages in comparison to fully irrigated plants. Several authors reported that the yield remained the same under field conditions with water stress during flowering (autumn cycle [2] and spring cycle [3]) but it decreased significantly in pots [3] or spring cycles [2]. All these results suggest that a moderate water stress level could minimize yield loss, even though the vegetative growth becomes reduced.
Cultivars of indeterminate growth and those used for green bean production are expected to be the most difficult when considering deficit irrigation management. Pod length and number are critical in the final yield assessment of these cultivars. Reference [18] suggested that the response of bean cultivars to water stress was the sum of several components among which genetic variability could be just one factor. These latter authors suggested that the number of pods and seeds were the most sensitive yield components. Pod length was also affected by water stress conditions, but less than the pod number [3,13,19]. These responses could also be affected by the vigor of the cultivar considered. The aim of this work, therefore, was to compare the yield response to water stress conditions of two green bean cultivars of the indeterminate growth-pattern, which were different in vigor. The hypothesis of the current work is that, in the autumn cycle, the yield loss due to deficit irrigation would be minimized in both cultivars.
2. Materials and Methods
2.1. Site Description and Experimental Design
Experiments were carried out in a greenhouse of Escuela Técnica Superior de Ingeniería Agronómica (E.T.S.I.A.) of the University of Seville, Spain (37° 21’ N, 5° 56’W, 33 m. a.s.l.) from late September to late December (autumn cycle) in 2020 (25/09 to 30/12) and 2021 (24/09 to 30/12). The greenhouse was two span, with 6 × 21 m each. Radiation transmissibility in the greenhouse was estimated as 75%. Passive ventilation was provided using lateral and overhead windows. The soil available was clay loam (21.5% coarse sand; 4.5 fine sand; 42.3 silt and 31.8% clay) with pH 8.11 (measured in water) and 2.5% of organic matter content. Two green bean cultivars of indeterminate growth patter (cv Helda and cv Perfección Blanca) were studied. Cultivar Helda is a vigorous plant with large flat pods, while cultivar Perfección Blanca (P Blanca) is a plant of medium vigor, French green bean type, with shorter pods than cv Helda. Both cultivars were grown for 14 days in a seedling nursery and transplanted to soil in the same greenhouse when they developed the second true leaf. The plant density was 2 plants per m-2 with 1 m between lines and 0.5 m between plants. A drip irrigation system was used with one dropper (4 L h−1) per plant.
The experimental design was a split plot in which the main plot was a cultivar and the subplot was irrigation treatment. Each plot included three rows, a central one containing the plants to be measured, and two side rows used as borders, with 6 plants per cultivar/irrigation combination. Each one of these combinations (cultivar*irrigation) was replicated four times. Irrigation scheduling was done weekly, and the water applied was estimated based on the irrigation time and drip flow. The irrigation treatments were:
- Control. Full irrigated conditions. The applied water was determined from a daily estimate of crop evapotranspiration (ETc), which was calculated using the Kc-ETo method [20]. ETo was calculated using a radiation method [21] that required outdoor radiation data (provided by the Andalusian Network of Agroclimatic Data, La Rinconada Station, [22]) and the transmissivity of the greenhouse (estimated at 75%). Kc values were estimated from [20]. The seasonal irrigation for 202 and 2021 was 346 and 375 mm, respectively (Figure 1).
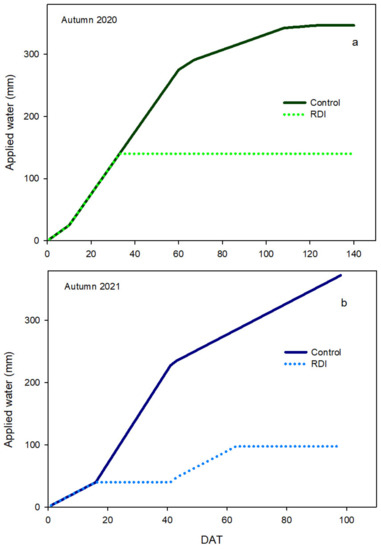 Figure 1. Applied water during the experiment in the 2020 (a) and 2021 (b) seasons. Solid lines, Control; Dash lines, RDI.
 - Regulated deficit irrigation (RDI). The RDI treatment received around 30% of the water applied in the Control treatment, that is 140 mm in the 2020 season (40%) and 98 mm during 2021 (26%) (Figure 1). In both seasons, irrigation started at the beginning of the experiment to ensure a successful transplant and it was stopped a few days later (33 days after transplanting (DAT) in 2020 and 16 DAT in 2021). Only in the 2021 season was there a second irrigation period (58 mm applied water) from the first pod setting (around DAT 42) until the beginning of harvest (DAT 63). During the irrigation periods, the amount of water applied in RDI was equal to that of the Control treatment.
2.2. Measurements
Climatic conditions and soil moisture in the greenhouse were measured continuously using a datalogger (CR1000, Campbell Sci, Shepshed, UK). Temperature and relative humidity (at 1 m height) were measured using a sensor ATMOS-14 (Meter, Pullman, WA, USA) inside a radiation shield. Soil moisture was measured at a 0.2 m depth around 0.1 m distance from the drip using TEROS-12 sensors (Meter, Pullman, WA, USA, minimum values 0.00 ± 0.03 m3 m−3). These measurements were obtained every 10 min and hourly and daily averages were calculated (the latter only from climatic measurements). Soil moisture data were used to estimate the relative extractable water (REW, [23]) using the Equation (1):
where:
REW = (θ − θmin)/(θmax − θmin)
θ: Actual soil water content
θmin: Minimum soil water content measured in the experiment (0.1 m3 m−3)
θmax: Soil water content at field capacity. Estimated as approximately 0.21 m3 m-3
Water relations were characterized using the leaf water potential and net photosynthesis. Leaf water potential was measured at mid-day in fully expanded leaves in the sun using a Scholander pressure chamber (model 1000, PMS, Albany, OR, USA) technique [24] in every treatment replicate. The Stress Integral (SI) was calculated from leaf water potential data according to [25]:
where: SI is the stress integral
SI = |∑ (LW – c) ∗ n |
LW is the average midday leaf water potential for any interval
c is the most positive leaf water potential value measured during the season
n is the number of days in the interval.
Measurements of net photosynthesis were carried out at the same time and in the same type of leaves than leaf water potential in every treatment replicate using an infrared gas analyzer (CI-340, CID BioScience, Camas, WA, USA).
Vegetative growth was described using plant height, number of pods before first harvest and plant development (lateral branch growth) data. Height was measured weekly in three plants for every treatment replicate. Number of pods was counted only in the 2020 season on three dates (DAT 34, 41, 48) before the first day of harvest in three plants per every treatment replicate. Plant canopy development was measured as the percentage of plant that covered a vertical square of 2 m2 only in the 2021 season. One white polystyrene sheet of 1 m2 square was placed behind a control line, first at the soil surface and then raised at 1 m height. A picture was taken in each position using a mobile phone, and the percentage of plant cover was estimated using Canopeo (a free software of the Oklahoma State University [26]).
Plants in the central row (3 plants) were harvested weekly when pods had reached a commercial size. The yield of each replicate (3 plants) was weighed, and the pods were classified into commercial or non-commercial. For the non-commercial classification, only the shape was considered. When over 30% of the pod length was curved, the pods were considered as “hook pod” and non-commercial (Figure A1). Only the length of the commercial pods were measured.
3. Results
3.1. Water Relations and Climatic Conditions
The temperature pattern was slightly different between seasons (Figure S1). During the 2020 season, the maximum temperature progressively decreased from 30 °C at the beginning of the experiment until around 15 °C at the end (Figure S1a). Conversely, the maximum temperature was steady during the experiment in the 2021 season, with a narrow range of variations between 24–32 °C (Figure S1b, there were no data from DAT 43 to 60). These differences were similar for the minimum temperature. In the 2020 season, minimum temperature varied from 5 to 16 °C most the time until DAT 80, when it decreased to values around 0 °C (Figure S1a). During the 2021 season, minimum temperatures were greater than 10 °C during the entire experimental period, with most values between 10–15 °C (Figure S1b).
The pattern of reference evapotranspiration (ETo) was similar to that of maximum temperature described above. Over the 2020 season, ETo decreased throughout the experiment with maximum values at the beginning (around 5 mm day−1) falling to approximately 2 mm day−1 (Figure S2a). The range of ETo values variations was greater during this season. Conversely, the range of variations was narrower during 2021 and the pattern was different as well (Figure S2b). While there was also a decreasing trend in 2021, this was smoother than in 2020, and most the time, ETo data were between 2 to 3 mm day−1. Only at the end of the season was there a sharp reduction to values below 2 mm day−1 (Figure S2b).
Irrigation scheduling caused clear changes in the soil moisture pattern in both seasons (Figure 2).
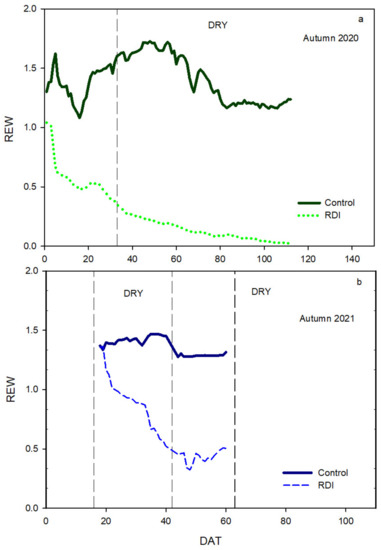
Figure 2.
Pattern of soil moisture (REW) at 20 cm depth during the 2020 (a) and 2021 (b) seasons. Solid lines, Control, Dash lines, RDI. The word “dry” indicates the period without irrigation.
Control measurements suggested that water in the soil was not limited in any of the seasons because REW was higher than one and did not show a decrease. However, RDI presented a seasonal pattern of continuous decrease from the beginning of the experiment. Such a decrease was sharp during the first days, but it slowed down 40–50 days after transplanting in both seasons. The irrigation period at the end of the 2021 season did not cause a change in the REW pattern in comparison to 2020, when RDI had irrigation only at the beginning.
Leaf water potential values were very highly variable in both seasons (Figure 3). Only in the 2020 season were differences between cultivars significant on DAT 13 and 41.
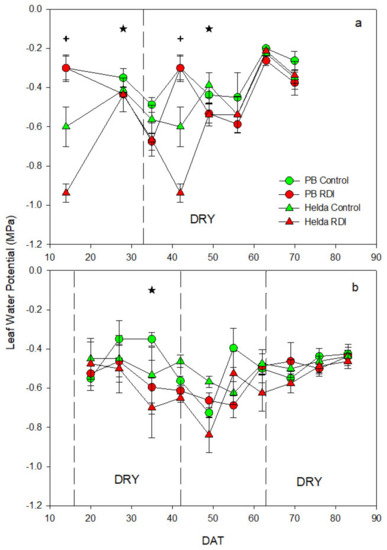
Figure 3.
Pattern of midday leaf water potential during the 2020 (a) and 2021 (b) seasons. Each point is the average of 4 measurements. Vertical lines represent the standard error. Triangles, cv Helda (upside down, Control; upright, RDI); Circles, cv Perfeccion Blanca (red, Control; orange, RDI). Asterisks indicate significant differences on that date by irrigation treatment (p < 0.05) and crosses are used for differences between cultivar (p < 0.05). The word “dry” indicates a period without irrigation.
In both seasons, the RDI treatment tended to have more negative values than Control until mid-experiment (around DAT 50); this trend was clearer in cv Helda than P Blanca. Such differences were significant only on a few dates (DAT 28 and 49, 2020; DAT 35, 2021). After DAT 50, all treatments were almost equal in leaf water potential across both seasons and cultivars. Minimum values were around −0.9 MPa and always observed in Helda RDI. The Stress Integral (SI) was greater in the 2020 season than in the 2021 one (Figure 4) and it was only significantly different in 2020 between cultivars, with greater values in Helda than in P Blanca. (Figure 4). RDI treatment tended to have greater SI values in both cultivars and seasons, and they were around 50% higher than Control. In both seasons, the RDI of cv Helda showed the maximum SI data.
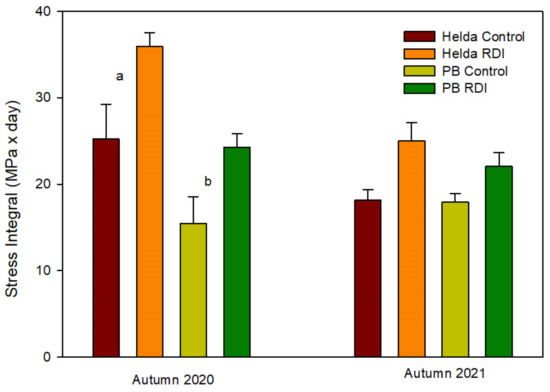
Figure 4.
Stress Integral in the 2020 and 2021 seasons. Each bar is the average of four measurements and vertical lines represent the standard error. ‘Helda’ (Control, brown and RDI, orange) and ‘Perfección Blanca’ (Control, light green and RDI, dark green). Different letters indicate significant differences between cultivars.
The different irrigation treatments did not cause any significant differences in net photosynthesis in any of the seasons (Figure 5).
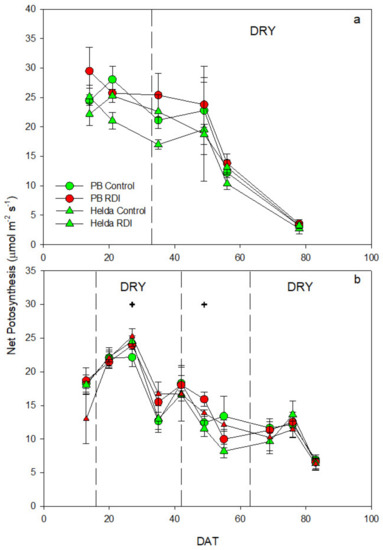
Figure 5.
Pattern of midday leaf photosynthesis during the 2020 (a) and 2021 (b) seasons. Each point is the average of four measurements. Vertical lines represent the standard error. Triangles, cv Helda (upside down, Control; upright, RDI); Circles, cv Perfeccion Blanca (red, Control; orange, RDI). Crosses indicate significant differences between cultivars on that date. The word “dry” indicates a period of no irrigation.
Despite this, differences between cultivars did occur on two dates in the 2021 season, although they did not present a clear pattern (Figure 5b). The effect of the cultivar was different on each date, and thus the details were not conclusive. Data were lower in the 2021 season than in the 2020 one in all replicates. The seasonal pattern was similar, with a clear decreasing trend along the experiment, from 25 μmol m−2 s−1 at the beginning down to values below 5 μmol m−2 s−1 at the end. Such reduction in net photosynthesis occurred around DAT 50, the same date when the leaf water potential was almost equal in all replicates.
3.2. Vegetative Growth
The pattern of plant height development was considerably different between cultivars but the differences ended on approximately the same date (Figure 6). Important differences between cultivars were found in both seasons from the beginning through to 30 DAT (with cv P Blanca being significantly shorter than cv Helda). From around DAT 30, both cultivars reached the same height (2.2 m), because this was the maximum available in the greenhouse. The effect of irrigation treatments was only significant at the beginning of the experiment in the 2020 season. However, Helda RDI grew more slowly than Helda Control in 2021 (Figure 6b).
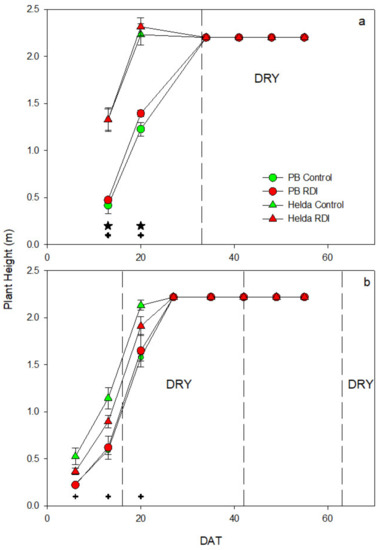
Figure 6.
Pattern of plant height during the 2020 (a) and 2021 (b) seasons. Each point is the average of four measurements. Vertical lines represent the standard error. Triangles, cv Helda (upside down, Control; upright, RDI); Circles, cv Perfeccion Blanca (red, Control; orange, RDI). Asterisks (irrigation) and crosses (cultivar) indicate significant differences on those dates (p < 0.05). The word “dry” indicates a period without irrigation.
Conversely, canopy development was heavily impacted in the 2021 season (Figure 7). There were important differences between cultivars with greater vegetative growth of cv Helda than cv P Blanca from DAT 42. In all replicates, the seasonal pattern was sigmoidal, with the steepest slope from DAT 42 and maximum values around DAT 50–60. In both cultivars, RDI presented significantly lower rates of development than the Control (from DAT 42) and the canopy development stopped earlier.
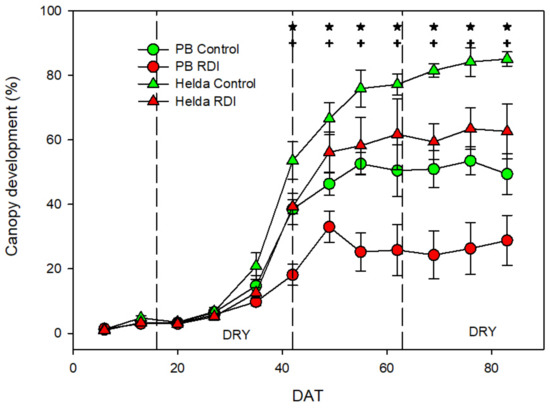
Figure 7.
Pattern of canopy development in the 2021 season. Each point is the average of four measurements. Vertical lines represent the standard error. Triangles, cv Helda (upside down, Control; upright, RDI); Circles, cv Perfeccion Blanca (red, Control; orange, RDI). Asterisks (irrigation) and crosses (cultivar) indicate significant differences on that date (p < 0.05). The word “dry” indicates a period without irrigation.
3.3. Yield and Yield Components
The observed differences in vegetative growth did not affect the number of pods in the 2020 season (Figure S3). On the three sample dates before the beginning of harvest, no significant differences between cultivars or irrigation treatments were found. On the two first dates (34 and 41 DAT) pod numbers were low, the greatest one being on the last day sampled, when harvesting started. This pattern was similar between cultivars and irrigation treatments.
Pod length at harvest was considerably different between cultivars, with shorter length in cv P Blanca than in cv Helda (Figure 8). The size pattern was not consistent across the experiments, with changes of approximately 20% between extreme sizes on different sample dates in both cultivars. Cv P Blanca produced more similarly-sized pods during both seasons than cv Helda, but in both cultivars the pods were classed as commercial. No effect of irrigation treatments was found in this parameter, and sizes were almost equal in both seasons across both water managements.
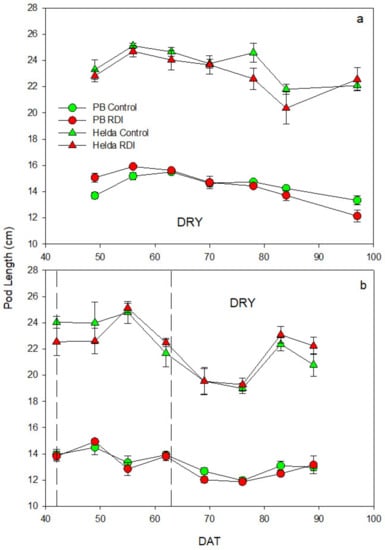
Figure 8.
Pattern of pod length over the 2020 (a) and 2021 (b) seasons. Each point is the average of four measurements. Vertical lines represent the standard error. Triangles, cv Helda (upside down, Control; upright, RDI); Circles, cv Perfeccion Blanca (red, Control; orange, RDI). No significant differences were found between irrigation treatments. The word “dry” indicates a period of no irrigation.
Cumulative yield was substantially different between cultivars in both seasons (Figure 9, Table 1). In the experiment of the 2020 season, the yield was greater in both cultivars than in 2021. The seasonal pattern was similar between cultivars and irrigation treatments, with a continuous increase during the experiments from DAT 50 (2020 season) or 40 (2021 season). Differences between cultivars were significant on most of the harvest dates in both seasons. However, the irrigation treatment did not affect the yield considerably in any of the replicates. Only in 2020 did cv P Blanca tend to have a lower yield in RDI than in Control by the end of the experiment. In that season, the reduction in yield was around 25% in cv P Blanca, while there was no reduction in cv Helda (Table 1). Those yield decreases due to irrigation were lower in 2021 in cv P Blanca, around 15%, although slightly greater in cv Helda (9 %), but were still not significant. There were no major differences in the percentage of non-commercial pods between cultivars and irrigation treatments (Table 1). The main defect was “hooked” pods (Figure A1) which were observed more frequently at the end of the seasons (data not shown). Irrigation water productivity was significantly greater in RDI than in Control in both seasons and cultivars (Table 1). RDI treatments reached, at least, double water productivity than Control. Such differences were greater in 2021 (around four times) than in 2020 (around two-three times). The greatest water productivity was always in cv Helda, with a maximum of 55.7 kg m−3 in the 2021 season.
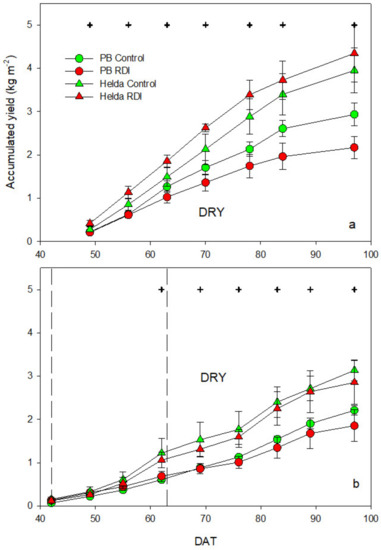
Figure 9.
Pattern of accumulated yield during the 2020 (a) and 2021 (b) seasons. Each point is the average of four measurements. Vertical lines represent the standard error. Triangles, cv Helda (upside down, Control; upright, RDI); Circles, cv Perfeccion Blanca (red, Control; orange, RDI). Crosses indicate significant differences on that date (p < 0.05). No important differences were found between irrigation treatments. The word “dry” indicates a period without irrigation.

Table 1.
Summary of yield, water efficiency and fruit quality during two seasons *.
4. Discussion
Yield was not affected by the irrigation treatments (Figure 9; Table 1), although harvesting occurred in a drought period (Figure 1 and Figure 2). The level of water stress was moderate, with no major differences in leaf water potential (Figure 3) and net photosynthesis (Figure 5), but a clear seasonal contrast in the stress integral (Figure 4) and plant development (Figure 7). The effect of water stress on bean yield was not clear in the scientific literature because of the differences between cultivars in drought tolerant and final harvestable products. In dry bean cultivars, where complete ripening is needed before harvest, the reduction in vegetative growth did not affect final yield under field conditions in the autumn cycle [3]. In the spring cycle, reduction on applied water commonly reduced yield [5,11,12]; however, some works reported no significant differences between crop pan coefficient 1.25, 1 and 0.75 [14] or under a moderate water stress [12]. In green bean cultivars, the autumn growth cycles produced major yield differences [2,19], although the crop pan coefficient 0.8 decreased the pod length, which could reduce the yield quality [19]. However, a drought period at flowering during the spring cycle also reduced the yield [2].
The effects on yield were reported as dependent on both the water stress level and the phenological stage, which is the moment when deficit occurred [27]. In the current work, the determination of a phenological stage is extremely difficult because the crop has an indeterminate growth pattern. However, the development could be segmented using plant height (Figure 6) and branch development (Figure 7). The former was less affected by water stress, likely due to the fact that the growth in height was fast and occurred under conditions of mild water deficit. Differences between cultivars were related to their vigor, which is greater in cv Helda than in cv P Blanca. Conversely, branch development occurred during the main period of water deficit, but the response in relation to yield was different depending on the cultivar. Cv Helda, a vigorous cultivar, showed a considerably reduced plant development (Figure 7), although yield was not affected (Figure 9, Table 1). However, cv Perfección Blanca, a significantly less vigorous plant (Figure 6 and Figure 7), presented a stronger reduction in yield with a similar decrease in growth (Figure 9, Table 1). Therefore, vegetative growth reduction was not strongly related to yield and depended on the cultivar considered. Several authors reported important differences in growth, but not in yield under moderate water stress conditions [2,3,28]. Indeed, in determinate-growth cultivars, some authors suggested that moderate water stress conditions before flowering did not affect yield [15,16,17].
The period of plant development, after the maximum height is reached, was coincident with the most important part of flowering and pod development (Figure S3 and Figure 8). No major effects of irrigation treatment were measured in pod length and number of pods on the sample dates. The former was almost equal in both cultivars in relation to irrigation management. The multiple sampling dates during the harvest period of this yield component in both seasons (Figure 8) suggest that the reduction in yield was not linked to pod length. However, sampling dates of the number of pods were limited to the beginning of harvest and only took place in one season (Figure S3), which might suggest that this yield component could be reduced during the harvest period, after the moment where these measurements were taken and later in the season. Pod length differed between different cultivars and it is an important indication of the yield quality. Therefore, a lower sensitivity to this latter component would allow a successful reduction of irrigation with no great impact on the grower’s profit. Yield reduction in green bean has been related to the decrease in the number of pods [4,29], pod length [5] and the increase in non-commercial pods [30].Most of the irrigation works did not consider the phenological stage when the water restriction is applied. Irrigation restrictions during flowering did not affect yield and reproductive biomass in the autumn cycles [2] and was not different to having a drought period during ripening [4].However, scientific literature reported that the pod number per plant presented a stronger reduction than pod length due to irrigation restrictions [3,13,19]. Moreover, pod length was only reduced when the water stress was performed at flowering but not at the vegetative stage [3]. The number of pods was strongly reduced during both periods in the pot experiment but not under field conditions [3].
5. Conclusions
Strong irrigation restriction during the autumn cycle affected plant development but did not reduce substantially the yield. In these two indeterminate cultivars, two growth parameters were considered: Plant height and plant development. Plant height developed rapidly with only a small amount of irrigation necessary to reach maximum height with no significant delay. Plant development could be more heavily affected (20% of reduction) with no clear decrease in the amount and quality of the yield. This parameter mainly included the branch growth that covers the space between plants, and it is where the pods grew. Such reduction in plant development could affect the number of pods, but in a way that could be acceptable from a yield and water productivity perspective. However, differences in plant vigor could affect the yield response. A trend to a greater reduction in yield was observed in the less vigorous cultivar (cv Perfección Blanca). The reduced irrigation treatment did not affect pod length in any of the cultivars, which produced the same yield quality as a fully irrigated treatment. A larger increase of water productivity of RDI strongly suggests that the autumn cycle could be adequate in locations with severe water scarcity.
Supplementary Materials
The following supporting information can be downloaded at: https://www.mdpi.com/article/10.3390/agriculture13010046/s1, Figure S1: Maximum and minimum temperature pattern inside the greenhouse along the experiment in 2020 (a) and 2021 (b) seasons. Figure S2. Potential evapotranspiration (ETo) inside the greenhouse along the experiment in 2020 (a) and 2021 (b) seasons. Figure S3. Number of pods on three different sample dates during the 2020 season. Each bar is the average of 4 measurements and vertical lines represent the standard error. Cv ‘Helda’ (Control, brown and RDI, orange) and cv ‘Perfección Blanca’ (Control, light green and RDI, dark green). No significant differences were found
Author Contributions
Conceptualization, M.C., M.J.M.-P.; A.M.; methodology, M.A.-M.; M.C., M.J.M.-P., A.M., P.C.-V., N.M.-Z.; formal analysis, M.A.-M.; M.C., A.M., N.M.-Z.; data curation, M.A.-M.; M.C., M.J.M.-P., A.M., N.M.-Z.; writing—original draft preparation, M.A.-M.; M.C., M.J.M.-P.; writing—review and editing, M.A.-M.; M.C., A.M., P.C.-V.; supervision, M.C., A.M.; project administration, M.C., N.M.-Z. All authors have read and agreed to the published version of the manuscript.
Funding
This research received no external funding.
Data Availability Statement
Not available.
Conflicts of Interest
The authors declare no conflict of interest.
Appendix A

Figure A1.
Harvested pod of cv Helda (a) and cv P Blanca (b). In both pictures, pods on the right of the ruler were considered non-commercial (hooked pod).
Figure A1.
Harvested pod of cv Helda (a) and cv P Blanca (b). In both pictures, pods on the right of the ruler were considered non-commercial (hooked pod).

References
- FAOSTAT. 2022. Available online: https://www.fao.org/faostat/es/#data/QCL (accessed on 15 November 2022).
- González, A.M.; Bonachela, S.; Fernández, M.D. Regulated deficit irrigation in Green vean and watermelon greenhouse crops. Sci. Hortic. 2009, 122, 527–531. [Google Scholar] [CrossRef]
- Campos, K.; Schwember, A.R.; Machado, D.; Ozores-Hampton, M.; Gil, P.M. Physiological and yield responses of Green-shelled beans (Phaseolus vulgaris L.) grown under restricted irrigation. Agronomy 2021, 11, 562. [Google Scholar] [CrossRef]
- Boutraa, T.; Sanders, F.E. Influence of water stress on grain yield and vegetative growth of two cultivars of bean (Phaseolus vulgaris L.). J. Agron. Crop Sci. 2001, 187, 251–257. [Google Scholar] [CrossRef]
- Sezen, S.M.; Yazar, A.; Canbolat, M.; Eker, S.; Çelikel, G. Effect of drip irrigation management on yield and quality of field grown green beans. Agric. Water Manag. 2005, 71, 243–255. [Google Scholar] [CrossRef]
- Abd El-Aal, H.; El-Hwat, N.; El-Hefnawy, N.; Medany, M. Effect of sowing dates, irrigation levels and climate change on yield of common bean (Phaseolus vulgaris L.). Am.-Eurasian J. Agric. Environ. Sci. 2011, 11, 79–86. [Google Scholar]
- Soureshjani, H.K.; Nezami, A.; Kafi, M.; Tadayon, M. The effect of deficit irrigation on dry matter partitioning, mobilitation and radiation use efficiency of common bean (Phaseolus vulgaris L). Commun. Soil Sci. Plant Anal. 2019, 51, 307–326. [Google Scholar] [CrossRef]
- Cuellar-Ortiz, S.; Arrieta-Montiel, M.P.; Acosta-Gallegos, J.; Covarrubias, A.A. Relationship between carbohydrate partitioning and drought resistance in common bean. Plant Cell Environ. 2008, 31, 1399–1409. [Google Scholar] [CrossRef]
- Wullschleger, S.D.; Oosterhuis, D.M. Osmotic adjustment and the growth response of seven vegatables crops following water deficit stress. HortScience 1991, 26, 1210–1212. [Google Scholar] [CrossRef]
- Bourgault, M.; Madramootoo, C.A.; Webber, H.A.; Stulina, G.; Horst, M.G.; Smith, D.L. Effects of deficit irrigation and salinity stress on common bean (Phaseolus vulgaris L.) and mungbean (Vigna radiata (L.) Wilczek) grown in a controlled environment. J. Agron. Crop Sci. 2010, 196, 262–272. [Google Scholar]
- Soureshjani, H.K.; Nezami, A.; Kafi, M.; Tadayon, M. Responses of two common bean (Phaseolus vulgaris L.) genotypes to deficit irrigation. Agric. Water Manag. 2019, 213, 270–279. [Google Scholar] [CrossRef]
- Webber, H.A.; Cadramootoo, C.A.; Bourgault, M.; Horst, M.G.; Stulina, G.; Smith, D.L. Water use efficiency of common bean and green gram grown using alternate furrow and deficit irrigation. Agr Water Manag. 2006, 86, 259–268. [Google Scholar] [CrossRef]
- Saleh, S.; Liu, G.; Liu, M.; Ji, Y.; He, H.; Gruda, N. Effect of irrigation on growth, yield and chemical composition of two Green bean cultivars. Horticulturae 2018, 4, 3. [Google Scholar] [CrossRef]
- Süheri, S.; Hussein-Hussein, N.M.; Kurtar, E.S.; Yavuz, N.; Dal, Y. Determination of yield and quality of different snap bean varieties under deficit irrigation. JOTAF 2020, 17, 252–263. [Google Scholar] [CrossRef]
- Hsiao, T.C. Plant responses to water stress. Annu. Rev. Plant. Physiol. 1973, 24, 519–570. [Google Scholar] [CrossRef]
- Kirda, C. Deficit irrigation scheduling based on plant growth stages showing water stress tolerance. In Deficit Irrigation Practice Water Report 22; FAO: Rome, Italy, 2002; pp. 3–10. [Google Scholar]
- Loveys, B.R.; Stoll, M.; Davies, W.J. Physiological approaches to enhance water use efficiency in agriculture: Exploiting plant signaling in novel irrigation practice. In Water Use Efficiency in Plant Biology; Bacon, M.A., Ed.; Blackwell Publishing Ltd.: Victoria, Australia, 2004; pp. 113–141. [Google Scholar]
- Ramirez-Vallejo, P.; Kelly, J.D. Traits related to drought resistance in common bean. Euphytica 1998, 99, 127–136. [Google Scholar] [CrossRef]
- Abuarab, M.E.; Hafez, S.M.; Shahein, M.M.; Hassan, A.M.; El-Sawy, M.B.; El-Mogy, M.M.; Abdeldaym, E.A. Irrigation scheduling for green bean grown in clay loam soil under drip irrigation system. Water 2020, 46, 573–582. [Google Scholar]
- Allen, R.G.; Pereira, L.S.; Raes, D.; Smith, M. Crop Evapotranspiration Guidelines for Computing Crop Water Requirements FAO Irrigation and Drainage Paper 56; FAO: Rome, Italy, 1998. [Google Scholar]
- Bonachela, S.; González, A.M.; Fernández, M.D. Irrigation scheduling of plastic greenhouse vegetable crops based on historical weather data. Irrig. Sci. 2006, 25, 53–62. [Google Scholar] [CrossRef]
- SIAR. Available online: https://eportal.mapa.gob.es/websiar/SeleccionParametrosMap.aspx?dst=1 (accessed on 15 November 2022).
- Fernádez, J.E.; Díaz-Espejo, A.; Infante, J.M.; Durán, P.; Palomo, M.J.; Chamorro, V.; Girón, I.F.; Villagracía, L. Water relations and gas exchange in olive trees under regulated deficit irrigation and partial rootzone drying. Plant Soil 2006, 284, 27–291. [Google Scholar]
- Scholander, P.F.; Hammel, H.T.; Bradstreest, E.A.; Hemmingsen, E.A. Sap pressure in vascular plants. Science 1965, 148, 339–346. [Google Scholar] [CrossRef]
- Myers, B.J. Water stress integral a link between short term stress and longterm growth. Tree Physiol. 1988, 4, 315–323. [Google Scholar] [CrossRef]
- Patrignani, A.; Ochsner, T.E. Canopeo: A powerful new tool for measuring fractional green canopy cover. Agron. J. 2015, 107, 2312–2320. [Google Scholar] [CrossRef]
- Hsiao, T.C. Measurements of plant water status. Chap. 9. In Irrigation of Agricultural Crops. Agronomy Monograph, 30; Steward, B.A., Nielsen, D.R., Eds.; American Society of Agronomy: Madison, WI, USA, 1990; pp. 243–279. [Google Scholar]
- El-Noemani, A.A.; El-Zeiny, H.A.; El-Gindy, A.M.; El-Sahhar, E.A.; El-Shawadfy, M.A. Performance of some bean (Phaseolus vulgaris L.) varieties under different irrigation systems and regimes. Aust. J. Basic Appl. Sci. 2010, 4, 6185–6196. [Google Scholar]
- Behboudian, M.H.; Ma, Q.; Turner, N.C.; Palta, J.A. Reactions of chickpea to water stress: Yield and seed composition. J. Sci. Food Agric. 2001, 81, 1288–1291. [Google Scholar] [CrossRef]
- Beshir, H.M.; Bueckert, R.; Tar’an, B. Effect of temporary drought at different growth stages on snap bean pod quality and yield. Afr. Crop Sci. J. 2016, 24, 317–330. [Google Scholar] [CrossRef][Green Version]


Disclaimer/Publisher’s Note: The statements, opinions and data contained in all publications are solely those of the individual author(s) and contributor(s) and not of MDPI and/or the editor(s). MDPI and/or the editor(s) disclaim responsibility for any injury to people or property resulting from any ideas, methods, instructions or products referred to in the content. |
© 2022 by the authors. Licensee MDPI, Basel, Switzerland. This article is an open access article distributed under the terms and conditions of the Creative Commons Attribution (CC BY) license (https://creativecommons.org/licenses/by/4.0/).