Article

Bioactive Compounds of Endemic Medicinal Plants (Cuphea spp.) Cultured in Aquaponic Systems: A Short Study

by
Priscila Sarai Flores-Aguilar
1,
Amanda Kim Rico-Chávez
1,
Eloy Rodriguez-deLeón
2,
Humberto Aguirre-Becerra
1,
Sergio Aurelio Zamora-Castro
3 and
Genaro Martín Soto-Zarazúa
1,*
1
Facultad de Ingeniería Campus Amazcala, Universidad Autónoma de Querétaro, El Marqués 76265, Mexico
2
Facultad de Química, Universidad Autónoma de Querétaro, Cerro de las Campanas, Querétaro 76010, Mexico
3
Facultad de Ingeniería, Construcción y Hábitat, Universidad Veracruzana, Boca del Río 94294, Mexico
*
Author to whom correspondence should be addressed.
Agriculture 2023, 13(10), 2018; https://doi.org/10.3390/agriculture13102018
Submission received: 9 August 2023 / Revised: 8 October 2023 / Accepted: 11 October 2023 / Published: 18 October 2023
(This article belongs to the Special Issue Abiotic Stresses, Biostimulant and Plant Activity—Series II)

Abstract

:
Aquaculture waters can be associated with the modification of the phytochemical profile in plants when they are used for irrigation; thus, Integrated Agri-Aquaculture Systems such as aquaponics represent a strategy to improve the bioactive content of medicinal plants. This study aimed to analyze the effect caused by cultivation using aquaponics on the modification of the content of bioactive compounds such as phenols, flavonoids, and apigenin in Cuphea hyssopifolia and Cuphea cyanea irrigated with Cyprinus carpio waters. The results of each culture method showed unique differences (p ≤ 0.05) in the concentrations of bioactive compounds and antioxidant activity in Cuphea spp. For C. hyssopifolia in aquaponics, 76% (61.08 ± 7.2 mg g−1 GAEq) of phenols and 50% (5.62 ± 0.5 mg g−1 CAEq) of flavonoids were maintained compared to 20% (16.99 ± 0.4 mg g−1 GAEq) of phenols and 76.5% (8.19 ± 1.6 mg g−1 CAEq) of flavonoids in conventional culture. For C. cyanea in aquaponics, 91% (15.36 ± 0.8 mg g−1 GAEq) of phenols and 47% (3.52 ± 0.6 mg g−1 CAEq) of flavonoids were maintained compared to 24% (14.11 ± 1.3 mg g−1 GAEq) of phenols and 82% (1.79 ± 0.1 mg g−1 CAEq) of flavonoids in conventional culture. An increase of more than 60% in the apigenin content of C. hyssopifolia in aquaponics confirms a eustress effect related to the use of organically enriched waters. The results indicate that aquaponics can promote the biostimulation/elicitation of medicinal plants and increase their bioactive compounds, but this effect does not occur in the same way between species.

1. Introduction

Aquaponics is part of a broader area, Integrated Agri-aquaculture Systems (IAAS), in which joins two of the most productive sectors in the field: aquaculture and hydroponics [1]. According to [2,3] vegetables produced in aquaponic systems show greater fruiting than those grown in hydroponics systems. In this way, aquaponics directly and positively impacts some goals of the 2030 agenda, such as zero hunger, good health and well-being, and climate action, because it increases productivity and protein diversification, and decreases waste of nutrients and water [4]. Moreover, aquaponic systems are an alternative for sustainable and organic production because they impact the environment to a lesser extent compared to aquaculture and traditional hydroponics [5]. Aquaculture water contains a wide variety of nutrients such as metabolic waste from fish produced via respiration and found in urine, faeces, and unconsumed dissolved food, dissolved organic molecules (DOM), and microorganisms such as bacteria, fungi, and protozoa [6]. This organically enriched water (OEW) can help activate secondary metabolism, defences, and plant growth when used as irrigation, and can consequently increase the quality of vegetables by modifying their phytochemical profile [7,8]. According to [9], the antioxidant activity of aquaponic herbal crops (i.e., Ocimum basilicum and Petroselinum crispum) was significantly higher than that of crops grown organically in soil. [10] found the same effect in lowering blossom-end rot symptoms (BER); this was related to the microorganism and the DOM in the water acting as biostimulants in the crops. Therefore, aquaponics cultivation presents an alternative to biostimulation for enhancing the nutritional value and stress tolerance of species with a high content of bioactive compounds, such as medicinal plants.
Cuphea is a plant genus with approximately 260 species that has a significant role in Mexican ethnopharmacology [11,12] The species in this genus are known due to their content of medium-chain fatty acids in seeds, such as capric, lauric, and myristic acid, a profile comparable to that of Cocos nucifera [13,14]. However, the most significant potential is in its content of phytochemicals associated with antimicrobial, antiviral, and cytotoxic activities [15]. Other popular uses range from treating dermatological conditions like skin tumours, pain, inflammation, and wounds, to diarrhoea and stomach infections [16]. One promising species is Cuphea hyssopifolia, also called Falso brezo (false heather), which is a small shrub that does not reach more than 60 cm and is also commonly used for ornamental purposes [15]. Its content of tannins, flavonoids, and phenols has been described to some extent, along with its cytotoxic and antioxidant activities [17]. Another endemic species of North America, but less described, is Cuphea cyanea. It is popular for ornamental purposes as a vine, with flowers resembling Christmas lights, thanks to which it received its colloquial name Serie de Luz (light series). Descriptions of its secondary metabolism are limited. Similarly, the use of aquaponic systems to grow herbaceous medicinal plants, including identifying, quantifying, or characterising their phenolic contents and antioxidant activity, is scarce. According to this evidence, this article aims to analyze the effect of an Integrated Agri-aquaculture System with Koi carp (Cyprinus carpio) on the content of bioactive compounds such as phenols, flavonoids, and apigenin, and on the antioxidant activity of two medicinal plants, Cuphea hyssopifolia, and Cuphea cyanea.

2. Materials and Methods

2.1. Experiment Setup

The experiment was carried out in facilities at the Faculty of Engineering, Campus Amazcala of the Universidad Autónoma de Querétaro, and lasted 90 days (that is, 23 days for the acclimatization of the carp within the system, 7 days for acclimatization of both plants species in the IAAS, and the last 60 days for testing the integration of Koi with each medicinal plant in an independent IAAS). The independent aquaponic systems were installed with their controls in conventional cultivation under the same controlled conditions within a 504 m2 multi-tunnel-type greenhouse. The experiment was set according to a full factorial design with the species and the cultivation method as independent variables. Three biological replicates were processed for the measurements of bioactive compounds, and three technical replicates were performed for each assay. The experimental unit consisted of 12 plants. Table 1A shows the climate conditions of the experiment.
As an initial step towards exploring the biostimulant properties of OEW in the production of biocompounds with IAAS, a vertical closed system was considered. This system was coupled with a nutrient film technique (NFT) unit without a growing medium for each plant species, as it is considered the most efficient hydroponic system [18]. For this approach, in place of a biofilter, biofilms were allowed to form on the available surfaces of plastic tubes including plant roots.
A metallic structure (2 m × 1 m) was used to support the system, which consisted of three plastic tubes to support 12 plants per level, for a total of 36 plants per system. Two submersible pumps (30 W; 1 Hp; 56 L min−1) were used, one in each IAAS, and they were left on from the beginning until the end of the experiment (90 days). Two fish tanks (40 cm × 40 cm × 100 cm) were filled to 160 L each. Oxygenation was carried out by returning the water to the tank via gravity. The flow within the NFT tubes of the system was 56 cm3 s−1. The three tubes together returned a total volume of 1.73 cm3 s−1, which is in the range of tolerance [19]. A 6% daily replacement with fresh water was carried out, according to [20].
The electric conductivity (EC), pH, and dissolved oxygen (DO) were monitored twice a week (Table 1B). The DO of the water in the systems was determined with a multiparametric meter HQ40D (RYE-HACH, CDMX, México) with the sensor LDO101-03 (°C and DO) and EC (series-H, °C, and µS cm−1). The pH was measured with the waterproof pH tester 10 sensor (Thermo Fisher Scientific Inc., EUTECH, CDMX, México). An initial analysis of the water quality (ammonium, nitrate, nitrite, phosphorus, and potassium) was carried out with a DR/6000 spectrophotometer (RYE-HACH, CDMX, México) using the Hach 380 N method. The 23-day baseline for recirculation is described in Table 2.

2.1.1. Aquatic Species

An ornamental species at a juvenile stage, Cyprinus carpio L. var. Koi was obtained from a local provider. Commercial food was used with crude protein 31.0%, crude fat 5.0%, crude fibre 2.0%, moisture 7.0%, phosphorous 0.9%, and ascorbic acid (Vit. C) 100 mg kg−1. The Koi carps were fed at a daily rate of 4% of the total biomass of each tank (78 g) divided into two servings per day described by [21].

2.1.2. Plant Species

The plants of C. hyssopifolia and C. cyanea were obtained from the greenhouse Red Viverista in Cuernavaca Morelos, México from the same batch. MSc Yolanda Pantoja carried out the authentication of the species endorsed by Dr Luis Hernandez-Sandoval, herbal curator, in the QMEX herbarium of the Faculty of Natural Sciences of the Universidad Autónoma de Querétaro, México. These species are not listed under Official Mexican Standard NOM-059-SEMARNAT-2010; (Available online https://www.profepa.gob.mx (accessed on 8 August 2023)) as threatened or subject to special protection. The authentication code for Cuphea hyssopifolia Kunt (Figure 1A) was 00006843 (see Supplementary Materials). The authentication code for Cuphea cyanea Moc. and Sessé ex DC (Figure 1B) was 00006847 (see Supplementary Materials). The collection of plant material and the performance of experimental research on such plants complied with the national guidelines of México in the standards NOM-003-STPS-1999 and NOM-007-STPS-2000; (https://www.stps.gob.mx (accessed on 8 August 2023)).
To integrate fish and plants into the system, 36 plants of each species were taken out of their transport pots and carefully transplanted, with their substrate removed, into 12 plastic tubes. Another 36 plants of each species were kept in their original pots, along with the substrate, which is a mixture of ground dry leaves that helps to maintain plant moisture without the need for soil.
For the Cuphea ssp. growth performance, maximum branch height and leaf area index were measured based on the methodology of [22]. The maximum branch height was recorded for time zero (T0) when the plants arrived; a second measurement was made one month before, another measurement was made at the beginning of April upon integration with the carp, and the last one was recorded at the end point of the trial time. The determination of the leaf area index was carried out as follows: for C. hyssopifolia, 5 leaves from 5 branches were measured randomly from the apex, in the middle, and at the end; for C. cyanea, 15 leaves from 2 branches were measured randomly from the apex, in the middle, and at the end.

2.2. Samples and Treatment of Cuphea spp.

2.2.1. Pre-Treatment of Samples and Monitoring

Sampling was carried out twice, in February (T0) and at the end point (April 2016), and maintaining the original proportion of the plant, the leaf, flower and dry stem were collected. Samples were collected randomly from the apex, in the middle, and at the end of each species. Once the samples were collected, they were weighed and placed in paper bags in an oven at 35 °C for four days. After grinding on a sieve with a 20 mm mesh opening, 500 mg was taken from here for extraction, and the rest was stored in amber plastic bottles at room temperature without exposure to light. Dry samples (500 mg) were added to 5 mL of a solvent mixture containing 80% methanol, 18% distilled water, and 2% formic acid. After 30 s of vortex agitation, the extracts were sonicated for 30 min at room temperature and centrifuged at 8500 rpm for 15 min at 4 °C. The supernatant was recovered, and 5 mL of the solvent mixture was added to the remaining pellet. It was stirred for 30 s in a vortex, sonicated for 30 min at room temperature, and centrifuged at 8500 rpm for 15 min. The supernatant was recovered with the above. Once together, the final volume of the extracts was measured, filtered in an acrodisc then used in all determinations.

2.2.2. Determination of Total Phenolic Compounds

Total phenols were determined using the Folin–Ciocalteu colourimetry method [23], using gallic acid as standard and a 10-point calibration curve. In 2 mL tubes, 100 µL of the extract was added, 400 µL of the solvent (80% methanol + 20% distilled water) with 250 µL of Folin–Ciocalteu reagent (1 N), and after 5 min, 1.25 mL of Na2CO3 was added to neutralize. The samples were incubated for 2 h without stirring out of the reach of light, and then measured. Absorbance was measured at 765 nm using a Spectra Max reader (Molecular Devices Co., Sunnyvale, CA, USA). Concentrations are expressed as milligrams of gallic acid equivalents per g of dry weight of extract (mg g−1 GAEq DW). All assays were performed in triplicate in 2 mL Eppendorf tubes (Eppendorf North America, Inc., Enfield, CT, USA).

2.2.3. Determination of Total Flavonoids

Total flavonoids were determined according to the method proposed by Brand-Williams et al. (1995) [24], with catechin as standard and a 6-point calibration curve. A volume of 300 μL of the standard/extract + 120 μL of distilled water + 90 μL of a 5% NaNO2 solution, and, after 5 min, 90 μL of 10% AlCl6H2O was added and allowed to stand for 6 min. Afterwards, 600 µL of NaOH (1 M) was added, and the volume was increased to 2.5 mL using distilled water. The solution was mixed, and the absorbance was measured at 510 nm using a Spectra Max reader (Molecular Devices Co., Sunnyvale, CA, USA). Concentrations are expressed as milligrams of catechin equivalents per g of dry weight of extract (mg g−1 CAEq DW).

2.2.4. Determination of Antioxidant Activity,1-Diphenyl-2-picrylhydrazyl Radical (DPPH) Inhibition Assay

Determination of the antioxidant activity was carried out via the DPPH method [25] using DPPH (1,1-diphenyl-2-picrylhidrazil) reagent with methanol. Aliquots of 1.865 mL of the reagent were placed in 2 mL microtubes along with 0.135 mL of the methanolic extract of each sample. The mix was allowed to stand for 30 min, protected from light. Trolox was used for the 7-point calibration curve, and the reading was performed at a wavelength of 480 nm. The results were expressed as milligrams of Trolox equivalents per g of dry weight (mg g−1 TEq DW).

2.2.5. Determination of Antioxidant Activity Ferric-Reducing/Antioxidant Power (FRAP) Assay

To determine the antioxidant activity using the FRAP method [26], the reagent was prepared with a mixture of a 20 mM solution of iron trichloride (FeCl3), acetate buffer with anhydrous sodium acetate, and sodium acetate trihydrate at pH 3.7. Finally, TPTZ (2,4,6-tripyridyl-2-triazine) was prepared at 10 mM dissolved in 40 mM HCL. A mix of 1.865 mL of the FRAP reagent and 0.135 mL of the methanolic extract of the samples were placed in 2 mL microtubes and allowed to react for 30 min, protected from light. Trolox was used for the 7-point calibration curve. The absorbance was read at 630 nm. The results were expressed as mg g−1 TEq DW.

2.2.6. Ultra-Performance Convergence Chromatography

Extraction for Identification and Quantification

For the analysis of phenolic compounds, 200 mg of dry and finely ground samples were weighed, and then 1 mL of methanol (HPLC grade) was added to each and stirred in a vortex for 30 s. Subsequently, the samples were placed in an ultrasonic chamber for 30 min at RT and protected from light. After this time, the samples were centrifuged at 9500 rpm for 5 min. The supernatant was recovered, and the solid residue was subjected to the same extraction procedure four consecutive times. Finally, the supernatants were pooled, and the total volume was increased to 5 mL. The extract obtained was filtered with an acrodisc and stored in amber vials at −20 °C until analysis.

Analysis of Phenolic Compounds

The analysis of phenolic compounds was carried out via convergence chromatography (UPC2: ultra-performance convergence chromatography). A Waters System HPLC chromatograph (Waters Corporation, Milford, MA, USA) was used, which consists of a quaternary pump, a diode array detector (model 996), an online vacuum degasser (MetaChem Technologies Inc., Freisenbergstraße, Germany) and a Rheodyne injector (4793). The control of the equipment, the process, and the management of the chromatographic information was carried out with the Millennium program (Waters). The previously prepared samples were injected into the UPC2 according to analysis conditions to determine their chromatographic profiles (Table 3). Subsequently, the standard (Sigma-Aldrich, Productos Químicos del Sur, CDMX, México; purity ≥ 95%) apigenin, kaempferol, catechin, quercetin, caffeic acid, and p-coumaric acid were injected to decide the retention time and obtain their UV spectra. The retention times and UV spectra of the different peaks in the samples were compared with those of the standards. Coincident peaks were subjected to co-elution to confirm the correspondence of the compounds.

2.3. Statistical Analysis

The results are reported as the mean ± standard deviation (SD). A one-way ANOVA and a Tukey means comparison test (p ≤ 0.05) were performed. Additionally, a multifactorial ANOVA was performed (see Supplementary Materials) for all the biochemical variables, and interaction graphics produced using the Statgraphics Centurion v. 19 software.

3. Results

3.1. Integrated Agri-Aquaculture System Performance

Per guidelines described by Palm et al. (2018) [1], due to its size, the system enters the first category of IAAS—aquaponics (≤50 m2), and according to its design, it can be used domestically, recreationally, or in a backyard. For this domestic vertical aquaponic system, the leakage and flow, drainage, and sedimentation tests of solids without aquatic organisms lasted 15 days (before the time zero, or T0). In the following 23 days, the aquatic organism was introduced, and tests related to the accumulation of food were carried out. The flow within the NFT tubes (56 cm3 s−1) and the return of water to the fish tank resulted in oxygen levels above 7 mg L−1, an adequate level for the carp. Similarly, the 1-inch hoses used to recirculate water showed no blockages due to solids and sediment. The pump had enough power to carry water to the 36 plants on all three levels. No fish mortality occurred during the experiment.

3.1.1. Water Quality in the Integrated Agri-Aquaculture System

Water temperature, pH, DO, and EC concentrations varied between 17–32 °C, 8.6–9.3, 6–8.5 mg L−1, and 225–280 µS cm−1, respectively. The average water hardness values in the fish tank at the beginning were 50–90 mg L−1 of Ca, 10–30 mg L−1 of Mg, 30–35 mg L−1 of K; and for Cl, PO4-P and SO4-S, the values were <0.5 mg L−1 for each. However, once the 30-day test ended (only fishes in tanks) and the medicinal plants were added to the NFT tubes, the water showed a different nutrient dynamic. In the IAAS with C. hyssopifolia (IAAS-H), the K concentration decreased by almost 80%. At the same time, the Mg was almost three times higher, the SO4-S was 3.7 times higher, the PO4-P was four times higher, and the NO3-N was the highest, with 6.5 times more concentration. The Cl, NH4-N, and NO2-N remained at <0.2 mg L−1. At the end of the trial time, the released rate (mg L−1) of nutrients in the water derived from fish feeding was in the following decreasing order: NO3-N (130) > Mg (90) > SO4-S (64) > PO4-P (9) > K (2) > Cl (0.28) > NH4-N (0.1) > NO2-N (0.04).
For the IAAS with C. cyanea (IAAS-C), the concentration of K, Mg, Cl, NH4-N, and NO2-N had similar values to IAAS-H. At the same time, PO4-P (1.58 mg L−1) remained constant over time, and the SO4-S decreased slightly (15–11 mg L−1), whereas NO3-N did not behave the same, dropping by 70%. At the end of the trial time, the released rate (mg L−1) of nutrients for IAAS-C was Mg (80) > NO3-N (6) > SO4-S (11) > PO4-P (1.50) ≈ K (1.58) > Cl (0.23) > NH4-N (0.1) > NO2-N (0.008).

3.1.2. Growth and Development of Cuphea spp.

There were no significant differences in the growth of the species in both IAAS-H and IAAS-C and each of their controls, conventional C. hyssopifolia cultivation (CCH) and conventional C. cyanea cultivation (CCC), respectively. Regarding the percentage humidity in the greenhouse, the samples from IAAS-H showed 59.67% humidity at the beginning of the test, while once the experiment was finished, this was 43.26%. The IAAS-C samples had 81.31% humidity at the beginning of the test, while at the end of the test period, they only had 51.92% humidity. According to descriptions of the geographical zones in which Cuphea grows, the temperature (29.02 ± 9.48 °C) and humidity (53 ± 8.05%) within the protected system were at their tolerable limits [11]. Table 4 shows the results observed for the length (cm) of their branches and their leaf index area (cm). The multifactorial ANOVA for growth variables showed no statistically significant interactions between species and cultivation method (p = 0.59). No statistical differences were found in the simple main effects of the cultivation method on growth performance during the trial period. For interaction graphics, tables, and the dynamics of the IAAS inside the greenhouse, see Supplementary Materials.

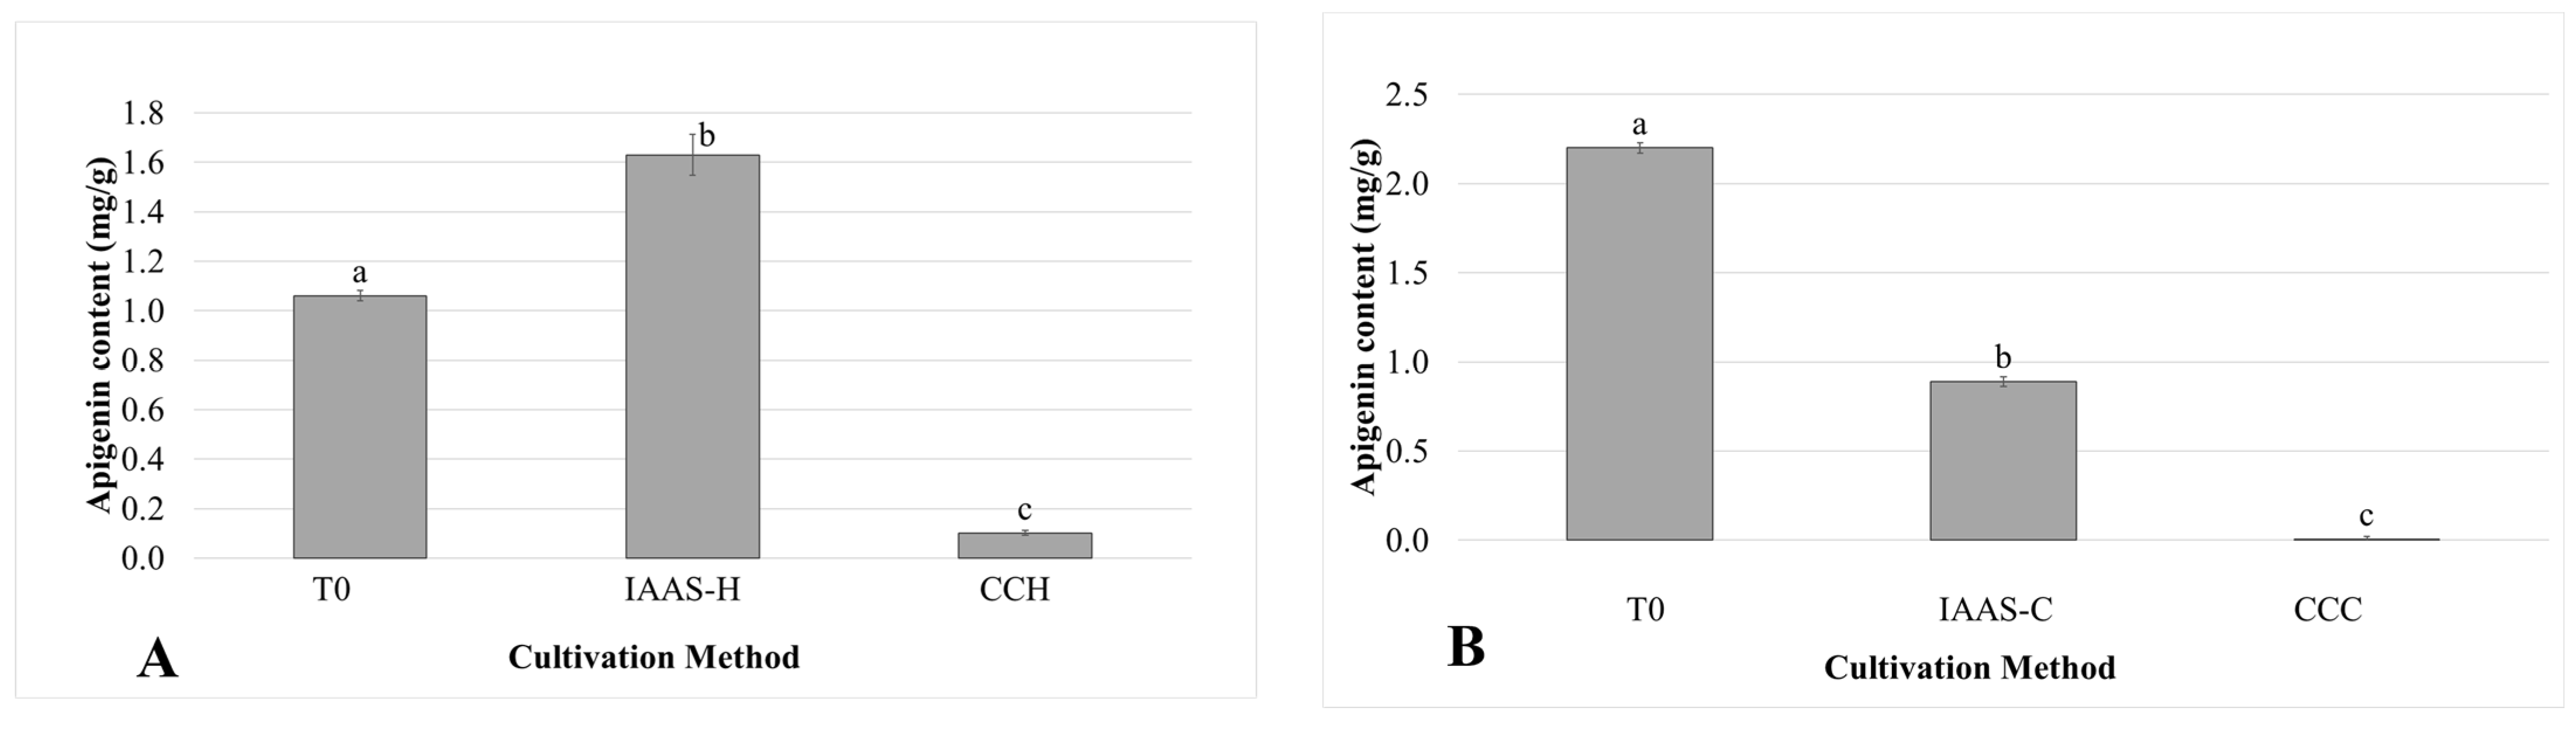
3.2. Bioactive Compounds

The cultivation method generated unique differences in the concentration of bioactive compounds and the antioxidant activity in Cuphea spp. (Table 5). A multifactorial ANOVA revealed significant interactions between factors (species*cultivation method) for the total phenolic, flavonoids, and apigenin content as well as for DPPH (p = 0.00). Significant main effects were observed for both factors (species and cultivation method) (p = 0.00) (Table 6). A simple main effects analysis showed statistically significant differences for all variables (p = 0.00) in relation to the cultivation method (Table 5, Figure 2). For C. hyssopifolia in its acclimatization stage (T0), the compound contents were 80.39 ± 9.9 mg g−1 GAEq and 10.71 ± 1.0 mg g−1 CAEq for phenolic and flavonoids, respectively. At the end of the trial period, approximately 76% of phenols and 50% of flavonoids remained in the dry basis of the plant cultivated in IAAS-H, with 20% of phenolics and 76.5% of flavonoids in CCH. For C. cyanea metabolites, their content at T0 was 17.06 ± 0.8 mg g−1 GAEq and 7.45 ± 0.8 mg g−1 CAEq for phenolic and flavonoids, respectively. At the end of the trial, 91% of phenols and 47% of flavonoids remained in IAAS-C, while 24% of phenolics and 82% of flavonoids remained in the dry basis of the plant cultivated in CCC. The antioxidant capacity in the methanol extract in C. hyssopifolia showed significant differences from T0 to the end of trial time, with higher antioxidant capacity; however, in C. cyanea, an increase of 4.11 mg g−1 TEq in the dry basis was observed, and remained in the integrated system.
It should be noted that for both species, their values in apigenin concentrations (Figure 2) were closer at the beginning of the experiment, this not being the case for their contents of phenols and total flavonoids. The results show significant differences in the concentration of apigenin between treatments. At the beginning of the experiment, the apigenin content in C. hyssopifolia was 1.06 mg g−1, whilst at the end of the trial period, the content in leaves from IAAS-H increased more than 60% (1.63 mg g−1), and its CCH concentration decreased by about a 93% (0.10 mg g−1). Regarding C cyanea, the apigenin concentration started at 2.2 mg g−1, and by the end of the trial, it had decreased by around 40% (0.89 mg g−1). CCC decreased in concentration by 97% (0.0067 mg g−1).

4. Discussion

This short study aimed to analyze the effect of an Integrated Agri-aquaculture Systems on the content of bioactive compounds in the medicinal plants Cuphea hyssopifolia and Cuphea cyanea. The content of water in C. hyssopifolia changed around 16% from time zero to the end, and the water content of C. cyanea decreased by nearly 30% from time zero to the last day. According to Graham (1994) [27], C. hyssopifolia has a root system of a short primary root and many lateral roots of equal thickness, and the tertiary root is fibrous; while C. cyanea has not been fully described in terms of its root system, we observed that it is less fibrous and abundant. C. cyanea needed manipulation during the first week of the experiment, because its long and creeping leaves moved the roots out of the NFT tube; after this period, and together with the sediment that accumulated in the roots, it could be kept in place. At the end of the experiment, we observed the death of flowers, then of leaves, and at the end, of complete branches; however, we did not observe the death of the complete plant. Some similar problems were also reported by Abdel-Rahim (2019) [28], where of the four medicinal plants that were produced, only mint and rosemary survived until the end of the trial period. This effect was associated with a gel-like rot of the roots in thyme and marjoram due to the sedimentation of fish faeces that ended up covering the roots. In this study, we observed this effect only in certain parts of the roots of C. hyssopifolia. Whereas the other roots looked healthy, those of C. cyanea, which had more parts with this gel, were not. This is probably because the method used was NFT, which allowed the roots to form new shoots in the air. At the end of the trial test, only C. hyssopifolia showed “full bloom” (floral and leaf growth), as described by Berti et al. (2008) [29], while for the use of C. cyanea, a design within IAAS should be reconsidered, either in its use with an inert substrate or with another aquaculture species. Because of the limitations in studies growing this native species with different media, methods, and nutrient solutions, it is not possible to directly compare the effect of IAAS on Cuphea spp. Yang et al. (2019) [30] reported a positive effect of integrated systems on basil growth, but the overall growth of basil is different from these species. The species utilized in this study are medicinal and recognised by local herbalists for use as medications, as an insecticide, and for treating sore throats [15]. These species also possess specific activities, such as an antitumor effect on human promyelocytic leukemia (HL-60 cells) [31], and on the ability to decrease effects on lipid peroxidation due to paracetamol-induced hepatoxicity [32]. In their study, Flanigan and Niemeyer (2014) [33] describe that variety affects the composition of the bioactive compounds, and Oladimeji et al. (2020) [6] reported that using an inert substrate as a culture medium modifies water quality (and therefore nutrient accumulation and secondary metabolite contents). While this aspect needs further investigation, it suggests that C. cyanea can grow in aquaponic culture if some variables are modified, such as the aquatic species, the use of some inert substrate as a support medium for the roots, water temperature, etc. It is possible that the decreased growth and death of C. cyanea occurred due to a distressing effect; it may be that the roots cannot tolerate being in constant contact with OEW, or this variety cannot accept nitrogen in the same way that C. hyssopifolia can.
Polyphenols in plants and their antioxidant activity are beneficial for human health. Nevertheless, in plants, these compounds are a part of the defensive response to stress. This observation may result from the fact that phenylpropanoids are secondary metabolites related to the activation of plant stress and defence [34] and have been shown to have protective functions against oxidative stress [35]. The cultivation method, that is, the integration into IAAS, showed differences in the concentration of the phytochemical profile (phenols and flavonoids) of Cuphea spp. [36]. It is well documented that plants that grow with optimum levels of environmental stimuli are less likely to stimulate defense mechanisms, such as secondary metabolite synthesis, which ultimately leads to a loss in adaptability [37]. The batch of plants in the initial cultivation site was only irrigated with tap water. This is an irrigation custom in local greenhouses because these species grow “anywhere”, without the need to add special nutrients. This probably generated nutritional stress in the plants, and thus raised their secondary metabolism. So, once the soil in which they came was removed, transplanted to the NFT, and irrigated with OEW, we observed a decrease in the immune activity of the plants that was detected in the analysis even when 7-day acclimatization was carried out. Then, during the days of integration, the levels of secondary metabolites decreased in each IAAS, but to some extent, the immune system remained in the plants; meanwhile, in the control, the production of phenols and flavonoids reached a minimum (Table 5). It is important to note that despite belonging to the same genus, the morphology of the two species is different, even contrasting, a remark that can be observed in the main effects analysis for the species (Table 5). Phenol and flavonoids compounds activate plant defense mechanisms against biotic and abiotic stressors through the shikimate and acetate pathways [38], so it can be confirmed that IAAS promotes sufficient stress (eustress), causing plants to activate and maintain a “waiting” state for a long time, in anticipation of a future stress situation [39].
It was also observed that the leaves of the plants In the IAAS appeared larger and greener, while the control showed small leaves with an opaque green color, a clear sign of biostimulation/elicitation [40]. However, the analyses showed no significant differences. A significant main effect of the species was observed for both growth variables, leaf area and plant height, and no main or simple main effects for of cultivation method were significant. These results imply that the cultivation method does not provoke significant changes in leaf area and plant height. Instead, the differences between species respond to the genetic identity of the plants, which can be inferred because the values for both groups are consistently different from each other for all types of cultivation (see the Supplementary Materials for interaction plots). No significant differences were found in the species’ growth in both IAAS-H and IAAS-C and each of its conventional cultivations; this is probably due to the measurement methods used. For future studies, it is necessary to scale the system and the number of plants to conserve the aquaponic feeding rate ratio [41]. In this way, an approach for commercial-scale production and more precise methodologies such as image analysis would have to be used.
Another observation was that the C. hyssopifolia species showed its roots, and this promoted the retention of some solids from the water. According to Olness et al. 2005 [42] when this genus is grown hydroponically, deficiency in root growth is manifested due to a lack of nutrients (e.g., vanadium) or the ionic ratio. In this study, C. cyanea showed the same result of low root growth, although further studies on the nutrient dynamics in aquaponics with medicinal plants are needed to clarify these findings. Basil (Ocimum basilicum) presents morphological characteristics like those of C. hyssopifolia (e.g., shrub type, pivoting roots, antioxidant properties correlated with disease prevention in humans); parsley (Petroselinum crispum), on the other hand, has been identified as a condiment or herb with beneficial effects on health due to its contents of phenolic acids and flavonoids [42,43]. In a study conducted by [9] with ornamental fish and both the aforementioned species, the authors found that the growing method has a significant effect on plant performance. Concerning the flavonoid content in parsley, aquaponics caused a significant increase in quercetin. Additionally, a remarkable increase was reported in other compounds such as myricetin and rosmarinic acid (+1861% and 633%, respectively).
Biostimulants are compounds of biotic origin that can induce a pre-stress conditioning effect, which promotes various physiological responses. Responses stimulated in this way can reach values between 30–60% higher than the values reported for the control [43,44]. Elgindi et al. 2011 [15] described 35 flavonoids found in 16 Cuphea spp; however, the presence of catechin, caffeic acid, and p-coumaric acid has not been described. Thus, it was proposed in this study that they could be detected using the UPC2 method. Although it is reported that kaempferol, catechin, and quercetin have been isolated in C. hyssopifolia, in this study, we did not find any of the above; however, we did find apigenin (Figure 2), which has only been described in a limited number of Cuphea spp. This represents an apparent contradiction, since Braglia et al. 2022. [9] also describe that aquaponic culture promotes the biosynthesis of resveratrol and therefore the production of p-coumaric acid; however, this standard was not found.
Apigenin is a natural flavonoid found in medicinal plants and other fruits and vegetables. It is recognised for being found in large quantities in garlic, chamomile, orange, and propolis [9,45]. Its importance lies in its biological functions, which are beneficial to human health (i.e., its antitumor effect, beneficial for the cardiovascular system, and its effects on the liver, respiratory, endocrine, and central nervous systems). Apigenin acts specifically as an anti-inflammatory, antibacterial, antiviral, antiallergic, cytotoxic, antitumor treatment, and as a treatment for neurodegenerative diseases [44,46]. In this short study, an increase of more than 60% in the apigenin content in IAAS-H was found by the end of the trial, so a eustress effect related to cultivation using IAAS can be confirmed, as can a consequent increase in the production of bioactive compounds. Moreover, from the multifactorial ANOVA, a significant interaction between cultivation method and plant species was observed for apigenin, total phenolic content, and total flavonoids, meaning that the plant metabolic response to the cultivation method varies differently depending on the species tested. The analysis of the main effects of the cultivation methods shows that aquaponic cultivation has a global significant effect, yielding higher means for the total phenolic and apigenin contents, and for antioxidant activity in comparison to conventional cultivation (Table 6). In addition, during the analysis of the samples using the UPC2 method, peaks for other different flavonoids were detected without identification, because standards were not available. More specific studies are needed to identify the other compounds that are present in these two medicinal species, possibly using gas-chromatography–mass spectrometry (GC-MS) analysis.

5. Conclusions

The results found in this short study show that C. hyssopifolia in IAAS-H has appropriate synergy, and that cultivation under aquaponic conditions has biostimulant effects. This allowed phenotypically better development than that of C. cyanea in IAAS-C. The results obtained in the present study show that the aquaponic system design is suitable for keeping Cuphea spp. in a greenhouse. IAAS-H was better for maintaining growth, high conversion of ammonia to nitrates in the water, and a high polyphenolic compound concentration in the plants; it also increased the content of a specific flavonoid, apigenin, compared with the conventional culture. This indicates that aquaponic cultivation can promote the biostimulation of medicinal plants, causing plants to activate second metabolism pathways, and thereby improving phenotypic variables (i.e., growth and development) and/or activating immunity by sacrificing previous ones. Future studies may involve comparing different scales of hydroponic units, testing various inert substrates, and analyzing the resulting waters of tilapia in different growth stages. It is important to conduct additional studies on the elicitor and biostimulant effects of organically enriched waters in aquaponics. Analyzing the activities of enzymes related to stress responses, such as superoxide dismutase, catalase, and phenylalanine ammonia-lyase, is necessary to confirm whether the use of aquaponics causes eustress or distress. In this case, the aquaponic integration of Cuphea spp. with C. carpio increases the production of polyphenolic compounds, with each variety in a specific concentration. It was observed that C. cyanea is not an excellent candidate for introduction into aquaponic systems because it needs support for its roots. We must also consider the limited data concerning medicinal plants such as Cuphea spp. grown using different methods. The findings reported here contribute to the use of aquaponics as a sustainable system to stimulate the immune system of plants, raise the antioxidant content in leaves and fruit, and thus impact the zero hunger, good health and well-being goals of the 2030 agenda at the local level.

Supplementary Materials

The following supporting information can be downloaded at: https://www.mdpi.com/article/10.3390/agriculture13102018/s1, File S1 includes real images, species interaction graphs, water dynamics data and species identification certificates.

Author Contributions

P.S.F.-A.; Writing—original draft preparation, Investigation; A.K.R.-C.; Formal analysis, Writing—editing; E.R.-d., Resources, data curation, editing; H.A.-B.; Writing—review, Software—validation; S.A.Z.-C.; Investigation, resources; G.M.S.-Z.; Supervising, Project administration, resources, and methodology. All authors have read and agreed to the published version of the manuscript.

Funding

We want to thank Consejo Nacional de Ciencia y Tecnología CONACYT for the scholarship 2019-000037-02NACF-01190 for doctorate studies, and the Laboratory of Bioengineering for the equipment, materials, and technical support.

Institutional Review Board Statement

The protocol entitled “Cultivo acuapónico vertical Carpa Koi (Cyprinus carpio L. 1758--Cuphea spp. con potencial nutracéuticos” was approved by the Applied Research Ethics Committee, Faculty of Engineering, CEAIFI of the Autonomous University of Querétaro (registration 7164-08-12-2014) for studies with animals, in adherence with the ethical guidelines of beneficence, non-maleficence, justice, and autonomy.

Data Availability Statement

All data generated and analyzed during this study are included in this published article in the Supplementary Materials.

Conflicts of Interest

All authors have reviewed the manuscript and report that they have no competing interests to declare. The sponsors had no role in the design of the study; in the collection, analyses, or interpretation of data; in the writing of the manuscript, and in the decision to publish the results.

References

  1. Palm, H.; Knaus, U.; Appelbaum, S.; Goddek, S.; Strauch, S.M.; Vermeulen, T.; Haïssam Jijakli, M.; Kotzen, B. Towards Commercial Aquaponics: A Review of Systems, Designs, Scales and Nomenclature. Aquac. Int. 2018, 26, 813–842. [Google Scholar] [CrossRef]
  2. Yang, T.; Kim, H. Characterizing Nutrient Composition and Concentration in Tomato-, Basil-, and Lettuce-Based Aquaponic and Hydroponic Systems. Water 2020, 12, 1259. [Google Scholar] [CrossRef]
  3. Yang, T.; Kim, H. Comparisons of Nitrogen and Phosphorus Mass Balance for Tomato-, Basil-, and Lettuce-Based Aquaponic and Hydroponic Systems. J. Clean. Prod. 2020, 274, 122619. [Google Scholar] [CrossRef]
  4. Gott, J.; Morgenstern, R.; Turnšek, M. Aquaponics for the Anthropocene: Towards a ‘Sustainability First’ Agenda. In Aquaponics Food Production Systems; Springer: Berlin/Heidelberg, Germany, 2019; pp. 393–432. [Google Scholar] [CrossRef]
  5. Yep, B.; Zheng, Y. Aquaponic Trends and Challenges—A Review. J. Clean. Prod. 2019, 228, 1586–1599. [Google Scholar] [CrossRef]
  6. Oladimeji, A.S.; Olufeagba, S.O.; Ayuba, V.O.; Sololmon, S.G.; Okomoda, V.T. Effects of Different Growth Media on Water Quality and Plant Yield in a Catfish-Pumpkin Aquaponics System. J. King Saud. Univ. Sci. 2020, 32, 60–66. [Google Scholar] [CrossRef]
  7. Bartelme, R.P.; Oyserman, B.O.; Blom, J.E.; Sepulveda-Villet, O.J.; Newton, R.J. Stripping Away the Soil: Plant Growth Promoting Microbiology Opportunities in Aquaponics. Front. Microbiol. 2018, 9, 8. [Google Scholar] [CrossRef] [PubMed]
  8. Delaide, B.; Teerlinck, S.; Decombel, A.; Bleyaert, P. Effect of Wastewater from a Pikeperch (Sander lucioperca L.) Recirculated Aquaculture System on Hydroponic Tomato Production and Quality. Agric. Water Manag. 2019, 226, 105814. [Google Scholar] [CrossRef]
  9. Braglia, R.; Costa, P.; di Marco, G.; D’Agostino, A.; Redi, E.L.; Scuderi, F.; Gismondi, A.; Canini, A. Phytochemicals and Quality Level of Food Plants Grown in an Aquaponics System. J. Sci. Food Agric. 2022, 102, 844–850. [Google Scholar] [CrossRef]
  10. Suhl, J.; Dannehl, D.; Kloas, W.; Baganz, D.; Jobs, S.; Scheibe, G.; Schmidt, U. Advanced Aquaponics: Evaluation of Intensive Tomato Production in Aquaponics vs. Conventional Hydroponics. Agric. Water Manag. 2016, 178, 335–344. [Google Scholar] [CrossRef]
  11. Graham, S.A.; Sosa, V. Flora de Veracruz. “Lytraceae”. Fascículo 1991, 66, 15–24. [Google Scholar]
  12. Santos, M.C.; Henriques, A.T.; Mendez, A.S.L. Analytical Methods of Phytochemicals from the Cuphea Genus—A Review. Drug Anal. Res. 2021, 5, 4–10. [Google Scholar] [CrossRef]
  13. Graham, S.A.; Kleiman, R. Composition of Seed Oils in Some Latin American Cuphea (Lythraceae). Ind. Crop. Prod. 1992, 1, 31–34. [Google Scholar] [CrossRef]
  14. Gesch, R.; Forcella, F.; Olness, A.; Archer, D.; Hebard, A. Agricultural Management of Cuphea and Potential for Commercial Production in the Northern Corn Belt. Ind. Crop. Prod. 2006, 24, 300–306. [Google Scholar] [CrossRef]
  15. Elgindi, M.; Ayoub, N.; Milad, R.; Hassan, R. A Comprehensive Review of Cuphea (Lythraceae). Res. J. Pharm. Biol. Chem. Sci. 2011, 2, 847–856. [Google Scholar]
  16. Tiwari, D.K.; Coria-Tellez, A.V.; Tripathi, D.; Alonso-Perez, M.O.; Navarro-Pérez, A.D. Extraction and Characterization of Chemical Constituents Present in Cuphea Aequipetala and Their Properties. Microsc. Microanal. 2021, 27, 2278–2282. [Google Scholar] [CrossRef]
  17. Tungmunnithum, D.; Thongboonyou, A.; Pholboon, A.; Yangsabai, A. Flavonoids and Other Phenolic Compounds from Medicinal Plants for Pharmaceutical and Medical Aspects: An Overview. Medicines 2018, 5, 93. [Google Scholar] [CrossRef]
  18. Palm, H.; Knaus, U.; Appelbaum, S.; Strauch, S.M.; Kotzen, B. Coupled Aquaponics Systems. In Aquaponics Food Production Systems; Springer: Berlin/Heidelberg, Germany, 2019; pp. 163–199. [Google Scholar] [CrossRef]
  19. Nozzi, V.; Graber, A.; Schmautz, Z.; Mathis, A.; Junge, R. Nutrient Management in Aquaponics: Comparison of Three Approaches for Cultivating Lettuce, Mint and Mushroom Herb. Agronomy 2018, 8, 27. [Google Scholar] [CrossRef]
  20. Kloas, W.; Groß, R.; Baganz, D.; Graupner, J.; Monsees, H.; Schmidt, U.; Staaks, G.; Suhl, J.; Tschirner, M.; Wittstock, B.; et al. A New Concept for Aquaponic Systems to Improve Sustainability, Increase Productivity, and Reduce Environmental Impacts. Aquac. Environ. Interact. 2015, 7, 179–192. [Google Scholar] [CrossRef]
  21. Rakocy, J.; Masser, M.; Losordo, T. Recirculating Aquaculture Tank Production Systems: Aquaponics-Integrating Fish and Plant Culture; Oklahoma Cooperative Extension Service: Stillwater, OK, USA, 2016. [Google Scholar]
  22. Vazquez-Cruz, M.A.; Luna-Rubio, R.; Contreras-Medina, L.M.; Torres-Pacheco, I.; Guevara-Gonzalez, R.G. Estimating the Response of Tomato (Solanum lycopersicum) Leaf Area to Changes in Climate and Salicylic Acid Applications by Means of Artificial Neural Networks. Biosyst. Eng. 2012, 112, 319–327. [Google Scholar] [CrossRef]
  23. Oomah, B.D.; Cardador-Martínez, A.; Loarca-Piña, G. Phenolics and Antioxidative Activities in Common Beans (Phaseolus vulgaris L.). J. Sci. Food Agric. 2005, 85, 935–942. [Google Scholar] [CrossRef]
  24. Brand-Williams, W.; Cuvelier, M.E.; Berset, C. Use of a Free Radical Method to Evaluate Antioxidant Activity. LWT-Food Sci. Technol. 1995, 28, 25–30. [Google Scholar] [CrossRef]
  25. Liu, J.K.; Hu, L.; Dong, Z.J.; Hu, Q. DPPH Radical Scavenging Activity of Ten Natural P-Terphenyl Derivatives Obtained from Three Edible Mushrooms Indigenous to China. Chem. Biodivers. 2004, 1, 601–605. [Google Scholar] [CrossRef] [PubMed]
  26. Singleton, V.L.; Rossi, J.A. Colorimetry of Total Phenolics with Phosphomolybdic-Phosphotungstic Acid Reagents. Am. J. Enol. Vitic. 1965, 16, 144–158. [Google Scholar] [CrossRef]
  27. Graham, S. Lythraceae*; Flora del Bajio y de Regiones Adyacentes; Instituto de Ecologia: Kent, OH, USA, 1994; Volume 24, pp. 1–62. [Google Scholar]
  28. Abdel-Rahim, M.M.; Awad, Y.M.; Abdallah, Y.A.; Radwan, S.M. Effects of Four Medicinal Plants on the Bioeconomic Analysis and Water-Use Efficiency of Nile Tilapia, Oreochromis Niloticus Fry Nursed under a Small-Scale Aquaponics System. AACL Bioflux 2019, 12, 851–866. [Google Scholar]
  29. Berti, M.T.; Johnson, B.L. Growth and Development of Cuphea. Ind. Crop. Prod. 2008, 27, 265–271. [Google Scholar] [CrossRef]
  30. Yang, T.; Kim, H.J. Nutrient Management Regime Affects Water Quality, Crop Growth, and Nitrogen Use Efficiency of Aquaponic Systems. Sci. Hortic. 2019, 256, 108619. [Google Scholar] [CrossRef]
  31. Elgindi, M.; Ayoub, N.; Milad, R.; Mekky, R. Antioxidant and Cytotoxic Activities of Cuphea Hyssopifolia Kunth (Lythraceae) Cultivated in Egypt. J. Pharmacogn. Phytochem. 2012, 1, 68–78. [Google Scholar]
  32. Moke, E.G.; Mordi, J.C.; Umukoro, E.K. Effects of Methanol Leaf Extract of Cuphea Hyssopifolia Kunth on Liver Enzymes Activity and Antioxidant Indices of Paracetamol-Induced Hepatotoxicity in Wistar Rats. Afr. J. Biomed. Res. 2020, 23, 123–126. [Google Scholar]
  33. Flanigan, P.M.; Niemeyer, E.D. Effect of Cultivar on Phenolic Levels, Anthocyanin Composition, and Antioxidant Properties in Purple Basil (Ocimum basilicum L.). Food Chem. 2014, 164, 518–526. [Google Scholar] [CrossRef]
  34. Francini, A.; Giro, A.; Ferrante, A. Biochemical and Molecular Regulation of Phenylpropanoids Pathway Under Abiotic Stresses. In Plant Signaling Molecules: Role and Regulation under Stressful Environments; Elsevier: Amsterdam, The Netherlands, 2019; pp. 183–192. [Google Scholar] [CrossRef]
  35. Brunetti, C.; Guidi, L.; Sebastiani, F.; Tattini, M. Isoprenoids and Phenylpropanoids Are Key Components of the Antioxidant Defense System of Plants Facing Severe Excess Light Stress. Environ. Exp. Bot. 2015, 119, 54–62. [Google Scholar] [CrossRef]
  36. Khandaker, M.; Kotzen, B. The Potential for Combining Living Wall and Vertical Farming Systems with Aquaponics with Special Emphasis on Substrates. Aquac. Res. 2018, 49, 1454–1468. [Google Scholar] [CrossRef]
  37. Erofeeva, E.A. Environmental Hormesis of Non-Specific and Specific Adaptive Mechanisms in Plants. Sci. Total Environ. 2022, 804, 150059. [Google Scholar] [CrossRef]
  38. Bravo, L. Polyphenols: Chemistry, Dietary Sources, Metabolism, and Nutritional Significance. Nutr. Rev. 1998, 56, 317–333. [Google Scholar] [CrossRef] [PubMed]
  39. Godínez-Mendoza, P.L.; Rico-Chávez, A.K.; Ferrusquía-Jimenez, N.I.; Carbajal-Valenzuela, I.A.; Villagómez-Aranda, A.L.; Torres-Pacheco, I.; Guevara-González, R.G. Plant Hormesis: Revising of the Concepts of Biostimulation, Elicitation and Their Application in a Sustainable Agricultural Production. Sci. Total Environ. 2023, 894, 164883. [Google Scholar] [CrossRef] [PubMed]
  40. González, R.G.G.; Pacheco, I.T. Manejo del Estrés Vegetal Como una Estrategia Para una Agricultura Sostenible; Universidad Almería: Almería, Spain, 2022; Volume 3, ISBN 8413511534. [Google Scholar]
  41. Rakocy, J. Aquaponics-Integrating Fish and Plant Culture; John Wiley & Sons: Hoboken, NJ, USA, 2012. [Google Scholar]
  42. Olness, A.; Gesch, R.; Forcella, F.; Archer, D.; Rinke, J. Importance of Vanadium and Nutrient Ionic Ratios on the Development of Hydroponically Grown Cuphea. Ind. Crop. Prod. 2005, 21, 165–171. [Google Scholar] [CrossRef]
  43. Ferreira, F.S.; de Oliveira, V.S.; Chávez, D.W.H.; Chaves, D.S.; Riger, C.J.; Sawaya, A.C.H.F.; Guizellini, G.M.; Sampaio, G.R.; Torres, E.A.F.d.S.; Saldanha, T. Bioactive Compounds of Parsley (Petroselinum crispum), Chives (Allium schoenoprasum L.) and Their Mixture (Brazilian Cheiro-Verde) as Promising Antioxidant and Anti-Cholesterol Oxidation Agents in a Food System. Food Res. Int. 2022, 151, 110864. [Google Scholar] [CrossRef]
  44. Hernández, M.V.; Jiménez, N.I.F. Introducción a La Teoría Del Estrés e Inmunología Vegetal. In Manejo del Estrés Vegetal Como una Estrategia Para una Agricultura Sostenible; Editorial Universidad de Almería: Almería, Spain, 2022; pp. 53–102. [Google Scholar]
  45. Zhou, X.; Wang, F.; Zhou, R.; Song, X.; Xie, M. Apigenin: A Current Review on Its Beneficial Biological Activities. J. Food Biochem. 2017, 41, e12376. [Google Scholar] [CrossRef]
  46. Ali, F.; Rahul; Naz, F.; Jyoti, S.; Siddique, Y.H. Health Functionality of Apigenin: A Review. Int. J. Food Prop. 2016, 20, 1197–1238. [Google Scholar] [CrossRef]
Figure 1. (A) Cuphea hyssopifolia Kunt; (B) Cuphea cyanea Moc. and Sessé ex DC; collection date February 2016, species acquired from “Red viverista” Located in Cuernavaca Morelos, Mexico (No collection number).
Agriculture 13 02018 g001
Figure 2. Simple main effects on the apigenin content of (A) Cuphea hyssopifolia and (B) Cuphea cyanea due to cultivation method at time zero (T0) and in Integrated Agri-aquaculture Systems with C. hyssopifolia (IAAS-H) and in Integrated Agri-aquaculture Systems with C. cyanea (IAAS-C), with their controls, Conventional C. hyssopifolia cultivation (CCH) and Conventional C. cyanea cultivation (CCC), respectively, at the end of the trial time. Bars represent the mean ± SD for three replicates for each system. Different letters indicate significant statistical differences according to Tukey’s test (p < 0.05).
Agriculture 13 02018 g002
Table 1. (A) Microclimate conditions of a greenhouse. (B) Water conditions in situ in a greenhouse at the Amazcala Experimental Campus. * The value was obtained from outside of the greenhouse.
Variables AData
Temperature greenhouse (°C)29.02 ± 9.48
Radiation * (W/m2)163.6 ± 42.06
Relative Humidity (%)53 ± 8.05
Variables BData
Temperature in the fish tank (°C)24.62 ± 5.04
pH 8.95 ± 0.20
Oxygen (mg L−1)7.23 ± 0.88
Conductivity (µS cm−1)248.52 ± 14.22
Table 2. Nutrients in the water of the 23-days trial recirculation (hydraulic test) in an Integrated Agri-aquaculture Systems (IAAS) in a greenhouse at the Amazcala Experimental Campus; baseline fish water quality before the integration of Koi carp–Cuphea spp. * Concentrations in the aquatic phase.
Water Quality (mg L−1) *MinMax
NH4-N0.151.00
NO3-N5.0022.0
NO2-N0.040.045
PO4-P0.503.00
SO4-S1.5024.0
Ca10.090.5
Mg11.041.0
Cl0.020.024
K26.028.0
Table 3. Method for detecting the phenolic compounds of Cuphea spp. with UPC2. The conditions in which the samples were introduced are as follows: injection volume: 10 µL, flow rate: 1.5 mL min−1, column: Viridis BEH 5 µm, 4.6 × 100 mm, column temperature: 40 °C, ABPR: 1500 psi. * CO2 Coleman grade.
Time (Min)* CO2 (%)Methanol (%)
0955
87030
97030
10955
11955
Table 4. Growth and development of Cuphea spp. measured at the time zero (T0) in Integrated Agri-aquaculture Systems with C. hyssopifolia (IAAS-H), and in Integrated Agri-aquaculture Systems with C. cyanea (IAAS-H), with its controls, Conventional C. hyssopifolia cultivation (CCH), and Conventional C. cyanea cultivation (CCC), respectively, at the final trial time. Data are means ± standard deviation for five replicates for each system in each level of NFT tubes. Different letters indicate statistically significant differences according to a multiple comparisons test (Tukey, p < 0.05).
Plant Species Maximum Branch
Height
Leaf Area
C. hyssopifolia bT029.71 ± 8.11.42 ± 0.7
IAAS-H39.98 ± 10.31.86 ± 0.5
CCH30.05 ± 5.21.87 ± 0.2
C. cyanea aT077.76 ± 40.119.16 ± 1.4
IAAS-C69.78 ± 32.922.07 ± 3.8
CCC65.04 ± 19.723.74 ± 8.5
Table 5. Bioactive compounds and antioxidant capacity of Cuphea spp. Concentrations are expressed as milligrams of gallic acid equivalents per g of dry weight of extract (mg g−1 GAEq DW), milligrams of catechin equivalents per g of dry weight of extract (mg g−1 CAEq DW), and milligrams of Trolox equivalents per g of dry weight (mg g−1 TEq DW) for phenolic, flavonoids, DPPH and FRAP, respectively. Data are presented as means ± standard deviation. Different letters indicate statistically significant differences for main and simple main effects (p = 0.00).
C. hyssopifolia aC. cyanea b
T0IAAS-HCCHT0IAAS-CCCC
Total phenolic content (mg g−1 GAEq)80.39 ± 9.9 a61.08 ± 7.2 b16.99 ± 0.4 c17.06 ± 0.8 a15.36 ± 0.8 b14.11 ± 1.3 c
Total flavonoid content (mg g−1 CAEq)10.71 ± 1.0 a5.62 ± 0.5 c8.19 ± 1.6 b7.456 ± 0.8 a3.52 ± 0.6 b1.79 ± 0.1 c
DPPH (mg g−1 TEq DW)125.73 ± 3.4 a114.82 ± 6.0 b96.92 ± 12.1 c11.05 ± 0.9 b15.16 ± 0.5 a7.22 ± 0.6 c
FRAP (mg g−1 TEq DW)133.05 ± 9.0 a134.53 ± 14.1 a114.878 ± 16.3 b13.34 ± 0.9 a13.35 ± 1.2 a7.37 ± 0.4 b
Table 6. Cultivation methods’ main effects. Data are shown as the least-squares means ± least-squares sigma estimated from a multifactorial ANOVA of the original data. Different letters indicate statistically significant differences according to a Tukey multiple comparisons test (p ≤ 0.05).
Cultivation MethodTotal Phenolic Content
(mg g−1 GAEq)
Total
Flavonoid Content
(mg g−1 CAEq)
Apigenin
(mg g−1)
DPPH
(mg g−1 TEq DW)
FRAP
(mg g−1 TEq DW)
T048.7 ± 1.2 a9.08 ± 0.2 a1.63 ± 0.01 a68.39 ± 1.3 a73.93 ± 2.3 a
IAA38.2 ± 1.2 b4.99 ± 0.2 b1.26 ± 0.01 b64.99 ± 1.3 a73.19 ± 2.3 a
CC15.5 ± 1.2 c4.56 ± 0.2 b0.05 ± 0.01 c52.06 ± 1.3 b61.12 ± 2.3 b
Disclaimer/Publisher’s Note: The statements, opinions and data contained in all publications are solely those of the individual author(s) and contributor(s) and not of MDPI and/or the editor(s). MDPI and/or the editor(s) disclaim responsibility for any injury to people or property resulting from any ideas, methods, instructions or products referred to in the content.

