Article

Physiological Response of Miscanthus sinensis (Anderss.) to Biostimulants

by
Marta Jańczak-Pieniążek
1,*,
Wojciech Pikuła
2,
Renata Pawlak
3,
Barbara Drygaś
4 and
Ewa Szpunar-Krok
1
1
Department of Crop Production, University of Rzeszow, Zelwerowicza 4 St., 35-601 Rzeszów, Poland
2
Silesian Botanical Garden, Sosnowa 5 St., 43-190 Mikołów, Poland
3
RENAGRO Renata Pawlak, Pod Chałupkami 10 St., 37-200 Przeworsk, Poland
4
Department of Bioenergetics, Food Analysis and Microbiology, Institute of Food Technology and Nutrition, College of Natural Science, University of Rzeszow, Ćwiklińskiej 2D St., 35-601 Rzeszow, Poland
*
Author to whom correspondence should be addressed.
Agriculture 2024, 14(1), 33; https://doi.org/10.3390/agriculture14010033
Submission received: 18 November 2023 / Revised: 11 December 2023 / Accepted: 21 December 2023 / Published: 23 December 2023
(This article belongs to the Special Issue Abiotic Stresses, Biostimulant and Plant Activity—Series II)

Abstract

:
Soil salinity stress is a serious problem in plant cultivation. The effect of this stress is to disrupt the photosynthetic process, which can cause growth restrictions and a decrease in plant productivity. The use of biostimulants can be one of the stress mitigation strategies in plant cultivation. Biostimulants increase the tolerance of plants to abiotic stresses, thus mitigating their adverse effects. In the present study, based on a pot experiment, the effect of foliar application of biostimulants differentiated in terms of chemical composition (Bombardino (B1), Quantis® (B2), Biofol Plex (B3) and Megafol (B4)) on the physiological properties of Chinese silver grass (Miscanthus sinensis (Anderss.)) plants growing under salt stress conditions was determined. Salt stress was induced by soil application of NaCl at concentrations of 200 and 400 mM. The application of salt solutions was followed by spraying Miscanthus plants with biostimulants using a hand-held sprayer. Physiological investigations (chlorophyll content, chlorophyll fluorescence and gas exchange) have been carried out twice: on the 1st (Term I) and 7th (Term II) day after spraying with biostimulants. It was shown that salt stress causes a decrease in the values of most of the physiological indicators tested (except Ci). On both measurement dates, the application of biostimulants, especially B2, caused an improvement in the values of the physiological indices studied, both for plants growing under optimal conditions and under salt stress. Term II showed an upward trend in most of the analyzed parameters compared to Term I, indicating plant acclimatization to stress conditions. Conducted studies have shown that using biostimulants contributes to the alleviation of the effects of soil salinity stress. The implementation of these practices can contribute to the advancement of sustainable farming.

1. Introduction

The growing demand for fossil energy has contributed to the increase in the global warming effect that threatens the ecosystem. Therefore, it is essential to substitute fossil fuels with alternative, renewable sources of energy [1]. Biofuels are considered sustainable energy options because they can mitigate CO2 emissions and reduce dependence on fossil fuels [2]. Bioenergy is renewable energy that comes from the processing of several types of organic sources called biomass, which can be wood, forestry waste, harvest residues, manure, urban waste, food industry residues, and many other by-products of farming processes [3,4,5]. Energy crops, in addition to wood, are a raw material commonly used for biofuel production through high biomass yields high biomass yield, high calorific value, and low agronomic inputs. Biofuel production is carried out both through direct burning, and bio-fermentation, i.e., biogas and bioethanol production [6]. However, the production of biomass for non-food uses should not be based on competition for agricultural land. This has become the cause for the use of marginal soils with disadvantageous agronomic characteristics for non-food cultivation [7,8]. Energy crop plantations have been promoted for many years as renewable source of energy within the policies of the European Union and United States of America [9]. Perennial energy grasses are a good option because they require relatively low nutrient levels and show high yields on marginal land. With regards to the beneficial environmental aspects, energy grasses absorb CO2 and provide valuable shelter and food for wildlife [10]. Chinese silver grass (Miscanthus sinensis (Anderss.)) is a perennial grass species commonly grown as an ornamental and for bioenergy production. Due to its ability to be grown from seed and tolerance to low temperatures, this species has advantages over the high-yielding hybrid species such as M. x gigantheus. M. sinensis is grown for energy purposes mainly due to its high genetic variability, tolerance to stress, and biotic interactions with fauna. The species is a good candidate for C4 bioenergy crop development for marginal lands. In addition, it is used as a fodder crop and building material [11,12,13]. Studies have shown that M. sinensis can be grown on marginal land and land polluted with heavy metals [14]. M. sinensis belongs to C4 species, which are better adapted to abiotic stress conditions under some environmental stresses than C3 species. These crops not only have better photosynthetic efficiency and CO2 fixation rates but also improved water use efficiency and transpiration, suggesting their superiority to C3 plants [15,16].
Salts are common in soil and are counted among the compounds necessary for plant growth. Their content at optimal concentrations has an important role in determining the maintenance of physiological plant functions [17]. However, excessive salt concentrations in the soil can contribute to osmotic stress and ionic toxicity by disrupting the ionic balance of nutrients, which ultimately affects the functioning of physiological processes and yield [18]. Salt stress is a serious abiotic stress occurring in many areas of the world mainly due to the use of poor-quality water for hydration, as well as soil salinity and inappropriate agricultural practices. The effect of salt stress is to reduce the growth and productivity of crop plants [19,20]. Shahid et al. [21] report that according to various estimates, about 10% of the total agricultural area is affected by salinity and sodicity, a billion hectares are covered with saline and/or sodic soils, and between 25% and 30% of irrigated land is saline and essentially economically unproductive. According to Singh [22], soil salinity is a widespread problem, involving more than one billion hectares in 100 countries. Salt stress in plants results in a combination of osmotic stress caused by dehydration and damage associated with Na+ ion accumulation, which causes premature aging, chlorosis, and necrosis of leaves. These changes adversely affect protein synthesis and photosynthetic activity [23]. Deskoy et al. [24] on the example of cowpea showed that fennel and ammi seed extracts modulate the antioxidant defense system and alleviate salinity stress. In the studies of these authors, extracts of Foeniculum vulgare and Ammi visnaga seeds, applied foliarly, significantly increased the content of osmoprotectants and the activity of components of the antioxidant system. This was reflected in a decrease in Na+, electrolyte leakage, and biomarkers of oxidative stress, and an increase in growth and yield traits, relative leaf water content, membrane stability index, photosynthetic efficiency, nutrient content, and K+/Na+ ratio. In another study [25], the application of a microbiological biostimulant including Rhizophagus intraradices and Trichoderma atroviride individually or in conjunction with plant-derived protein hydrolysates resulted in an increase in chlorophyll content and photochemical yield of PSII, as well as a better nutritional status of lettuce leaf tissue. The improved crop yield was due to better architecture of the root system, enhanced chlorophyll synthesis, and improved proline storage.
According to Ahmad et al. [26], one of the strategies for alleviating salt stress is to apply natural extracts of plants in place of artificial fertilizers, thus reducing water, soil, and environmental pollution. Plant biostimulants are substances that have positive effects on plant growth and nutrition and enhance tolerance to both biotic and abiotic stresses. A biostimulant can be an organic material and/or microorganism used to increase nutrient uptake, stimulate growth, and improve stress tolerance or yield quality [27]. Since these substances are rich in bioactive compounds including carotenoids, flavonoids, and phenols, they effectively regulate redox metabolism thus developing plant growth and yield. Biostimulants enhance plant tolerance to salinity mainly through the modulation of signaling signatures and pathways and regulation of redox machinery [26].
The objective of this research is to identify of the impact of foliar application of biostimulants on the physiological processes (relative chlorophyll content, chlorophyll a fluorescence, and gas exchange parameters) in M. sinensis plants exposed to soil salinity stress. It is hypothesized that the use of biostimulants will have an impact on alleviating the effects of salt stress.

2. Materials and Methods

2.1. Pot Experiment Design

Pot experiments on M. sinensis plants were conducted under laboratory conditions. Miscanthus seeds were sown into multi pots, and, after germination, the seedlings were transplanted into 15 × 15 cm plastic pots, in which soil with a slightly acid reaction and a granulometric composition of loamy sand with (pH: KCl 6.35; H2O 6.52) was placed [28]. The experiment was conducted in four replicates in a phytotron (Model GC-300/1000, JEIO Tech Co., Ltd., Seoul, South Korea) at a temperature of 22 ± 2 °C, humidity of 60 ± 3% RH, photoperiod of 16/8 h (L/D), and a maximum light intensity of 300 µE m−2 s−1. In the experiment, the position of the pots was changed weekly. After the plants reached the tillering stage (approx. 8 months after sowing M. sinensis seeds), they were watered with aqueous solutions of neutral salt (NaCl) at concentrations of 200 and 400 mM at a rate of 100 mL per pot. In the control trial, the plants were watered with demineralized water of the same volume (100 mL). The application of salt solutions was followed by spraying M. sinensis plants with various biostimulants: BioFol Bombardino, Quantis®, Biofol Plex, and Megafol using a hand sprayer. The characteristics of biostimulants are specified in Table 1.
The variants of the experiment were:
  • Control
  • S1—200 mM NaCl
  • S2—400 mM NaCl
  • B1—Bombardino
  • B2—Quantis
  • B3—BiofolPlex
  • B4—Megafol
  • S1 + B1—200 mM NaCl + BioFol Bombardino
  • S2 + B1—400 mM NaCl + BioFol Bombardino
  • S1 + B2—200 mM NaCl + Quantis®
  • S2 + B2—400 mM NaCl + Quantis®
  • S1 + B3—200 mM NaCl + BiofolPlex
  • S2 + B3—400 mM NaCl + BiofolPlex
  • S1 + B4—200 mM NaCl + Megafol
  • S2 + B4—400 mM NaCl + Megafol

2.2. Physiological Measurement

Physiological measurements were taken twice on fully expanded leaves on the first and the seventh day after spraying: Term I—the 1st day after biostimulant application, Term II—the 7th day after biostimulant application.

2.2.1. Relative Chlorophyll Content

A CCM-200plus portable chlorophyll meter (Opti-Sciences, Hudson, NH, USA) was used to determine relative chlorophyll content. Measurements were performed on 5 fully expanded leaves per pot.

2.2.2. Chlorophyll Fluorescence

A Pocket PEA portable fluorimeter (Pocket PEA, Hansatech Instruments, King’s Lynn, Norfolk, UK) was used to measure chlorophyll fluorescence parameters. Specialized leaf clips were used to adapt the plants to darkness for a period of 30 min [29]. The fluorescence signal has been collected in red actinic light with a light source peak wavelength of 627 nm and was used for 1 s at the maximum intensity available of 3500 μmol photosynthetically active radiation (PAR) m−2 s−1. Chlorophyll fluorescence was measured on 4 fully developed leaves per pot. The following parameters were determined during the measurements: the maximum quantum yield of primary photochemistry (Fv/F0), the photochemical efficiency of PS II (Fv/Fm), and the performance index of PS II (PI).

2.2.3. Gas Exchange

Gas exchange was metered using an LC pro-SD apparatus (ADC Bioscientific Ltd., Herts, UK) on two fully developed leaves per pot. During the measurement, the intensity of light inside the measurement chamber was 1500 mol∙m−2∙s−1, while the temperature was 22 °C. During gas exchange measurements, the following parameters were determined: net photosynthetic rate (PN), transpiration rate (E), stomatal conductance (gs), and intercellular CO2 concentration (Ci).

2.3. Statistical Analysis

The results obtained in the experiment were tested to statistical analysis using Statistica 13.3.0 (TIBCO Software Inc., Palo Alto, CA, USA). The Shapiro–Wilk test was performed to check the normality of the distribution at p = 0.05, followed by a two-factor (two-way) ANOVA with repeated measurements (time assessment as a factor). Tukey’s post hoc test was used to determine and verify the relationship at a significance level of p ≤ 0.05.

3. Results

3.1. Relative Chlorophyll Content

The application of salt stress to S1 and S2 in Term I reduced chlorophyll content compared to the control by 18.3 and 49.0%, respectively (Figure 1). Term II, on the other hand, showed no significant difference (p = 0.000) between S1 and the control. There were no differences in the value of the studied parameter between B1 and B2 and B3 and B4 variants. However, higher chlorophyll content was shown between B2, B3, and B4 in Term I (p = 0.000), and no differences between the biostimulants in Term II. The use of biostimulators in variants in which salt stress occurred alleviated its effects and increased the value of the tested parameter. In Term I, in the case of variants S1 + B1, S1 + B2, and S1 + B3, the chlorophyll content was at the control level. However, in Term II, such a relationship was found in variants S1 + B2, S1 + B3, and S1 + B4. Most of the analyzed variants showed an increasing tendency in the chlorophyll content in Term II. However, a significant increase about Term I was demonstrated only in the variants: S2, S2 + B1, S2 + B2S1 + B3, and S1 + B4. In Term II, an increase in chlorophyll content was observed in the variants with biostimulants compared to the S2 variant, but a significant difference was demonstrated only in S2 + B1 (5.5% increase).

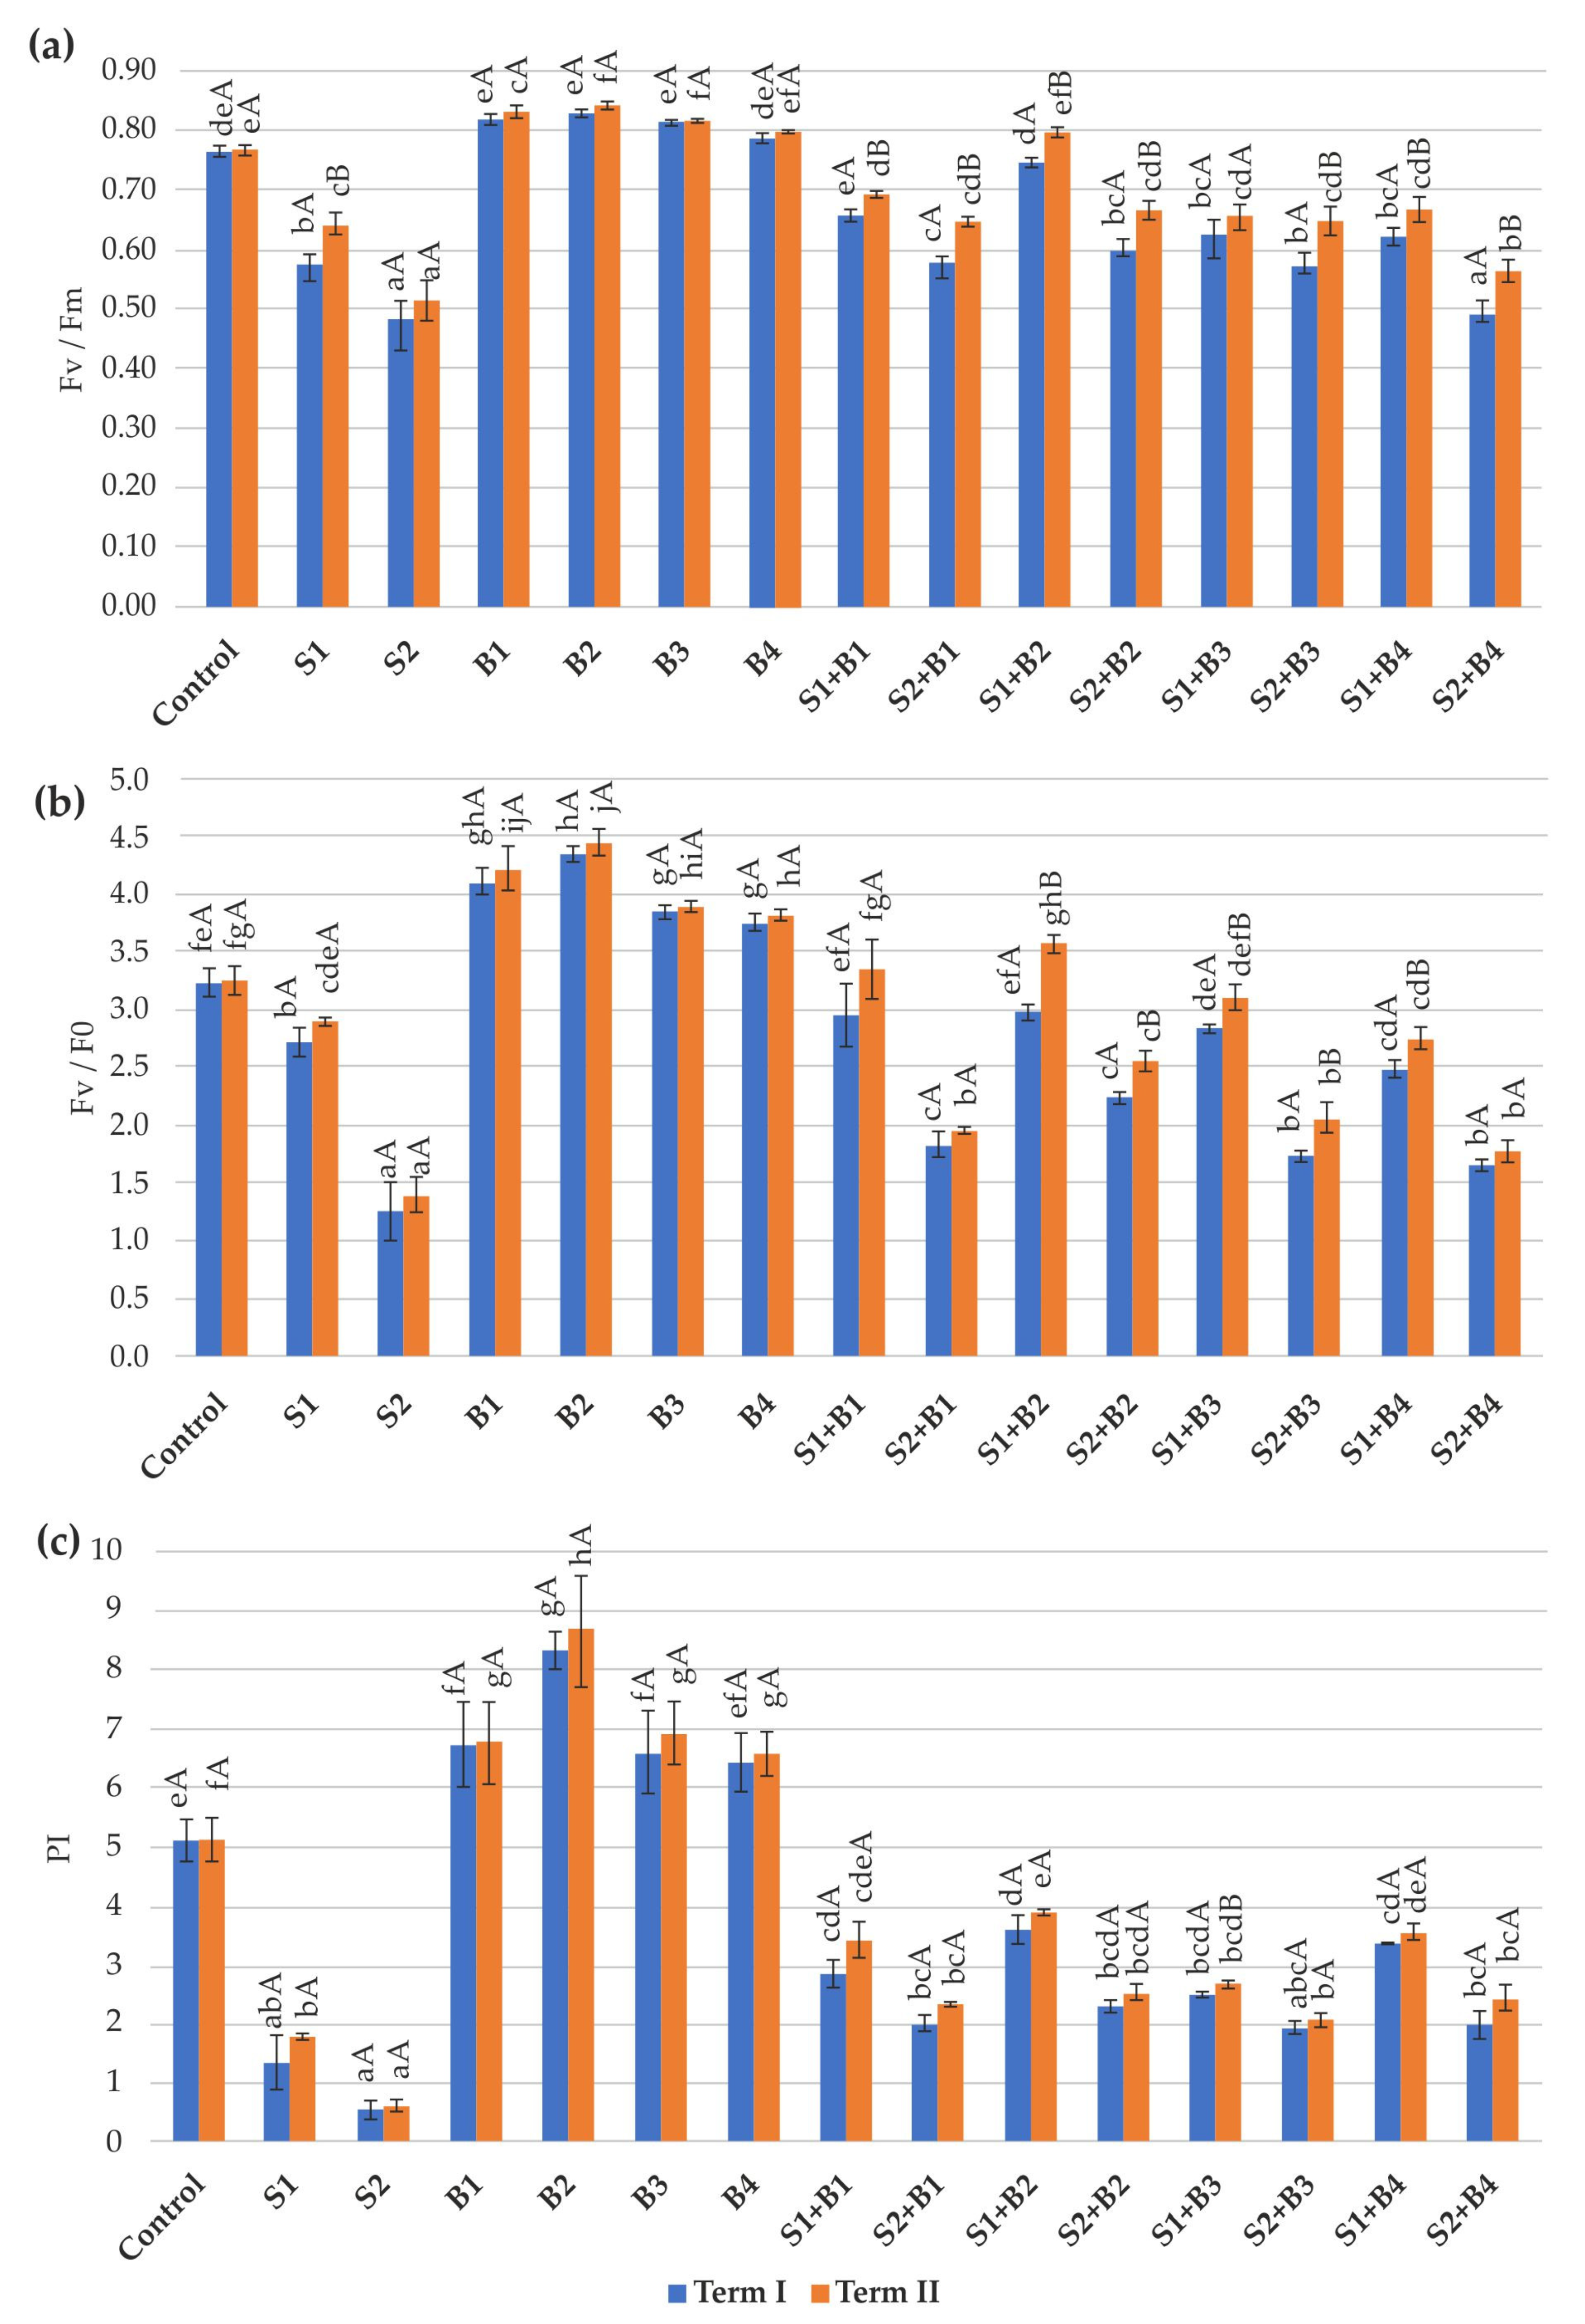
3.2. Chlorophyll Fluorescence

Salt stress in both Term I (p = 0.000) and Term II (p = 0.000) caused a significant decrease in Fv/Fm values (Figure 2a). Relative to the control, the decrease was 32.9% (Term I), 19.5% (Term II) with the S1 variant, 58.5% (Term I), and 48.6% (Term II) with the S2 variant. The application of biostimulants demonstrated a significant increase in Fv/Fm values in comparison to the control only in Term II, after spraying with biostimulants B1, B2, and B3. After biostimulants on plants growing under salt stress, the Fv/Fm value was at the control level only in the case of the S1 + B2 variant (Term I and II). In variants, S1 + B3, S1 + B4 (Term I and II) and S2 + B4 (Term II). The use of the biostimulator did not result in a significant increase in the Fv/Fm value compared to the variants in which the same concentration of salt was applied. In Term II, variants S1, S1 + B1, S2 + B1, S1 + B2, S2 + B2, S2 + B3, S1 + B4, and S2 + B4 showed a value increase in the tested parameter compared to Term I.
Soil salinity resulted in a decrease in Fv/F0 values compared to the control, except for the S1 variant in Term II (for both Terms p = 0.000) (Figure 2b). The lowest decline, which amounted to 157.9% in Term I and 133.1% in Term II, was demonstrated in the S2 variant. The use of biostimulants resulted in an increase in the Fv/F0 value compared to the control in both Term I and Term II. After the application of biostimulants, in the variants with saline soil (S1 + B1 and S1 + B2 in Term I and II and S1 + B3 in Term II), an increase in the Fv/F0 value to the control level was shown. In Term II, variants S1 + B3 and S1 + B4 showed no improvement in Fv/F0 values due to spraying with biostimulants. Measurements carried out in Term II generally showed an enhancement in the value of the tested parameter compared to Term I. However, significant differences were observed only in the variants with saline soil and biostimulants (S1 + B2, S2 + B2, S1 + B3, S2 + B3, and S1 + B4).
Salt stress caused a significant decrease in PI values, compared to the control (for both Terms p = 0.000) (Figure 2c). With salt S1 application, the PI value was only 1.355 (Term I) and 0.530 (Term II), while salt S2 was 0.532 (Term I) and 0.600 (Term II). The application of biostimulants resulted in a significant increase in PI values compared to the control, except for biostimulant B4 applied in Term I. In the variants with saline soil, spraying with biostimulants increased PI values, but did not reach the level of the control in any of the analyzed variants. In the case of variants S1 + B3 (Term I and II) and S2 + B3 (Term I), no increase in values was observed compared to variants without biostimulants. Most of the analyzed variants showed an increasing tendency measured during Term II compared to Term I. However, only in the case of variants S2 + B1 and S1 + B3, this increase was statistically significant.

3.3. Gas Exchange

For the parameter Ci, a significant increase in its value was demonstrated in comparison to the control due to salt stress (Figure 3a). This increase was 86.5% (S1) and 118.2% (S2) in Term I (p = 0.000) and 115.8% (S1) and 144.2% (S2) in Term II (p = 0.000). As a result of spraying with biostimulants, there was a decreasing tendency in the value of the tested indicator compared to the control, but these values were not statistically significant. After treatment of plants growing under salt stress conditions with biostimulants, all variants showed a decrease in Ci values compared to variants without biostimulants. However, the control level was reached only in the S1 + B2 variant (Terms I and II). In Term I, higher Ci values were shown for the tested variants compared to Term II. However, they were statistically significant only for the control, S2, S1 + B1, S1 + B2, and S1 + B3.
In comparison to the control, a significant decrease in E values was observed in plants growing in salt stress conditions (for both Terms p = 0.000), which was 53.8% (S1) and 62.2% (S2) in Term I and 45.4% (S1) and 57.3% (S2) in Term II (Figure 3b). After spraying with biostimulants, there was an upward trend in E values compared to the control. However, only the biostimulant B2 in Term II showed a significant increase of 21.1% in E values compared to the control. Spraying with biostimulants also increased the value of the parameter under study and reached the control level in the S1 + B2 and S1 + B4 variants in Terms I and II. Variants S1 + B1, S2 + B2, and S2 + B3 in Term II and variant S2 + B4 in Terms I and II showed a significant increase in E values compared to variants with salt stress without biostimulant application. Only in the case of variants S1 + B2 and S2 + B2, no significant increase in the value of the studied parameter was observed in Term II.
As a consequence of soil salinization, a significant decrease in gs values was shown in relation to the control (for both Terms p = 0.000) (Figure 3c). The application of salt S2 resulted in a decrease in the value of the studied indicator by 72.2% (Term I) and 67.0% (Term II). Spraying M. sinensis plants with biostimulants did not result in an increase in Ci values compared to the control. However, under salt stress conditions after the application of biostimulants, an increase in gs values to the control level was shown for the S1 + B2 variant compared to the variant without biostimulants. On the other hand, the rest of the variants did not show a significant increase in the value of the studied indicator except for S1 + B1 and S1 + B3 (Term II). Compared to the variants in which no biostimulant was applied, the increase was 100.0% (S1 + B1) and 103.0% (S1 + B3). Although in most of the analyzed variants, an increase in gs values was observed in Term II, but only in the case of the variant S2 + B3 it was statistically significant.
The salt stress application caused a decrease in Pn values relative to the control (for both Terms p = 0.000) (Figure 3d). It amounted in Term I to 59.1% (S1) and 71.6% (S2), while in Term II to 58.9% (S1) and 68.0% (S2). The treatment of biostimulant spraying resulted in a significant increase in the value of the studied indicator compared to the control except for biostimulant B4 (Term I). Spraying with biostimulants promoted an increase in Pn values in the variants where salt stress was applied. In the case of variants S1 + B1, S1 + B2, and S1 + B3 (Term I and II) and variant S1 + B4 (Term II), the Pn value was at the control level. In contrast, the S2 + B1, S2 + B2, and S2 + B3 variants (Term I) and the S2 + B4 variants (Term I and II) did not demonstrate significant differences between the variants without the biostimulant. No significant changes were shown in the value of the studied indicator between Terms I and II.

4. Discussion

Salt stress is a significant problem in plant cultivation. In the initial stage, salt stress is seen by the root system as causing osmotic stress due to reduced water availability. At a later stage, salt stress induces ionic toxicity caused by nutrient imbalances in the cytosol [30].
In the conducted experiment, there was a decrease in the values of the studied parameters of chlorophyll content and fluorescence (Fv/Fm, Fv/F0, and PI) and gas exchange (E, gs, and Pn) caused by soil salinity.
Photosynthesis is an important biological process in plants that determines life on Earth. Soil salinity significantly affects the photosynthetic process. As a consequence of salt stress, the photosynthetic pigments, photosystems, and enzymes engaged in carbon metabolism can be damaged [31,32]. The decrease in chlorophyll content, on the other hand, can be explained by the inhibition of several steps in porphyrin formation and a decrease in chlorophyll-binding proteins [33].
Analysis of chlorophyll a fluorescence parameters is an important tool used in plant physiological research, which can provide valuable information about the state of PSII [29]. Such studies can be particularly useful for quantifying injury to the photosynthetic apparatus as a result of various stress factors, which allows us to determine photosystem II (PS II) damage [34,35]. In salt stress treatment, the decline in chlorophyll fluorescence parameters was noted in the present study. In particular, in the case of the PI parameter, which is a very significant and responsive index of photosynthesis, a significant decrease in its values was recorded about the control. A similar relationship was also obtained in the studies of Metha et al. [35] and Jańczak-Pieniążek et al. [36] in which salt stress was applied to wheat plants. Salt stress causes restrictions in the conductivity of stomata as a result of their closure, leading to inhibition of CO2 absorption and stimulation of huge energy levels. This is the cause of an increase in the amount of reactive oxygen species (ROS) [37], which leads to oxidative stress due to their overproduction and lack of balance between defense mechanisms. The decrease in chlorophyll content and the value of chlorophyll fluorescence parameters may result from disturbances in the cell membrane permeability and the functioning of thylakoids in chloroplasts. This leads to a gradual decline in the activity of photosystems [38,39]. Physiological process inhibition associated with overaccumulation of Na+ and Cl ions, which reduces photosynthetic electron transport and photosynthetic efficiency [40]. As a result, this leads to a significant inhibition of plant growth and reduces the yield level. Under salt stress, plants have developed several cellular and tissue level mechanisms to avoid its effects. These mechanisms involve alterations in stomatal conductance, hormonal balance, antioxidant defense system, osmotic regulation, and ion exclusion [37,41,42].
In the short term, salinity causes a reduction in stomatal restrictions resulting in a decrease in CO2 assimilation. On the other hand, in the long term, salt stress leads to a decrease in chlorophyll and carotenoids due to salt storage in young leaves [30,43]. In addition, as a consequence of the decrease in CO2 assimilation, the activity of the Rubisco enzyme that converts CO2 into high-energy substances decreases [44]. In the presented studies, an increase in substrate salinity increased the intercellular CO2 concentration (Ci), which shows a decline in the CO2 attachment capacity in the Calvin–Benson cycle [45]. A similar plant response to stress was observed in other crop species. For example, an increase in Ci with a concomitant decrease in Pn, gs, and E was observed in potato under stress conditions caused by plant exposure to ozone (O3) [46] and spraying with hydrogen peroxide (H2O2) [47].
Plants, due to constant exposure to biotic and abiotic stresses, have adapted and remodeled their defense system, which helps them respond to constantly changing environmental conditions [48]. In the study, most of the analyzed cases showed an enhancement in the values of chlorophyll content and fluorescence indicators and gas exchange in Term II. A comparable relation was achieved in the case of study of Jańczak-Pieniążek et al. [36] conducted on wheat seedlings. A higher value of these indices was obtained at successive measurement dates. This demonstrates the activation of defense mechanisms that counteract the effects of stress by reducing the production of ROS and scavenging them [41,49]. The antioxidant system is then activated, consisting of enzymatic (including superoxide dismutase, ascorbate peroxidase, guaiacol peroxidase, and catalase) and non-enzymatic (including flavonoids, carotenoids, tocopherols) antioxidants [50,51].
The yield losses are mainly due to drought and soil salinization caused by climate change and agricultural intensification leading to soil degradation. Plant defense strategies can be improved and sensitized using chemical and biological treatments. As a result of this process, the plant-based immune system and defense mechanisms are pre-conditioned, which results in faster and more efficiency defense and resistance mechanisms to later biotic and abiotic stresses. Some substances of natural origin have positive effects on plant development [52,53,54,55]. To this end, the use of biostimulants is recommended as a means of protecting plants from environmental stresses [56]. The function of biostimulants is to promote growth and development of plant by improvement of plant metabolism efficiency to increase crop growth and improve yield quality, increase tolerance to abiotic stresses, facilitate assimilation, translocation, and utilization of nutrients, etc. Biostimulants are divided into categories: microbial modifiers, humic acids, fulvic acids, protein hydrolysates and amino acids, and seaweed extracts [56,57,58]. The use of plant biostimulants is fast becoming popular in agriculture. In the past decade, the plant biostimulant domain has been growing steadily and has become one of the key strategies for increasing crop production and immunity to a changing climate. In addition to increasing stress tolerance, biostimulants effectively regulate several plant physiological processes [59]. This was also demonstrated in this study, which found an increase in the values of the physiological indicators tested as a result of the application of biostimulants both in the case of variants without salinity and in which salt stress was applied. The effects of salt stress were best alleviated by foliar spraying of plants with Quantis, which contains, among others, potassium (K) and calcium (Ca). K is a crucial macronutrient that controls growth and development by changing physiological and biochemical indicators. This element influences the osmolyte accumulation and increases antioxidant components in plants subjected to water and salt stress [60]. Soil salinity stress causes rapid depolarization of the cell membrane, activating voltage-gated GORK channels and causing K+ efflux. ROS accumulation under salinity conditions may subsequent mobilization GORK and ROS-activated NSCC channels, inducing greater K+ efflux. This, in turn, results in fast loosing of K+ from the cytosol, which impairs the homeostasis of the cytosolic Na+/K+ ratio [61]. Ca is also fundamental to plant physiology. It affects the maintenance of ionic homeostasis on an intracellular scale [62]. Of the biostimulants used in the experiments, in most of the analyzed physiological parameters, in general, their lowest values were obtained after Megafol application. It is hard to say exactly why. This biostimulator contains proline, which ensures the appropriate rate of photosynthesis under various stress conditions. It helps maintain the water content in the cell, protects photosynthetic units against the harmful effects of high-energy free electrons, protects the cell membrane by lipid peroxidation inhibition, and increases the level of various antioxidant enzymes and non-enzymatic compounds [63]. Extended research is necessary to understand the basic mechanisms responsible for these effects.

5. Conclusions

The study showed that soil salinity stress is resulting in a decrease in the values of most of the tested physiological indicators (except Ci). The application of spraying with biostimulants, especially Quantis (B2), caused in an enhancement in the values of the studied physiological indices both for plants being grown in optimal conditions and under salt stress. The second measurement term (Term II) showed an increasing trend for most of the analyzed parameters compared to the first measurement term (Term I), suggesting plant acclimatization to stress conditions. Based on the experiment, it was proved that the use of biostimulants can be an innovation in crops and allows to alleviate the negative impacts due to salt stress. This knowledge can contribute to the implementation of sustainable practices in crop production in the future. However, further investigations are needed on the effects of biostimulants on different plant species grown under different environmental conditions and/or different degrees of salinity stress.

Author Contributions

Conceptualization, M.J.-P. and R.P.; methodology, M.J.-P. and E.S.-K.; validation, M.J.-P. and E.S.-K.; formal analysis, M.J.-P.; investigation, M.J.-P., W.P., R.P., B.D. and E.S.-K.; data curation, M.J.-P.; writing—original draft preparation, M.J.-P.; writing—review and editing, M.J.-P. and E.S.-K.; visualization, M.J.-P.; supervision, E.S.-K. All authors have read and agreed to the published version of the manuscript.

Funding

Financial resources of the Ministry of Science and Higher Education for scientific activities of the Institute of Agricultural Sciences, Land Management and Environmental Protection, University of Rzeszow.

Institutional Review Board Statement

Not applicable.

Data Availability Statement

The datasets used and/or analyzed in the current study are available from the author upon reasonable request.

Conflicts of Interest

The authors declare no conflicts of interest.

References

  1. Alemán-Ramirez, J.L.; Okoye, P.U.; Torres-Arellano, S.; Mejía-Lopez, M.; Sebastian, P.J. A review on bioenergetic applications of Leucaena leucocephala. Ind. Crops Prod. 2022, 182, 114847. [Google Scholar] [CrossRef]
  2. Núñez-Regueiro, M.M.; Siddiqui, S.F.; Fletcher, R.J., Jr. Effects of bioenergy on biodiversity arising from land-use change and crop type. Conserv. Biol. 2019, 35, 77–87. [Google Scholar] [CrossRef] [PubMed]
  3. Mattioli, A.; Boscaro, D.; Dalla Venezia, F.; Santacroce, F.C.; Pezzuolo, A.; Sartori, L.; Bolzonella, D. Biogas from residual grass: A territorial approach for sustainable bioenergy production. Waste Biomass Valoriz. 2017, 8, 2747–2756. [Google Scholar] [CrossRef]
  4. Chiumenti, A.; Boscaro, D.; Da Borso, F.; Sartori, L.; Pezzuolo, A. Biogas from fresh spring and summer grass: Effect of the harvesting period. Energies 2018, 11, 1466. [Google Scholar] [CrossRef]
  5. Ferrari, G.; Pezzuolo, A.; Nizami, A.-S.; Marinello, F. Bibliometric analysis of trends in biomass for bioenergy research. Energies 2020, 13, 3714. [Google Scholar] [CrossRef]
  6. Oleszek, M.; Matyka, M. Nitrogen fertilization level and cutting affected lignocellulosic crops properties important for biogas production. BioResources 2017, 12, 8565–8580. [Google Scholar] [CrossRef]
  7. Helis, M.; Strzelczyk, M.; Golimowski, W.; Steinhoff-Wrześniewska, A.; Paszkiewicz-Jasińska, A.; Hawrot-Paw, M.; Koniuszy, A.; Hryniewicz, M. Biomass potential of the marginal land of the polish Sudetes mountain range. Energies 2021, 14, 7156. [Google Scholar] [CrossRef]
  8. Khanna, M.; Chen, L.; Basso, B.; Cai, X.; Field, J.L.; Guan, K.; Jiang, C.; Lark, T.J.; Richard, T.L.; Spawn-Lee, S.A.; et al. Redefining marginal land for bioenergy crop production. GCB Bioenergy 2021, 13, 1590–1609. [Google Scholar] [CrossRef]
  9. Li, W.; Ciais, P.; Stehfest, E.; van Vuuren, D.; Popp, A.; Arneth, A.; Di Fulvio, F.; Doelman, J.; Humpenöder, F.; Harper, A.B.; et al. Mapping the yields of lignocellulosic bioenergy crops from observations at the global scale. Earth Syst. Sci. 2020, 12, 789–804. [Google Scholar] [CrossRef]
  10. Lewandowski, I.; Scurlock, J.M.O.; Lindvall, E.; Christou, M. The development and current status of perennial rhizomatous grasses as energy crops in the US and Europe. Biomass Bioenergy 2003, 25, 335–361. [Google Scholar] [CrossRef]
  11. Stewart, J.R.; Toma, Y.; Fernández, F.G.; Nishiwaki, A.; Yamada, T.; Bollero, G. The ecology and agronomy of Miscanthus sinensis, a species important to bioenergy crop development, in its native range in Japan: A review. GCB Bioenergy 2009, 1, 126–153. [Google Scholar] [CrossRef]
  12. Quinn, L.D.; Allen, D.J.; Stewart, J.R. Invasiveness potential of Miscanthus sinensis: Implications for bioenergy production in the United States. GCB Bioenergy 2010, 2, 310–320. [Google Scholar] [CrossRef]
  13. Sun, Q.; Yamada, T.; Han, Y.; Takano, T. Influence of salt stress on C4 photosynthesis in Miscanthus sinensis Anderss. Plant Biol. 2020, 23, 44–56. [Google Scholar] [CrossRef] [PubMed]
  14. Nie, G.; Zhong, M.; Cai, J.; Yang, X.; Zhou, J.; Appiah, C.; Tang, M.; Wang, X.; Feng, G.; Huang, L.; et al. Transcriptome characterization of candidate genes related to chromium uptake, transport and accumulation in Miscanthus sinensis. Ecotoxicol. Environ. Saf. 2021, 221, 112445. [Google Scholar] [CrossRef] [PubMed]
  15. Way, D.A.; Katul, G.G.; Manzoni, S.; Vico, G. Increasing water use efficiency along the C3 to C4 evolutionary pathway: A stomatal optimization perspective. J. Exp. Bot. 2014, 65, 3683–3693. [Google Scholar] [CrossRef] [PubMed]
  16. Hatfield, J.L.; Dold, C. Water-use efficiency: Advances and challenges in a changing climate. Front. Plant Sci. 2019, 10, 103. [Google Scholar] [CrossRef] [PubMed]
  17. Fang, P.; Ren, L.L.; Zhang, L.T.; Gao, H.Y. Inhibition effects of salt stress on photosynthetic activity of RumexK-1. Chin. J. Appl. Ecol. 2008, 10, 2137–2142. [Google Scholar]
  18. Zhang, H.; Xu, N.; Wu, X.; Wang, J.; Ma, S.; Li, X.; Sun, G. Effects of four types of sodium salt stress on plant growth and photosynthetic apparatus in sorghum leaves. J. Plant Interact. 2018, 13, 506–513. [Google Scholar] [CrossRef]
  19. Gupta, B.; Huang, B. Mechanism of salinity tolerance in plants: Physiological, biochemical, and molecular characterization. Int. J. Genom. 2014, 2014, 701596. [Google Scholar] [CrossRef]
  20. Corwin, D.L. Climate change impacts on soil salinity in agricultural areas. Eur. J. Soil Sci. 2021, 72, 842–862. [Google Scholar] [CrossRef]
  21. Shahid, S.A.; Zaman, M.; Heng, L. Soil Salinity: Historical Perspectives and a World Overview of the Problem. In Guideline for Salinity Assessment, Mitigation and Adaptation Using Nuclear and Related Techniques; Springer: Cham, Switzerland, 2018. [Google Scholar] [CrossRef]
  22. Singh, A. Soil salinity: A global threat to sustainable development. Soil Use Manag. 2022, 38, 39–67. [Google Scholar] [CrossRef]
  23. Oyiga, B.C.; Sharma, R.C.; Shen, J.; Baum, M.; Ogbonnaya, F.C.; Léon, J.; Ballvora, A. Identification and Characterization of Salt Tolerance of Wheat Germplasm Using a Multivariable Screening Approach. J. Agron. Crop Sci. 2016, 202, 472–485. [Google Scholar] [CrossRef]
  24. Desoky, E.M.; EL-Maghraby, L.M.M.; Awad, A.E.; Abdo, A.I.; Rady, M.M.; Semida, W.M. Fennel and ammi seed extracts modulate antioxidant defense system and alleviate salinity stress in cowpea (Vigna unguiculata). Sci. Hortic. 2020, 272, 109576. [Google Scholar] [CrossRef]
  25. Rouphael, Y.; Cardarelli, M.; Bonini, P.; Colla, G. Synergistic Action of a Microbial-based Biostimulant and a Plant Derived-Protein Hydrolysate Enhances Lettuce Tolerance to Alkalinity and Salinity. Front. Plant Sci. 2017, 8, 131. [Google Scholar] [CrossRef] [PubMed]
  26. Ahmad, A.; Blasco, B.; Martos, V. Combating salinity through natural plant extracts based biostimulants: A Review. Front. Plant Sci. 2022, 13, 862034. [Google Scholar] [CrossRef] [PubMed]
  27. Van Oosten, M.J.; Pepe, O.; De Pascale, S.; Silletti, S.; Maggio, A. The role of biostimulants and bioeffectors as alleviators of abiotic stress in crop plants. Chem. Biol. Technol. Agric. 2017, 4, 5. [Google Scholar] [CrossRef]
  28. IUSS Working Group WRB. International soil classification system for naming soils and creating legends for soil maps. In Word Reference Base for Soil Resources 2014, Update 2015; Word Soil Resources Reports No. 106; FAO: Rome, Italy, 2015; pp. 172–173. [Google Scholar]
  29. Maxwell, K.; Johnson, G.N. Chlorophyll fluorescence—A practical guide. J. Exp. Bot. 2000, 51, 659–668. [Google Scholar] [CrossRef]
  30. Acosta-Motos, J.R.; Ortuño, M.F.; Bernal-Vicente, A.; Diaz-Vivancos, P.; Sanchez-Blanco, M.J.; Hernandez, J.A. Plant responses to salt stress: Adaptive mechanisms. Agronomy 2017, 7, 18. [Google Scholar] [CrossRef]
  31. Tsai, Y.-C.; Chen, K.-C.; Cheng, T.-S.; Lee, C.; Lin, S.-H.; Tung, C.-W. Chlorophyll fluorescence analysis in diverse rice varieties reveals the positive correlation between the seedlings salt tolerance and photosynthetic efficiency. BMC Plant Biol. 2019, 19, 403. [Google Scholar] [CrossRef]
  32. Tobiasz-Salach, R.; Mazurek, M.; Jacek, B. Physiological, Biochemical, and Epigenetic Reaction of Maize (Zea mays L.) to cultivation in conditions of varying soil salinity and foliar application of silicon. Int. J. Mol. Sci. 2023, 24, 1141. [Google Scholar] [CrossRef]
  33. Abdelkader, A.F.; Aronsson, H.; Sundqvist, C. High salt stress in wheat leaves causes retardation of chlorophyll accumulation due to a limited rate of protochlorophyllide formation. Physiol. Plant. 2007, 130, 157–166. [Google Scholar] [CrossRef]
  34. Abdeshahian, M.; Nabipour, M.; Meskarbashee, M. Chlorophyll fluorescence as criterion for the diagnosis salt stress in wheat (Triticum aestivum) plants. World Acad. Sci. Eng. Technol. 2010, 71, 569–571. [Google Scholar] [CrossRef]
  35. Mehta, P.; Jajoo, A.; Mathur, S.; Bharti, S. Chlorophyll a fluorescence study revealing effects of high salt stress on Photosystem II in wheat leaves. Plant Physiol. Biochem. 2010, 48, 16–20. [Google Scholar] [CrossRef] [PubMed]
  36. Jańczak-Pieniążek, M.; Migut, D.; Piechowiak, T.; Balawejder, M. Assessment of the impact of the application of a quercetin—Copper complex on the course of physiological and biochemical processes in wheat plants (Triticum aestivum L.) growing under saline conditions. Cells 2022, 11, 1141. [Google Scholar] [CrossRef] [PubMed]
  37. Seleiman, M.F.; Aslam, M.T.; Alhammad, B.A.; Hassan, M.U.; Maqbool, R.; Chattha, M.U.; Khan, I.; Gitari, H.I.; Uslu, O.S.; Roy, R.; et al. Salinity stress in wheat: Effects, mechanisms and management strategies. Phyton-Int. J. Exp. Bot. 2021, 91, 337. [Google Scholar] [CrossRef]
  38. Murata, N.; Takahashi, S.; Nishiyama, Y.; Allakhverdiev, S.I. Photoinhibition of photosystem II under environmental stress. Biochim. Biophys. Acta (BBA) Bioenerg. 2007, 1767, 414–421. [Google Scholar] [CrossRef]
  39. Wang, R.L.; Hua, C.; Zhou, F.; Zhou, Q.-C. Effects of NaCl stress on photochemical activity and thylakoid membrane polypeptide composition of a salt-tolerant and a salt-sensitive rice cultivar. Photosynthetica 2009, 47, 125–127. [Google Scholar] [CrossRef]
  40. Zw, S.; Lk, R.; Jw, F.; Li, Q.; Kj, W.; Mm, G.; Wang, L.; Li, J.; Gx, Z.; Zy, Y.; et al. Salt response of photosynthetic electron transport system in wheat cultivars with contrasting tolerance. Plant Soil Environ. 2016, 62, 515–521. [Google Scholar] [CrossRef]
  41. Kumari, A.; Parida, A. Metabolomics and network analysis reveal the potential metabolites and biological pathways involved in salinity tolerance of the halophyte Salvadora persica. Environ. Exp. Bot. 2018, 148, 85–99. [Google Scholar] [CrossRef]
  42. De Freitas, P.A.F.; De Carvalho, H.H.; Costa, J.H.; Miranda, R.D.S.; Saraiva, K.D.D.C.; De Oliveira, F.D.B.; Coelho, D.G.; Prisco, J.T.; Gomes-Filho, E. Salt acclimation in sorghum plants by exogenous proline: Physiological and biochemical changes and regulation of proline metabolism. Plant Cell Rep. 2019, 38, 403–416. [Google Scholar] [CrossRef]
  43. Munns, R.; Tester, M. Mechanisms of salinity tolerance. Ann. Rev. Plant Biol. 2008, 59, 651–681. [Google Scholar] [CrossRef] [PubMed]
  44. Wang, Y.; Stevanato, P.; Yu, L.; Zhao, H.; Sun, X.; Sun, F.; Li, J.; Geng, G. The physiological and metabolic changes in sugar beet seedlings under different levels of salt stress. J. Plant Res. 2017, 130, 1079–1093. [Google Scholar] [CrossRef] [PubMed]
  45. Degl’Innocenti, E.; Guidi, L.; Soldatini, G. Effect of Chronic O3 Fumigation on the Activity of Some Calvin Cycle Enzymes in Two Poplar Clones. Photosynthetica 2002, 40, 121–126. [Google Scholar] [CrossRef]
  46. Szpunar-Krok, E.; Jańczak-Pieniążek, M.; Migut, D.; Skrobacz, K.; Piechowiak, T.; Pawlak, R.; Balawejder, M. Physiological and biochemical properties of potato (Solanum tuberosum L.) in response to ozone-induced oxidative stress. Agronomy 2020, 10, 1745. [Google Scholar] [CrossRef]
  47. Szpunar-Krok, E.; Jańczak-Pieniążek, M.; Skrobacz, K.; Bobrecka-Jamro, D.; Balawejder, M. Response of potato (Solanum tuberosum L.) plants to spraying by hydrogen peroxide. Sustainability 2020, 12, 2469. [Google Scholar] [CrossRef]
  48. Stael, S.; Rocha, A.G.; Robinson, A.J.; Kmiecik, P.; Vothknecht, U.C.; Teige, M. Arabidopsis calcium-binding mitochondrial carrier proteins as potential facilitators of mitochondrial ATP-import and plastid SAM-import. FEBS Lett. 2011, 585, 3935–3940. [Google Scholar] [CrossRef]
  49. Caverzan, A.; Casassola, A.; Brammer, S.P. Antioxidant responses of wheat plants under stress. Genet. Mol. Biol. 2016, 39, 1–6. [Google Scholar] [CrossRef]
  50. Mittler, R. Oxidative stress, antioxidants and stress tolerance. Trends Plant Sci. 2002, 7, 405–410. [Google Scholar] [CrossRef]
  51. Muhammad, I.; Shalmani, A.; Ali, M.; Yang, Q.-H.; Ahmad, H.; Li, F.B. Mechanisms regulating the dynamics of photosynthesis under abiotic stresses. Front. Plant Sci. 2021, 11, 615942. [Google Scholar] [CrossRef]
  52. Calvo, P.; Nelson, L.; Kloepper, J.W. Agricultural uses of plant biostimulants. Plant Soil. 2014, 383, 3–41. [Google Scholar] [CrossRef]
  53. Balmer, A.; Pastor, V.; Gamir, J.; Flors, V.; Mauch-Mani, B. The “prime-ome”: Towards a holistic approach to priming. Trends Plant Sci. 2015, 20, 443–452. [Google Scholar] [CrossRef] [PubMed]
  54. Borges, A.A.; Jiménez-Arias, D.; Expósito-Rodríguez, M.; Sandalio, L.M.; Pérez, J.A. Priming crops against biotic and abiotic stresses: MSB as a tool for studying mechanisms. Front. Plant Sci. 2014, 5, 642. [Google Scholar] [CrossRef] [PubMed]
  55. Westman, S.M.; Kloth, K.J.; Hanson, J.; Ohlsson, A.B.; Albrectsen, B.R. Defence priming in Arabidopsis—A Meta-Analysis. Sci. Rep. 2019, 9, 13309. [Google Scholar] [CrossRef] [PubMed]
  56. Nephali, L.; Piater, L.A.; Dubery, I.A.; Patterson, V.; Huyser, J.; Burgess, K.; Tugizimana, F. Biostimulants for plant growth and mitigation of abiotic stresses: A metabolomics perspective. Metabolites 2020, 10, 505. [Google Scholar] [CrossRef] [PubMed]
  57. du Jardin, P. Plant biostimulants: Definition, concept, main categories and regulation. Sci. Hortic. 2015, 196, 3–14. [Google Scholar] [CrossRef]
  58. Szpunar-Krok, E.; Depciuch, J.; Drygaś, B.; Jańczak-Pieniążek, M.; Mazurek, K.; Pawlak, R. The influence of biostimulants used in sustainable agriculture for antifungal protection on the chemical composition of winter wheat grain. Int. J. Environ. Res. Public Health. 2022, 19, 12998. [Google Scholar] [CrossRef] [PubMed]
  59. Yakhin, O.I.; Lubyanov, A.A.; Yakhin, I.A.; Brown, P.H. Biostimulants in plant science: A global perspective. Front. Plant Sci. 2017, 7, 2049. [Google Scholar] [CrossRef]
  60. Ahanger, M.A.; Tomar, N.S.; Tittal, M.; Argal, S.; Agarwal, R.M. Plant growth under water/salt stress: ROS production; antioxidants and significance of added potassium under such conditions. Physiol. Mol. Biol. Plants 2017, 23, 731–744. [Google Scholar] [CrossRef]
  61. Wu, H.; Zhang, X.; Giraldo, J.P.; Shabala, S. It is not all about sodium: Revealing tissue specificity and signalling roles of potassium in plant responses to salt stress. Plant Soil 2018, 431, 1–17. [Google Scholar] [CrossRef]
  62. Manishankar, P.; Wang, N.; Köster, P.; Alatar, A.A.; Kudla, J. Calcium signaling during salt stress and in the regulation of ion homeostasis. J. Exp. Bot. 2018, 69, 4215–4226. [Google Scholar] [CrossRef]
  63. Butt, M.; Ayyub, C.M.; Amjad, M.; Ahmad, R. Proline application enhances growth of chilli by improving physiological and biochemical attributes under salt stress. Pak. J. Agric. Sci. 2016, 53, 43–49. [Google Scholar] [CrossRef]
Figure 1. Effect of salt concentrations, biostimulants treatment, and terms of measurement on relative chlorophyll content (Term I—the 1st day after biostimulant application, Term II—the 7th day after biostimulant application). Lowercase letters indicate significant differences among means of the variants within the respective measurement term. Capital letters indicate significant differences among means of individual measurement terms within each experiment variant. As determined by ANOVA and followed by Tukey’s HSD test (n = 30, p = 0.05).
Agriculture 14 00033 g001
Figure 2. Effect of salt concentrations, biostimulants treatment, and terms of measurement on chlorophyll fluorescence parameters: (a) the photochemical efficiency of PS II (Fv/Fm); (b) the maximum quantum yield of primary photochemistry (Fv/F0); (c) the performance index of PS II (PI). (Term I—the 1st day after biostimulant application, Term II—the 7th day after biostimulant application). Lowercase letters indicate significant differences among means of the variants within the respective measurement term. Capital letters indicate significant differences among means of individual measurement terms within each experiment variant. As determined by ANOVA and followed by Tukey’s HSD test (n = 30, p = 0.05).
Agriculture 14 00033 g002
Figure 3. Effect of salt concentrations, biostimulants treatment, and terms of measurement on chlorophyll fluorescence parameters: (a) intercellular CO2 concentration (Ci); (b) transpiration rate (E); (c) stomatal conductance (gs); (d) net photosynthetic rate (PN). (Term I—the 1st day after biostimulant application, Term II—the 7th day after biostimulant application). Lowercase letters indicate significant differences among means of the variants within the respective measurement term. Capital letters indicate significant differences among means of individual measurement terms within each experiment variant. As determined by ANOVA and followed by Tukey’s HSD test (n = 20, p = 0.05).
Agriculture 14 00033 g003
Table 1. The characteristics of biostimulants.
Foliar FertilizersProducerFertilizer CharacteristicsDose
(per 1000 mL of Water)
BioFol BombardinoBiostyma Sp. z o.o. (Poland)70.0% organic matter content, 35.0% seaweed concentrate, 30.0% organic carbon, 5.0% free L-amino acids, polysaccharides, phosphorus, potassium, magnesium, iron, calcium, copper, vitamins B1, B2, B3, B6, B9;5 mL
Quantis®SAF Argentina S.A. (Argentina)1% total nitrogen (N), 0.9% organic nitrogen (Norg), 9.3% potassium (in conversion to K2O), 4.6% calcium (in conversion to CaO), dry matter 52%, organic matter 26%10 mL
BioFol PlexBiostyma Sp. Z o.o. (Poland)2.0% Ntot; 0.3% Mg; 5.0% S; 0.15% B; 0.05% Cu; 0.20% Fe; 0.10% Mn; 0.50% Zn; 1.25% C; 5.0% extract from algae; traces of plant hormones, betaine (C5H11NO2), amino acids, thiamine7.5 mL
MegafolVALAGRO (Italy)amino acids (proline and tryptophan), glycosides, polysaccharides, organic nitrogen and organic carbon10 mL
Disclaimer/Publisher’s Note: The statements, opinions and data contained in all publications are solely those of the individual author(s) and contributor(s) and not of MDPI and/or the editor(s). MDPI and/or the editor(s) disclaim responsibility for any injury to people or property resulting from any ideas, methods, instructions or products referred to in the content.

