Abstract
This study utilized fifty bull calves of the Continental × British crossbreed, with an average body weight of 147.0 ± 1.67 kg (BW), in a completely randomized design. The objective was to examine the impact of varying levels and duration of calcium propionate (CaPr) supplementation on the growth performance, body fat reserves, serum metabolites, and hemogram of high-risk newly received stocker calves. These calves were individually housed and fed a received diet for 56 d. The calves received the following treatments: (1) no CaPr (CTL), (2) 20 g CaPr/calf/d, (3) 40 g CaPr/calf/d, (4) 60 g CaPr/calf/d, and (5) 80 g CaPr/calf/d at 14, 28, 42, and 56 d after their arrival. Supplementing with 20 g CaPr from 28 to 56 d after arrival increased average daily gain (ADG) and BW (p < 0.05), and DMI was not affected (p > 0.05). This was reflected at 28 d with increases (p < 0.05) in the ADG/DMI ratio and longissimus muscle area (LMA), and at 56 d in back fat thickness (BFT) and fat thickness at the rump (FTR). Also, with 20 g, blood urea nitrogen decreased (p < 0.05), and increases were observed in the activity of gamma glutamyltransferase, monocytes (quadratic trend, p < 0.07), and granulocytes % (quadratic effect, p < 0.03). However, as the level of CaPr increased during the first 14 d after arrival, daily water intake, creatinine, total cholesterol, mean corpuscular hemoglobin concentration (linear effect, p < 0.05), globulin, calcium, and mean corpuscular volume (linear trend, p = 0.08) increased, while alkaline phosphatase (linear trend, p = 0.07) and lymphocytes (linear effect, p = 0.05) decreased. Finally, the different levels of CaPr supplementation did not produce any significant effects or differences (p > 0.05) in the remaining serum metabolites and hemogram (p > 0.05). Ultimately, the inclusion of 20 g CaPr/calf/d in the diet for 28 d in newly received stocker calves increased ADG, ADG/DMI ratio, and LMA. If extended to 42 or 56 d, the increases in ADG persisted, but there was also a rise in body fat reserves (BFT and FTR) at the expense of a reduction in the ADG/DMI ratio. Furthermore, the different supplementation levels did not impact the reference range for most serum metabolites or the health of stocker calves.
1. Introduction
Factors such as recent weaning, handling, transportation, commingling, and exposure to a new environment, along with a lightweight condition (<200 kg), can cause acute stress in calves. Calves in such circumstances are considered high risk [1,2], often leading to water and feed deprivation [3]. These stress factors have a negative impact on the energy balance [4], resulting in a reduction of body fat reserves. Consequently, this negatively affects the immune system [5], leaving the animal vulnerable to infectious agents. As a result, morbidity rates can increase by 16.2%, and mortality also increases during the reception period (first 6 to 8 weeks) [6,7].
Energy is one of the most critical nutrients for the animal’s immune system [6], making its storage in the form of body fat a valuable indicator of the nutritional status and health of calves. Energy is stored in the body as lipids [8], which, when catabolized, are highly efficient in energy production. However, the low dry matter intake (DMI), approximately 0.9 to 1.5% of body weight (BW), during the first 14 d after arrival [9,10], complicates the correction of nutritional deficiencies. This could further compromise immune function [11] and reduce body fat reserves. As a result, a significant portion of the consumed energy is directed towards the production of antibodies and immune system proteins. However, this also means that less energy is available for tissue deposition or average daily gain (ADG).
Due to this this altered feeding pattern, the performance of newly received stocker calves is typically optimized by using diets with a higher grain concentration (≥60% concentrate) [12]. However, this approach leads to a 17% increase in morbidity rate and a 24% increase in the number of days requiring medical treatment (morbidity severity) [13]. On the other hand, increasing the proportion of forage in the diet decreases the morbidity rate by 1.3% [14] and improves DMI by 9% [15], but it also reduces ADG by 8.3% [14]. Despite the decrease in morbidity among the calves, it fails to compensate for the economic loss associated with the reduced productivity of calves fed with high forage proportions [4,16,17].
In light of all the aforementioned factors, it becomes imperative to explore ingredients that can increase the availability of dietary energy to enhance both growth performance and body fat reserves without compromising the health of calves. It has been observed that gluconeogenic precursor calcium propionate (CaPr) alters energy metabolism when supplemented in ruminant diets. Specifically, it has two significant effects: (1) It alters rumen fermentation by improving ruminal DM digestibility, increasing the proportion of ruminal propionate, and reducing methane production [18,19], and (2) it enhances the action of insulin on glucose (GLU) metabolism [20], promoting an increase in energy status through enhanced GLU synthesis via gluconeogenesis in the liver [21]. In this context, Carrillo-Muro et al. [22,23], studying finishing diets for lambs, found that 10 g of CaPr/lamb/d for 28 d increased dry matter intake (DMI) by 1 to 13%, ADG by 28%, ADG/DMI ratio by 17 to 25%, and BW by 5 to 7%. If the supplementation was extended to 42 d, it resulted in a 30% increase in body fat reserves. Nevertheless, there is currently no available information regarding the effects of the levels and duration of CaPr inclusion on the growth performance, body fat reserves, serum metabolites, and hemogram of high-risk, newly received stocker calves.
Hence, in this study, we hypothesized that augmenting the available energy in the diet through CaPr supplementation in high-risk newly received stocker calves could potentially enhance growth performance, body fat reserves, and serum metabolites, without adverse effects on the hemogram. Moreover, we aimed to ascertain whether the magnitude of these effects is linked to the level and duration of CaPr supplementation. Therefore, the objective of the present study was to investigate the impact of different levels (0, 20, 40, 60, and 80 g CaPr calf/d) and durations of CaPr inclusion (0, 14, 28, 42, or 56 d) in high-risk newly received beef calves concerning their growth performance, body fat reserves, serum metabolites, and hemogram.
2. Materials and Methods
The protocol (protocol # 2023/05/19) received approval from the Animal Welfare Committee at the Unidad Académica de Medicina Veterinaria y Zootecnia at the Universidad Autónoma de Zacatecas (UAMVZ-UAZ). The handling and management of the calves strictly adhered to the guidelines set forth by the Officials Mexicans Standards. The experiment was conducted over two consecutive months at the Torunos Livestock Preconditioning Center, within the experimental area, located in Fresnillo, Zacatecas, Mexico (north-central Mexico), and owned by Grupo Exportador Pa Lante S.P.R. de R.L. Throughout the duration of the experiment (June to July 2023), the ambient air temperature averaged 22.4 °C, with a minimum of 12.2 °C and a maximum of 28.3 °C.
2.1. Animal Housing and Management Health
The calves used in this experiment fit the definition of high risk due to their lightweight condition (<200 kg) and because their health and management history is unknown [2]. Eighty-seven calves were weaned and transported approximately 120 km (4 h by truck) from an order buyer facility in Milpillas de la Sierra, Valparaiso, Zacatecas, to the Torunos Livestock Preconditioning Center. The calves arrived at the preconditioning center on 1 June 2023 and experienced a 5% reduction in weight during transit. Upon arrival, the calves were housed in pens, with two calves per pen, and provided access to water and long-stem alfalfa hay overnight. The following morning (0600 h), the calves underwent the following procedures: (1) metaphylatic antimicrobial treatment (Emicina® líquida, Zoetis, Ciudad de Mexico, Mexico); (2) eleven-way clostridial, Mannheimia haemolytica, and Pasteurella multocida type A and D vaccination (Biovac 11 Vías®, Biozoo, Jalisco, Mexico); (3) deworming with 4% ivermectin (Master LP®, Ourofino Salud Animal, São Paulo, Brazil) and pour on cypermethrin (Cypermil Pour On®, Ourofino Salud Animal, São Paulo, Brazil); (4) each calf was assigned a unique ear tag with an individual number; and (5) individual initial body weight (IBW) was recorded. Thirty-seven calves were excluded from the experiment due to their low IBW or temperament issues, resulting in a final group of 50 bulls for use in the experiment (n = 50). These fifty bull calves were primarily 50% Charolais, 25% Simmental, and 25% Angus crossbred with an average IBW of 147.0 ± 1.67 kg and 5 months of age. The IBWs of the calves were recorded, and they were accommodated in 50 soil-surfaced pens (3.14 m × 5.25 m).
2.2. Diet Management and Feed Samples
For the 56 d of the experimental phase, a basal diet was used, with the proportion of concentrate gradually increasing (1) 50% concentrate was provided from d 0 to 14; (2) 60% concentrate from d 15 to 28; and (3) 70% concentrate from d 29 to 56. On transition days, the basal diet was provided at 90% of the amount delivered the day before. The basal diets were formulated to meet NRC [24] recommendations for nutrients (Table 1). Throughout the study, the calves had unrestricted access to the basal diet and fresh water. The basal diet was divided into three daily feedings at 0800, 1200, and 1800 h in a 20:20:60 proportion, respectively. To ascertain the correct feed quantity for delivery, the feed bunks were assessed at 0730, 1130, and 1730 h daily, with residual feed being collected and weighed to determine dry matter intake (DMI). Adjustments in daily feed delivery were made at the afternoon feeding. Additionally, the calves’ individual weights were recorded at the start of the experiment (IBW), at intermediate points (14, 28, 42 d), and at the end of the experiment (56 d). The calves were under daily observation for any signs of bovine respiratory disease, which encompassed symptoms such as labored breathing, nasal or ocular discharge, depression, anorexia, and lethargy. Animals expressing symptoms were removed from experiment. Furthermore, daily samples of the basal diet were collected and analyzed in triplicate to determine the following: (1) DM%, which was achieved by drying the samples for 24 h at 100 °C in a forced air-drying oven; (2) crude protein (CP) (FP-528 LECO nitrogen analyzer) [25]; (3) neutral detergent fiber (NDF) (fiber Ankom analyzer); and (4) Ether extract (EE) (extractor of Ankomxt15).

Table 1.
Composition and nutritional profile (DM basis) of basal diet offered to bull calves during the experiment (g kg−1 DM).
The diet provided in this study was carefully monitored to ensure that aflatoxin levels were well below the established safety limits for animal feed. This precautionary measure was taken to safeguard the animals’ health and welfare. By maintaining feed quality within safe limits, we aimed to minimize any potential influence of aflatoxins on the study results.
2.3. Experimental Design and Treatments
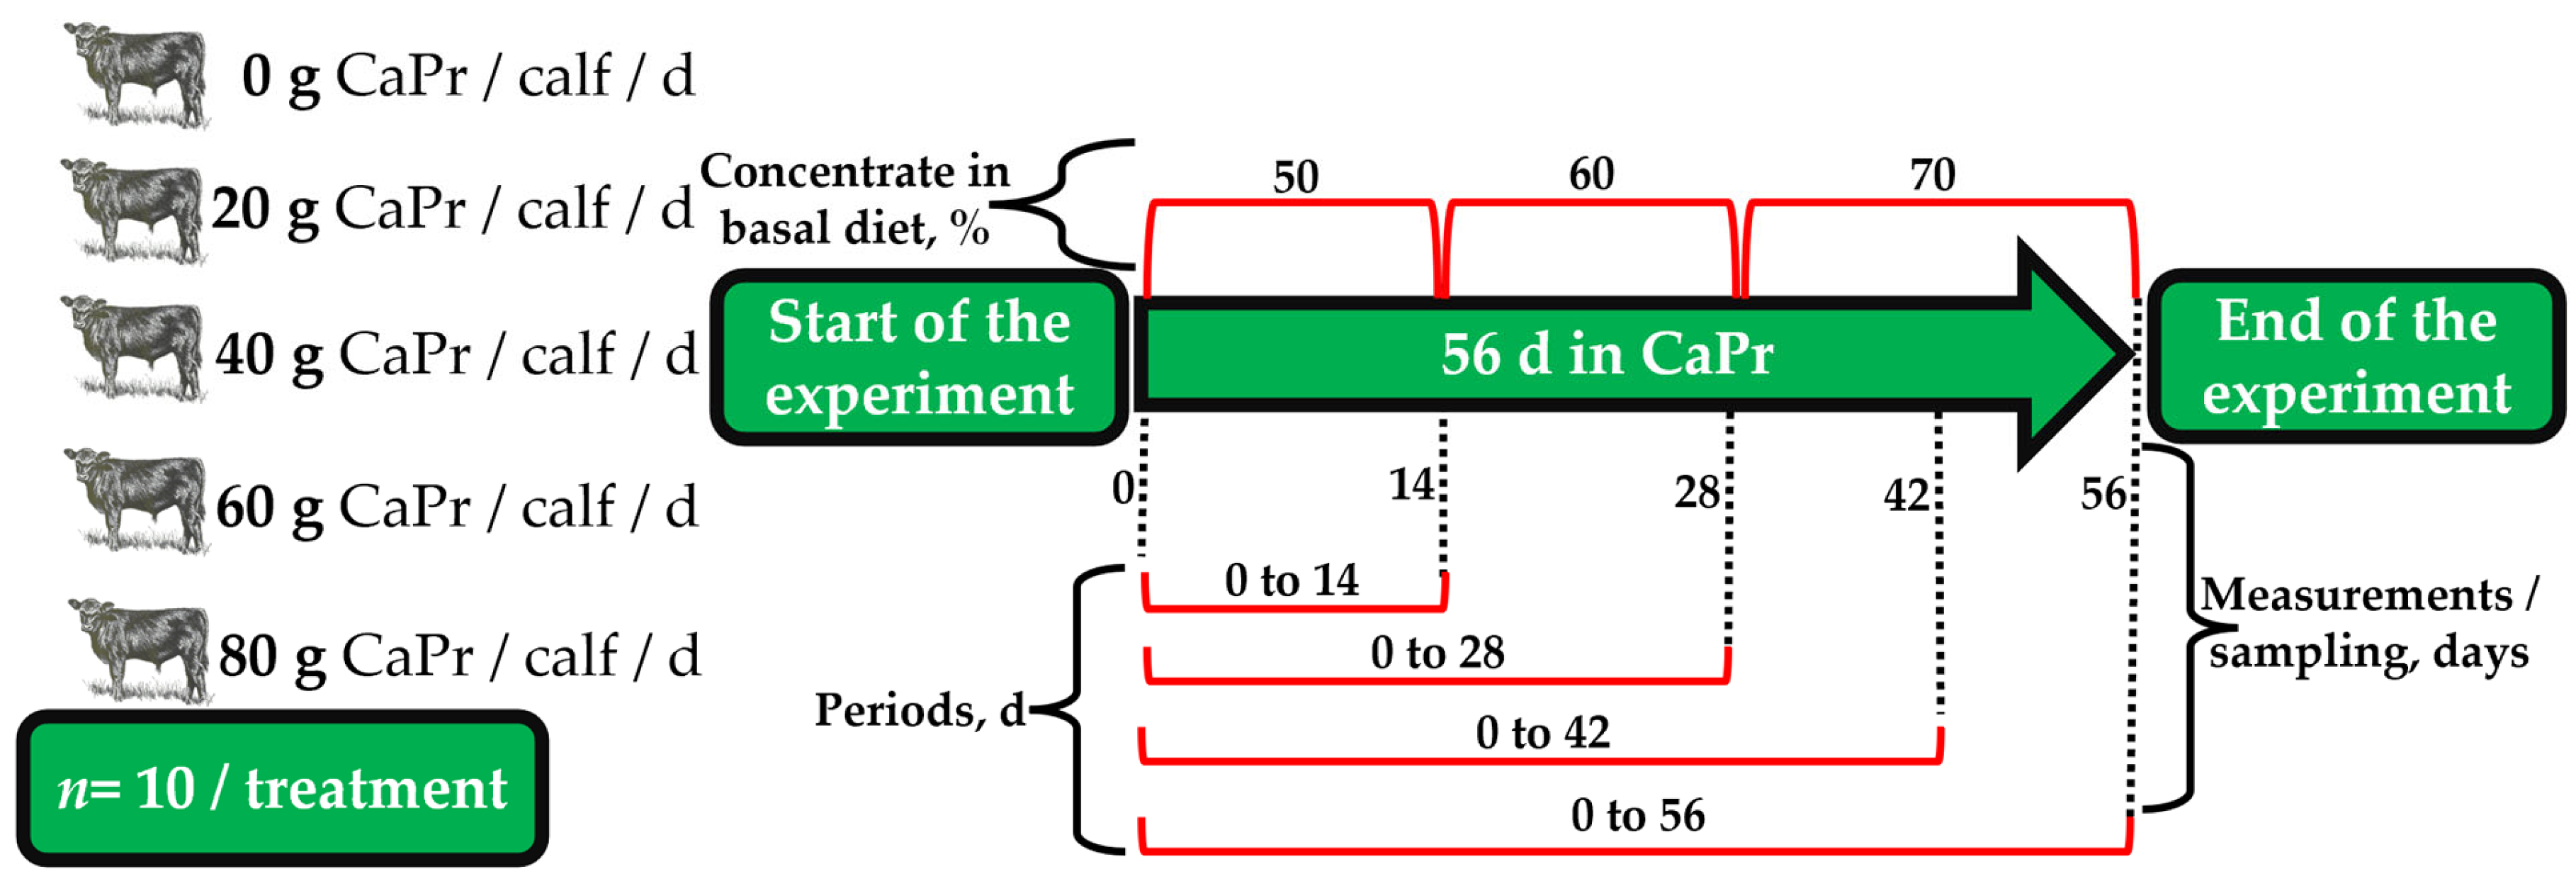
A completely randomized design was employed to investigate the effects of varying levels and durations of CaPr supplementation in calves. The treatments consisted of (1) No CaPr (CTL), (2) 20 g CaPr/calf/d, (3) 40 g CaPr/calf/d, (4) 60 g CaPr/calf/d, and (5) 80 g CaPr/calf/d. These treatments were administered for a duration of 56 d, with evaluations conducted at 0, 14, 28, 42, and 56 d after arrival (Figure 1). The source of CaPr used was Nuprocal® (Nutryplus, Queretaro, Mexico), originating from the same batch, containing propionic acid and calcium sulfate (chemical composition 20% calcium and 69% of propionic acid). Each individual CaPr dose was meticulously weighed using a precision balance (Pioneer-PX523, Ohaus Corp., Parsippany, NJ, USA). To ensure that the treated group consumed the full dosage, the doses were mixed with 100 g of the basal diet, provided at 0800 and 1600 h. Any remaining portion of the diet was administered to the calves once they consumed their initial portions.
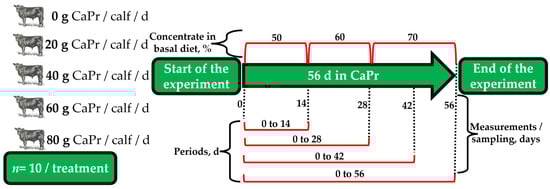
Figure 1.
Completely randomized design, level (0, 20, 40, 60, or 80 g CaPr/calf/d), and duration (0, 14, 28, 42, and 56 d) of calcium propionate (CaPr) supplementation in high-risk newly received stocker calves.
2.4. Growth Performance
By utilizing the individual data collected data during feeding trial, we computed the following averages for various time intervals (d 0 to 14, d 0 to 28, d 0 to 42, and d 0 to 56): (1) ADG = [(Weight out—Weight in/Days on period] expressed as kg/d; (2) DMI = (Feed offered—Feed refused), which was weighed and recorded daily, expressed as kg/d; (3) ADG/DMI ratio = (ADG/DMI); and (4) Daily water intake (DWI) = (Water offered − Water refused), which was determined and recorded daily, expressed as L/d. For this purpose, a drinking cup with a capacity of 30 L was graduated to determine intake.
2.5. Serum Metabolites and Hemogram
Serum metabolite and hemogram samples were processed at the Laboratorio de Análisis Clínicos Veterinarios of the UAZ-UAMVZ. Blood samples were collected from five randomly selected calves from each treatment, on d 0, 14, 28, 42, and 56. Coinciding with individual weighing, at 0700 h, and before the first feeding of the d, blood was drawn from the jugular vein. The blood samples (6.0-mL BD Vacutainer con EDTA K2-Dikysa) were later analyzed for a complete blood count (CBC) using an automatic cell counting machine (Exigo veterinary haematology analyser, Boule Medical AB, Sweden). The following parameters were determined: total white blood cells (WBC), lymphocytes (LYM), lymphocytes % (LYM%), monocytes (MON), monocytes % (MON%), granulocytes (GRA), granulocytes % (GRA%), platelets (PLT), mean platelet volume (MPV), red blood cells (RBC), red blood cells distribution width test % (RDW%), hemoglobin (HGB), hematocrit (HCT), mean corpuscular volume (MCV), mean corpuscular hemoglobin (MCH), and mean corpuscular hemoglobin concentration (MCHC). In addition, the blood serum was collected by centrifugation (2500× g for 30 min; 4 °C), and metabolites were quantified using an automated analyzer (FUJI DRI-CHEM NX500; Fujifilm, Tokyo, Japan). The following parameters were determined: activity of alkaline phosphatase (ALP), gamma glutamyltransferase (GGT), and aspartate aminotransferase (AST); levels of albumin (ALB), blood urea nitrogen (BUN), calcium (Ca), creatinine (CRE), GLU, total bilirubin (TBIL), total cholesterol (TCHO), triglycerides (TG), total protein (TP), sodium (Na+), potassium (K+), and chlorine (Cl-). The globulin fraction (GLO) is a calculated value obtained by subtracting the ALB concentration from the TP concentration [26].
2.6. Body Fat Reserves and Longissimus Muscle Area
The following measurements were made: (1) Longissimus muscle area (LMA), measured in cm2; (2) back fat thickness (BFT), which represents subcutaneous fat over the longissimus dorsi muscle, measured in mm, wherein both measurements were taken between the 12th and 13th ribs; and (3) fat thickness at the rump (FTR) at the p8 site, measured in mm, which was assessed. This measurement is located over the gluteus muscle on the rump and is determined at the intersection of a line drawn through the pin bone, parallel to the chine, and perpendicular to the third sacral crest [27]. These measurements were obtained through ultrasonography every 0, 14, 28, 42, and 56 d. The measurements were consistently performed by the same operator using a real-time scanner equipped with a linear array transducer of 3.5 MHz (Aloka Prosound 2 instrument).
2.7. Statistical Analyses
Statistical analysis was performed using the SAS® OnDemand free software, which is freely available. A normality test was performed using the UNIVARIATE procedure. The data related to growth performance were analyzed assuming a completely random design, with each calf serving as the experimental unit. The GLM procedure of SAS was used, involving a model that took into account the effects of treatment (CaPr level). A one-way ANOVA was performed, and Bartlett’s test was used to assess variances homogeneity. The statistical model used can be expressed as Yij = μ + Ti + εij, where Yij corresponds to response variable, μ is overall mean effect, Ti is the treatment effect (i = 1, 2, 3, 4, 5), and εij is the residual error term. When significant effects were detected, mean comparisons were conducted using the Tukey method with the LSMEANS instruction. Orthogonal polynomials were applied to evaluate linear and quadratic responses among the different levels of CaPr. Statistical significance was determined when the p-value was ≤0.05, and a trend if the p-value was >0.05 and ≤0.10.
3. Results
3.1. Growth Performance
In the initial 14 d, most of the studied variables remained unaffected by the varying levels (p > 0.05; Table 2). Nevertheless, a noticeable effect was observed concerning DWI during this timeframe, with a 4.6% increase as the inclusion level of CaPr went up (linear effect, p = 0.04). As for DMI, reductions were observed from 28 to 56 d as the level of inclusion increased (linear effect, p < 0.05). The lowest consumption was recorded on d 56 with 80 g, but the other levels were comparable to the CTL (p < 0.05). Starting from d 28, distinctions became apparent with 20 g, showing an 11.8% increase in ADG (quadratic trend, p = 0.07) and a 4.6% increase in BW, compared to the CTL (p < 0.05). This trend persisted through 42 and 56 d, with the highest increase occurring on d 42, resulting in a 13.3% increase in ADG and a 4.9% increase in BW (p < 0.05). Nonetheless, it was also observed that as the level of inclusion increased, ADG decreased on 42 and 56 d (linear effect, p < 0.05), and the same trend was noted for BW on d 56 (linear trend, p = 0.06). This was reflected in a 16.7% increase in the ADG/DMI ratio on d 28 (p < 0.05) with 20 g. However, on 42 and 56 d, no significant differences were observed between the treatments (p > 0.05).
Table 2.
Effect of dietary calcium propionate (CaPr) inclusion level and duration on the growth performance of high-risk newly received stocker calves (n = 10/treatment).
3.2. Enzymatic Activity
The activity of ALP decreased with the increasing levels of CaPr (linear trend, p = 0.07; Table 3). It was higher in the CTL and lower with 80 g (p < 0.05). However, in the case of GGT, its activity was higher with 20 g CaPr/calf/d, showing a significant 37.3% increase (quadratic trend, p = 0.06) when compared to the CTL. The different levels of CaPr supplementation did not produce any effect on the activity of AST (p > 0.05).
Table 3.
Overall effect of level calcium propionate (CaPr) inclusion on enzymes activity of high-risk newly received stocker calves, sampled on d 0, 14, 28, 42, and 56 (n = 5/treatment).
3.3. Serum Metabolites
The concentration of GLO increased with the level of CaPr (linear trend, p = 0.08; Table 4), with higher levels observed with 40 to 80 g of CaPr (p < 0.05). BUN was lower with 20 g, higher with 80 g, and similar with the other levels and CTL (p < 0.05). Additionally, increasing the level of CaPr increased the concentration of Ca (linear trend, p = 0.08), and CRE (linear effect, p = 0.003) and TCHO (linear effect, p = 0.02) was higher with levels above 40 g (p < 0.05). The different levels of CaPr supplementation did not result in any significant effect or difference in ALB, GLU, TBIL, TG, TP, and electrolytes (p > 0.05).
Table 4.
Overall effect of level calcium propionate (CaPr) inclusion on serum metabolites of high-risk newly received stocker calves, sampled on d 0, 14, 28, 42, and 56 (n = 5/treatment).
3.4. Body Fat Reserves and Longissimus Muscle Area
BFT, FTR, and LMA were not affected by the different levels during the initial 14 d (p > 0.05; Table 5). Regarding LMA, at 28 d, its maximum value was observed, with a 23.9% increase with 20 g (quadratic effect, p = 0.05) compared to the CTL. However, the most significant increase in BFT (p < 0.05) was observed from d 42 onwards, and for FTR, these increases persisted up to d 56. These increases were most pronounced with 20 g of CaPr (quadratic effect, p < 0.05), showing a 24.9% increase in BFT and a 21% increase in FTR compared to the CTL.
Table 5.
Effect of dietary calcium propionate (CaPr) inclusion level and duration on the body fat reserves and longissimus muscle area of high-risk newly received stocker calves (n = 10/treatment).
3.5. White Blood Cells
As the level of CaPr increased, the value of LYM decreased (linear effect, p = 0.05; Table 6). LYM% was 16.7% higher in the CTL (quadratic effect, p = 0.02). MON increased by 21.4% with 20 g (quadratic trend, p = 0.07). GRA increased by 12.9% with 20, 40, and 60 g, and GRA% increased by 19.5% with 20 g (quadratic effect, p < 0.03). The different levels of CaPr supplementation did not have any significant effect or difference in WBC and MON% (p > 0.05).
Table 6.
Overall effect of level calcium propionate (CaPr) inclusion on white blood cells of newly received stocker calves, sampled on d 0, 14, 28, 42, and 56 (n = 5/treatment).
3.6. Platelets and Red Blood Cells
As the level of CaPr increased, so did the values of MCV (linear trend, p = 0.08; Table 7) and MCH (linear effect, p = 0.02). The different levels of CaPr supplementation did not produce any significant effect or difference in PLT, MPV, RBC, RDW%, HGB, HCT%, and MCHC (p > 0.05).
Table 7.
Overall effect of level calcium propionate (CaPr) inclusion on platelets and red blood cells of newly received stocker calves, sampled on d 0, 14, 28, 42, and 56 (n = 5/treatment).
4. Discussion
4.1. Growth Performance
The literature on increasing energy intake in calves receiving diets through gluconeogenic precursors is quite limited. However, various publications concur that with receiving diets providing increasing levels of net energy for gain (NEg) from concentrates, DMI, ADG, and ADG/DMI ratio significantly improve [36,37,38,39,40]. Moreover, different authors with various additives agree that the most significant improvements in productive behavior are observed during the first 30 d of reception [41,42,43]. On the other hand, when CaPr is supplemented in the diet and reaches the rumen, it undergoes hydrolysis at an acidic pH, resulting in the formation of Ca2+ and propionic acid [21]. Additionally, in the rumen: (1) the pattern of volatile fatty acids is altered [19]; (2) methane production decreases; (3) digestibility of dry matter increases; (4) fermentation efficiency improves [18]; (5) insulin response capacity in GLU metabolism improves [20]; and (6) body fat reserves increase [23]. As a cumulative result of these mechanisms, there is a promotion of energy status achieved through increased GLU synthesis via gluconeogenesis [21]. This results in improvements in DMI, ADG, ADG/DMI ratio, and BW during the finishing phase [22,23].
The 20 g CaPr level did not affect DMI at any point during the reception period. However, starting from d 28 up to d 56, there was a reduction in DMI with the increasing CaPr levels (40 to 80 g), reaching as low as 19.6% with 80 g. Similarly, when gluconeogenic precursor crude glycerin is included in the beef cattle diet at increasing proportions, DMI decreases [44,45]. Hales et al. [46] also described that DMI reduction in beef cattle, as crude glycerin concentration is increased, seems consistent throughout literature. A similar pattern has been observed with increasing levels of concentrate in the diets of receiving calves. There are maximal DMI levels with 60 to 72% concentrate and reductions with 90% concentrate during the first 28 d [12,36,47]; likewise, Crawford et al. [40] mention that DMI reduces with increasing NEg concentration in calf reception diets at 56 d after arrival. In agreement, but in finishing diets for lambs, Carrillo-Muro et al. [22] observed reductions in DMI of 14.3% with the higher levels of 30 g CaPr, whereas with 10 g, DMI increased by 1.1% during the first 28 d [23]. However, Tomczak et al. [39] with increasing NEg concentration in calf reception diets did not observe differences in DMI.
Newly received calves commonly face the stress of dehydration [3], so they should be offered water immediately upon arrival [48]. In this study, DWI was not affected when 20 g of CaPr was included, but it increased by 4.6% within the first 14 d as the inclusion level increased. In contrast, Carey et al. [45] added crude glycerin to the drinking water of receiving calves and did not observe any effects on DWI. However, Lofgreen et al. [49] reported that DWI was 16.6% higher at 28 d with diets containing less concentrate (20%).
Starting from day 28, there were increases of 11.8% in ADG and 4.6% in BW, with 20 g of CaPr, reaching 13.3% ADG and 4.9% BW at day 42 compared to CTL. Nevertheless, as the levels of CaPr supplementation increased, ADG decreased. In line with these findings, in lambs with finished diets, Carrillo-Muro et al. [22] observed reductions of 16.0% in ADG and 2.8% in BW with the highest levels of CaPr, ranging from 20 to 30 g. Conversely, with 10 g of CaPr during the first 28 days, they observed an increase of 26.8% in ADG and 4.7% in BW [23]. Additionally, Lofgreen et al. [49] reported that ADG improved after the first 7 d of calf arrival and continued to increase until d 28, especially with higher values of NEg. Similarly, Lofgreen [37], using a diet containing 75% concentrate, detected a 6.5% increase in ADG compared to a 50% concentrate diet. Also, Crawford et al. [40] mention that the ADG increased with increasing NEg concentration in calf reception diets; for the first 28 d, it did not differ, and at 56 d, it was greater with the highest level of NEg. In contrast, Pritchard and Méndez [47] reported increased ADG during the first 28 d of the reception period in calves fed diets with lower energy content compared to a diet containing 60% concentrate. However, Tomczak et al. [39], with increasing NEg concentration in calf reception diets, did not observe differences in ADG and BW.
As for the ADG/DMI ratio, a notable improvement of 16.7% was observed during the first 28 d when 20 g of CaPr was included. Conversely, this ratio decreased with the CTL and the other levels. Similarly, Carrillo-Muro et al. [22], in lambs with finished diets, noted a 5.9% improvement in the ADG/DMI ratio with the lowest CaPr level, 10 g, and a substantial 25% improvement during the initial 28 d with 10 g [23]. Fluharty and Loerch [12] found that in receiving calves, increasing concentrate proportions (70, 75, 80, and 85%) resulted in a more significant increase by d 14. Also, Lofgreen [37] detected a 17.5% increase in the ADG/DMI ratio with 75% concentrate compared to 50% concentrate. Likewise, Tomczak et al. [39], Spore et al. [38], and Crawford et al. [40] mentioned that the ADG/DMI ratio increased with higher NEg concentration in calf reception diets. Contrastingly, Pritchard and Méndez [47] reported an increase in the ADG/DMI ratio during the first 28 d of the receiving period in calves fed diets with lower energy compared to a diet with 60% concentrate.
The reduced growth performance of received beef calves with higher levels of 40, 60, and 80 g CaPr can be explained by the decrease in DMI. This reduction in DMI is attributed to the hepatic oxidation theory (HOT), as described by Allen [50]. The HOT theory explains the role of the ruminant liver in signaling and controlling satiety through temporal patterns of various oxidative products, including propionic acid. Signals are transmitted from the liver to the brain via afferents in the vagus nerve and are influenced by hepatic oxidation and ATP generation [51,52]. Additionally, the elevated levels of CaPr may have increased insulin secretion, leading to a reduction in DMI. Insulin reaches the brain and binds to its specific receptors on neurons, resulting in reduced DMI [53,54].
4.2. Enzymatic Activity
Blood samples were analyzed to measure enzyme activity, specifically ALP, GGT, and AST, to assess whether different levels of CaPr supplementation could affect liver and kidney functions or metabolic processes in these organs. It was noted that ALP activity exhibited a decrease with increasing CaPr levels, although the values remained within the normal reference ranges (0 to 488 [28]). According to Otter [33], physiologically higher ALP activity occurs in young growing cattle and is predominantly associated with bone growth and osteoblast proliferation. Based on this, it can be inferred that received beef calves with 80 g of CaPr may experience a reduction in bone growth. As for GGT, its activity was highest with 20 g of CaPr, showing a notable increase of 37.3%, slightly exceeding the reference range (6.1 to 17.4 [28]). This could be attributed to increased liver activity in these calves [55]. However, a study by Ladeira et al. [56], which used different proportions of glycerin in bulls, did not observe any effects on GGT. As for AST, its activity with various levels of CaPr supplementation did not produce any effects and remained within normal ranges (48 to 100 [29]). These results align with previous studies by Ladeira et al. [56] in bulls and de Freitas et al. [57] in ewes, both of which used different proportions of glycerin and found no observable effects on AST. In contrast, Silva et al. [58], in a study involving crude glycerin in beef cattle, observed increases in AST levels with higher inclusion rates. Carlson [59] notes that AST is a nonspecific indicator of tissue damage and can be elevated in cases of muscle injury or necrosis, particularly in recumbent animals. Importantly, it is worth noting that the enzyme activity values for ALP, GGT, and AST observed in this study remained within the normal, non-pathological range. This suggests that there were no indications of liver or kidney damage, as well as no notable metabolic improvements associated with CaPr supplementation in calves’ reception.
4.3. Serum Metabolites
The TP, which primarily includes ALB and GLO, serves as a significant solid component of serum and acts as an indicator of an animal’s nutritional status [60]. In the current study, the concentrations of TP and ALB remained unaffected by CaPr supplementation. However, it is noteworthy that TP levels were slightly below the reference range (6.74 to 7.46 [28]), while ALB values were within the normal range (2.7 to 4.2 [29]). In terms of TP, these findings align with a study by de Freitas et al. [57] in ewes, which investigated the effects of different proportions of crude glycerin supplementation and similarly found no significant effects on TP. Nevertheless, the concentration of GLO was slightly elevated with CaPr levels of 40 to 80 g, exceeding the reference range (3.0 to 3.48 [28]). This can occur due to increased levels of ALB, GLO, or both. Dehydration is the sole cause of hyperalbuminemia, where both ALB and GLO levels increase. However, when hyperproteinemia is observed in the absence of dehydration, it is typically associated with hyperglobulinemia. Common causes of hyperglobulinemia include chronic antigenic stimulation and liver disease. Chronic antigenic stimulation can be attributed to various conditions such as traumatic reticuloperitonitis, liver abscesses, or chronic pneumonia [26]. Based on this, it can be assumed that with higher levels of 40 to 80 g CaPr, there may be chronic liver inflammation.
As for the BUN levels, they are typically used to estimate nitrogen excretion and utilization efficiency [61]. In ruminants, BUN concentrations are influenced by various factors, including CP intake, rumen degradability, and liver and kidney function [62]. Notably, supplementation with 20 g of CaPr resulted in reduced serum BUN levels, although all these values remained within the normal range (10 to 25 [30]). Similarly, Crawford et al. [40] mention that the BUN decreased with increasing NEg concentration in calf reception diets. Carrillo-Muro et al. [22] observed in lambs with finished diets that with higher levels of 20 CaPr, BUN increased. Furthermore, de Freitas et al. [57] in ewes and Carey et al. [45] in newly received beef calves observed increases in BUN with the highest proportions of crude glycerin. Waggoner et al. [63] pointed out that calves with immunological issues exhibit lower N retention, probably due to increased muscle catabolism to obtain proteins and enhance the immune response. The elevated BUN concentration observed in newly received cattle could be caused by mobilization of protein stores to compensate for inadequate DMI [64], or from immune requirements for amino acids [65]. Based on the aforementioned principles, it can be inferred that supplementation with 20 g CaPr in high-risk newly received stocker calves promotes nitrogen utilization and reduces muscle protein catabolism. Conversely, the opposite occurs with elevated levels of 40 to 80 g or 0.
The concentrations of CRE observed In the study fell within the normal range (1 to 2 mg/dL) reported by Kaneko et al. [28]. This indicates that the renal glomerular filtration rate for CRE was adequate and remained unaffected by the presence of CaPr. However, it is notable that as the level of CaPr increased, CRE concentrations also rose. This contrasts with findings from Crawford et al. [40] with increasing NEg concentration in calf reception diets and de Freitas et al. [57] in ewes, who used different levels of glycerin and did not observe effects on CRE. Otter [33] noted that CRE can be low in emaciated beef cattle or those with low muscle mass or elevated in heavily muscled animals. These results suggest that a higher level of CaPr (40 to 80 g) may promote increased muscle deposition over fat. This observation aligns with the higher values of BFT and FTR observed with a CaPr level of 20 g.
In the current study, TBIL concentrations were not affected by CaPr supplementation and remained within the normal range (0.01 to 0.5 [28]). TBIL serves as important indicator of liver function; it typically increases during severe lipidosis [66,67] and decreases in concentration when the liver is healthy. Therefore, based on these TBIL values, it can be concluded that different levels of CaPr do not have any negative effects on liver function.
Serum lipids mainly comprised TCHO and TG. TCHO levels fell below the reference range (73 to 280 [30]) but exhibited an increase as the level of CaPr supplementation rose, with only the 80 g CaPr falling within the range. No significant treatment effects were observed on TG, but all values were above the reference range (0 to 14 [28]). The increase in TCHO levels with the 80 g CaPr level could be attributed to the heightened production of propionic acid in the rumen, subsequently leading to increased TCHO production in the liver. The decrease in serum TCHO levels in this study indicates an energy deficit, whereas increases in TCHO typically occur in response to the ingestion of energy-rich, lipid-containing foods [68]. As crude glycerin inclusion increased, the same conclusion was drawn by Silva et al. [58] in beef cattle and de Freitas et al. [57] in ewes, where they observed increases in TCHO. However, in lambs with finished diets, Carrillo-Muro et al. [22], in their study of lambs fed finishing diets, did not observe significant effects on TCHO and TG levels with levels of 10, 20, or 30 g CaPr/lamb/d. Similarly, de Freitas et al. [57] did not find significant effects with different proportions of crude glycerin inclusion. Ndlovu et al. [69] pointed out that TCHO concentration reflects the energy metabolism in the liver, particularly lipid export in the form of very-low-density lipoproteins.
The CaPr used in this study, chemical composition of 20% calcium and 69% propionic acid, may have provided additional calcium beyond the calves’ nutritional requirements, which were already met by the basal diet. Consequently, as the levels of CaPr inclusion increased, blood calcium concentration also showed an increase, with all levels exceeding the reference range (8.3 to 10.4 [30]). This aligns with what Russell and Roussel [26] mentioned, stating that hypercalcemia is fairly rare in ruminants and usually occurs as a result of the administration of Ca solutions or gels.
GLU concentrations are considered metabolic indicators of nutrient intake in beef cattle [70]. No significant treatment effects were observed on GLU. Likewise, Crawford et al. [40] reported no observed differences in GLU with increasing NEg concentration in calf reception diets. However, it is worth noting that all GLU values recorded in our study were above the reference range (45 to 75 [28]). Consistent with these findings, in lambs fed different levels of CaPr in their diets, Carrillo-Muro et al. [22] did not observe any effects on GLU with levels of 10, 20, or 30 g CaPr. Similarly, Silva et al. [58] in beef cattle and de Freitas et al. [57] in ewes did not observe effects on GLU with different proportions of crude glycerin inclusion. In contrast, Ladeira et al. [56] used different proportions of glycerin in bulls and observed that GLU decreased as the level of inclusion increased. The GLU concentrations within the reference range for all treatments are indicative of adequate DMI intake, since circulating GLU is influenced by nutrient availability [71]. Likewise, Oosthuysen et al. [72] reported that elevated blood GLU concentrations suggest improved energy status associated with better utilization of dietary nutrients.
The different levels of CaPr supplementation did not produce any effects or differences in electrolytes (Na+, K+, and Cl−). Similarly, Crawford et al. [40] reported no significant differences in these electrolytes in their study involving increasing NEg concentration in calf reception diets. However, the values of Na+ and Cl− were below the ranges of 132 to 152 and 97 to 111, respectively [28]. Conversely, K+ levels were within the reference range of 3.9 to 5.8 [28]. The low values of Na+ and Cl− in the calves might be attributed to the diet not entirely meeting their nutritional requirements. Radostits et al. [73] note that the most common causes of hyponatremia are the lack or inadequate level of Na+ in the diet, and alterations in Cl− concentration are generally associated with proportional changes in Na+ concentration, resulting from shifts in relative water balance [59]. Another common reason for reduced Na+ and Cl− levels in reception calves is diarrhea, which, however, did not occur in this study [59]. Regarding K+, Crawford et al. [40] did not report significant differences in K+ levels in their study of increasing NEg concentration in calf reception diets. However, K+ deficiency is commonly linked to stressed beef cattle experiencing dehydration and the loss of K+ from tissues [48].
4.4. Body Fat Reserves and Longissimus Muscle Area
Evaluating lipid reserves in newly received calves can offer valuable insights into their nutritional status. Energy is stored in the body in the form of lipids [8], primarily TG [74]. When catabolized, lipids are highly efficient in energy production, yielding up to 9.4 Mcal/kg, whereas carbohydrates produce 4.2 and proteins 5.6 Mcal/kg [75,76]. Therefore, energy from body fat reserves can be nearly twice as much as that derived from muscles. During periods of limited energy availability, the body’s fat reserves are the first to be mobilized through the process of adipose tissue lipolysis, releasing TG [77]. Several factors influence body fat reserves, including (1) reproductive potential [78]; (2) negative energy balance [79]; (3) feeding level; and (4) nutrient composition [80].
The findings regarding BFT, FTR, and LMA align with expected patterns of tissue deposition at various stages of the growth curve in young animals. Initially, growth prioritizes the development of bone and muscle, with fat accumulation occurring subsequently. Diets with higher energy or protein content tend to stimulate fat deposition [81,82]. Consequently, supplementation with 20 g of CaPr resulted in a 23.9% maximum increase in LMA up to d 28, followed by a 24.9% increase in BFT from d 42 onwards, and a 21% increase in FTR up to d 56. In line with these results, Carrillo-Muro et al. [23] observed in lamb finishing diets that, with the lowest level of 10 g CaPr, BFT increased by up to 30% by d 42 as the inclusion period extended. Similarly, Crawford et al. [40] with increasing NEg concentration in calf reception diets, observed that the highest level of NEg increased BFT and FTR at 74 d after arrival. Klinger et al. [83] observed similar outcomes when comparing limit feeding a high NEg diet compared with a high roughage diet during a 77 d backgrounding trial. In contrast, no significant effects were observed on LMA. This aligns with findings from Carrillo-Muro et al. [23], Martínez-Aispuro et al. [84], Lee-Rangel et al. [85], and Mendoza-Martínez et al. [86], which were observed in lambs with finishing diets over 42 d, as well as with the results from Crawford et al. [40] in calf reception diets over 74 d.
4.5. White Blood Cells
The values of WBC were unaffected by the different levels of CaPr inclusion, and these values fell within the normal WBC range (4 to 12 [31]). LYM decreased with increasing CaPr levels, yet these values remained within the normal range (1.5 to 5.6 [32]). MON counts slightly exceeded the range (0 to 0.8) [33]. However, the fact that these values remained within the normal range could indicate an overall enhancement in the calves’ immune status or reduced infection rates. In contrast, Silva et al. [58] and Lopez et al. [87], in beef cattle supplemented with crude glycerin, did not observe effects on any of these WBC variables. However, de Freitas et al. [57] in ewes, with different proportions of crude glycerin supplementation, observed a reduction in WBC and LYM with the highest level, and no changes in MON.
4.6. Platelets and Red Blood Cells
With increasing CaPr levels, the values of MCV and MCH also increased. However, it is worth noting that MCV was below the typical range (38 to 50 [32]). The different levels of CaPr supplementation did not produce any significant differences in PLT, MPV, RBC, RDW%, HGB, HCT%, and MCHC. Nevertheless, RBC, RDW%, and HCT remained above the range (22 to 32 [34]), while MCHC levels remained below ([38 to 43 [35]). Similarly, for Silva et al. [58] in beef cattle and de Freitas et al. [57] in ewes, no effects were observed with different proportions of crude glycerin inclusion on these variables. Yet, de Freitas et al. [57] noted an increase in MCV with the highest levels. The values of HCT% were not influenced by the different CaPr inclusion doses; nevertheless, these percentages remained above the typical HCT% range (22% to 32%; [34]), suggesting that the beef cattle experienced slight dehydration throughout the experiment.
5. Conclusions
The gluconeogenic compound CaPr can be successfully integrated in reception diets for high-risk, newly received stocker calves. When administered at a daily level of 20 g CaPr/calf for 28 d, it significantly enhanced growth performance. This improvement was evident through increased ADG, an enhanced ADG/DMI ratio, and an increase in LMA. However, when supplementation was extended to 42 or 56 d at this level, ADG continued to increase, and it also led to an elevation in body fat reserves (BFT and FTR), resulting in a reduction in the ADG/DMI ratio. Furthermore, with the different levels of CaPr supplementation, serum metabolites and hemogram remained within the reference ranges. However, it is important to note that further studies with a larger number of high-risk newly received stocker calves are necessary to comprehensively evaluate the economic and health aspects before recommending the practical use of CaPr in such scenarios.
Author Contributions
Conceptualization, all authors; methodology and formal analysis, O.C.-M., P.H.-B., A.R.-V. and D.R.-C.; data curation, P.H.-B.; writing—original draft preparation, O.C.-M., P.H.-B. and D.R.-C.; writing—review and editing, A.R.-V., A.E.-A. and O.C.-M. All authors have read and agreed to the published version of the manuscript.
Funding
This research received no external funding.
Institutional Review Board Statement
This experiment was conducted at the Torunos Livestock Preconditioning Center, in the experimental area, situated in Fresnillo 99150, Mexico, property Grupo Exportador Pa Lante S.P.R. de R.L. The experiment reported herein was approved of Bioethics and Animal Welfare Committee of UAMVZ-UAZ, with protocol # 2023/05/19.
Data Availability Statement
The information published in this study is available on request from the corresponding author.
Acknowledgments
The authors thank Manuel Núñez Carrillo, owner of Grupo Exportador Pa Lante S.P.R. de R.L., and his team, for the great help they provided to this project, as well as their interest in research and innovation. Likewise, we thank Paola Isaira Correa Aguado, from the Laboratorio de Análisis Clínicos Veterinarios of the UAZ-UAMVZ, for the determination of serum metabolites and hemogram.
Conflicts of Interest
The authors declare no conflict of interest.
References
- Cooke, R.F. Nutritional and management considerations for beef cattle experiencing stress-induced inflammation. Prof. Anim. Sci. 2017, 33, 1–11. [Google Scholar] [CrossRef]
- Wilson, B.K.; Richards, C.J.; Step, D.L.; Krehbiel, C.R. Best management practices for newly weaned calves for improved health and well-being. J. Anim. Sci. 2017, 95, 2170–2182. [Google Scholar] [CrossRef] [PubMed]
- Loerch, S.C.; Fluharty, F.L. Physiological changes and digestive capabilities of newly received feedlot cattle. J. Anim. Sci. 1999, 77, 1113–1119. [Google Scholar] [CrossRef] [PubMed]
- Richeson, J.T.; Samuelson, K.L.; Tomczak, D.J. Beef species–ruminant nutrition cactus beef symposium: Energy and roughage levels in cattle receiving diets and impacts on health, performance, and immune responses. J. Anim. Sci. 2019, 97, 3596–3604. [Google Scholar] [CrossRef] [PubMed]
- Blecha, F.; Boyles, S.L.; Riley, J.G. Shipping suppresses lymphocyte blastogenic responses in Angus and Brahman× Angus feeder calves. J. Anim. Sci. 1984, 59, 576–583. [Google Scholar] [CrossRef]
- Duff, G.C.; Galyean, M.L. Board-invited review: Recent advances in management of highly stressed, newly received feedlot cattle. J. Anim. Sci. 2007, 85, 823–840. [Google Scholar] [CrossRef]
- Galyean, M.L.; Duff, G.C.; Rivera, J.D. Galyean Appreciation Club Review: Revisiting nutrition and health of newly received cattle—What have we learned in the last 15 years? J. Anim. Sci. 2022, 100, skac067. [Google Scholar] [CrossRef]
- Chilliard, Y.; Anne, F.; Yannick, F.; Muriel, B.; Jacques, R.; François, B. Adipose Tissue Metabolism and Its Role in Adaptations to Undernutrition in Ruminants. Proc. Nutr. Soc. 2000, 59, 127–134. [Google Scholar] [CrossRef]
- Hutcheson, D.P. Receiving rations for feedlot cattle. In Beef Cattle Science Handbook, 21st ed.; International Stockmen’s School: Tuscon, AZ, USA, 1987; pp. 417–421. ISBN 9780941471008. [Google Scholar]
- Galyean, M.L.; Hubbert, M.E. Effects of season, health, and management on feed intake by beef cattle. In Symposium: Intake by Feedlot Cattle; Oklahoma Agricultural Experiment Station: Stillwater, OK, USA, 1995; pp. 226–234. [Google Scholar]
- Cole, N.A. Nutrition and disease interactions. In Review of Bovine Respiratory Disease—Schering-Plough Animal Health; Smith, R., Ed.; Veterinary Learning Systems: Trenton, NJ, USA, 1996; pp. 57–74. [Google Scholar]
- Fluharty, F.L.; Loerch, S.C. Effects of dietary energy source and level on performance of newly arrived feedlot calves. J. Anim. Sci. 1996, 74, 504–513. [Google Scholar] [CrossRef]
- Lofgreen, G.P. Nutrition and management of stressed beef calves. Vet. Clin. N. Am. Food Anim. Pract. 1983, 5, 87–101. [Google Scholar] [CrossRef]
- Lofgreen, G.P.; Kiesling, H.E. Energy Levels in Receiving Diets for Yearling Cattle. Prof. Anim. Sci. 1986, 2, 23–26. [Google Scholar] [CrossRef]
- Smerchek, D.T.; Buckhaus, E.M.; Miller, K.D.; Smith, Z.K. Increasing hay inclusion in silage-based receiving diets and its effects on performance and energy utilization in newly weaned beef steers. Transl. Anim. Sci. 2020, 4, 848–853. [Google Scholar] [CrossRef]
- Rivera, J.D.; Galyean, M.L.; Nichols, W.T. Review: Dietary roughage concentration and health of newly received cattle. Prof. Anim. Sci. 2005, 21, 345–351. [Google Scholar] [CrossRef]
- Reinhardt, C.; Thomson, D.U. Nutrition of newly received feedlot cattle. Vet. Clin. Food Anim. Pract. 2015, 31, 283–294. [Google Scholar] [CrossRef] [PubMed]
- Osorio-Teran, A.I.; Mendoza-Martínez, G.D.; Miranda-Romero, L.A.; Martínez-Gomez, D.; Hernández-García, P.A.; Martínez-García, J.A. Effect of calcium propionate and monensin on in vitro digestibility and gas production. Rev. Bras. Zootec. 2017, 46, 348–353. [Google Scholar] [CrossRef]
- Murillo-Ortiz, M.; Pámanes-Carrasco, G.; Castillo, Y.; Ortiz-Robledo, F.; Herrera-Torres, E. Evaluation of monensin, yeast and glucogenic precursor on growth performance, ruminal fermentation and digestive kinetics of feedlot steers. Indian J. Anim. Res. 2019, B-1003, 1–4. [Google Scholar] [CrossRef]
- Sano, H.; Fujita, T. Effect of supplemental calcium propionate on insulin action to blood glucose metabolism in adult sheep. Rep. Nut. Dev. 2006, 46, 9–18. [Google Scholar] [CrossRef]
- Aiello, R.J.; Armentano, L.E.; Bertics, S.J.; Murphy, A.T. Volatile fatty acid uptake and propionate metabolism in ruminant hepatocytes. J. Dairy Sci. 1989, 72, 942–949. [Google Scholar] [CrossRef]
- Carrillo-Muro, O.; Rivera-Villegas, A.; Hernández-Briano, P.; López-Carlos, M.A.; Aguilera-Soto, J.I.; Estrada-Angulo, A.; Mendez-Llorente, F. Effect of calcium propionate level on the growth performance, carcass characteristics, and meat quality of feedlot ram lambs. Small Rumin. Res. 2022, 207, 106618. [Google Scholar] [CrossRef]
- Carrillo-Muro, O.; Rivera-Villegas, A.; Hernandez-Briano, P.; Lopez-Carlos, M.A.; Castro-Perez, B.I. Effect of Dietary Calcium Propionate Inclusion Period on the Growth Performance, Carcass Characteristics, and Meat Quality of Feedlot Ram Lambs. Agriculture 2023, 13, 1577. [Google Scholar] [CrossRef]
- NRC (National Research Council). Nutritive Requirements of Beef Cattle, 8th ed.; National Academy of Science: Washington, DC, USA, 2016. [Google Scholar] [CrossRef]
- AOAC (Official Methods of Analysis). Official Methods of Analysis of AOAC International, 20th ed.; AOAC: Rockville, MD, USA, 2016. [Google Scholar]
- Russell, K.E.; Roussel, A.J. Evaluation of the ruminant serum chemistry profile. Vet. Clin. Food Anim. 2007, 23, 403–426. [Google Scholar] [CrossRef] [PubMed]
- Hopkins, D.L.; Brooks, A.A.; Johnston, A.R. Factors affecting subcutaneous fat depth at two sites on beef carcasses. Aust. J. Exp. Agric. 1993, 33, 129–133. [Google Scholar] [CrossRef]
- Kaneko, J.J.; Harvey, J.W.; Bruss, M.L. Apendixes. In Clinical Biochemistry of Domestic Animals, 6th ed.; Academic Press: San Diego, CA, USA, 2008; pp. 873–904. ISBN 9780123704917. [Google Scholar]
- Meyer, D.J.; Harvey, J.W. Veterinary Laboratory Medicine, Interpretation and Diagnosis, 3rd ed.; Saunders: Philadelphia, PA, USA, 2004; Volume 33, p. 182. ISBN 9780721689265. [Google Scholar]
- Adkins, M.L.; Rollin, E.; Heins, B.D.; Berghaus, R.D.; Credille, B.C. Evaluation of serum metabolic parameters as predictors of bovine respiratory disease events in high-risk beef stocker calves. Bov. Pract. 2020, 54, 9–16. [Google Scholar] [CrossRef]
- Jain, N.C. Comparative hematology of common domestic animals. In Essentials of Veterinary Hematology; Wiley: Hoboken, NJ, USA, 1993; Volume 1, pp. 19–53. [Google Scholar]
- George, J.W.; Snipes, J.; Lane, V.M. Comparison of bovine hematology reference intervals from 1957 to 2006. Vet. Clin. Pathol. 2010, 39, 138–148. [Google Scholar] [CrossRef]
- Otter, A. Diagnostic blood biochemistry and haematology in cattle. Practice 2013, 35, 7–16. [Google Scholar] [CrossRef]
- Harvey, J.W. Veterinary Hematology: A Diagnostic Guide and Color Atlas; Elsevier Health Sciences: St. Louis, MO, USA, 2011; pp. 49–121. ISBN 978437701739. [Google Scholar]
- Wood, R.D. Hematology of bovids. In Schalm’s Veterinary Hematology; Weiss, D.J., Wardrop, K.J., Schalm, O.W., Eds.; John Wiley & Sons, Incorporated: New York, NY, USA, 2010; pp. 1004–1011. ISBN 9780813817989. [Google Scholar]
- Lofgreen, G.P.; Givens, R.L.; Morrison, S.R.; Bond, T.E. Effect of drinking water temperature on beef cattle performance. J. Anim. Sci. 1975, 40, 223–229. [Google Scholar] [CrossRef]
- Lofgreen, G.P. Nutrition and management of stressed beef calves. An update. Vet. Clin. N. Am. Food Anim. Pract. 1988, 4, 509–522. [Google Scholar] [CrossRef]
- Spore, T.J.; Montgomery, S.P.; Titgemeyer, E.C.; Hanzlicek, G.A.; Vahl, C.I.; Nagaraja, T.G.; Cavalli, K.T.; Hollenbeck, W.R.; Wahl, R.A.; Blasi, D.A. Effects of a high-energy programmed feeding protocol on nutrient digestibility, health, and performance of newly received growing beef cattle. Appl. Anim. Sci. 2019, 35, 397–407. [Google Scholar] [CrossRef]
- Tomczak, D.J.; Lockard, C.L.; Jennings, J.S.; Richeson, J.T. Performance, rumination, and rumen pH responses to different dietary energy density and feed management strategies in auction-derived feedlot cattle. J. Anim. Sci. 2019, 97, 4682–4690. [Google Scholar] [CrossRef]
- Crawford, D.M.; Richeson, J.T.; Perkins, T.L.; Samuelson, K.L. Feeding a high-energy finishing diet upon arrival to high-risk feedlot calves: Effects on health, performance, ruminal pH, rumination, serum metabolites, and carcass traits. J. Anim. Sci. 2022, 100, 1–12. [Google Scholar] [CrossRef]
- Mowat, D.N.; Chang, X.; Yang, W.Z. Chelated chromium for stressed feeder calves. Can. J. Anim. Sci. 1993, 73, 49–55. [Google Scholar] [CrossRef]
- Moonsie-Shageer, S.; Mowat, D.N. Effect of level of supplemental chromium on performance, serum constituents, and immune response of stressed feeder steer calves. J. Anim. Sci. 1993, 71, 232–238. [Google Scholar] [CrossRef] [PubMed]
- Bernhard, B.C.; Burdick, N.C.; Rounds, W.; Rathmann, R.J.; Carroll, J.A.; Finck, D.N.; Jennings, M.A.; Young, T.R.; Johnson, B.J. Chromium supplementation alters the performance and health of feedlot cattle during the receiving period and enhances their metabolic response to a lipopolysaccharide challenge. J. Anim. Sci. 2012, 90, 3879–3888. [Google Scholar] [CrossRef] [PubMed]
- Parsons, G.L.; Shelor, M.K.; Drouillard, J.S. Performance and carcass traits of finishing heifers fed crude glycerin. J. Anim. Sci. 2009, 87, 653–657. [Google Scholar] [CrossRef]
- Carey, R.E.; Samuelson, K.L.; Oosthuysen, E.R.; Lopez, F.A.; Pillmore, S.L.; Klump, L.T.; Burdick-Sanchez, N.C.; Carroll, J.A.; Hernandez-Gifford, J.A.; Löest, C.A. Glycerin supplementation via drinking water alters nitrogen balance and immune response of beef steers during an endotoxin challenge. Proc. West. Sect. Amer. Soc. Anim. Sci. 2017, 68, 70–75. [Google Scholar]
- Hales, K.E.; Foote, A.P.; Brown-Brandl, T.M.; Freetly, H.C. Effects of dietary glycerin inclusion at 0, 5, 10, and 15 percent of dry matter on energy metabolism and nutrient balance in finishing beef steers. J. Anim. Sci. 2015, 93, 348–356. [Google Scholar] [CrossRef]
- Pritchard, R.H.; Mendez, J.K. Effects of preconditioning on pre-and post-shipment performance of feeder calves. J. Anim. Sci. 1990, 68, 28–34. [Google Scholar] [CrossRef]
- Preston, R.L. Receiving Cattle Nutrition. Vet. Clin. Food Anim. 2007, 23, 193–205. [Google Scholar] [CrossRef]
- Lofgreen, G.P.; Dunbar, J.R.; Addis, D.G.; Clark, J.G. Energy level in starting rations for calves subjected to marketing and shipping stress. J. Anim. Sci. 1975, 41, 1256–1265. [Google Scholar] [CrossRef]
- Allen, M.S. Drives and limits to feed intake in ruminants. Anim. Prod. Sci. 2014, 54, 1513–1524. [Google Scholar] [CrossRef]
- Allen, M.S.; Bradford, B.J.; Oba, M. Board-invited review: The hepatic oxidation theory of the control of feed intake and its application to ruminants. J. Anim. Sci. 2009, 87, 3317–3334. [Google Scholar] [CrossRef]
- Oba, M.; Allen, M.S. Dose-response effects of intrauminal infusion of propionate on feeding behavior of lactating cows in early or midlactation. J. Dairy Sci. 2003, 86, 2922–2931. [Google Scholar] [CrossRef]
- Plum, L.; Schubert, M.; Bruning, J.C. The role of insulin receptor signaling in the brain. Trends Endocrinol. Metab. 2005, 16, 59–65. [Google Scholar] [CrossRef]
- Porte, D.J.; Baskin, D.G.; Schwartz, M.W. Insulin signaling in the central nervous system: A critical role in metabolic homeostasis and disease from C. elegans to humans. Diabetes 2005, 54, 1264–1276. [Google Scholar] [CrossRef] [PubMed]
- Latimer, K.S. Duncan and Prasse’s Veterinary Laboratory Medicine: Clinical Pathology, 4th ed.; Wiley: Hoboken, NJ, USA, 2011; ISBN 849634410X/9788496344105. [Google Scholar]
- Ladeira, M.M.; Carvalho, J.R.R.; Chizzotti, M.L.; Teixeira, P.D.; Dias, J.C.O.; Gionbelli, T.R.; Rodrigues, A.C.; Oliveira, D.M. Effect of increasing levels of glycerin on growth rate, carcass traits and liver gluconeogenesis in young bulls. Anim. Feed Sci. Technol. 2016, 219, 241–248. [Google Scholar] [CrossRef]
- de Freitas Almeida, M.M.S.; de Araújo, M.J.; da Costa Torreão, J.N.; Marques, C.A.T.; Nogueira, A.F.S.; Pereira, E.A.; Sejian, V. Crude glycerin inclusion in Santa Inês ewes’ diet before and during the breeding season: Its effects on physiological parameters, hematological variables, and reproductive performance. Semin. Cienc. Agrar. 2020, 41, 1735–1772. [Google Scholar] [CrossRef]
- Silva, D.A.V.; Ezequiel, J.M.B.; Paschoaloto, J.R.; Almeida, M.T.C. Roughages and crude glycerin on beefcattle diets: Effect on the hemogram and seric biochemistry/volumosos e glicerina bruta na dieta de bovinos de corte: Efeito sobre o hemograma e bioquímica sérica. Ars. Vet. 2013, 29, 183–189. [Google Scholar] [CrossRef]
- Carlson, P.G. Clinical chemistry test. In Large Animal Internal Medicine, 4th ed.; Smith, B.P., Ed.; Elsevier Health Sciences: Amsterdam, The Netherlands, 2009; pp. 375–398. ISBN 9780323042970. [Google Scholar]
- Doornenbal, H.; Tong, A.K.; Murray, N.L. Reference values of blood parameters in beef cattle of different ages and stages of lactation. Can. Vet. Res. 1988, 52, 99–105. [Google Scholar] [PubMed]
- Kohn, R.; Dinneen, M.; Russek-Cohen, E. Using blood urea nitrogen to predict nitrogen excretion and efficiency of nitrogen utilization in cattle, sheep, goats, horses, pigs, and rats. J. Anim. Sci. 2005, 83, 879–889. [Google Scholar] [CrossRef]
- Eicher, R.; Liesegang, A.; Bouchard, E.; Tremblay, A. Effect of cow-specific factors and feeding frequency of concentrate on diurnal variations of blood metabolites in dairy cows. Am. J. Vet. Res. 1999, 60, 1493–1499. [Google Scholar]
- Waggoner, J.W.; Löest, C.A.; Turner, J.L.; Mathis, C.P.; Hallford, D.M. Effects of dietary protein and bacterial lipopolysaccharide infusion on nitrogen metabolism and hormonal responses of growing beef steers. J. Anim. Sci. 2009, 87, 3656–3668. [Google Scholar] [CrossRef] [PubMed]
- Richeson, J.T.; Beck, P.A.; Hughes, H.D.; Hubbell, D.S.; Gadberry, M.S.; Kegley, E.B.; Powell, J.G.; Prouty, F.L. Effect of growth implant regimen on health, performance, and immunity of high-risk, newly received stocker cattle. J. Anim. Sci. 2015, 93, 4089–4097. [Google Scholar] [CrossRef] [PubMed]
- Petersen, H.H.; Nielsen, J.P.; Heegaard, P.M.H. Application of acute phase protein measurements in veterinary clinical chemistry. Vet. Res. 2004, 35, 163–187. [Google Scholar] [CrossRef] [PubMed]
- Bossaert, P.; Trevisi, E.; Opsomer, G.; Bertoni, G.; De Vliegher, S.; Leroy, J.L.M.R. The association between indicators of inflammation and liver variables during the transition period in high-yielding dairy cows: An observational study. Vet. J. 2012, 192, 222–225. [Google Scholar] [CrossRef]
- Sejersen, H.; Sørensen, M.T.; Larsen, T.; Bendixen, E.; Ingvartsen, K.L. Liver protein expression in dairy cows with high liver triglycerides in early lactation. J. Dairy Sci. 2012, 95, 2409–2421. [Google Scholar] [CrossRef]
- Fernandes, S.R.; Freitas, J.A.; Souza, D.F.; Kowalski, L.H.; Dittrich, R.L.; Rossi, P., Jr.; Silva, C.J.A. Lipidograma como ferramenta na avaliação do metabolismo energético em ruminantes. Rev. Bras. Agrociênc. 2012, 8, 1–32. [Google Scholar]
- Ndlovu, T.; Chimonyo, M.; Okoh, A.I.; Muchenje, V.; Dzama, K.; Raats, J.G. Assessing the nutritional status of beef cattle: Current practices and future prospects. Afr. J. Biotechnol. 2007, 6, 2727–2734. [Google Scholar] [CrossRef]
- Hersom, M.J.; Wettemann, R.P.; Krehbiel, C.R.; Horn, G.W.; Keisler, D.H. Effect of live weight gain of steers during winter grazing: III. Blood metabolites and hormones during feedlot finishing. J. Anim. Sci. 2004, 82, 2059–2068. [Google Scholar] [CrossRef]
- Huntington, G.B. Starch utilization by ruminants: From basics to the bunk. J. Anim. Sci. 1997, 75, 852–867. [Google Scholar] [CrossRef]
- Oosthuysen, E.R.; Hubbert, M.E.; Samuelson, K.L.; Scholljegerdes, E.J.; Duff, G.C.; Löest, C.A. Health evaluation of immune-stimulated and hay-supplemented feedlot receiving calves as assessed by blood gas analysis. Proc. Am. Soc. Anim. 2016, 67, 83–87. [Google Scholar] [CrossRef]
- Radostits, O.M.; Gay, M.L.; Blood, D.C.; Hinchcliff, K.W. Veterinary Medicine, 10th ed.; Baillier Tindall: London, UK, 2007; pp. 303–311. ISBN 978-0702027772. [Google Scholar]
- Herdt, T.H. Fuel homeostasis in the ruminant. Vet. Clin. Food Anim. Pract. 1988, 4, 213–231. [Google Scholar] [CrossRef] [PubMed]
- Maynard, L.A.; Loosli, J.K.; Hintz, H.F.; Warner, R.G. Animal Nutrition, 7th ed.; McGraw-Hill: New York, NY, USA, 1979. [Google Scholar]
- Robbins, C.T. Wildlife Nutrition and Feeding; Academic Press: San Diego, CA, USA, 1992; ISBN 9781483258843. [Google Scholar]
- Contreras, G.A.; Strieder-Barboza, C.; Raphael, W. Adipose tissue lipolysis and remodeling during the transition period of dairy cows. J. Anim. Sci. Biotechnol. 2017, 8, 41. [Google Scholar] [CrossRef] [PubMed]
- Vernon, R.G.; Doris, R.; Finley, E.; Houslay, M.D.; Kilgour, E.; Lindsay-Watt, S. Effects of lactation on the signal transduction systems regulating lipolysis in sheep subcutaneous and omental adipose tissue. Biochem. J. 1995, 308, 291–296. [Google Scholar] [CrossRef] [PubMed]
- Sumner, J.M.; McNamara, J.P. Expression of lipolytic genes in the adipose tissue of pregnant and lactating Holstein dairy cattle. J. Dairy Sci. 2007, 90, 5237–5246. [Google Scholar] [CrossRef]
- Hocquette, J.F.; Ortigues-Marty, I.; Vermorel, M. Manipulation of tissue energy metabolism in meat-producing ruminants-review. Asian-Australas. J. Anim. Sci. 2001, 14, 720–732. [Google Scholar] [CrossRef]
- Owens, F.N.; Dubeski, P.; Hanson, C.F. Factors that alter the growth and development of ruminants. J. Anim. Sci. 1993, 71, 3138–3150. [Google Scholar] [CrossRef]
- Davis, T.A.; Burrin, D.G.; Fiorotto, M.L.; Reeds, P.J.; Jahoor, F. Roles of insulin and amino acids in the regulation of protein synthesis in the neonate. J. Nutr. 1998, 128, 347–350. [Google Scholar] [CrossRef]
- Klinger, S.A.; Campbell, J.; Wildeman, B.; Block, H.; McKinnon, J.J. The effects of limit feeding a high-energy barley-based diet to backgrounding cattle in western Canada. Can. J. Anim. Sci. 2007, 87, 385–391. [Google Scholar] [CrossRef]
- Martínez-Aispuro, J.; Sanchez-Torres, M.; Mendoza-Martínez, G.; Cordero Mora, J.; Figueroa-Velasco, J.; Ayala-Monter, M.; Crosby-Galvan, M. Addition of calcium propionate to finishing lamb diets. Vet. Mex. 2018, 5, 37–46. [Google Scholar] [CrossRef]
- Lee-Rangel, H.A.; Mendoza, G.D.; Gonzalez, S.S. Effect of calcium propionate and sorghum level on lamb performance. Anim. Feed Sci. Technol. 2012, 177, 237–241. [Google Scholar] [CrossRef]
- Mendoza-Martínez, G.D.; Pinos-Rodríguez, J.M.; Lee-Rangel, H.A.; Hernández-García, P.A.; Rojo-Rubio, R.; Relling, A. Effects of dietary calcium propionate on growth performance and carcass characteristics of finishing lambs. Anim. Prod. Sci. 2016, 56, 1194–1198. [Google Scholar] [CrossRef]
- Lopez, F.A.; Oosthuysen, E.R.; Duff, G.C.; Richeson, J.T.; Samuelson, K.L.; Hubbert, M.E.; Löest, C.A. Health, performance, and complete blood counts of newly received feedlot heifers in response to an oral drench of water and crude glycerin. Transl. Anim. Sci. 2018, 2, 74–78. [Google Scholar] [CrossRef]
Disclaimer/Publisher’s Note: The statements, opinions and data contained in all publications are solely those of the individual author(s) and contributor(s) and not of MDPI and/or the editor(s). MDPI and/or the editor(s) disclaim responsibility for any injury to people or property resulting from any ideas, methods, instructions or products referred to in the content. |
© 2023 by the authors. Licensee MDPI, Basel, Switzerland. This article is an open access article distributed under the terms and conditions of the Creative Commons Attribution (CC BY) license (https://creativecommons.org/licenses/by/4.0/).