Article

Multivariate Analysis of Clean Technologies in Agricultural and Livestock Companies in Castilla y León

by
Saudi-Yulieth Enciso-Alfaro
1,*,
Víctor Amor-Esteban
2,
Tânia-Cristina Azevedo
3 and
Isabel-María García-Sánchez
1,*
1
IME-Instituto Multidisciplinar de Empresa, Departamento de Administración y Economía de la Empresa, Universidad de Salamanca, 37007 Salamanca, Spain
2
Departamento de Estadística, Universidad de Salamanca, 37008 Salamanca, Spain
3
Departamento de Ciências Sociais Aplicadas, Universidade Estadual de Feira de Santana (UEFS), Salvador 44036-900, Bahia, Brazil
*
Authors to whom correspondence should be addressed.
Agriculture 2023, 13(11), 2087; https://doi.org/10.3390/agriculture13112087
Submission received: 2 October 2023 / Revised: 27 October 2023 / Accepted: 31 October 2023 / Published: 2 November 2023
(This article belongs to the Section Ecosystem, Environment and Climate Change in Agriculture)

Abstract

:
Through multivariate data analysis, this research aims to study the current commitment of agricultural and livestock companies in Castilla y León to the mitigation of their negative environmental impacts and whether it is conditioned by their resources and capabilities, through the implementation of clean technologies. Agricultural and livestock production is vital for the subsistence of the world’s population, but the productive activities of this sector can have unfavorable consequences on the environment. These business projects are designed to mitigate the negative impacts on three essential environmental elements: air, freshwater and ecosystems (fauna and flora). The results were derived via the External Logistics Biplot methodology, whose purpose is to determine the influence of various factors or variables on a result, and which shows that 63% of the companies analyzed have invested in technological systems to optimize water use, 40% have invested in technologies and systems to avoid and control carbon dioxide (CO2) and Greenhouse Gases (GHG) emissions, and 24% of companies have implemented technologies for recycling and reusing waste, showing a hierarchical preference in mitigating risks related to freshwater scarcity, emitting polluting emissions into the air and the conservation of ecosystems.

1. Introduction

One of the main challenges of the food sector is related to responding to a shortage of resources for a growing world population. On the other hand, the fight against climate change supposes enormous challenges for one of the most important segments of this industry, the agricultural and livestock sector.
These activities have traditionally benefited from privileged climatology and geographical situations, which makes them especially vulnerable to climate change. Increased soil erosion, floods, droughts and forest fires, along with increases in pests and diseases, are some of its direct effects [1]. At the same time, the activities of these sectors also contribute to climate change: the specialization and intensification of crops, the use of chemical inputs and the industrialization of livestock production have negative effects on water, soil, air, biodiversity and habitat conservation [2,3].
In this sense, Passarelli [4] stated that companies in the agricultural and livestock sector develop activities such as the cultivation and harvesting of natural foods or the production of proteins that are necessary for the subsistence of populations based on their eating habits, and must be invested in technologies that not only generate increases in productivity or crop efficiency, but are also in line with social demands to reduce negative impacts on the environment.
Authors such as Gabriel and Scharty [2,5] indicate that the dynamic technological development of agricultural and livestock infrastructure favors a reduction in negative impacts on agro-ecosystems, such as the extensive use of energy, scarce water resources and reductions in terrestrial resources through the use of irrigation networks based on wireless sensors, sensors for spreading liquid manure for land fertilization or the implementation of systems to monitor the adequate amount of fertilizer that the land requires, avoiding the oversaturation of the soil and the risk of contaminating groundwater. However, the high investment and maintenance costs, as well as the lack of training of farmers, have led to a low use of these technologies [2,5].
Additionally, the findings of Malhi [6] show the development of technologically intelligent practices in the agricultural sector to mitigate climate change and ensure the sustainability of the sector by ensuring the balance of nutrients in the soil and reducing the carbon footprint through crop diversification, precise nutrient application, zero tillage and crop residue management. The effectiveness of these practices is strongly conditioned by the support of the local government in the education and training of farmers, which facilitates the operation of crops [6].
Likewise, the findings of Mariantonietta and Coderoni [7,8] reflect that the efficient use of economic resources of agricultural and livestock companies allows the establishment of investments in technological equipment that favor a reduction in greenhouse gas (GHG, hereinafter) emissions, especially carbon dioxide (CO2 in forward), generating economic value for companies and environmental quality in their immediate surroundings.
In this way, the previous literature on clean technologies [1,2,5,6] suggests that their implementation allows for achieving conditions environmentally favorable for the agricultural and livestock sector. Firstly, this is achieved by avoiding CO2 emissions by opting for renewable energy systems, such as the use of solar panels to meet the energy needs of farms, contributing to a reduction in CO2 emissions from the agriculture and livestock sectors, since these are responsible for 11% of the total emissions of GHG in the European Union [9,10].
Secondly, the optimization of water resources in a sector highly dependent on fresh water to carry out its activities [11,12] allows for mitigating the risk of water scarcity in areas with water stress and ensuring sustainable agricultural and livestock production [11] through the implementation of drip irrigation systems, wastewater recycling or automated systems with sensors for the hydration of animals that release the amount of water necessary to maintain the well-being of the animals, once the previously existing amount of water has been exhausted [12,13].
Thirdly, we might encourage eliminating the generation of waste and pollutants in ecosystems through the reuse of goods discarded at different stages of the production process; for example, organic waste from poultry production can be used as compost on arable land, reducing the use of chemical products in composting the land, as well as the combination and application on land of cattle urine and food waste, contributing to the fertility of arable land [10,14].
The results obtained by Casson, Kircher, Kumar, Kumar Sarangi and Molina-Maturano [15,16,17,18,19] indicate the frequent use of clean technologies in the agricultural and livestock sectors oriented towards changes in renewable and efficient energy sources, such as solar panels, alternative crop irrigation systems or automated systems for the hydration of animals, recycling systems for agricultural materials or waste, as well as the implementation of control systems for gas emissions or polluting substances. In this regard, in Figure 1, we describe the most common initiatives that have been identified in previous studies and the main environmental risks that can be thus mitigated, as well as the environmental elements that they directly favor.
In addition, it is necessary to consider that, according to the resources and capabilities theory [20], companies that have a growing and constant level of operational income acquire economic and financial power that translates into investments in technologically advanced and environmentally efficient machinery, systems or projects, constituting a disruptor in favor of agro-ecosystems, such as investments in clean technologies. All this is reinforced with the accumulation of the knowledge and capabilities of the people involved in directing investments and operationalizing projects [21]. In this way, monetary funds help to consolidate corporate strategies to ensure their competitiveness in an environmentally demanding context [22,23].
With the aim being to study the current commitments of agro-livestock firms to the mitigation of their negative environmental impacts, as conditioned by their resources and capabilities, this manuscript has the following research objectives, or questions (RQ):
  • RQ1. To infer the status of clean technologies used for the management of air, water and waste in the agricultural and livestock sectors, and the environmental commitment strategies;
  • RQ2. To determine the relationship between the resources and capacities of agro-livestock companies and their investments in these clean technologies and environmental commitment strategies;
  • RQ3. To analyze the relationship of the adoption of clean technologies and environmental commitment strategies with agro-livestock firms’ profitability.
In order to answer these questions, we have selected the 150 main agro-livestock firms of the Autonomous Community of Castilla y León, Spain. The agricultural and livestock sectors in Spain are a strategic sector of great social, territorial, environmental and economic importance. They are an area vital importance for the economy in terms of employment. But they emit more than 10% of the total greenhouse gases. It is thus important to know the degree of implementation of new tools and technologies, contributing to scientific and professional knowledge in relation to the path taken and the challenges to be addressed. This specific study of the companies of Castilla y León is based on two differentiated characteristics [24] that highlight their importance to the community, such as: a greater participation in the regional economy, compared to the national one, and the support the food industry provides in generating employment and wealth. Furthermore, Castilla y León is at the forefront of such important areas as the production of cereals, fodder, potatoes, sugar beets, leeks, beef and sheep heads, sheep milk, carrots, legumes such as lentils and chickpeas, sunflower, dairy sheep, suckling pigs, Iberian pig heads, beekeeping, rabbit farming, feed, laying poultry, etc., which makes the region an agricultural power at the national level. In addition, the agricultural and livestock sector is an important pillar of the economic and social development of this autonomous community, being considered one of the main paths to a better future for Castilla y León.
In order to obtain and evaluate the practical implications in a simple way, facilitating their use by users who are not educated in these techniques, such as professionals, we have chosen to use Biplot models with which we can undertake a multivariate analysis whose purpose is to determine the influences of several factors or variables on a result. This will allow for determining the different commitments of agricultural and livestock companies based on the relationships observed amongst their investments in the clean technologies analyzed, as well as the relationships with their resources and capacities and the generation of financial benefits.
Our results show that approximately 63% of Castile-Leonese companies have invested in technological systems to optimize their use of water, and in this way mitigate the risks of freshwater scarcity. This percentage is around 40% in the case of clean technologies and systems used to control and monitor CO2 and GHG emissions, as elements used to manage their adverse effects on the air. Likewise, 24% of the agricultural and livestock companies analyzed have implemented technologies for the recycling and reuse of waste generated via their activities. These investments are strongly associated with the resources and capabilities possessed by larger companies, contributing to the generation of higher returns associated with operating income and, to a lesser extent, profitability.
These results contribute to those of the previous literature by highlighting the progress made in the implementation of clean technologies in the agricultural and livestock sectors at a regional (European) level, which can be used as an academic reference for future trend analyses under a methodological approach that allows us to scrutinize, in detail, business implications in terms of resources and capabilities related to the transition towards technologies that improve productivity levels without worsening the current state of the environment.
Our paper is structured into seven epigraphs in addition to this Introduction. In Section 2, the method is presented, defining the sample, variables and methodology. In the following epigraph, we present a description of the results of the adoption of clean technologies in agricultural and livestock companies in Castilla y León. In Section 5, we present deeper results via a cluster approach based on environmental elements and specific environmental commitments. Section 6 gives a discussion of the results. The study ends with the main conclusions.

2. Method

2.1. Population and Sample

In order to carry out the proposed study, the 150 firms with the highest income in the agricultural and livestock sector in Castilla y León (Spain) were selected as the initial population. The income is taken as the aggregate of all the sales that a company has made, related to its ordinary activity, in a specific period of time, and it is one of the best criteria commonly used to determine the sizes of companies worldwide.
Spanish public administrations are strongly committed to promoting research and innovation to improve the competitiveness of the agricultural and livestock sectors. This commitment is especially important in the Autonomous Community of Castilla y León, due to the greater weight that this sector has in the regional economy, especially in terms of employment and wealth. Furthermore, within the national context, taking into account three indicators (number of industries, turnover and employment), the agri-food industry of Castilla y León ranks third behind those of Catalonia and Andalusia.
On the other hand, the number of smaller agricultural–livestock companies is higher in Castilla y León. In this sense, in this community, the number of existing microenterprises is around 50% of the total number of companies. This factor explains the difficulty of transforming leadership in terms of innovation, research, development, the application of technology and entrepreneurship throughout the entire sector [23].
The 150 biggest agro-livestock firms in Castilla y León generate 67.48% of the sector’s income, according to the economic–financial information available in the SABI database for the year 2021, as well as the last financial year, which ended on 1 May 2023. However, the average sizes of the companies analyzed are variable, allowing us to infer the influence that resources and capabilities can have on investments in clean technologies that contribute to reducing the environmental impacts of their activity, thus conserving the environment and the planet.
In total, 83 of the selected companies did not have a corporate website, and were dropped from the analysis. Therefore, the final sample comprised 67 Castilian-Leonese firms that had information available on their websites about strategies, policies and investments related to clean technologies that will mitigate the environmental risks arising from their business activities. In this regard, Figure 2 shows the economic relevance of the companies that make up the final sample, both in relation to the total and in relation to the population initially selected. The 67 companies with a corporate website showed higher values for operating income, total assets and quantity of employees, with significant differences for the year 2021. There are also significant differences in the mean, median and mean trimmed at 5%. These results confirm the representativeness of the final sample analyzed.
The information related to clean technology projects was identified through the the content analysis methodology, carried out during the month of May and the first week of June 2023. This methodology is based on the identification of documentary sources (text, images, videos, etc.) on the corporate websites of the companies analyzed and their subsequent interpretation [25]. In this context, the interpretation involved the tabulation of information derived from the relevant documentary sources in order to identify the clean technology projects being promoted.

2.2. Variables of Interest

The information required for the multivariate study is related to: (i) the environmental initiatives promoted by agribusinesses, identified through content analysis; and (ii) business resources and capabilities, which give economic–financial information and were extracted from the SABI database. The variables associated with each type of information are described in more detail below.

2.2.1. Environmental Variables (RQ1)

In order to represent the company’s commitment to the adoption of clean technologies and thus to a reduction in the unfavorable consequences of its activities on the environment, following authors like Scharfy, Velasco-Muñoz, Bwambale and Singh [5,10,11,12], 7 dummy variables have been defined for the three environmental elements—air, water and ecosystems—which take the value 1 if the company has invested or implemented the environmental measure, and 0 otherwise.
For example, three variables have been defined for the environmental element air. Air1 represents the acquisition of clean technologies that reduce CO2 and GHG emissions during production processes. Air2 represents the implementation of a CO2 and GHG emissions control system. Air3 represents improvements in energy efficiency.
Two further indicators relate to the environmental element of water. Water1 indicates whether the company has invested in clean technologies to optimize water management. Water2 indicates the implementation of a water control system used in agricultural or livestock activities.
The last two measures relate to the ecosystems (fauna and flora) environmental element. Waste1 identifies the implementation and development of activities that allow the transformation of wastes of plant origin into fertilizers for plants or food for animals. Waste2 identifies the implementation and development of activities towards the reuse of cardboard, paper, glass, plastic and all types of containers and packaging. Table 1 summarizes the descriptions of the variables used.

2.2.2. Financial Variables (RQ2 and RQ3)

The variables relating to the economic–financial dimension of the companies analyzed are related to their resources and capabilities (RQ2) and profitability (RQ3). These have been selected according previous papers [21,23,26]. In this sense, in order to answer RQ2, it has been decided to represent the size of the firm by its total assets (TASSETS). In addition, the tangible and intangible resources available to the company, closely linked to the exercise of its activity, are identified through investment in fixed assets (NON-CURRENT ASSETS) and human capital determined by the quantity of employees (EMPLOYEES). All of these variables illustrate the economic and labor resources of the agricultural–livestock firms and allow us to determine their relationship with clean technology adoption under the premise that higher volumes of them should be associated with greater environmental commitment.
In addition, the inclusion of leverage (LEVERAGE) determines the dependence on external resources compared to the financial autonomy of a company. In general, agricultural–livestock companies show a great preference for self-financing the projects they launch, showing a high degree of aversion to the use of external funds [23]. Additionally, in the event that debt is high, companies have a lower capacity to undertake new projects due to the financing restrictions that this situation entails.
For RQ3, the economic dimension of each company’s activity is also monitored through the amount obtained as a result of the development of its business purpose (OPEINC), financial profitability (ROE) and economic profitability (ROA). The consideration of the relationship between the adoption of clean technologies and profitability is derived from the existing consensus on the favorable effects of sustainability on business results by increasing customer loyalty, employee satisfaction and motivation, and the reputation and image of the company in society [7,8].

2.3. Multivariate Analysis Methodology

Given the multidimensional nature of the data, it is vital to use methods that reflect this multivariate nature. The Biplot methodology is selected due to its utility with respect to other methods and the statistical controls that they incorporate. More concretely, the advantage of juxtaposing the data means it can relate all the data in a single graph for analysis.
The biplot method proposed by Gabriel [27] employs a type of exploratory graph used in statistics; it is a multivariate generalization of a scatter diagram of two variables, where both the columns and the rows of a matrix X are represented. The classical Biplots are called JK-Biplot and GH-Biplot, where the JK-Biplot achieves high quality in the representation of the rows and the GH-Biplot does so for the columns. These methods consist of a matrix U , whose column vectors are orthonormal and contain the r first eigenvectors of X X ; V , an orthonormal matrix whose column vectors are the r first eigenvectors of X X ; and D , which is the diagonal matrix of the r first singular values of X , i.e., the non-negative square roots of the eigenvalues of X X or X X . The JK-Biplot has the notation J for the matrix of row markers, with J = U D , and K for the matrix of column markers, with K = V ; and the GH-Biplot has the notation G for the matrix of row markers, with G = U , and H for the matrix of column markers, with H = V D .
These methods are asymmetric in the sense that they do not give the same quality of representation for the columns and rows of the data matrix. Galindo [18] developed a multivariate method under the name of HJ-Biplot as an alternative to the methods proposed by Gabriel [27], based on a combination of his markers, where H refers to the matrix of column markers, with H = V D , and J to row markers, with J = U D , which allows the rows and columns to be projected in a low-dimensional space, both with the maximum quality of representation and interpretation on the same factorial plane.

2.3.1. HJ-Biplot

The HJ-Biplot [27] is defined as an intuitive and simple representation of markers j i = ( j i , , j n ) for the rows and h j = ( h j , , h p ) for the columns of a matrix X n x p , where the markers are reflected in the same factorial plane with the highest quality of representation. It is part of a singular value decomposition (SVD) of the matrix X n x p previously defined, with X n x p = U n x r D r x r V r x p   w i t h   U U = V V = I r , where U n x r is the eigenvector matrix of X X ; V r x p is the eigenvector matrix of X X , and D r x r is a diagonal matrix, where λ 1 , , λ r correspond to the r eigenvalues of X X or X X .
Thus, the quality of data representation is the same for columns and rows of the data matrix X , whose information is represented in principal coordinates for the clearer interpretation of the row and column relationships (individuals and variables) in factorial axes. As V refers to the eigenvectors of X X , taking into account the relationships that bind U and V   ( U = X V D 1   a n d   V = X U D 1 ) , we can write U D = X V D 1 D = X V , which implies that U D coincides with the projection of the n points that represent the rows on the space of best fit to that point cloud in the least squares sense; therefore, we can ensure that the markers for the rows of an HJ-Biplot coincide with the coordinates of the rows with respect to the factorial axes. In the same way as U refers to the eigenvectors of X X , D V = D D 1   X U = X U , D V coincides with the projection of the points representing the variables on the space of maximum inertia, such that the markers for the columns coincide with the coordinates of the columns, with respect to the factorial axes. Since the quality of the representation of the columns and rows is the same, the positions of the columns and rows can be interpreted in terms of the contributions made by the factor to the element, and by the element to the factor [28].
In an HJ-Biplot graph, the row markers are represented as points on the plane (companies in the study), and the column markers are represented by vectors (economic–financial variables and variables evaluating environmental initiatives). The rules of interpretation of the HJ-Biplot (see Figure 3) on the two-dimensional plane are based on five key points: (1) proximity between points (individuals) translates into similarity between them; (2) the length of vectors (variables) corresponds with their variability, with greater variability in longer vectors; (3) angles between vectors correspond in terms of covariation, as obtuse angles translate into negative correlations, acute angles into positive correlations and right angles into independence of variables; (4) the orthogonal projections of the points on the vectors allow an approximate ordering of individuals with respect to each variable (if the point or group of points is in the same direction as the type of vector, it indicates high values on that variable); and (5) the factorial axes represent gradients, and the contributions of each variable to the latent gradient can be evaluated [29,30].

2.3.2. External Logistic Biplot

Let X be the order of the data matrix ( I × J ) , which comes from the observation of I individuals (the 67 companies from Castilla y León that make up the study) to which J attributes or qualitative characteristics are quantified as associated with binary variables (the seven variables that reflect the use of clean technologies to mitigate environmental risks related to air, water, and ecosystems), which themselves take the value 0 if the characteristic is absent and the value 1 if it is present. The linear Biplots discussed in the previous section outline a linear response along their dimensions, in a manner similar to linear regression; therefore, it is not convenient to use these methods when the data are binary. For this reason, multiple correspondence analysis [31] can be used as a form of Biplot for categorical or binary matrices. This method proposes, as an extension of classical linear projections, the so-called “prediction regions”, wherein the factorial plane is divided into regions that predict each variable or a combination of them. Subsequently, the logistic Biplot [32] appears, and in the same way that the classic Biplots are related to linear regression, this method is related to logistic regression. Two years later, the External Logistic Biplot appeared [33], which combines logistic regression with principal coordinate analysis [34] in the same algorithm.
Let π i j = E ( x i j ) reflect the probability that the j t h variable is present in an individual i, whose coordinates are y i r ( i = 1 , , I ;   r = 1 , , R ) if it is represented on the plane R—dimensional generated by PCA. πij can be written in terms of principal coordinates as:
π i j = e b j 0 + r = 1 R b j r y i r 1 + e b j 0 + r = 1 R b j r y i r
where bjr (j = 1,…, J; r = 1,…, R) are the logistic regression coefficients that correspond to the j-th variable in the r-th dimension. The model represented is equivalent to the general linear model that uses the logit function as a link function to avoid scaling problems.
l o g i t π i j = l o g π i j 1 π i j = b j 0 + r = 1 R b j r y i r = b j 0 + y t b j
where y i = ( y i 1 , , y i R ) and b j = ( b j 1 , , b j R ) . Starting from this, a logit scale Biplot can be defined, and this procedure is called the External Logistic Biplot (ELB) because the coordinates of the I individuals are calculated by an external procedure, such as a PCA. In this way, if the y r are known variables whose number depends only on the one R d i m e n s i o n s that you want to retain, the parameters of b r are obtained by fitting simple logistic regressions using the j t h column of the matrix X as a dependent variable and the y r as independents.
This statistical treatment allows for creating a graph R d i m e n s i o n a l , which is usually two- or three-dimensional, where the y i values are represented as points (individuals) and b j as vectors (variables), which together determine the spatial directions of the Biplot. The projection of the individuals on the line in which each variable is represented allows us to obtain the estimated probability of the presence of the variable in the individuals.
Now, not all variables are significantly associated with the configuration, as is known in modeling problems. As such, a pseudo R 2 can be used as a measure of the quality of representation. Long [35] interpreted this in the same way as in correspondence analysis [36]. Furthermore, when seeking to select variables with high discriminatory capacity, the Bonferroni correction can be used, so that only those variables with p-values below the significance threshold are projected in the Biplot. However, p-values are considerably affected by the number of variables and sample size, and for this reason, Demey [33] proposed using the pseudo R 2 , since it is less sensitive to sample size. This index is applied to organize the data as a highly restrictive value that represents the goodness of fit or the use of the proportion of correct classification; that is, the percentage of coincidences between the estimated matrix according to the logistic regression models and the original binary data matrix. This percentage can be calculated for the columns or rows separately or globally for Biplot representation.
The geometrization of the External Logistic Biplot is the same as those of the Biplots adjusted through linear regression models; that is, the hyperplane of the fit generates a sigmoid response surface, where the projections of the response curves on the subspace of best fit generate linear prediction Biplot axes, even if the fitted response is nonlinear. Vicente-Villardón [32] showed that the projection of the nonlinear response curve onto a low-dimensional subspace is always linear, although the prediction scale on the Biplot axis is not equally spaced. Consequently, the prediction of the probabilities is undertaken in the same way as a linear Biplot (see Figure 4). To facilitate graphical interpretation, at the ends of each vector, prediction points with known probability are set; thus, 0.5 is set as the cut-off point for predicting the presence and 0.75 is used to obtain the direction in which the highest probability is growing.
Following the guidelines for correct application, this method will allow us to determine the variables that most challenge or concern companies, and, on the contrary, the most widely forgotten ones, as well as the relationships between them or the development profiles shown by groups of companies. In the representation of the External Logistic Biplot (see Figure 5), the variables (columns of the matrix) will be represented by a vector (Agriculture 13 02087 i001
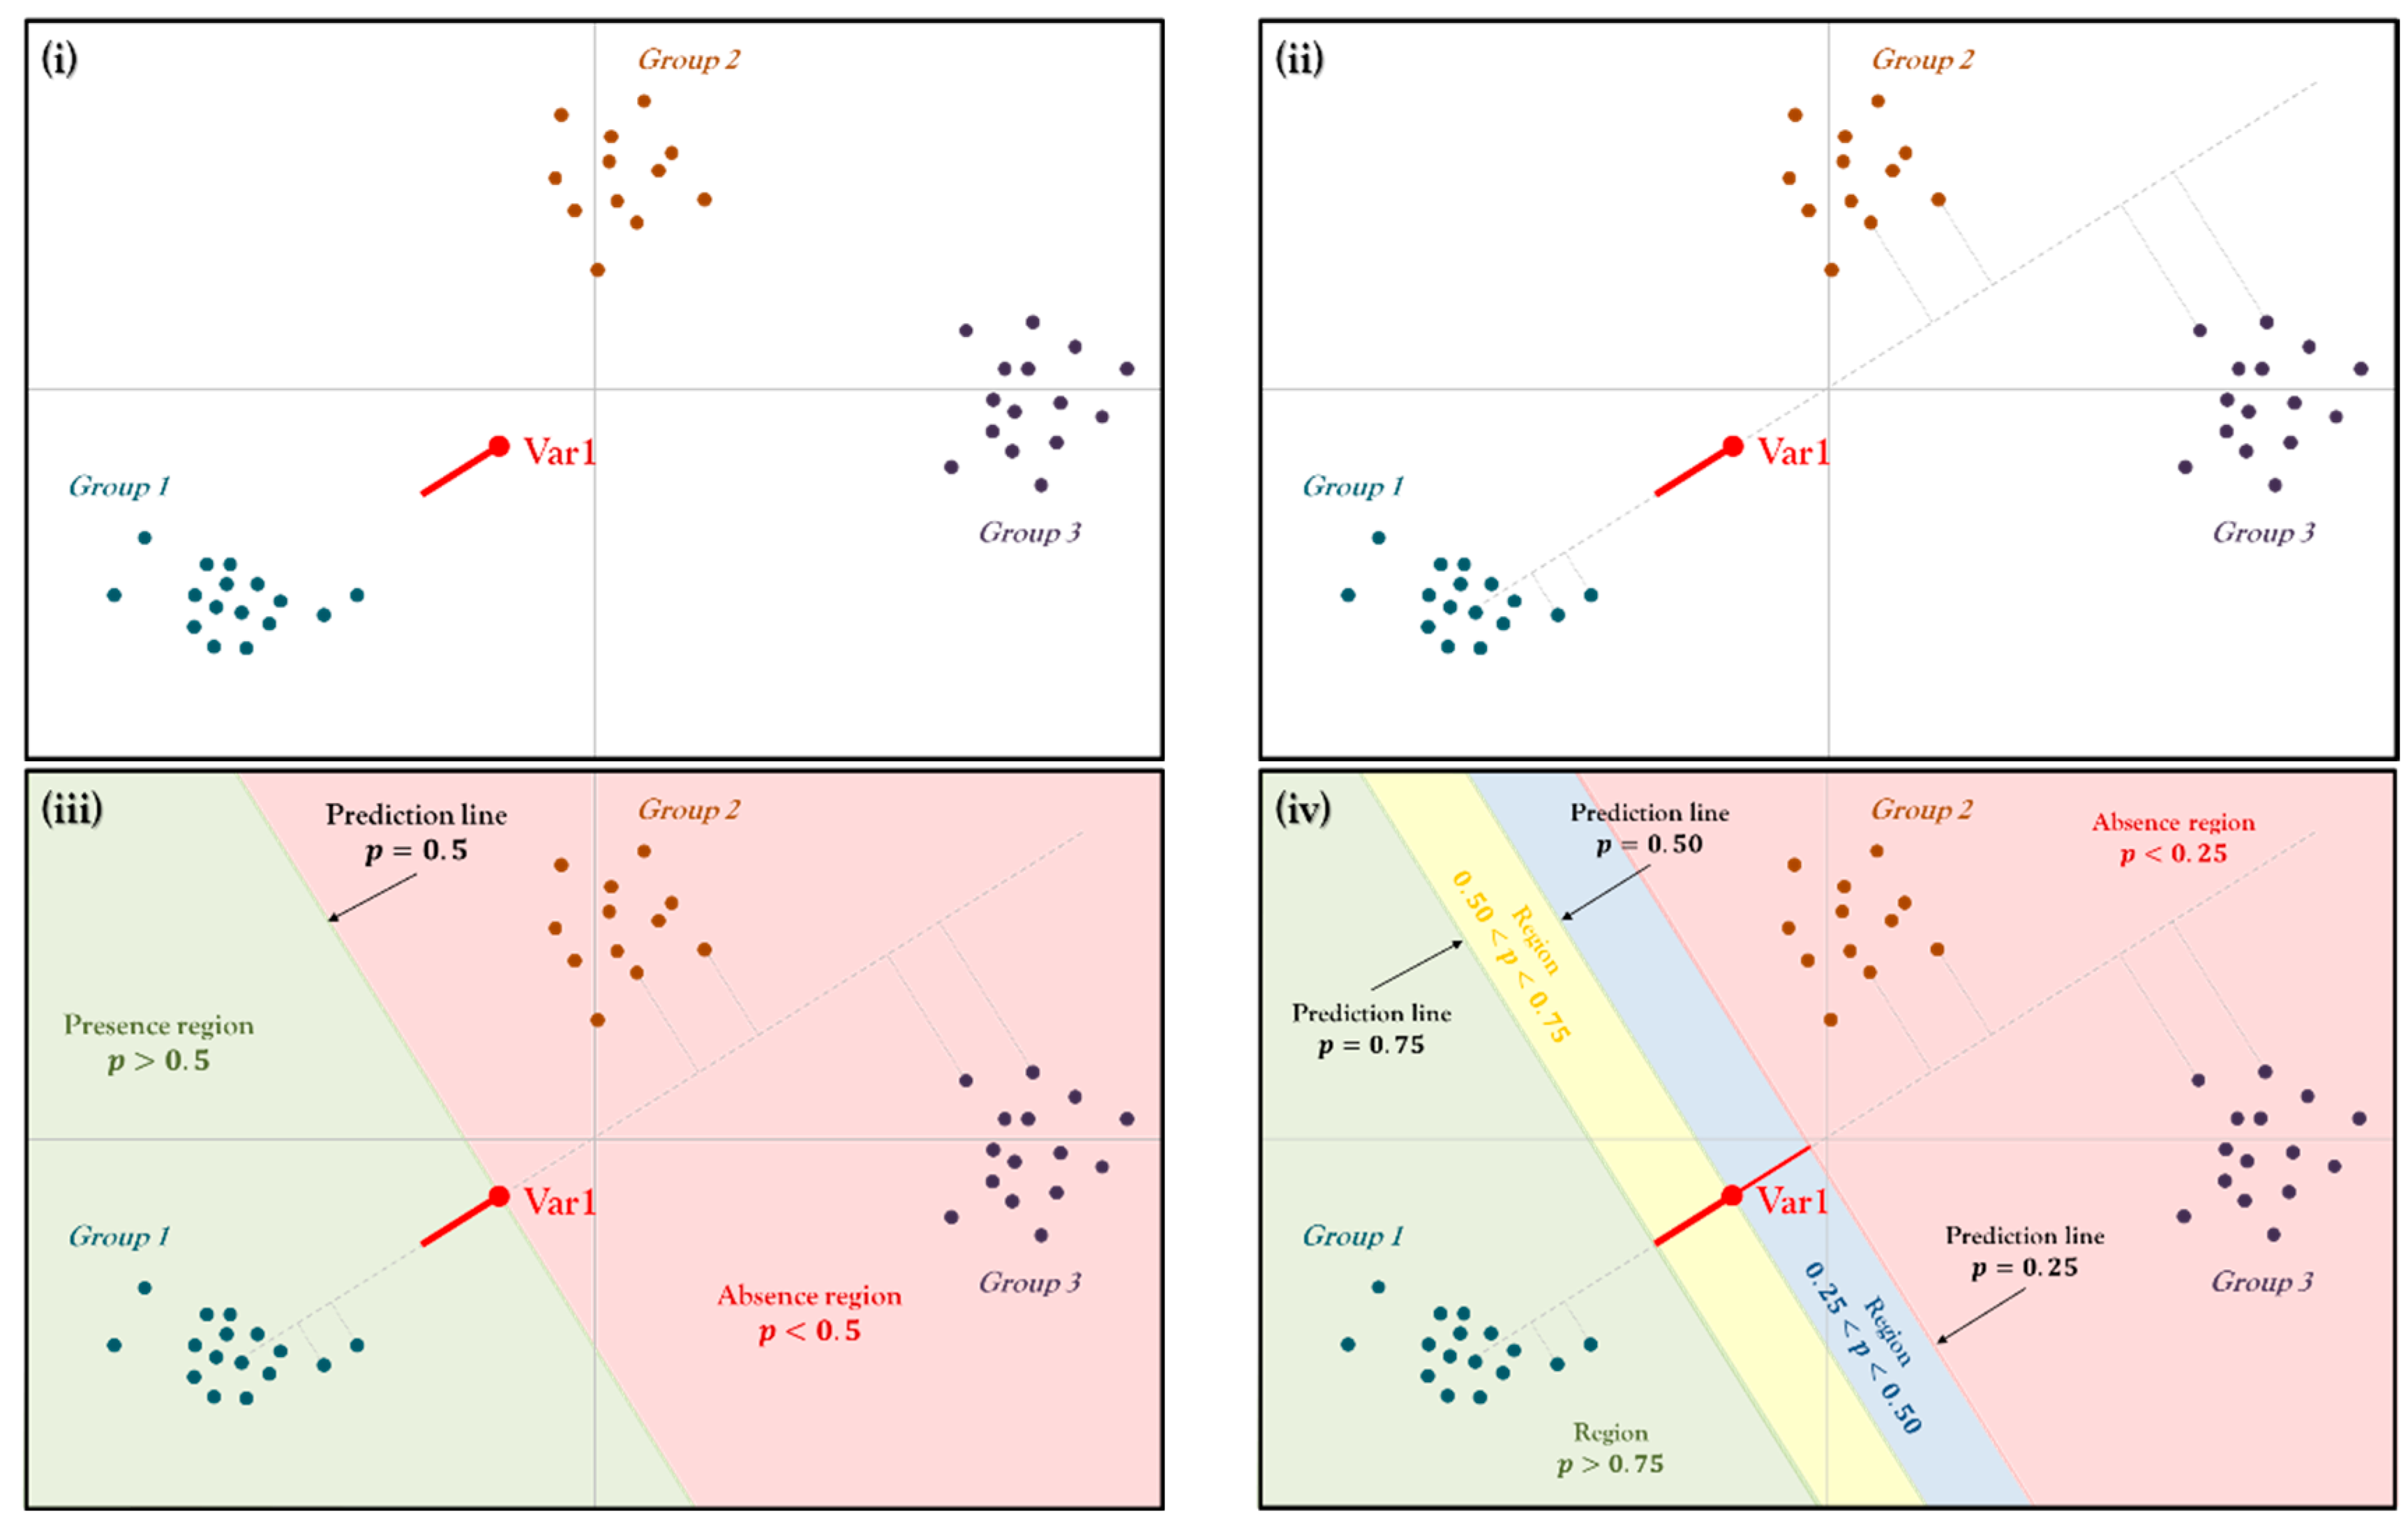
), and the direction of the variable should be understood as a continuous series that covers the probability scale; however, to simplify the graphical representation, only the points that predict 0.5, at the origin of the segment, and 0.75, at the end, are taken as representative of the segment (Figure 5i). This is how, if the variable is projected in the direction of the vector, the line will cover probabilities greater than 0.75, and in the opposite direction to the vector, the line will cover probabilities less than 0.5. Furthermore, the length of the vectors refers to their discriminating power; short vectors are useful for more effectively differentiating companies, with better fit and quality of representation, and, on the contrary, long vectors are less useful for discriminating and yield a lower quality of representation.
The companies (rows of the matrix) will be represented by points, such that those firms positioned in the direction of a vector, in front of the point, show a greater probability of the presence of the variable in question. If we take some reference individuals (or groups of individuals, if applicable) and make perpendicular projections of each of them on the line of the variable, the perpendicular projection of an individual in that direction can be used to approximate the probability (Figure 5ii). As in a classic Biplot, those points placed close together on the map will present similar characteristics in terms of the variables under study, and those vectors with a close position and the same direction will have positive relationships.
The next steps of the interpretation consist of dividing the graph by drawing a line perpendicular to the variable that crosses the prediction point of 0.5. With this line, the space is divided into two regions: the region in which it is more likely that individuals therein will feature this variable ( p > 0.5 ) , and the region in which it will more likely be absent ( p < 0.5 ) . For example, all individuals in group 1 (Figure 5iii) are more likely to have the variable, while individuals in the other groups are more likely to not have the variable.
As an example, the symmetry of the variable is represented in the direction of lowest probability, and perpendicular lines are drawn at the ends of the original variable and its image (Figure 5iv). The first line represents the probability p = 0.75 and the second the probability p = 0.25 , and this suggests that the probability of our variable being present in group 1 is greater than 0.75 ( p > 0.75 ) . One can draw as many perpendicular lines and probability regions as are required in the graph, thus increasing the precision of the interpretation.
To carry out all the processes and representations of the Biplot analyses, the MultiBiplot software was used [37].

3. Descriptive Results of the Environmental Commitment of Agricultural and Livestock Companies in Castilla y León

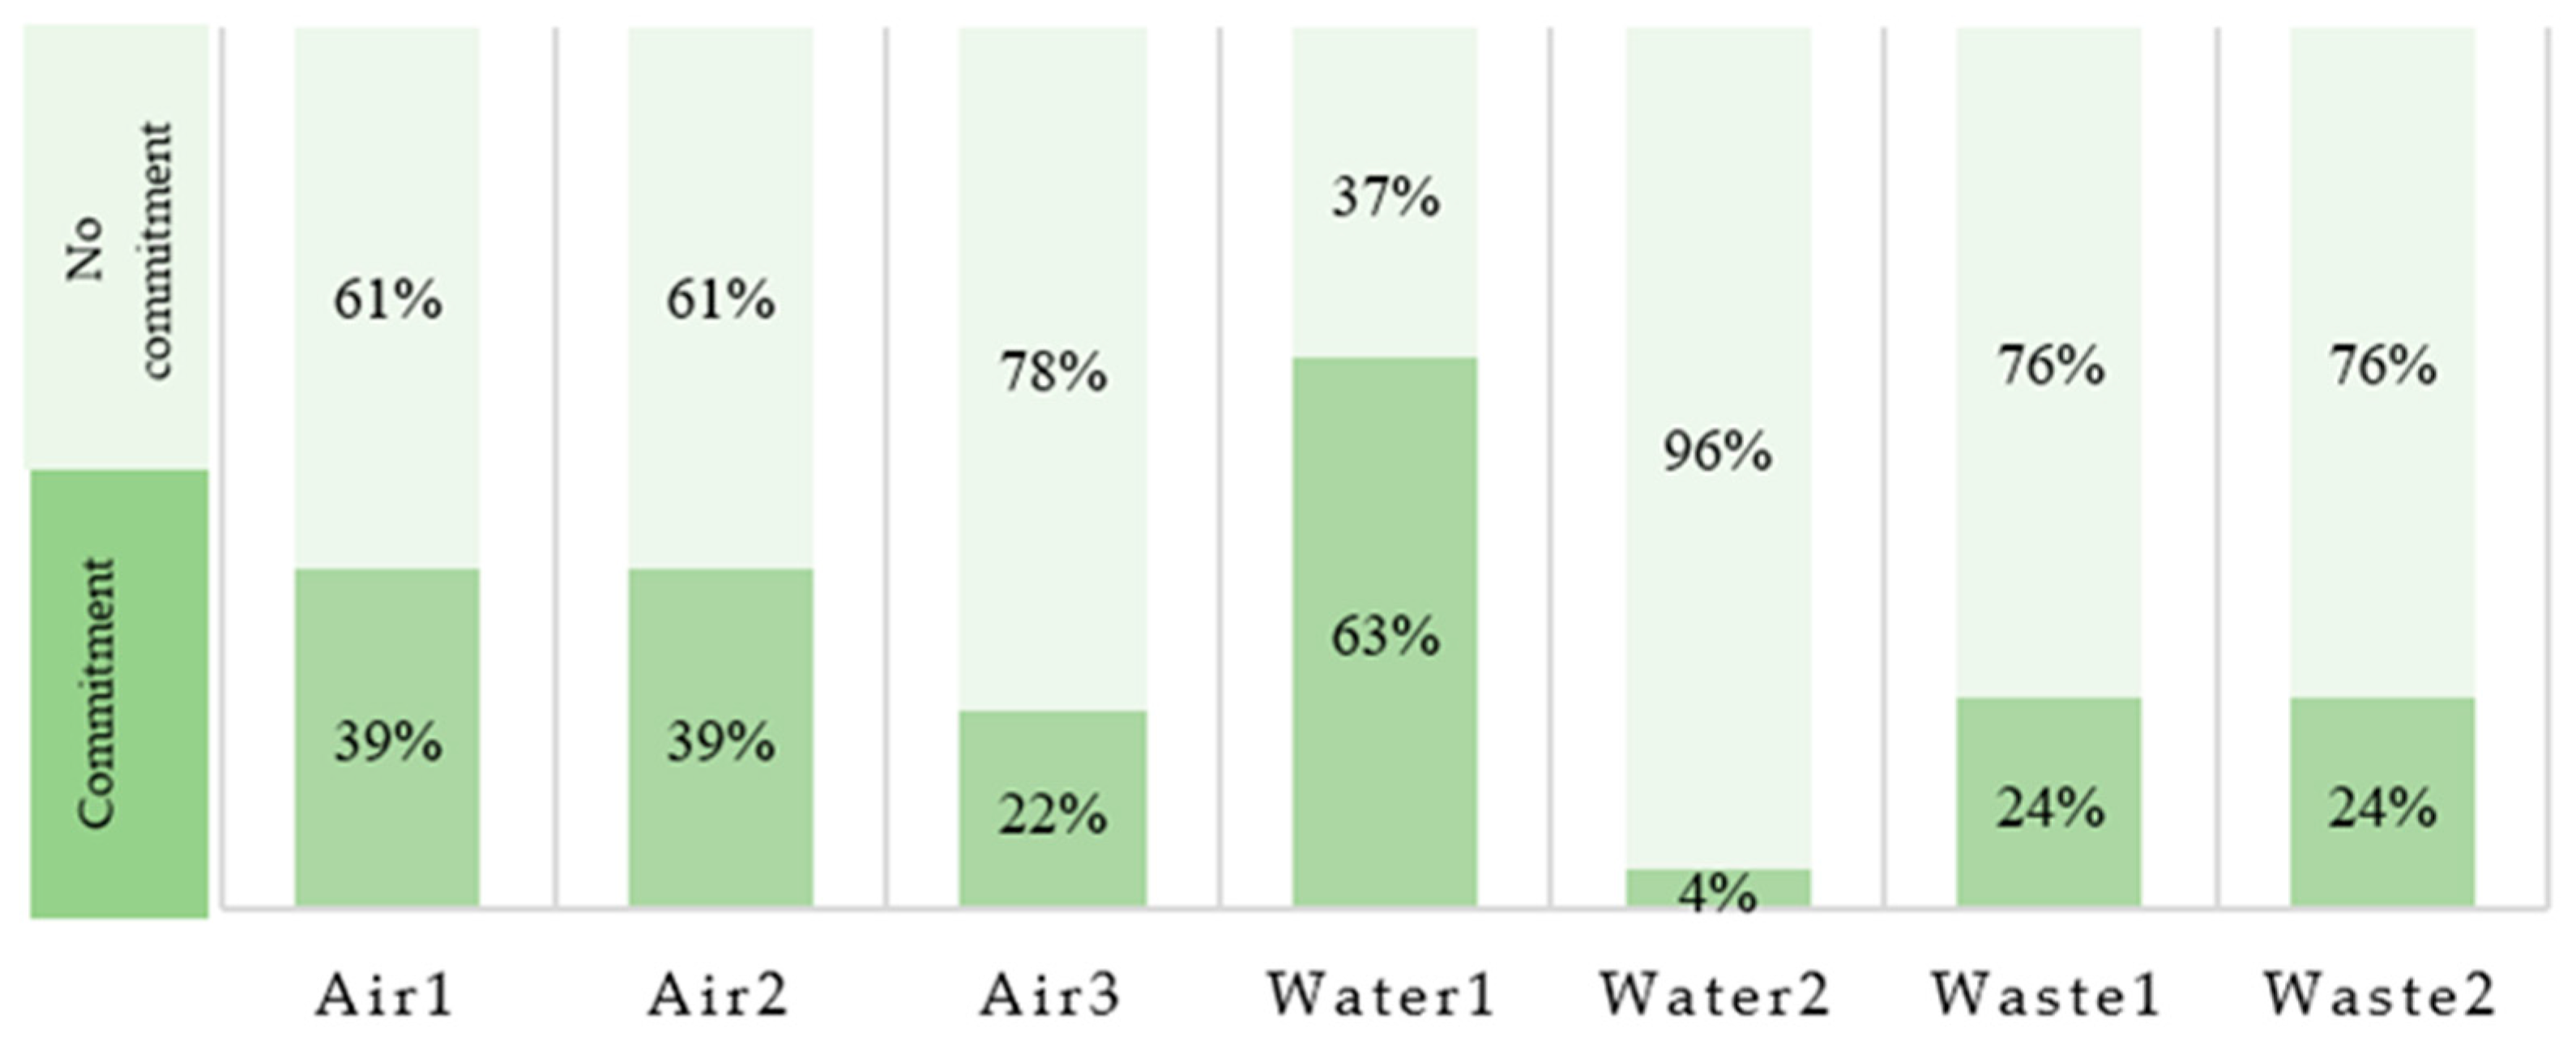
3.1. Panoramic View of Clean Technologies Adoption (RQ1)

In this section, we present an analysis of the current situation as regards the companies’ commitment to the adoption of clean technologies in order to reduce environmental risks and achieve more circular production processes, describing the degree of development of investments and control systems related to the management of environmental elements such as air, water and ecosystems (fauna and flora).
In relation to the results of the External Logistic Biplot method, Table 2 presents the goodness of fit measures of the analysis that was carried out. In this sense, the percentage of correct classifications in the Biplot is 97.23%, i.e., 97% of the absences and presences are correctly predicted for the entire data matrix. Table 2 shows these percentages individually by variable; it is also possible to see that all the variables present a statistical significance and a good representation (R2), except for the variable “Water2”, which, as already said, presents a more limited commitment.
In order to interpret the logistic Biplot, the origin of each vector—the point—is taken to correspond to a probability of presence of 0.50, and the end of the vector corresponds to a value of probability of 0.75; this means that the companies positioned in the direction of a vector, before the point, show an increased probability of presence of the variable in question. Figure 6 shows the logistics Biplot with the 67 Castilian-Leonese companies and their positions according to the presence/absence of the seven binary variables (Air1, Air2, Air3, Waste1, Waste2, Water1 and Water2).
In this regard, for the final sample of 67 companies, 22 do not provide any information on their website regarding the investments, systems or procedures considered. However, two companies have invested and implemented all the environmental measures analyzed.
It should also be noted that many of the companies share a location on the map because they have the same values for the seven variables, and have therefore been grouped into sub-groups of companies. Thus, in the graph, we see different figures referring to subgroups of 2, 3, 4, 5, 12 and 22 enterprises. In addition, the variable Water2 differs from the others due to the fact that a limited number of companies have implemented a water verification system.
With a more individualized approach, set out by environmental element, the following frequencies and relationships can be observed in Figure 7. With regard to air management, we found a perfect relationship between investments in clean technologies (Air1) and in systems to control CO2 and GHG emissions (Air2). These results indicate that all companies that invest in clean technologies also implement a system to control the pollution of emissions. A total of 26 out of the 67 companies analyzed (39%) make this choice. However, the companies’ commitments to these two initiatives are only marginally linked to the disclosure of information on the impact they have on energy efficiency (Air3). In this sense, only 22% of the companies analyzed present this type of information on their website. However, this percentage would be 58% if calculated on the basis of the 26 companies that have made both investments.
In relation to water management, there are notable differences. Specifically, 63% of Castilian-Leonese companies have invested in clean technologies to optimize water management (Water1). However, only 4.5% have implemented verification systems (Water2).
With regard to waste management, 24% of Castilian-Leonese companies have implemented both processes for reusing waste (Waste1) and processes for recycling materials, containers and/or packaging (Waste2).

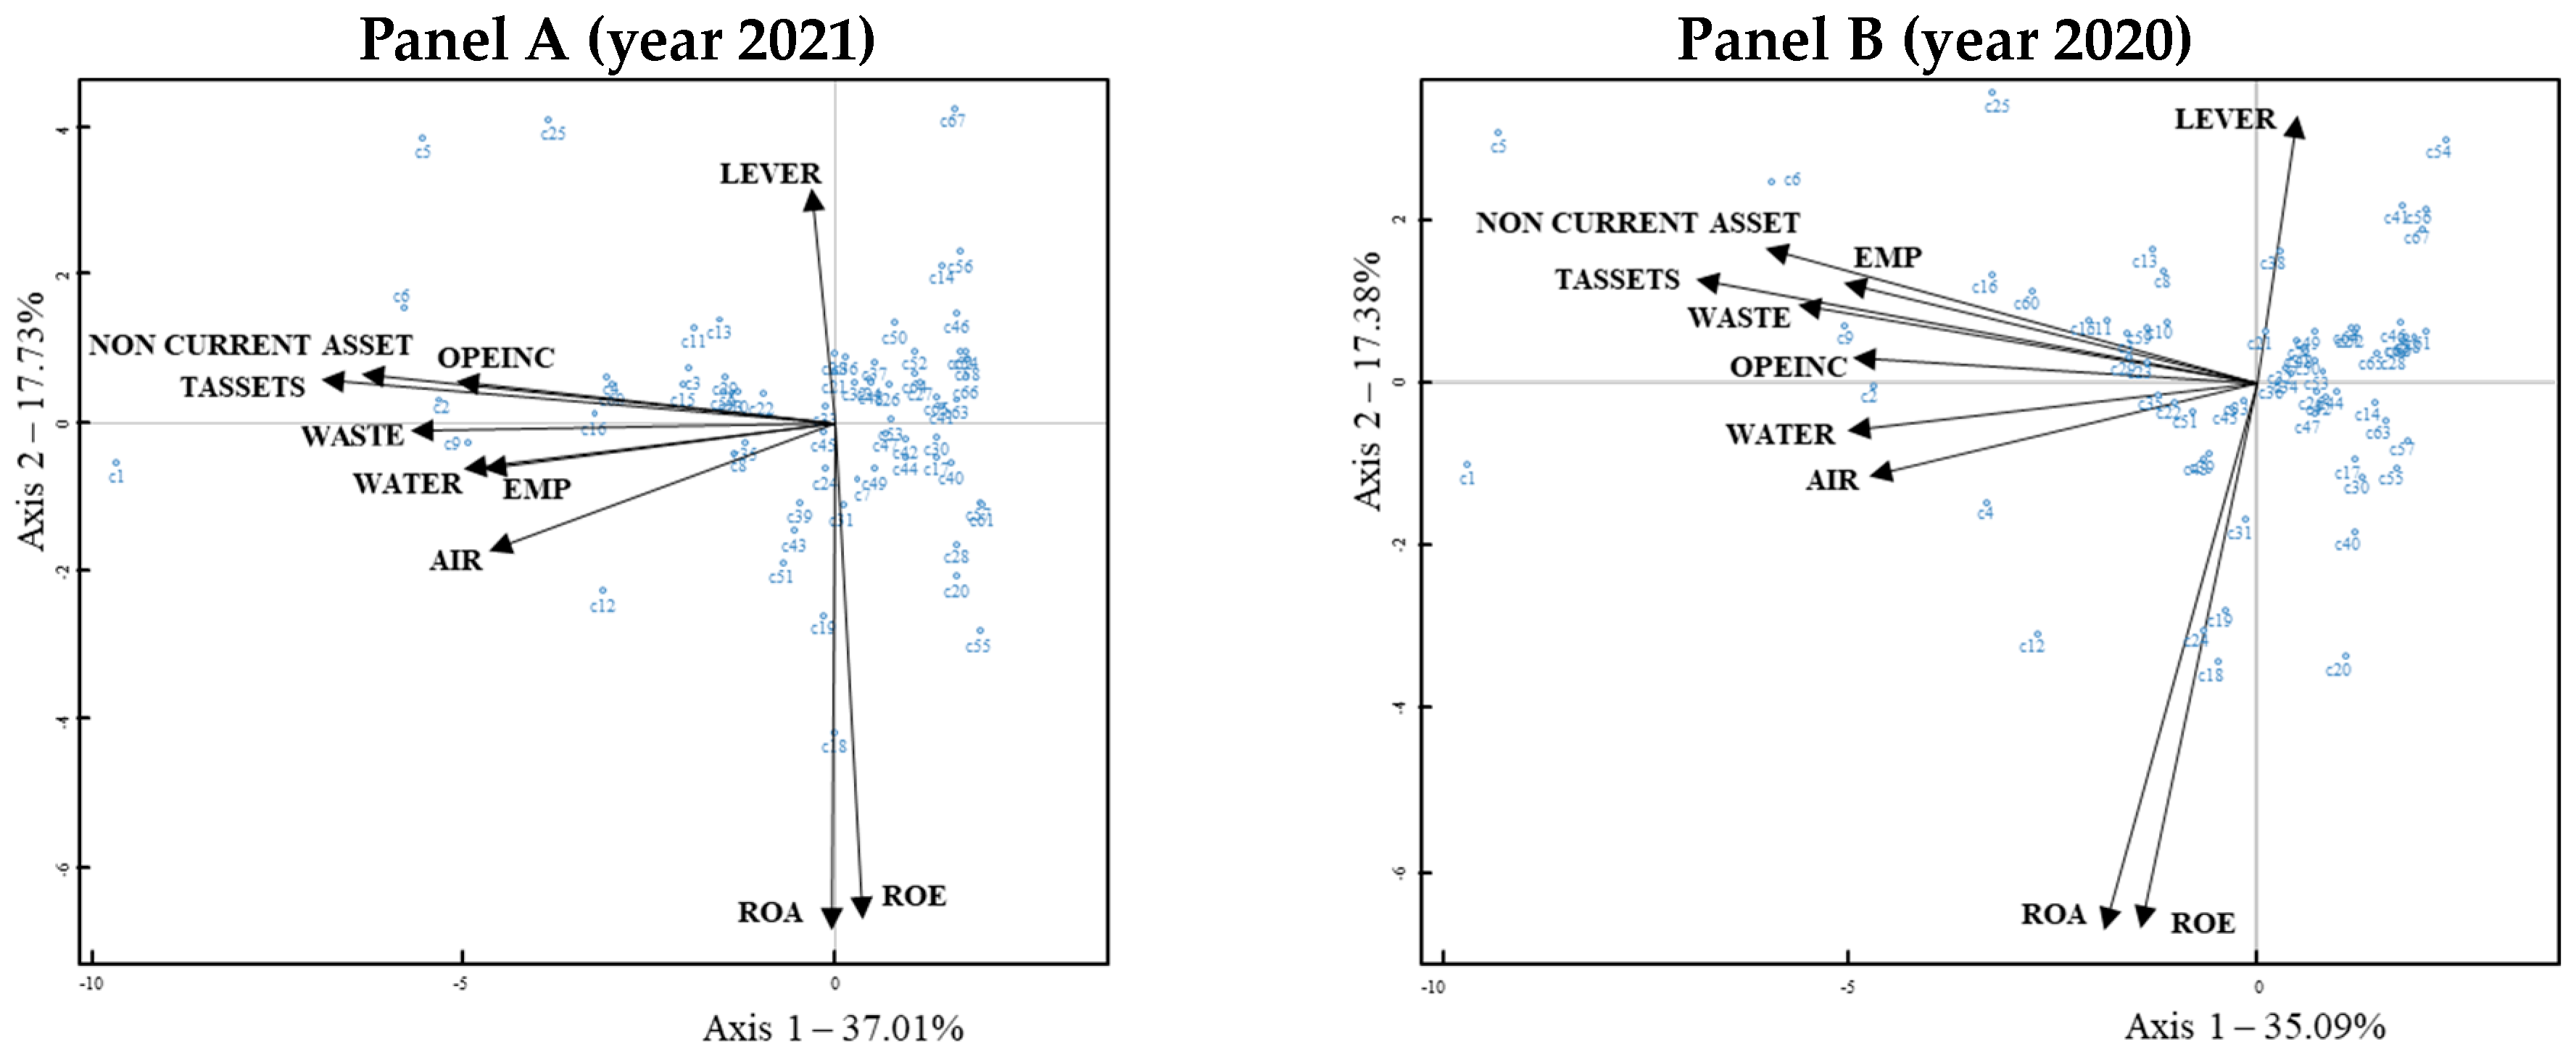
3.2. Panoramic View of Firms’ Clean Technologies Adoption according to Resources and Capabilities (RQ2) and the Economic Benefits (RQ3)

On the other hand, in order to derive a general view of the economic–financial situation of Castilian-Leonese companies and their environmental commitment, we calculated the average values per company of the dummy variables (Air1, Air2, Air3, Waste1, Waste2, Water1 and Water2), and we constructed an HJ-Biplot [38] together with the financial information. In this way, the final matrix would have dimensions of 67 rows (companies) and 10 variables (clean technologies—air, water and waste, as well as the financial information of resources (NON-CURRENT ASSETS, TASSETS, EMP and LEVERAGE) and profitability (OPEINC, ROA and ROE).
The purpose of this study is to analyses the connection between variables in order to determine whether the resources and capabilities of the company condition or determine its commitment to mitigate undesirable environmental impacts, and to determine the potential benefits. Therefore, we will look for acute angles between the vectors that translate into positive correlations; on the contrary, the positions of the companies are not the object of study, since we will not characterize them individually. In panel A of Figure 8, we observe the goodness of fit, which collects about 55% of the total information, and represents the positions of the 67 companies based on the values of the 10 variables considered for the year 2021.
Thus, we have observed that the clean technology variables that relate to the mitigation of negative impacts on the environmental elements of air, water and ecosystems have a positive relationship with operating income, total assets, the number of fixed assets and the quantity of employees. On the contrary, the variables of economic and financial profitability and leverage show a weak or no relationship. This evidence suggests that the adoption of clean technologies is strongly related to firms’ resources and capabilities, and, although these commitments improve firms operating income, they have a limited effect on profitability.
In addition, panel B of Figure 8 presents the same information for the year 2020, and it shows a similar structure to that discussed above, although the relationships occur with greater intensity in this period, suggesting this may be the year in which many of the investments and environmental initiatives considered were undertaken.

4. Cluster Results: Environmental Strategies of Agricultural and Livestock Companies in Castilla y León

4.1. Cluster Analysis by Environmental Elements and Their Relationship with the Business’ Economic–Financial Situation

In order to deepen the interpretation of the information obtained from the analysis of the previous logistics Biplot, based on the coordinates, we classified the companies into two clusters for each of the environmental elements: (i) waste, (ii) air and (iii) water. Thus, for each of these variables, two clusters are formed: cluster1 is made up of the companies with a commitment to these variables (Waste1 and Waste2; Air1, Air2 and Air3; Water1 and Water2); and cluster 0 is made up of the companies without a commitment to these variables. Then, we interpret the data supplied by the clusters in relation to the variables of the resources and capabilities of the enterprise.
As far as waste management is concerned, Figure 9 shows that the variables that reflect the ecosystem’s environmental element—Waste1 and Waste2—show a strong relationship in the study, since, as we can see, they are close to each other, and the directions of their vectors are the same. In this dimension, cluster 1 (green) is made up of 23 companies that show commitment to these variables (Waste1, Waste2 or both) and cluster 0 (red) is made up of 44 companies that have not implemented any of the processes considered.
By characterizing the two clusters in terms of the economic–financial variables of resources (EMP, TASSETS, NON-CURRENT ASSET, LEVER,) and profitability (OPEINC, ROA, ROE), it is possible to see that the companies with the greatest commitment to waste management are those with greater volumes of resources and capacities. Thus, the first conclusion is that waste reuse and recycling processes are stronger in companies with higher total assets (TASSETS), quantities of employees (EMP) and active long-term assets (NON-CURRENT-ASSET). These variables show highly significant differences according to the paired t-test for non-parametric data. This effect is also associated with a higher operating income (OPEINC). These relationships can also be extended, although not statistically significantly, to higher economic and financial returns (ROA and ROE), and greater autonomy or lower leverage (LEVERAGE). The table represents the information graphically, allowing us to identify the results.
In terms of business initiatives related to the environmental element air, cluster 1 of commitment is made up of 26 companies, and cluster 0 of 41 companies. In Figure 10, we can see that the variables Air1 and Air2 share a vector, as they have exactly the same values, which means that companies invest in clean technologies and control systems at the same time (39% presence). The Air3 variable has the same direction as the previous ones, but is more to the left, indicating a lower commitment (22% presence).
Characterizing the two clusters in terms of business resources and capabilities leads to the same conclusions as for waste management. However, the results are less significant.
With regard to the environmental element of water, Figure 11 shows that commitment cluster 1 is made up of 42 companies and cluster 0 of 25 companies. The variable Water1 “investment in clean technologies for water management” follows the same direction as the variables Waste1 and Waste2, but it is positioned in the lower semi-plane and includes a greater number of companies, 63% of which have invested in it. As far as resources and capacities are concerned, the conclusions are similar to those previously discussed for waste management and air management.
In summary, the results of the logistic Biplot show a relationship between the study variables. If we look at the vectors, the companies with strong commitments are located in the left half of the plane, with those in the upper part being more focused on waste management and those in the lower part more focused on air management. There is a relationship between the variables for waste management and the variables for air management, with companies focusing more on one or the other, depending on their preferences. Therefore, we can conclude that investments in clean technologies that reduce environmental risks related to water are a priority for companies (67% presence).
In a second step, we find that investments in clean technologies to mitigate negative impacts on air and improve emissions control systems (39% presence) have a positive relationship with concern for energy efficiency (22% presence). This is followed by re-use and waste recycling processes (24%) and, finally, as a future challenge, verification systems for water management (4.5%). Also, we can see that companies with higher operating income, total assets, fixed assets and quantities of employees are more involved in waste, air and water management.

4.2. Cluster Analysis by Specific Environmental Commitments and Their Relationship with the Economic–Financial Situation

In order to deepen our knowledge about business decisions, the next step is to group the companies by cluster based on more specific commitments. To do this, based on the results of the logistics Biplot, we analyze the Castilian-Leonese companies by grouping them into six different clusters, described below and presented in Figure 12. Additionally, Figure 13 shows parallel coordinates with a comparison of the financial information of these clusters, and Table 3 shows the mean values per cluster of environmental commitment:
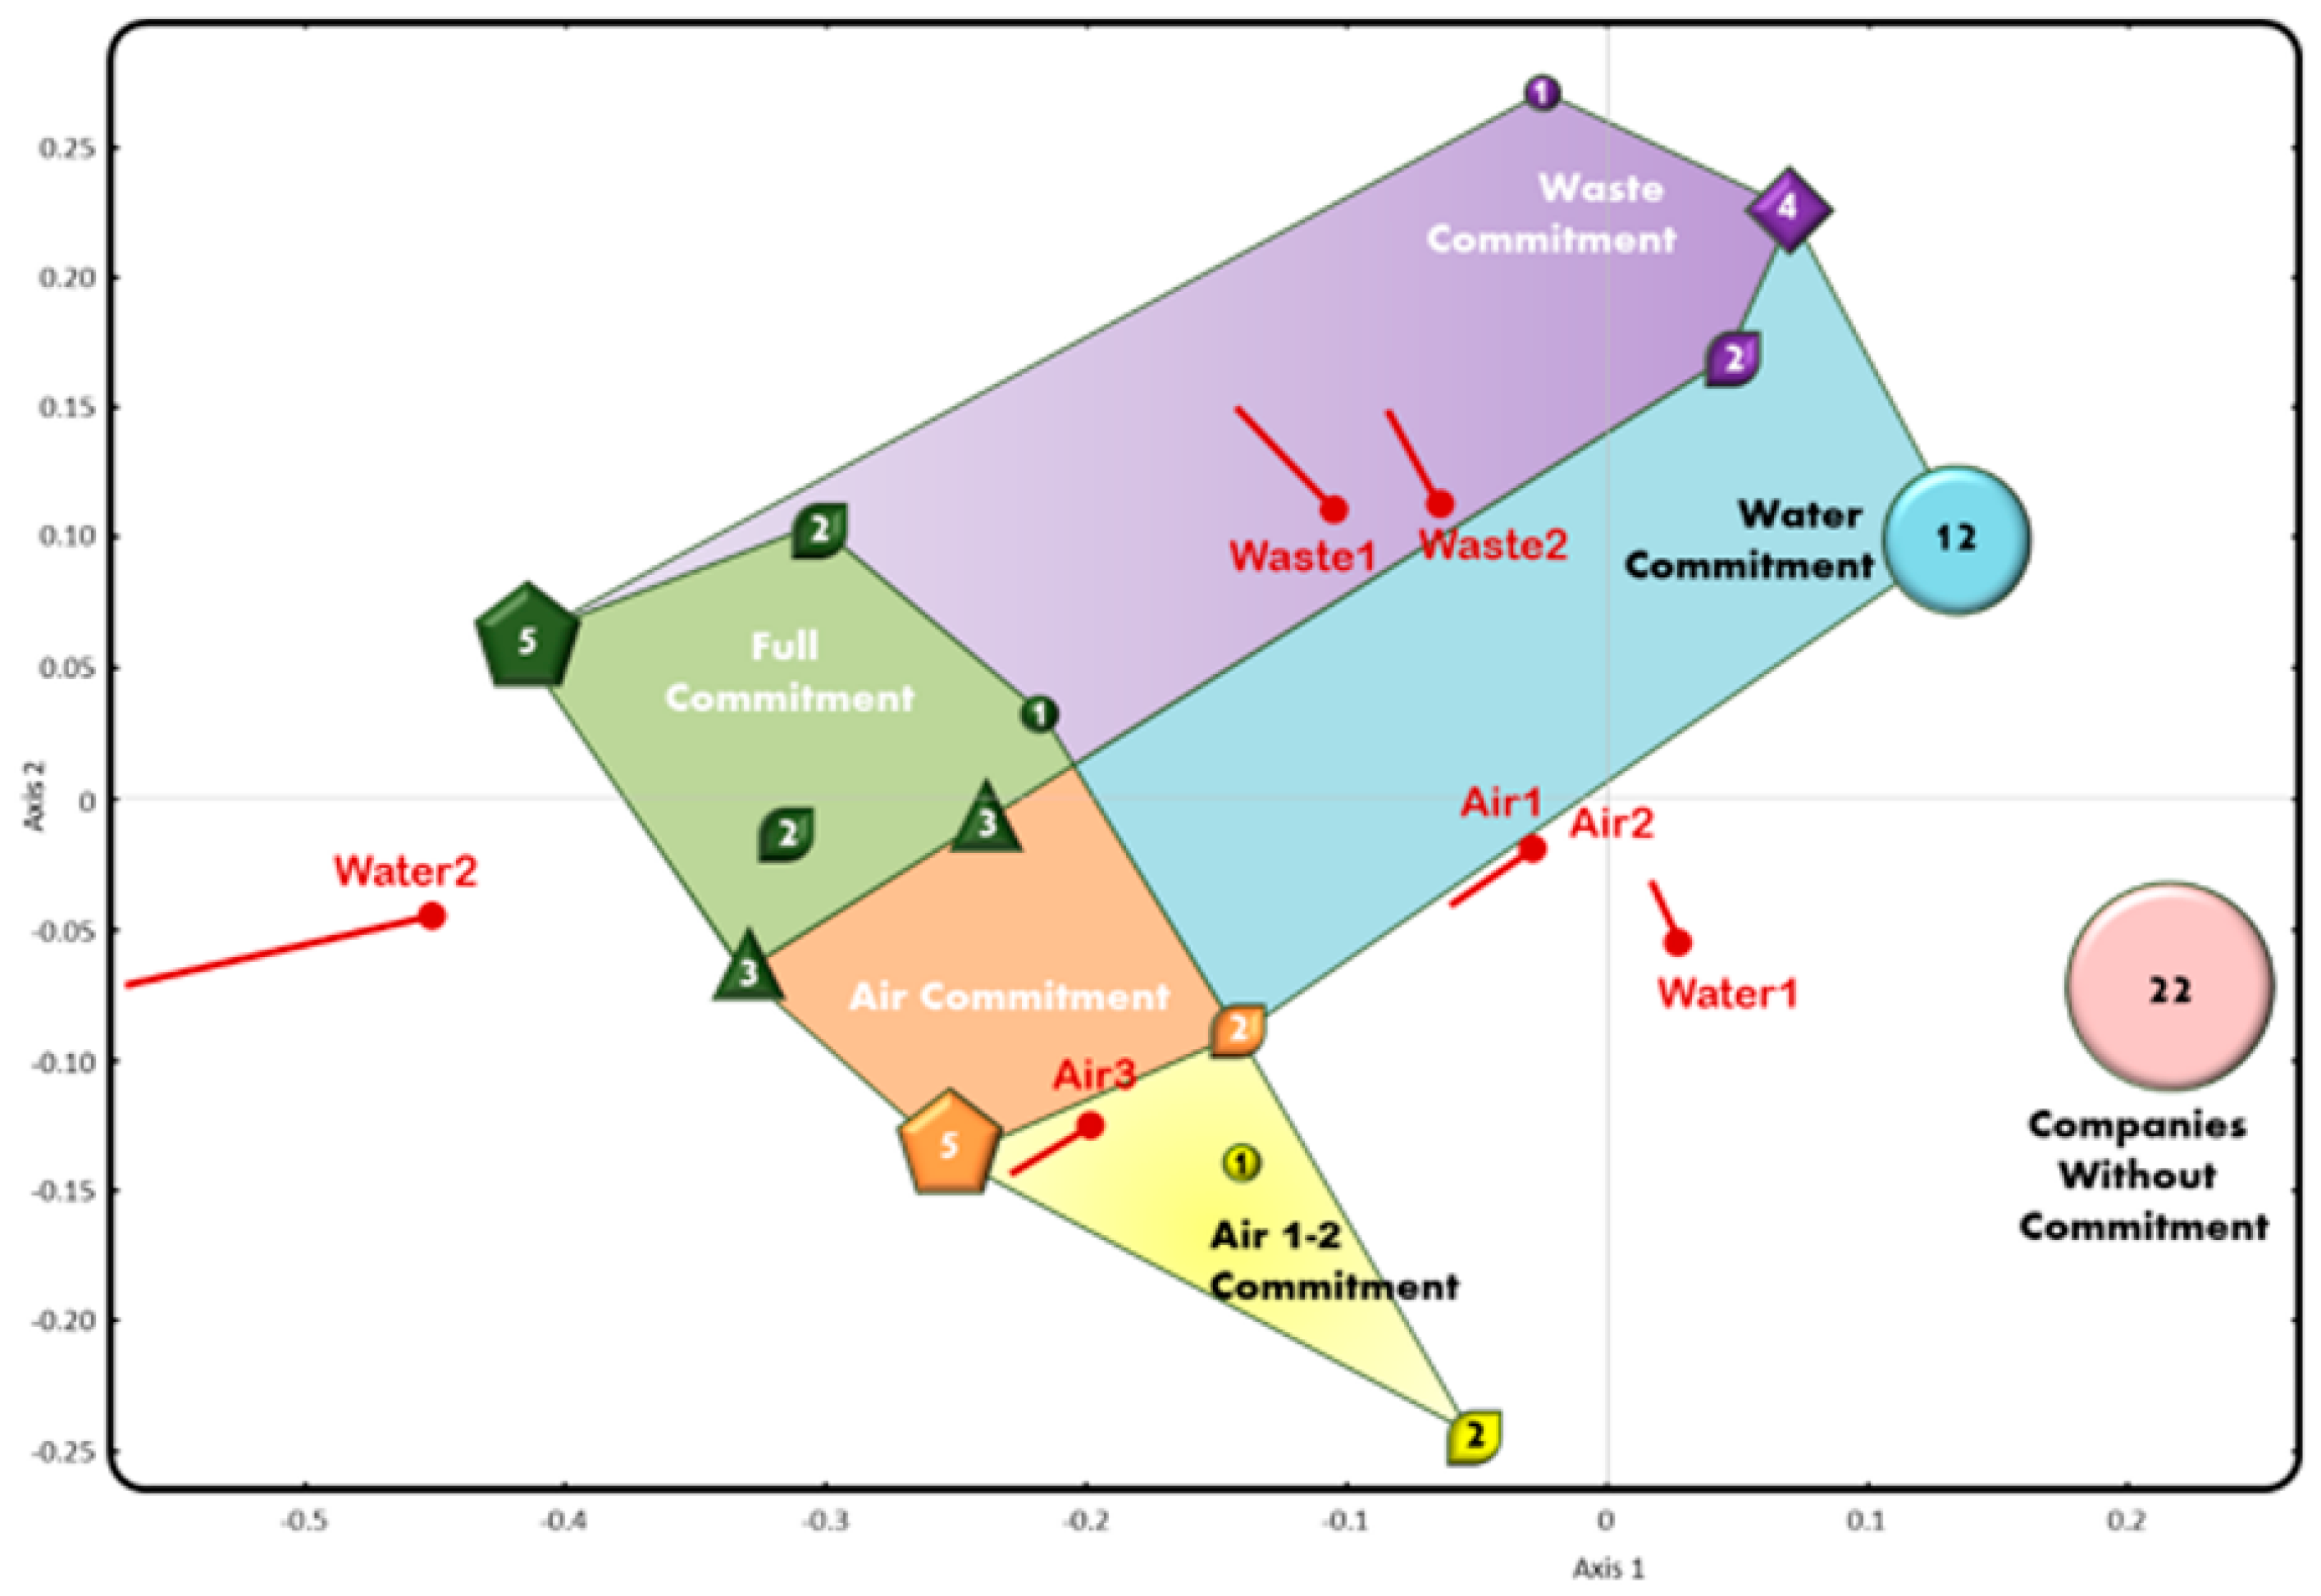
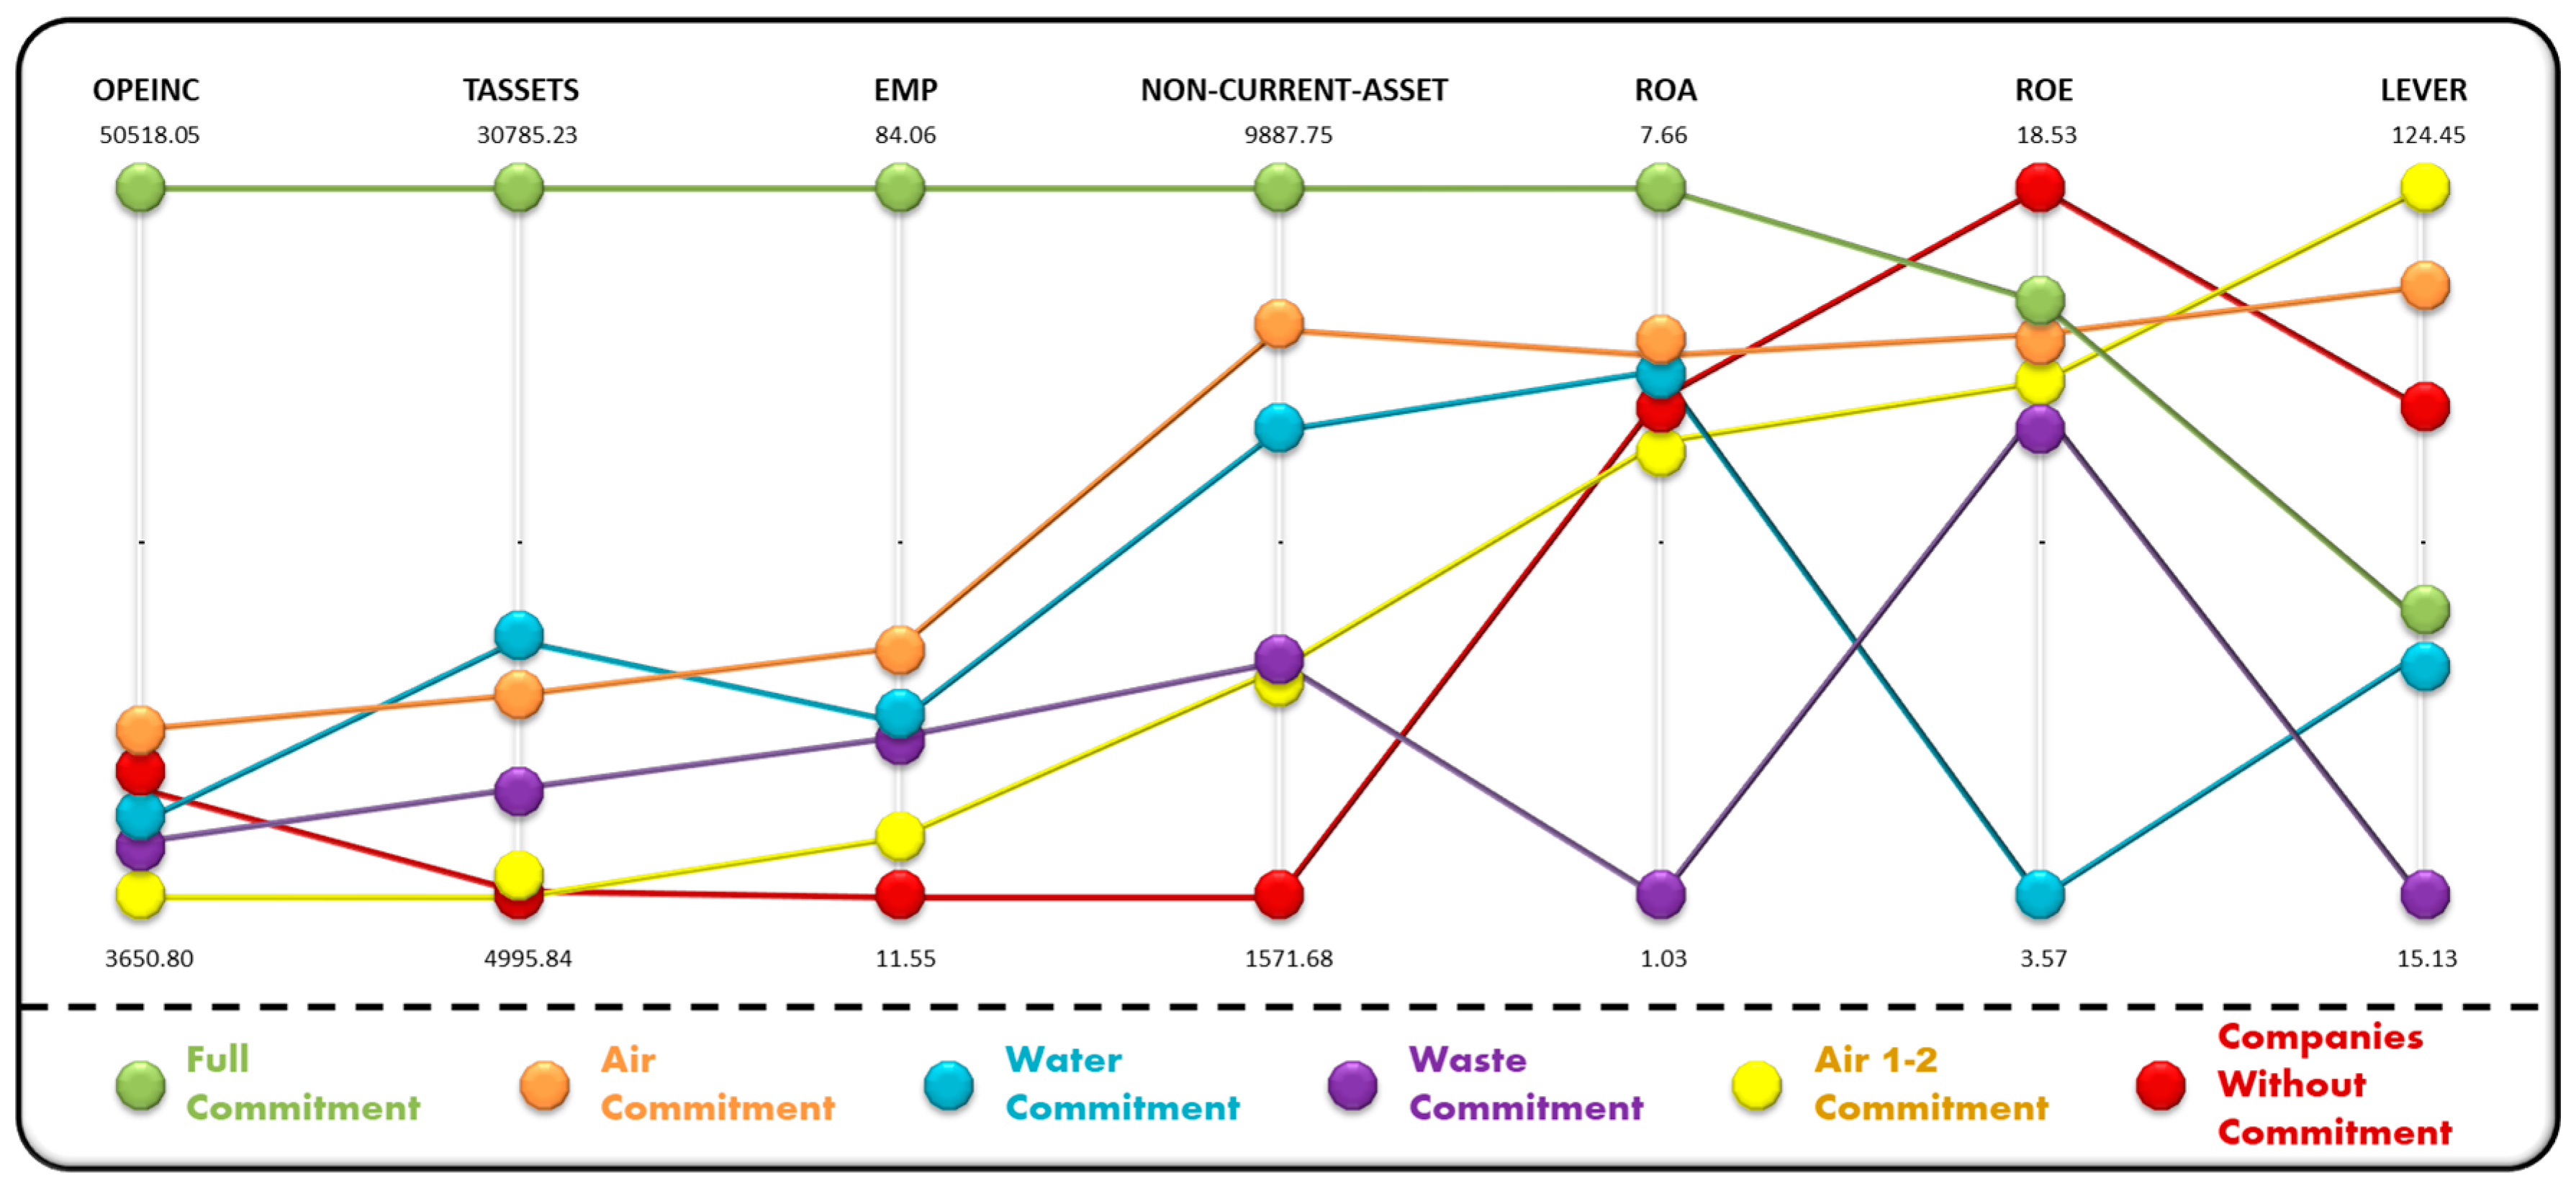
Full commitment. This cluster is made up of 16 of the 67 companies, which show commitment to all the environmental measures analyzed. These must be considered as the leading Castilian-Leonese companies in mitigating the adverse effects on air, water and ecosystems. As can be seen in Figure 13, they also show values well above the rest of the companies in terms of resources and capabilities represented by total assets, non-current assets and quantity of employees. These firms also obtain higher operating incomes;
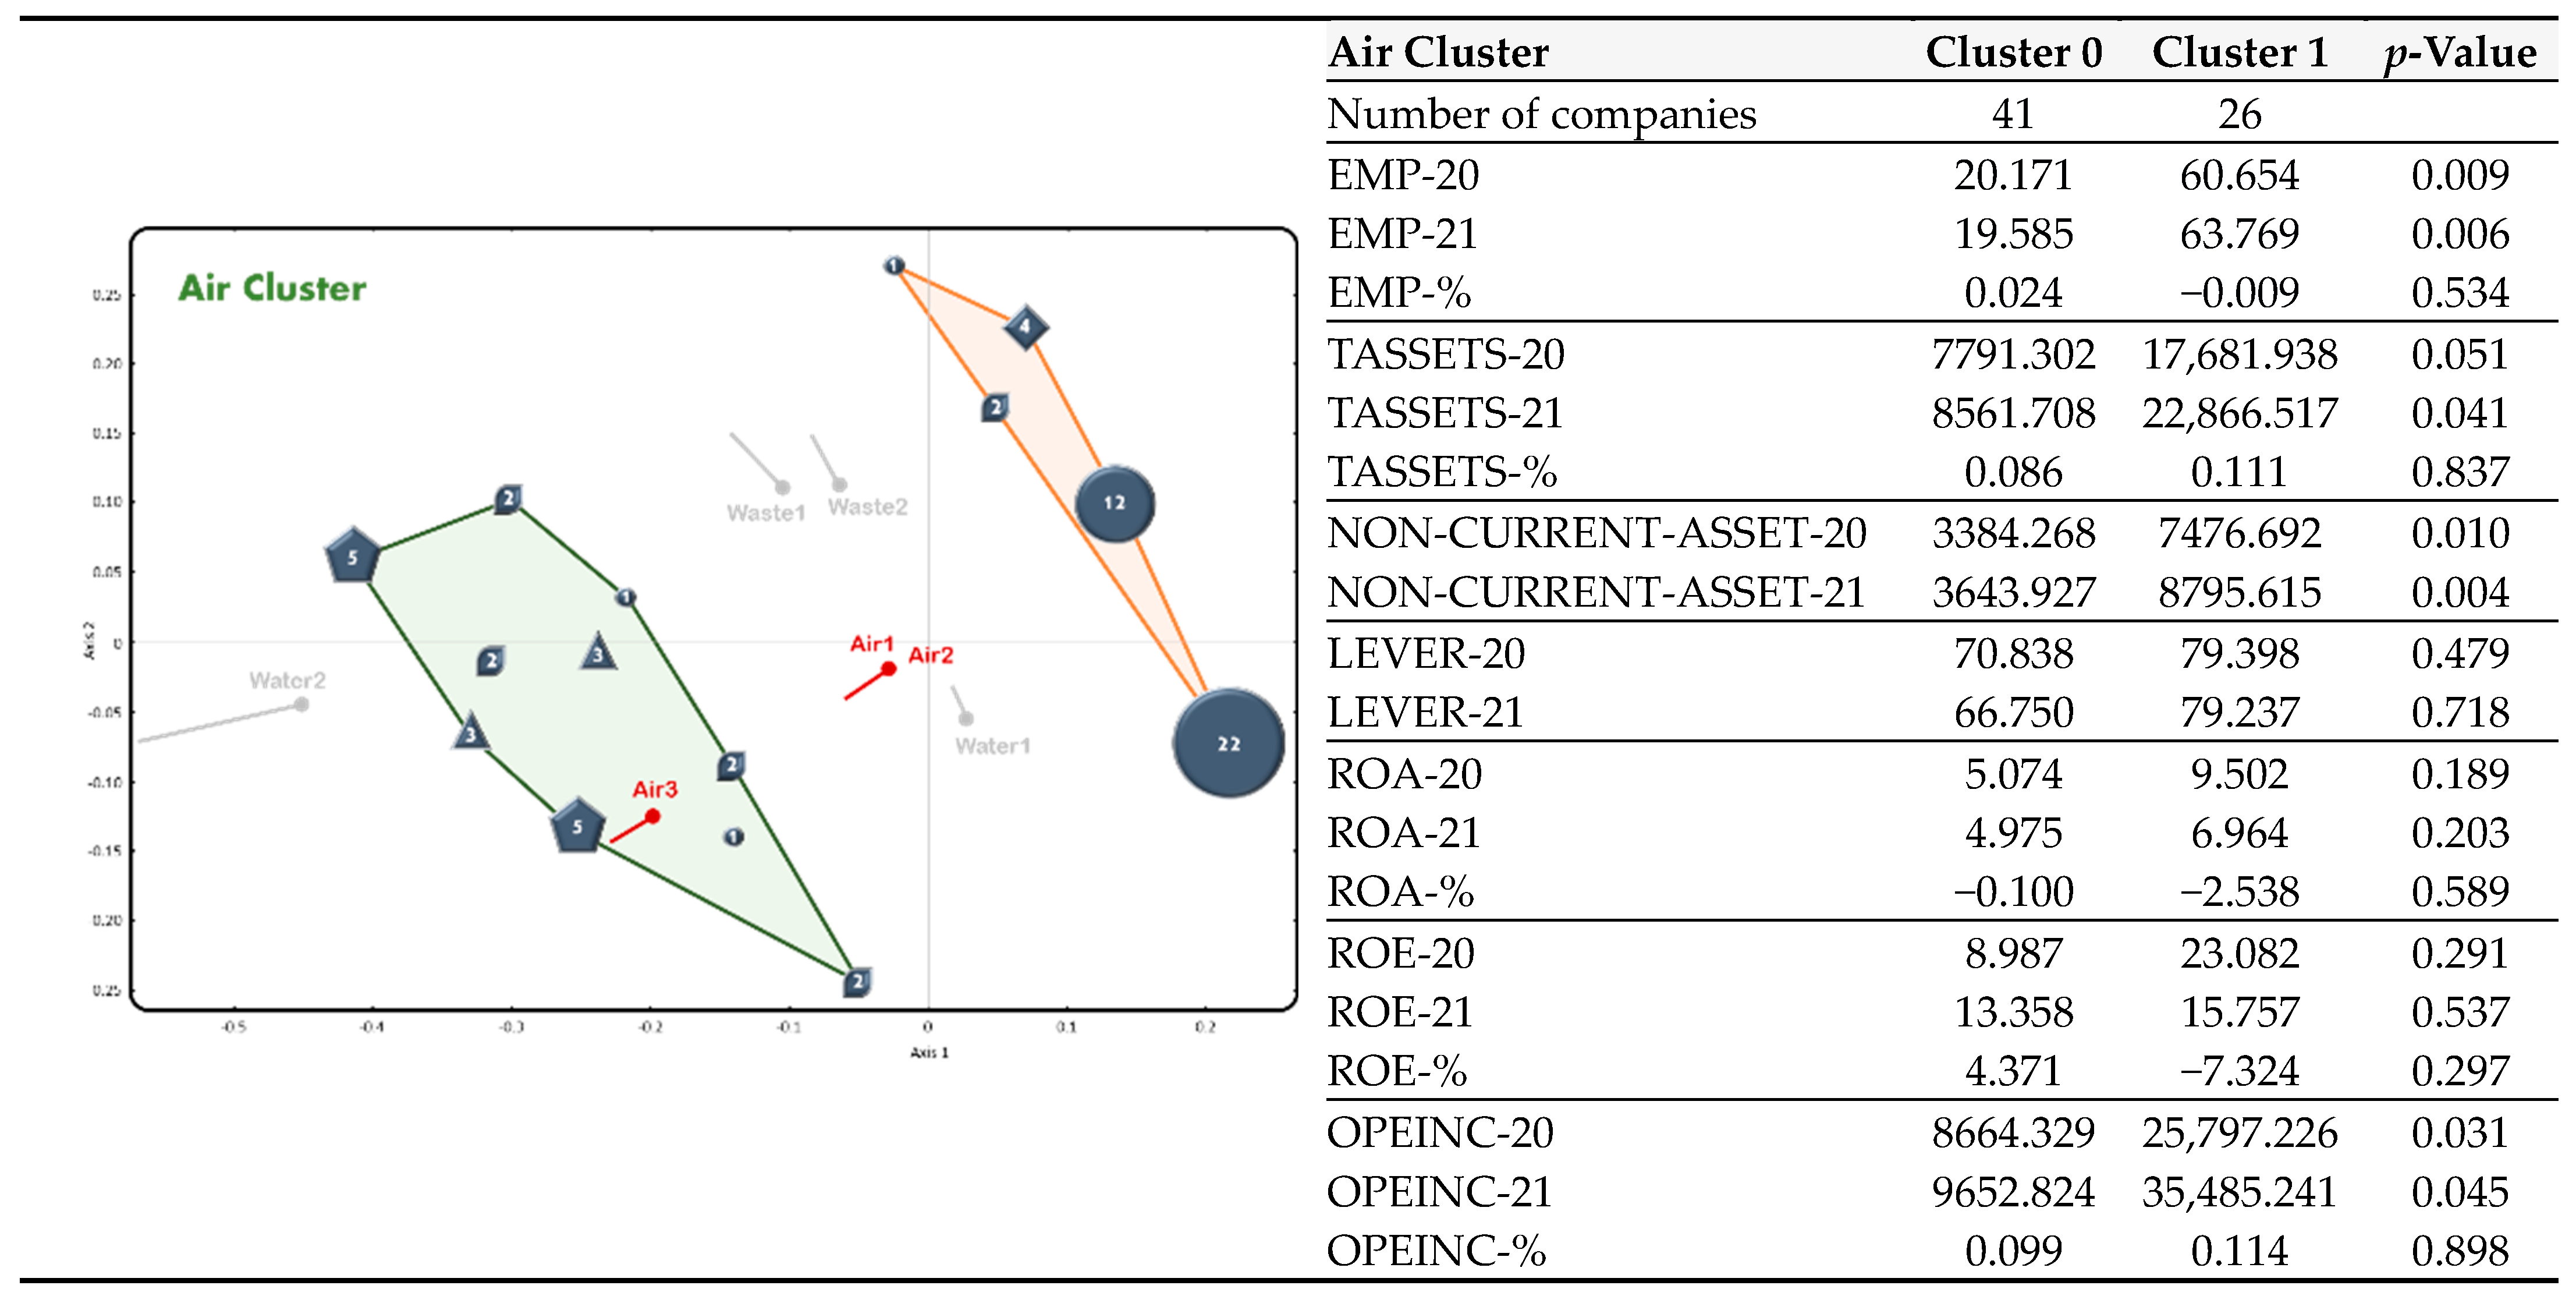
Air commitment. This cluster is made up of seven companies that show a significant commitment to everything related to air management and investment in technologies to avoid polluting emissions. In addition, they are characterized by an availability of resources and capacity well above the rest of the companies, with the exception of those belonging to the previous cluster;
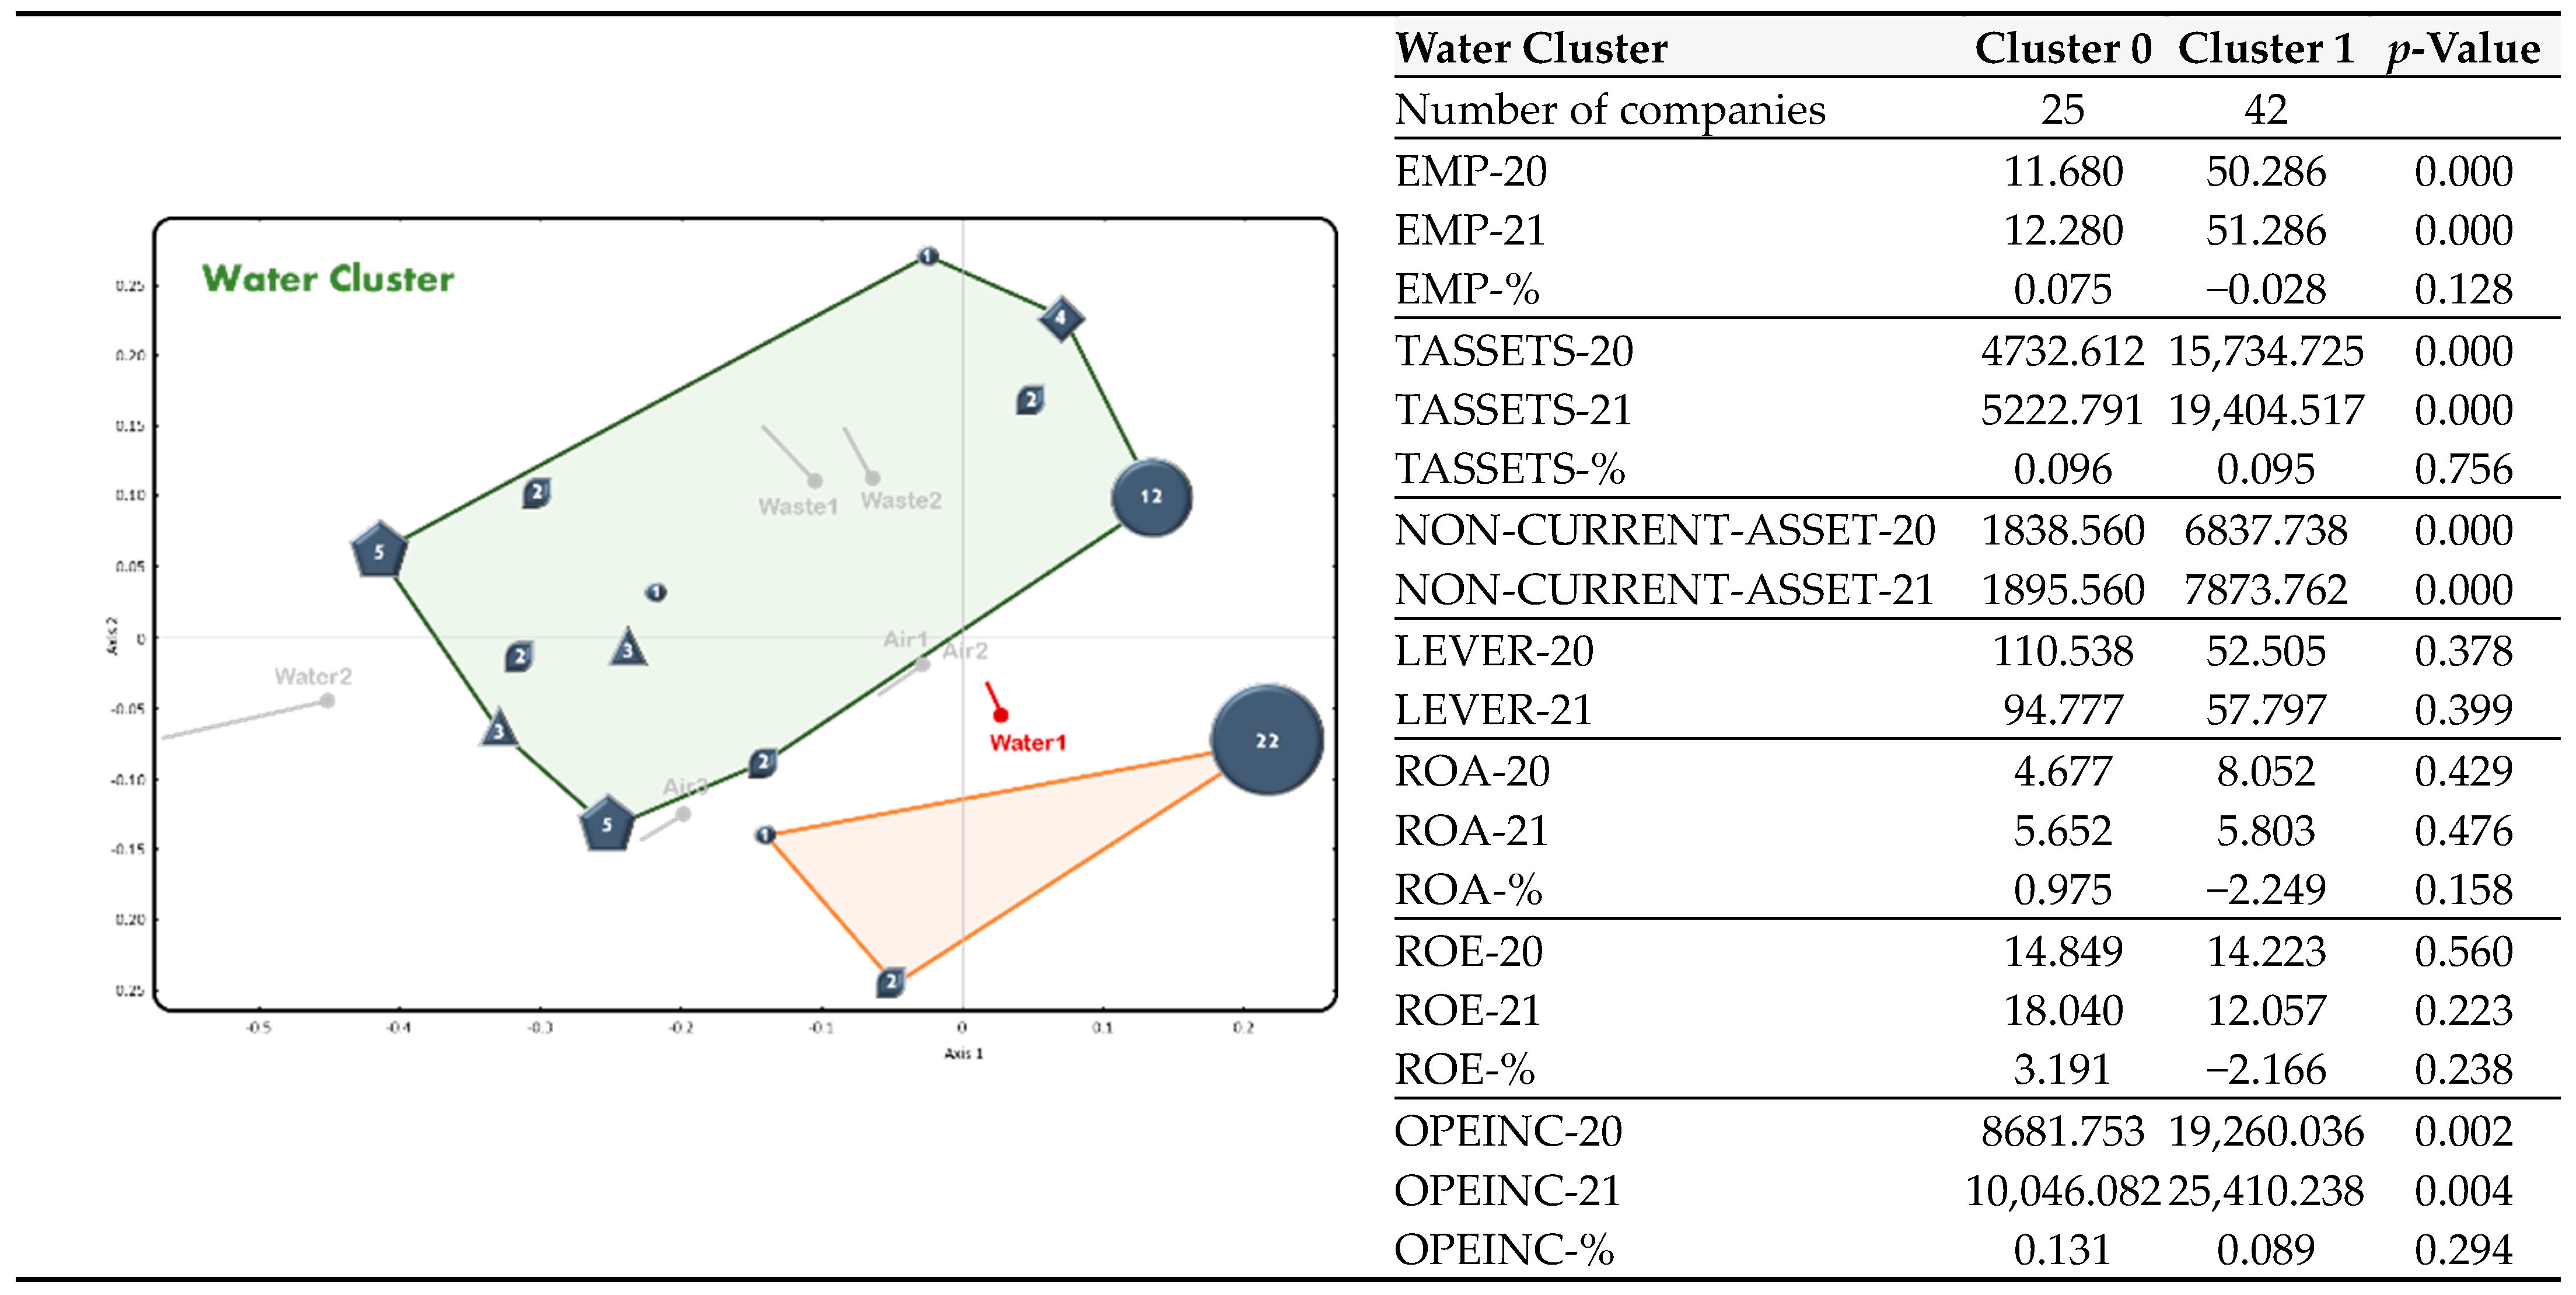
Water commitment. This cluster is made up of 12 companies, whose commitment is focused on investing in technologies to optimize water management. Regarding their economic–financial condition, they show similar financial values to companies concerned with air management, although the ROE is lower as they are more prone to self-financing and have very low leverage;
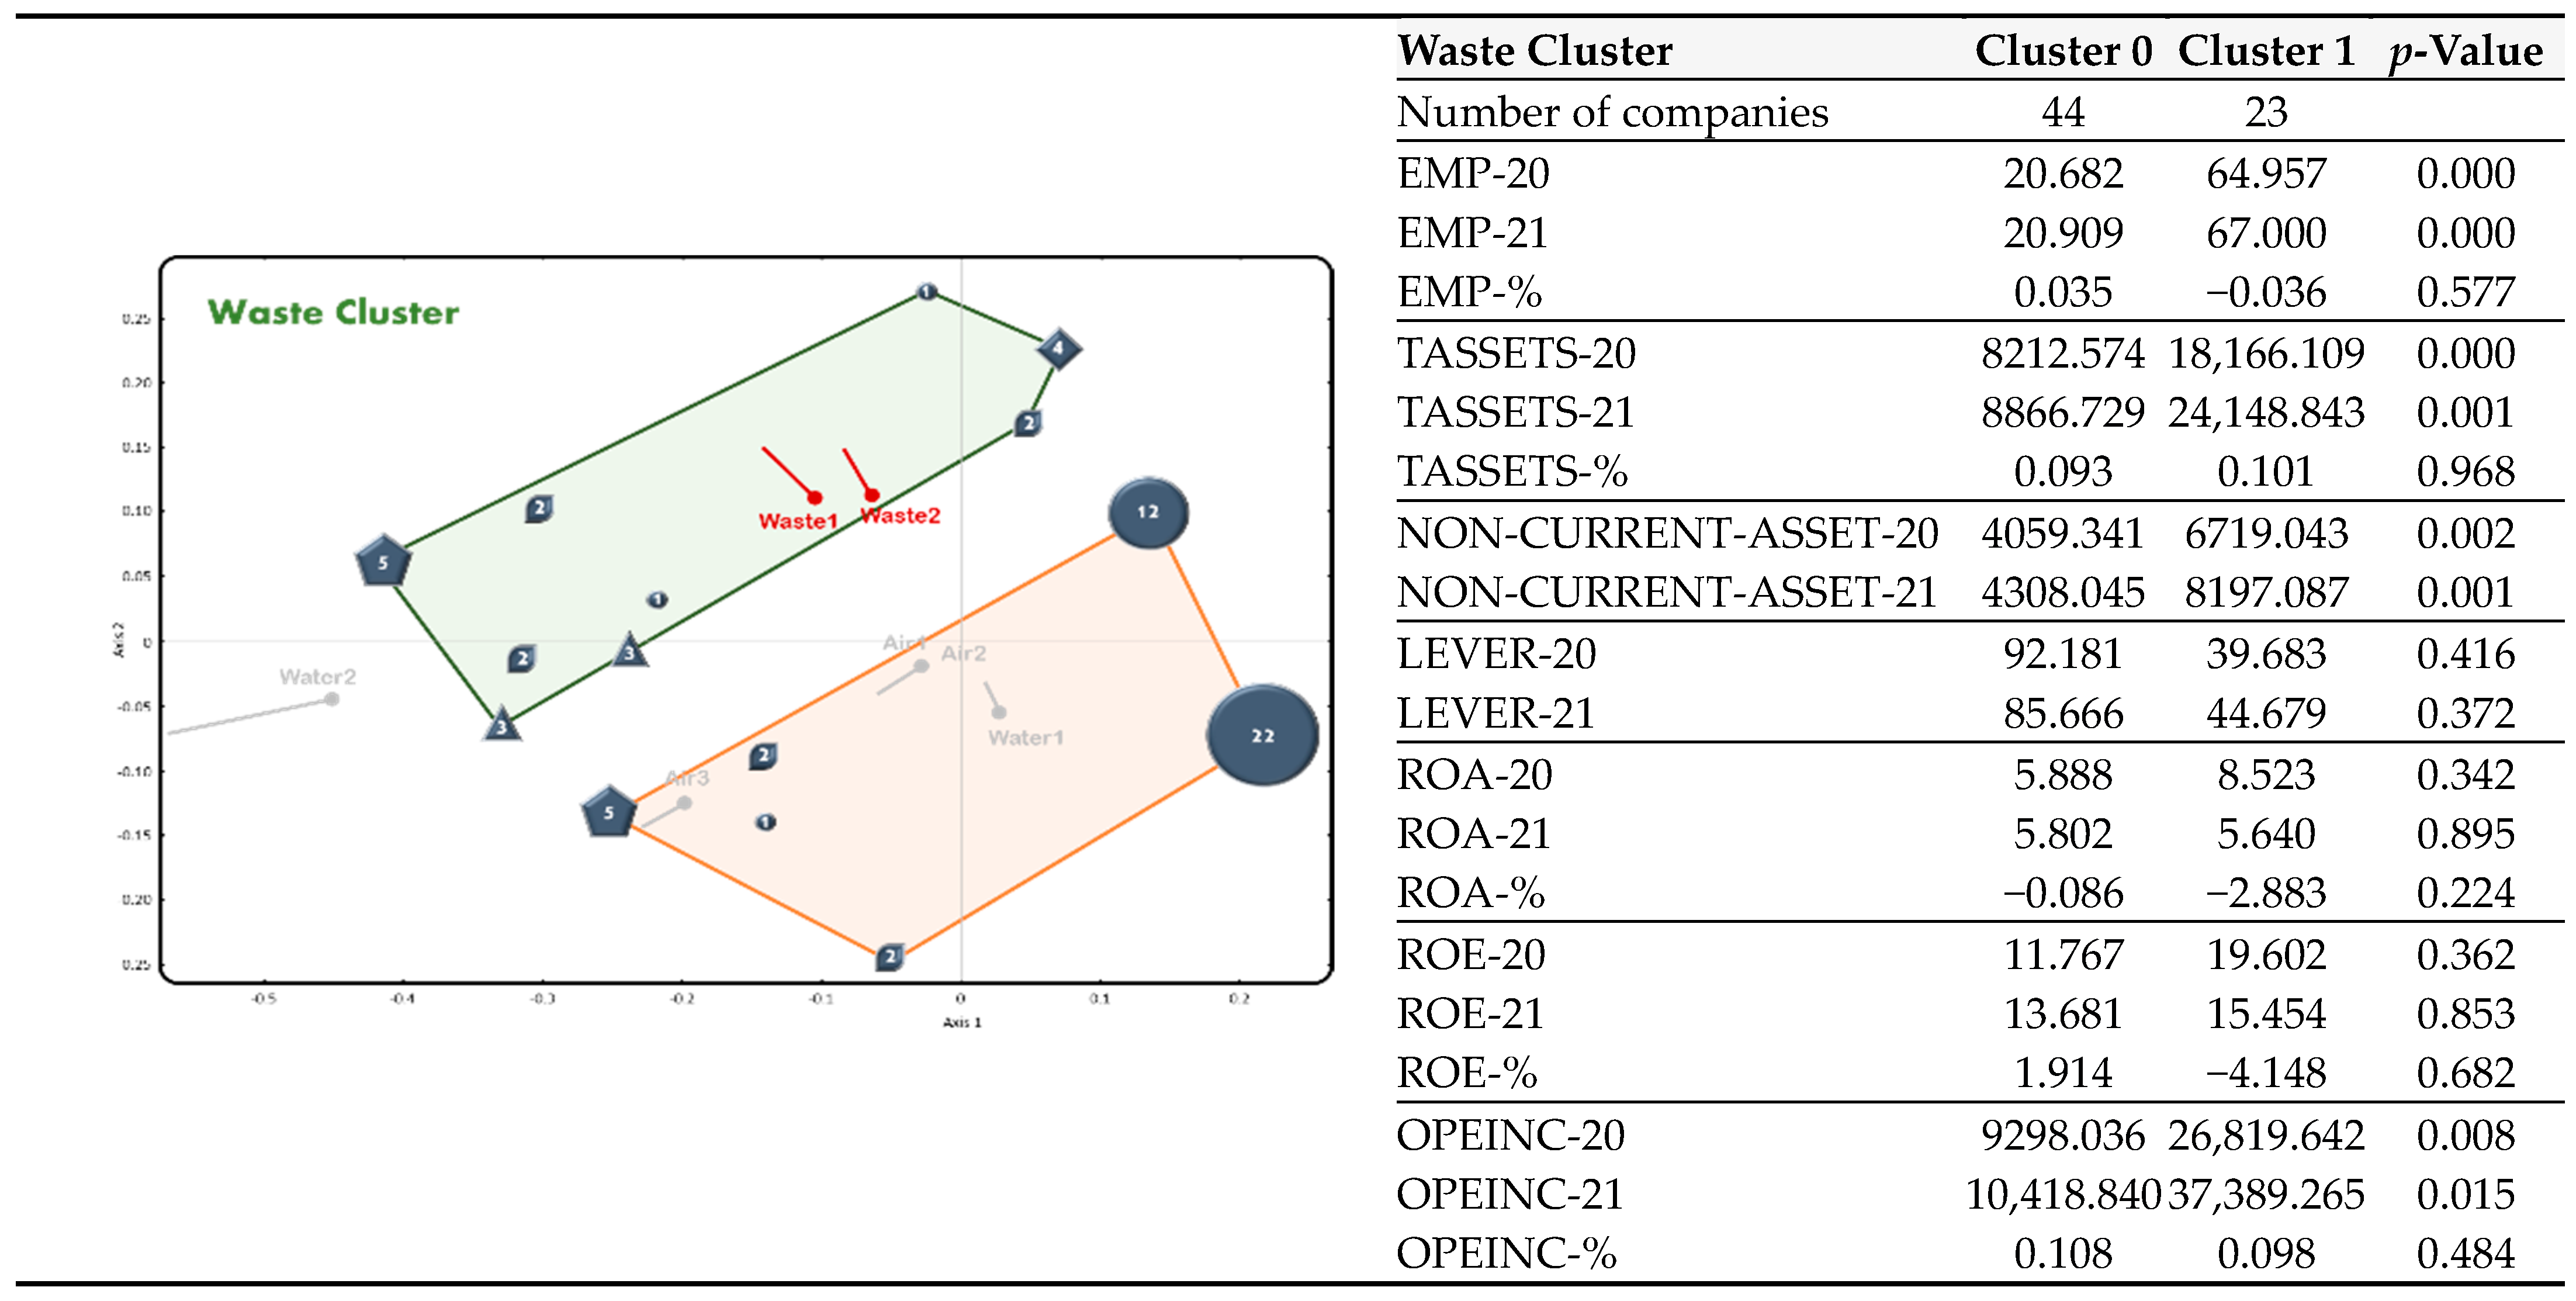
Waste commitment. The cluster is made up of seven companies that are particularly concerned with waste and water management. The values of the financial magnitudes considered here are similar to those of the previous cluster. They are also characterized by presenting the lowest economic returns and the lowest leverage;
Air commitment (only Air1 and Air2). This is made up of only three companies that priorities air management. From the economic–financial point of view, they show values well below those of the previous clusters. On the contrary, they present high ROA and ROE values, and are the most leveraged companies in the study;
Companies without commitment. Finally, 22 of the 67 companies in the study do not report on their website any type of commitment to the variables studied. These companies show the lowest values in the magnitudes related to size and investment in tangible and intangible resources. Further, their economic and financial returns are high and they have great leverage.

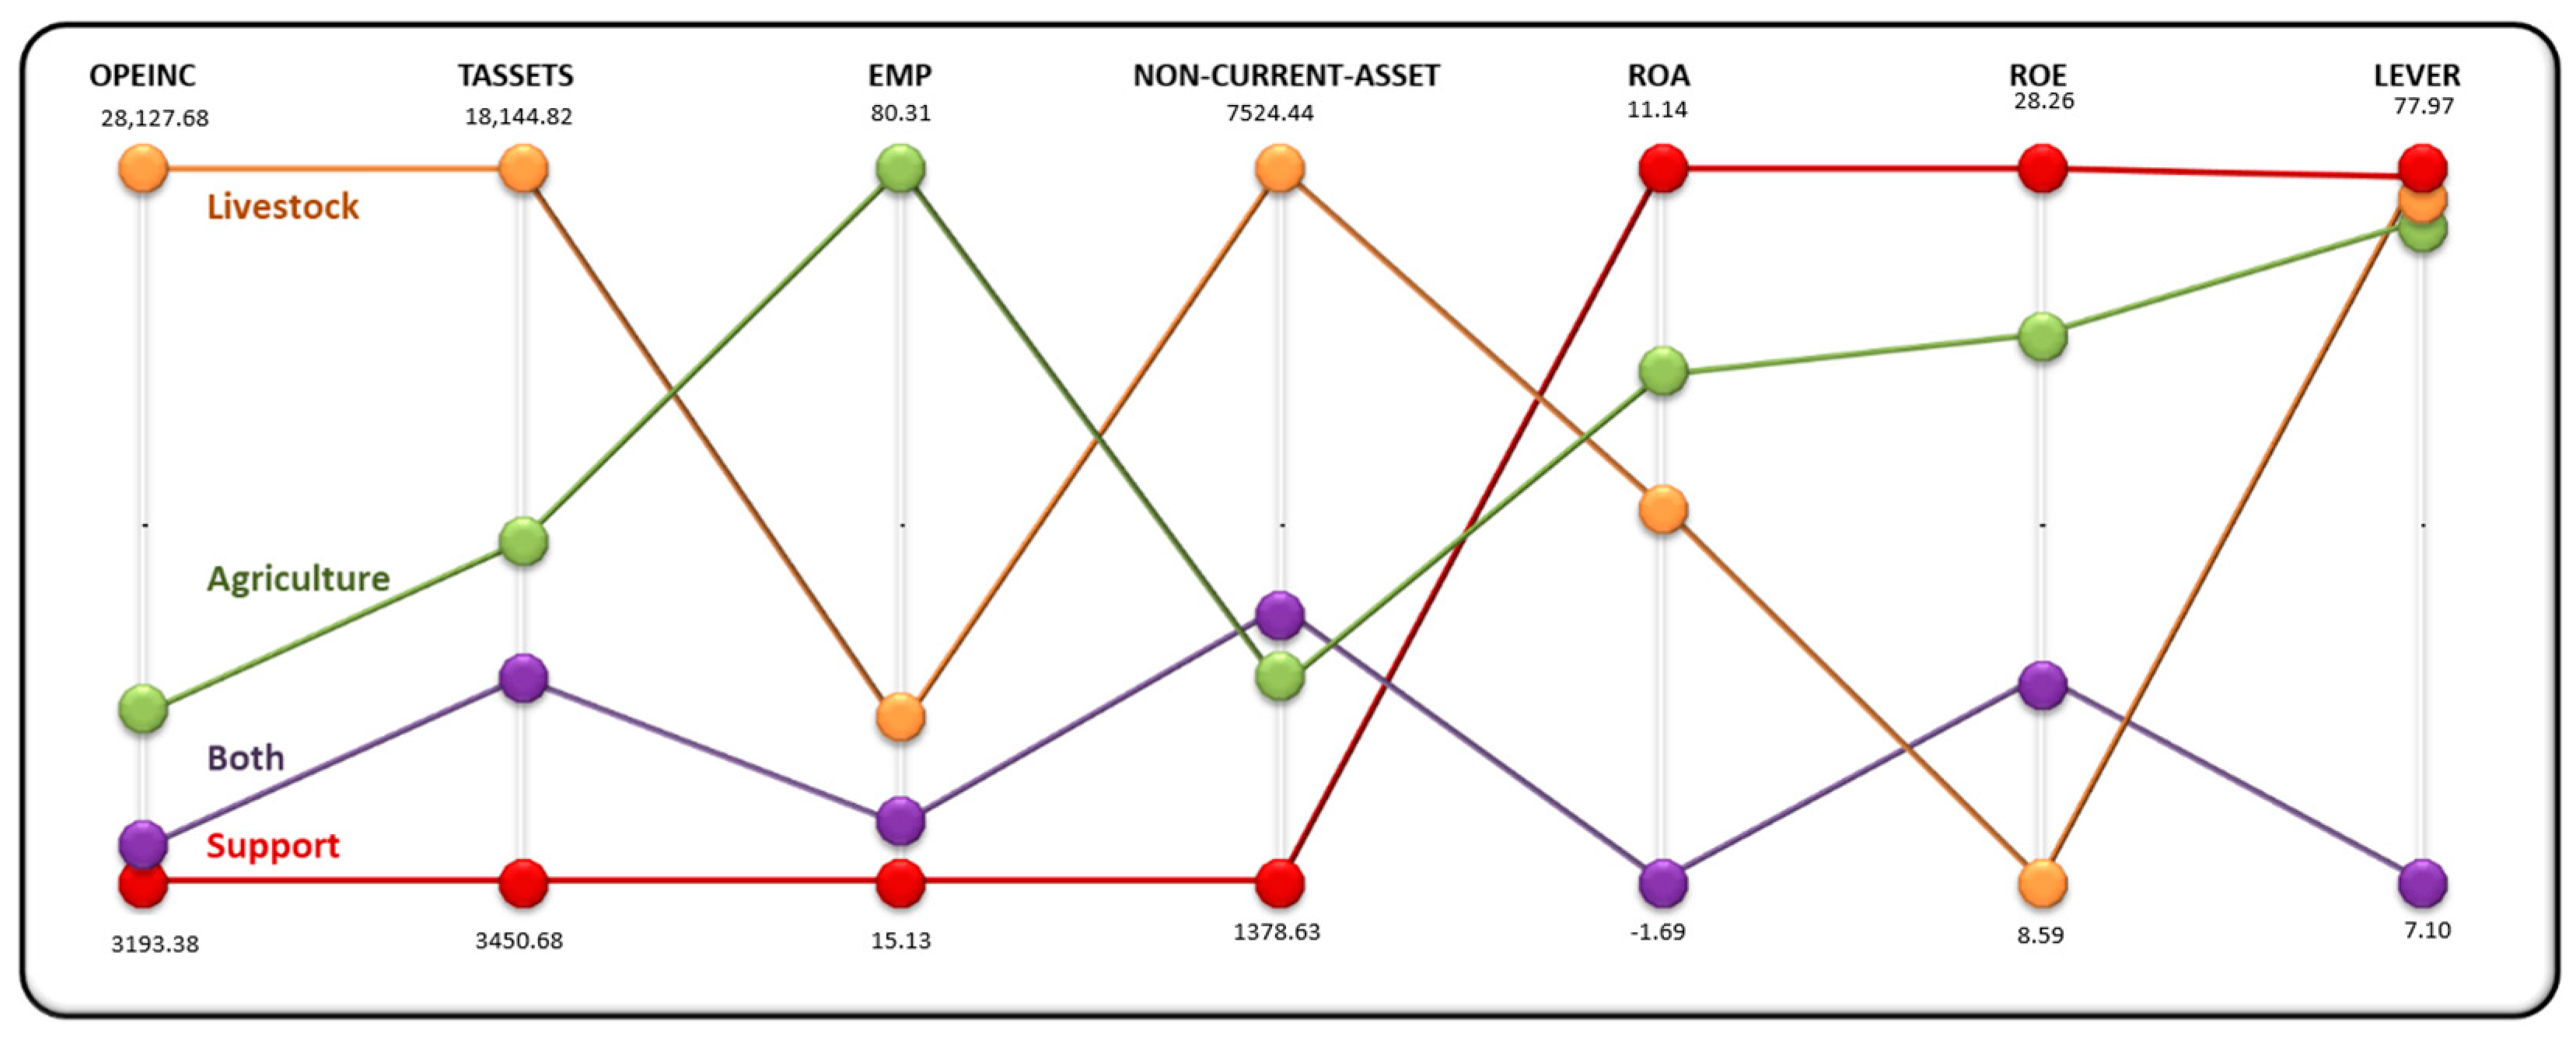
5. Analysis of Environmental Commitments by Sub-Activity and Their Relationship with the Economic–Financial Situation of the Company

The next step is to analyze the environmental commitment of the companies according to the sub-activities in which they are engaged. To do this, we consider the following groups of companies: (i) agriculture, (ii) livestock farming, (iii) agriculture and livestock farming, and (iv) support activities. The latter are companies that sell agricultural inputs such as seeds, fertilizers and animal feed.
In this respect, as shown in Table 4, it can be observed that the companies specifically dedicated to agriculture are the ones that show the greatest environmental commitment (measured by the percentages of presence), and who invest in and promote the initiatives analyzed in terms of air, water and waste management. Very close to these companies are the livestock farming companies, whose environmental commitments to air and water management are much lower than those of the agricultural companies, but who are more committed to waste management.
In third place are the companies with support activities, whose contributions to air management are similar to those of the livestock companies, but whose contributions are much lower in the other areas. Finally, companies with both agricultural and livestock activities show a commitment to water management and processes related to recycling materials, containers and/or packaging.
The global commitments of the agricultural companies are close to those of the livestock companies—35% compared to 32%. Thus, we can see that the livestock companies have the highest operating income, total assets and fixed assets, and the agricultural companies have the highest quantities of employees (see Figure 14); as we have already mentioned, these are the variables related to environmental commitment. Companies with auxiliary activities show the lowest values in the study for these variables, but the highest values for economic and financial profitability and leverage. Finally, the companies engaged in both agriculture and livestock farming show low values for all the economic–financial variables, indicating fewer resources and capacities, although they are the most effective companies in terms of reducing the risks of water scarcity. They are also the most likely to implement and develop activities related to reusing materials such as cardboard, glass or plastic.

6. Discussion of the Results

This analysis of the adoption of clean technologies required to counteract the adverse effects on the environment generated by the agricultural and livestock sectors of Castilla y León has allowed us to identify, in a general way, a close relationship between the means, factors and capabilities available to companies (which are associated with the economic and financial variables related to total income, total assets, fixed assets and quantities of employees) and the acquisition and implementation of technologies that help to reduce air- and water-polluting emissions, as well as the management of waste derived from the activities agro-livestock. This is consistent with the hypothesis of the resources and capabilities approach, according to which a greater source of operating income, a greater financial capacity to undertake investments, and the growing expertise and knowledge of workers make it easier for companies to undertake continuous improvements in their production processes in favor of the environment [23].
In addition, the analysis based on clusters at the level of environmental elements and specific environmental commitments allowed us to observe the hierarchical preference of companies as regards adopting clean technologies that will help to mitigate, first, the risks of water scarcity, followed by the risks of CO2 and GHG emissions and, lastly, the risks of pollution that relate to agro-ecosystems (negative impacts on fauna and flora) and the management of waste and its reintroduction through composting, or the reuse of plastic materials. Related to this, 24% of the companies in the sample show a strong commitment, in line with the synergy between agriculture and animal husbandry, to the transition to clean technologies, as was identified by Passarelli, Scharfy, Singh, Chiarelotto and Kumar [4,5,12,14,17].
In addition to the above, 34% of the companies show a high level of economic and financial profitability, but they also have a high level of debt, which prevents them from acquiring clean technologies. This shows the financial and economic potential of agricultural and livestock activities in Castilla y León, and necessitates the implementation of public policies and/or the attraction of investors committed to sustainability and willing to provide financial resources so that these companies can implement clean technologies with the potential to benefit the wildlife of agro-ecosystems.
Likewise, companies that only carry out agricultural activities are the most committed to reducing the emission of pollutants into the air, as a consequence of replacing traditional and polluting energy sources with renewable energy systems. In addition, these systems can also bring medium- and long-term economic benefits for companies, as they allow them to have autonomy in the supply of energy and reduce liquidity risks due to increases in the price of energy resources on the market [17]. In addition, the livestock companies are the ones that invest the most in technologies that allow them to transform vegetable waste into feed for livestock, which elucidates a network of collaboration between companies involved in exclusive and independent activities of planting–gathering food and livestock—that is, the development of nascent business symbiosis between the agro-livestock companies of Castilla y León. Finally, the companies that jointly carry out agricultural and livestock activities in Castilla y León are the ones that have developed the most technologies in mitigating the risk of freshwater scarcity, this being a local approach to one of the main challenges facing the sector worldwide [12].

7. Conclusions

Given the multidimensional nature of the data, the use of statistical techniques that can capture this multivariate character was essential. Thus, the results of the External Logistic Biplot, given in a language accessible to researchers in the field of business projects on clean technologies, prioritizing visual results, allow us to conclude, within our analytical framework, that the agro-livestock companies of Castilla y León Larger that are the most active in investments in tangible and intangible resources, and with the greatest economic activities, are the firms that show greater commitments to mitigating the environmental risks arising from their activities, promoting the care of agro-ecosystems and the transition to agricultural circularity, as supported by the utilization of clean technologies in their manufacture processes. Moreover, it can be affirmed that the acquisition of clean technologies to reduce CO2 and GHG emissions is an investment with added value for entrepreneurs in the sector, as it allows them to face the operational risks stemming from the increases in the costs of traditional energy sources.
In other words, our findings suggest that the productive systems of agro-livestock activities are developing in a way that is resilient to climate and environmental changes, without compromising other ecosystem services, and seem to be aligned with the different sectors of society. This will enable the management and protection of biodiversity, which is essential to sustainable development, although these commitments are strongly conditioned by resources and business capacities. Therefore, our findings suggest the need for public institutions that promote greater knowledge about clean technologies among companies in the agro-livestock sector, and encourage investments related to processes that respect the environment, as well as collaboration with other institutions. We also would like promote the link between the environment, animals and health, as promoted by the United Nations.

Limitations and Future Research

Finally, our research presents limitations that can be addressed in future work, such as the scarcity of information on environmental issues faced by companies, which can be overcome by conducting interviews with managers of agricultural and livestock companies. In addition, a future line of research that emerges from our results is the characterization of the drivers and barriers of business symbiosis between agribusinesses in Castilla y León, in a context that increasingly demands effective and socially inclusive environmental strategies.
It is also suggested that future studies should investigate the adoption of sustainable technologies in agricultural cooperatives and family farms, encouraging their adoption and use in daily activities. Studies should also focus on determine how governments have adopted economic, financial and fiscal instruments to encourage the agricultural and livestock sectors to adopt practices that reduce environmental impacts in line with sustainability, and their effectiveness.
From the methodological point of view, futures studies need to specify improvements regarding different multivariate techniques that will improve the visual representation and robustness of results. In addition, future authors need to introduce further controls in addition to those used in this paper.

Author Contributions

S.-Y.E.-A., V.A.-E., T.-C.A. and I.-M.G.-S. have participated in the research. All authors have read and agreed to the published version of the manuscript.

Funding

Junta de Castilla y León y Fondo Europeo de Desarrollo Regional under Grant CLU-2019-03 Unidad de Excelencia “Gestión Económica para la Sostenibilidad” (GECOS). Programa Investigo 2021: Programa del Servicio Público de Empleo Estatal (SEPE).

Institutional Review Board Statement

Not applicable.

Data Availability Statement

The datasets generated and analyzed during the current study are available from the corresponding author on reasonable request.

Conflicts of Interest

The authors declare no conflict of interest.

References

  1. Bibi, F.; Rahman, A. An Overview of Climate Change Impacts on Agriculture and Their Mitigation Strategies. Agriculture 2023, 13, 1508. [Google Scholar] [CrossRef]
  2. Gabriel, A.; Gandorfer, M. Adoption of digital technologies in agriculture—An inventory in a european small-scale farming region. Precis. Agric. 2022, 24, 68–91. [Google Scholar] [CrossRef]
  3. Ridzuan, N.H.A.M.; Marwan, N.F.; Khalid, N.; Ali, M.H.; Tseng, M.-L. Effects of agriculture, renewable energy, and economic growth on carbon dioxide emissions: Evidence of the environmental Kuznets curve. Resour. Conserv. Recycl. 2020, 160, 104879. [Google Scholar] [CrossRef]
  4. Passarelli, M.; Bongiorno, G.; Cucino, V.; Cariola, A. Adopting new technologies during the crisis: An empirical analysis of agricultural sector. Technol. Forecast. Soc. Chang. 2023, 186, 122106. [Google Scholar] [CrossRef]
  5. Scharfy, D.; Boccali, N.; Stucki, M. Clean Technologies in Agriculture—How to Prioritise Measures? Sustainability 2017, 9, 1303. [Google Scholar] [CrossRef]
  6. Malhi, G.S.; Kaur, M.; Kaushik, P. Impact of Climate Change on Agriculture and Its Mitigation Strategies: A Review. Sustainability 2021, 13, 1318. [Google Scholar] [CrossRef]
  7. Mariantonietta, F.; Alessia, S.; Francesco, C.; Giustina, P. GHG and cattle farming: CO-assessing the emissions and economic performances in Italy. J. Clean. Prod. 2018, 172, 3704–3712. [Google Scholar] [CrossRef]
  8. Coderoni, S.; Vanino, S. The farm-by-farm relationship among carbon productivity and economic performance of agriculture. Sci. Total. Environ. 2022, 819, 153103. [Google Scholar] [CrossRef]
  9. Mielcarek-Bocheńska, P.; Rzeźnik, W. Greenhouse Gas Emissions from Agriculture in EU Countries—State and Perspectives. Atmosphere 2021, 12, 1396. [Google Scholar] [CrossRef]
  10. Velasco-Muñoz, J.F.; Mendoza, J.M.F.; Aznar-Sánchez, J.A.; Gallego-Schmid, A. Circular economy implementation in the agricultural sector: Definition, strategies and indicators. Resour. Conserv. Recycl. 2021, 170, 105618. [Google Scholar] [CrossRef]
  11. Bwambale, E.; Abagale, F.K.; Anornu, G.K. Smart irrigation monitoring and control strategies for improving water use efficiency in precision agriculture: A review. Agric. Water Manag. 2021, 260, 107324. [Google Scholar] [CrossRef]
  12. Singh, A. A review of wastewater irrigation: Environmental implications. Resour. Conserv. Recycl. 2021, 168, 105454. [Google Scholar] [CrossRef]
  13. Haaker, T.; Ly, P.T.M.; Nguyen-Thanh, N.; Nguyen, H.T.H. Business model innovation through the application of the Internet-of-Things: A comparative analysis. J. Bus. Res. 2021, 126, 126–136. [Google Scholar] [CrossRef]
  14. Chiarelotto, M.; Restrepo, J.C.P.S.; Lorin, H.E.F.; Damaceno, F.M. Composting organic waste from the broiler production chain: A perspective for the circular economy. J. Clean. Prod. 2021, 329, 129717. [Google Scholar] [CrossRef]
  15. Casson Moreno, V.; Iervolino, G.; Tugnoli, A.; Cozzani, V. Techno-economic and environmental sustainability of biomass waste conversion based on thermocatalytic reforming. Waste Manag. 2020, 101, 106–115. [Google Scholar] [CrossRef] [PubMed]
  16. Kircher, M.; Aranda, E.; Athanasios, P.; Radojcic-Rednovnikov, I.; Romantschuk, M.; Ryberg, M.; Schock, G.; Shilev, S.; Stanescu, M.D.; Stankeviciute, J.; et al. Treatment and valorization of bio-waste in the EU. EFB Bioeconomy J. 2023, 3, 100051. [Google Scholar] [CrossRef]
  17. Kumar, C.M.S.; Singh, S.; Gupta, M.K.; Nimdeo, Y.M.; Raushan, R.; Deorankar, A.V.; Kumar, T.A.; Rout, P.K.; Chanotiya, C.; Pakhale, V.D.; et al. Solar energy: A promising renewable source for meeting energy demand in Indian agriculture applications. Sustain. Energy Technol. Assess. 2023, 55, 102905. [Google Scholar] [CrossRef]
  18. Sarangi, P.K.; Subudhi, S.; Bhatia, L.; Saha, K.; Mudgil, D.; Shadangi, K.P.; Srivastava, R.K.; Pattnaik, B.; Arya, R.K. Utilization of agricultural waste biomass and recycling toward circular bioeconomy. Environ. Sci. Pollut. Res. 2022, 30, 8526–8539. [Google Scholar] [CrossRef]
  19. Molina-Maturano, J.; Speelman, S.; De Steur, H. Constraint-based innovations in agriculture and sustainable development: A scoping review. J. Clean. Prod. 2019, 246, 119001. [Google Scholar] [CrossRef]
  20. Peteraf, M.A. The cornerstones of competitive advantage: A resource-based view. Strat. Manag. J. 1993, 14, 179–191. [Google Scholar] [CrossRef]
  21. Aibar-Guzmán, B.; Aibar-Guzmán, C.; Piñeiro-Chousa, J.-R.; Hussain, N.; García-Sánchez, I.-M. The benefits of climate tech: Do institutional investors affect these impacts? Technol. Forecast. Soc. Chang. 2023, 192, 122536. [Google Scholar] [CrossRef]
  22. García-Sánchez, I. The moderating role of board monitoring power in the relationship between environmental conditions and corporate social responsibility. Bus. Ethic. A Eur. Rev. 2019, 29, 114–129. [Google Scholar] [CrossRef]
  23. García-Sánchez, I.; Gallego-Álvarez, I.; Zafra-Gómez, J. Do independent, female and specialist directors promote eco-innovation and eco-design in agri-food firms? Bus. Strat. Environ. 2020, 30, 1136–1152. [Google Scholar] [CrossRef]
  24. Instituto Tecnológico Agrario de la Junta de Catilla y Leòn. Plataforma de Dinamización de la Investigación e Inno-Vación Agraria y Agroalimentaria 2021–2027. 2023. Available online: https://www.itacyl.es/documents/20143/342632/Plataforma+Dinamizaci%C3%B3n_v7_Media.pdf/fc553131-1ec2-9611-3e05-e22ae5774c51?t=1625641022319 (accessed on 21 October 2023).
  25. Hsieh, H.-F.; Shannon, S.E. Three Approaches to Qualitative Content Analysis. Qual. Health Res. 2005, 15, 1277–1288. [Google Scholar] [CrossRef] [PubMed]
  26. García-Sánchez, I.-M. Debt vs. self-financing innovation projects: An exploratory study of Spanish agri-food SMEs. Span. J. Agric. Res. 2021, 19, e0104. [Google Scholar] [CrossRef]
  27. Gabriel, K.R. The biplot-graphic display of matrices with application to principal component analysis. Biometrika 1971, 58, 453–467. [Google Scholar] [CrossRef]
  28. Galindo, M.P.; Cuadras, C. Una Extensión del Método Biplot y su Relación con Otras Técnicas; Publicaciones de Bioestadística y Biomatemática, 17; Universidad de Barcelona: Barcelona, Spain, 1986. [Google Scholar]
  29. Greenacre, M.J. Biplots in Practice; Fundacion BBVA: Bilbao, Spain, 2010. [Google Scholar]
  30. Greenacre, M.J. Biplots: El placer de la descomposición de valores singulares. Revis. Interdiscip. Wiley Estadística Comput. 2012, 4, 399–406. [Google Scholar] [CrossRef]
  31. Gower, J.C.; Hand, D.J. Biplots; CRC Press: Boca Raton, FL, USA, 1995. [Google Scholar]
  32. Vicente-Villardón, J.L.; Galindo-Villardón, M.P.; Blázquez-Zaballos, A. Logistic biplots. In Multiple Correspondence Analysis and Related Methods; Chapman & Hall: London, UK, 2006; pp. 503–521. [Google Scholar]
  33. Demey, J.R.; Vicente-Villardón, J.L.; Galindo-Villardón, M.P.; Zambrano, A.Y. Identifying molecular markers associated with classification of genotypes by External Logistic Biplots. Bioinformatics 2008, 24, 2832–2838. [Google Scholar] [CrossRef]
  34. Gower, J.C. Some distance properties of latent root and vector methods used in multivariate analysis. Biometrika 1966, 53, 325–338. [Google Scholar] [CrossRef]
  35. Long, J.S. Regression models for categorical and limited dependent variables. Adv. Quant. Tech. Soc. Sci. 1997, 7, 80–81. [Google Scholar]
  36. Tenenhaus, M.; Young, F.W. An analysis and synthesis of multiple correspondence analysis, optimal scaling, dual scaling, homogeneity analysis and other methods for quantifying categorical multivariate data. Psychometrika 1985, 50, 91–119. [Google Scholar] [CrossRef]
  37. Vicente-Villardón, J.L. Multbiplot: A Package for Multivariate Analysis Using Biplots. Computer Software. Departa-Mento de Estadística. Universidad de Salamanca. Extraído de 2010. Available online: http://biplot.usal.es/multbiplot (accessed on 1 October 2023).
  38. Galindo, M.P. An alternative for simultaneous representation: HJ-Biplot. Questiió Quad. D’estadística Sist. Inform. I Investig. Oper. 1986, 10, 12–23. [Google Scholar]
Figure 1. Analysis framework.
Agriculture 13 02087 g001
Figure 2. Comparative statistics of companies.
Agriculture 13 02087 g002
Figure 3. Graphical interpretation of the HJ-Biplot.
Agriculture 13 02087 g003
Figure 4. Geometry of the fitted logistic response curve.
Agriculture 13 02087 g004
Figure 5. Graphic interpretation of the External Logistic Biplot: analysing the variables that most concern companies.
Agriculture 13 02087 g005
Figure 6. Logistics biplot: analyzing the mitigation of adverse environmental effects through clean technologies.
Agriculture 13 02087 g006
Figure 7. Presence of the companies committed to each environmental element.
Agriculture 13 02087 g007
Figure 8. HJ-Biplot: Environmental commitment and economic-financial situation of Castilla y León companies.
Agriculture 13 02087 g008
Figure 9. Mean values and non-parametric p-value, External Logistic Biplot by waste management cluster for the care of ecosystems.
Agriculture 13 02087 g009
Figure 10. Mean values and non-parametric p-value, External Logistic Biplot by air management cluster.
Agriculture 13 02087 g010
Figure 11. Mean values and non-parametric p-value, External Logistic Biplot by water management cluster.
Agriculture 13 02087 g011
Figure 12. Cluster analysis by specific environmental commitments.
Agriculture 13 02087 g012
Figure 13. Parallel coordinates by cluster: environmental commitments and their relationships with the economic–financial situation, year 2021.
Agriculture 13 02087 g013
Figure 14. Parallel coordinates by cluster: linking the main activity and the economic–financial situation, year 2021.
Agriculture 13 02087 g014
Table 1. Description of financial information and clean technology variables.
ItemVariableDescriptionName
Clean technologies
(RQ1)
Investments in clean technologiesDummy variables that represent the acquisition of machinery that reduces carbon dioxide (CO2) emissions and/or greenhouse gas (GHG) emissions and is used in production processes. Also, it refers to the purchase of photovoltaic plants that allow for replacing non-renewable energy sources.Air1
Carbon dioxide (CO2) and greenhouse gas (GHG) emissions control systemDummy variables that represent the implementation of a system that facilitates the permanent monitoring of CO2 and GHG emissions in production processes (agricultural and livestock).Air2
Energy efficiencyDummy variables that represent the minimization of the consumption of non-renewable or polluting energy.Air3
Investment in clean technologies for water managementDummy variables that represent the acquisition of machinery, irrigation systems for crops or water supply systems for animals that guarantee the efficient use of water resources.Water1
Verification system in water managementDummy variables that represent the implementation of a system that facilitates the control of water consumed in agricultural or livestock activities, either per planted hectare or per animal.Water2
Waste reuse processesDummy variables that represent the implementation and development of activities that allow the conversion of waste of vegetable origin into fertilizers for plants or food for animals.Waste1
Processes for recycling materials, containers and/or packagingDummy variables that represent the implementation and development of activities for the reuse of cardboard, paper, glass, plastic and all kinds of containers and packaging.Waste2
Financial informationResources and capabilities (RQ2)
EmployeesNumerical variable that represents labor resources measured by the quantity of employees.EMP
Total activeNumerical variables that identify the economic resources controlled by the firm as a result of past events and from which economic benefits are expected to be obtained.TASSETS
Non-current assetsNumerical variables that identify the economic resources controlled by the company, which are expected to be maintained for more than one year. For example, trademarks, constructions and buildings, machinery and equipment.NON-CURRENT-ASSET
LeverageNumerical variable that identifies the leverage positions of the firms by the proportion of debt compared to its own resources.LEVERAGE
Economic benefits (RQ3)
Economic profitabilityNumerical variable of profitability measured by the ratio that relates net profit and total assets.ROA
Financial profitNumerical variable of profitability measured by the ratio that relates the company’s net profit and its own funds.ROE
Operating incomeNumerical variable of other economic benefits measured by the amount obtained by the company as a result of developing its corporate purpose.OPEINC
Table 2. Goodness of fit of the columns.
VariableDeviancep-ValueR2% Correct
Air191.4420.000…0.996100%
Air291.4420.000…0.996100%
Air3207.5340.000…0.994100%
Water1136.6870.000…0.992100%
Water29.2450.002…0.38995.52%
Waste180.2230.000…0.87389.55%
Waste288.1540.000…0.89694.03%
Table 3. Average values by cluster: linking between environmental commitments and the economic–financial situation.
Cluster AnalysisFull CommitmentAir CommitmentWater CommitmentWaste CommitmentAir Commitment (only Air1 and Air2)Companies without Commitment
(Companies)(16)(7)(12)(7)(3)(22)
Air1100%100%0%0%100%0%
Air2100%100%0%0%100%0%
Air363%71%0%0%0%0%
Water1100%100%100%100%0%0%
Water213%0%0%0%33%0%
Waste181%0%0%43%0%0%
Waste263%0%0%71%33%0%
EMP-2080.56334.57131.33329.28615.33311.182
EMP-2184.06337.14329.41728.00017.66711.545
EMP-%−0.0380.012−0.035−0.0290.0960.073
TASSETS-2022,472.48512,076.74313,208.3958322.9645211.1414667.358
TASSETS-2130,785.23512,425.45114,382.3458979.9494995.8425253.738
TASSETS-%0.1230.1280.0650.0500.0040.109
NON-CURRENT-ASSET-207839.6887966.0006407.0834157.5714399.0001489.409
NON-CURRENT-ASSET-219887.7508238.5717041.2504332.7144270.6671571.682
LEVER-2060.44689.21455.668−7.776157.570104.125
LEVER-2157.607109.29752.89915.129124.45390.730
ROA-2010.3999.3306.4044.2355.1224.616
ROA-217.6596.0945.9461.0265.2885.701
ROA-%−2.740−3.235−0.458−3.2100.1661.085
ROE-2022.54626.648−3.33412.87417.61814.472
ROE-2116.13115.4523.56513.90614.47618.526
ROE-%−6.414−11.1966.9001.031−3.1414.054
OPEINC-2035,224.19813,870.6197914.6197609.2293348.7959408.975
OPEINC-2150,518.04614,767.8758658.4817380.6213650.80210,918.166
OPEINC-%0.1390.0470.0960.0020.1320.131
Table 4. Percentages of companies’ presence by main business activity and the average values of their economic–financial data.
ActivityAgricultureLivestockBothSupport
Proportion of the sample19%61%7%12%
Air154%39%0%38%
Air254%39%0%38%
Air331%22%0%25%
Water177%61%80%38%
Water20%7%0%0%
Waste115%32%0%13%
Waste215%27%40%13%
EMP-2075.30829.12221.80015.250
EMP-2180.30829.14620.20015.125
EMP-%−0.0140.024−0.1450.081
TASSETS-208737.00214,763.6427336.8912949.867
TASSETS-2110,463.91518,144.8217597.0953450.677
TASSETS-%0.1400.0760.0360.158
NON-CURRENT-ASSET-202464.5386673.0733503.8001249.375
NON-CURRENT-ASSET-213069.3857524.4393730.8001378.625
LEVER-2063.02583.783−24.136104.364
LEVER-2172.94977.9697.10077.044
ROA-207.8977.129−0.8638.057
ROA-217.4435.062−1.68711.144
ROA-%−0.454−2.067−0.8233.086
ROE-2029.55710.6876.08514.468
ROE-2123.7128.58714.19728.257
ROE-%−5.845−2.1008.11213.789
OPEINC-207747.22721,606.3493400.2152798.754
OPEINC-219081.78528,127.6794307.3953193.376
OPEINC-%0.0980.0940.1800.124
Disclaimer/Publisher’s Note: The statements, opinions and data contained in all publications are solely those of the individual author(s) and contributor(s) and not of MDPI and/or the editor(s). MDPI and/or the editor(s) disclaim responsibility for any injury to people or property resulting from any ideas, methods, instructions or products referred to in the content.

