
Three-Dimensional Structure Measurement for Potted Plant Based on Millimeter-Wave Radar
 ,
, 
Abstract
:1. Introduction
2. Materials and Methods
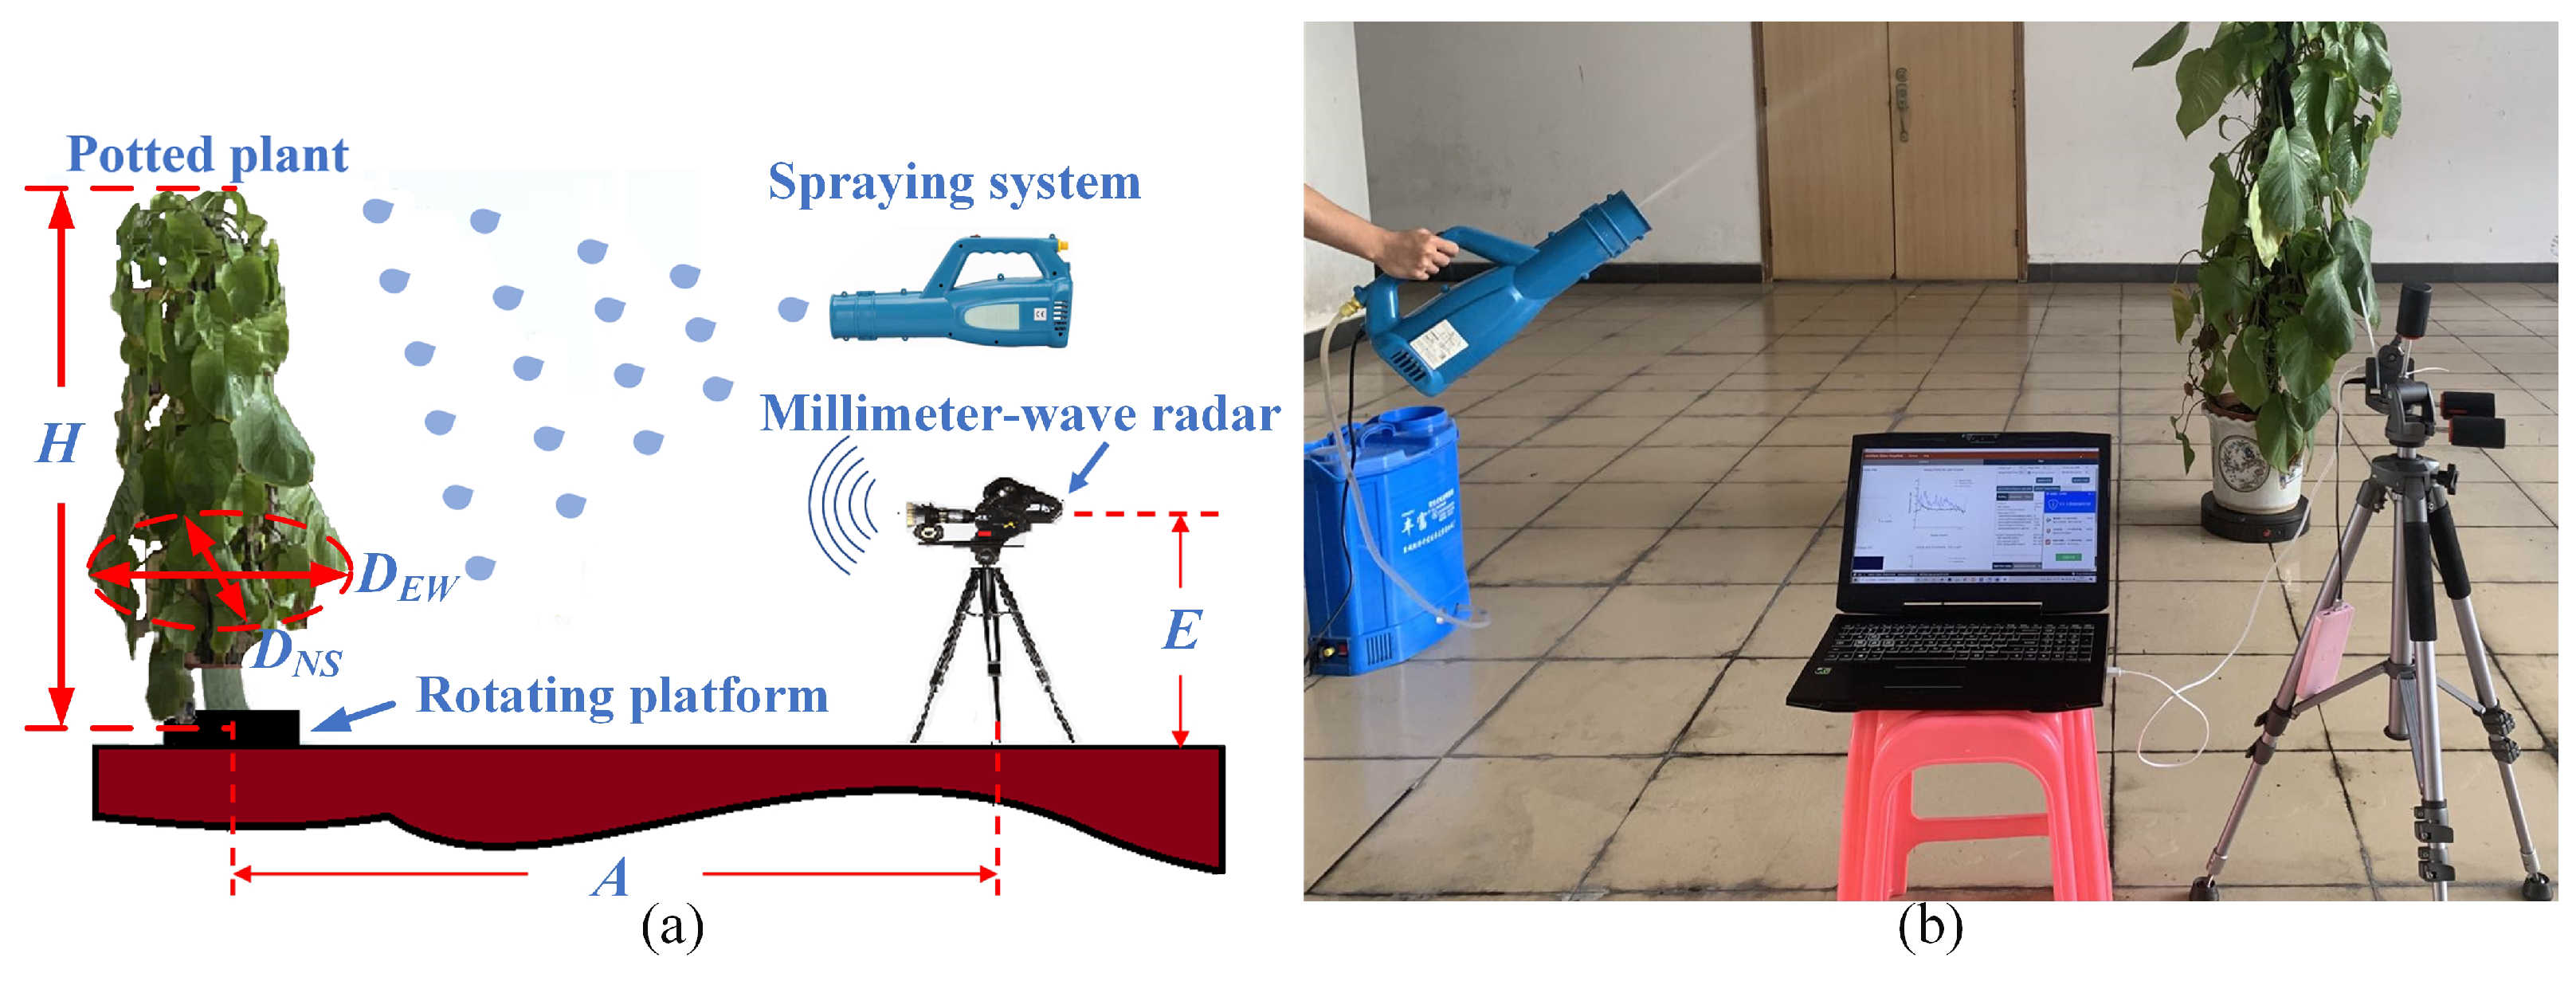
2.1. Detection System
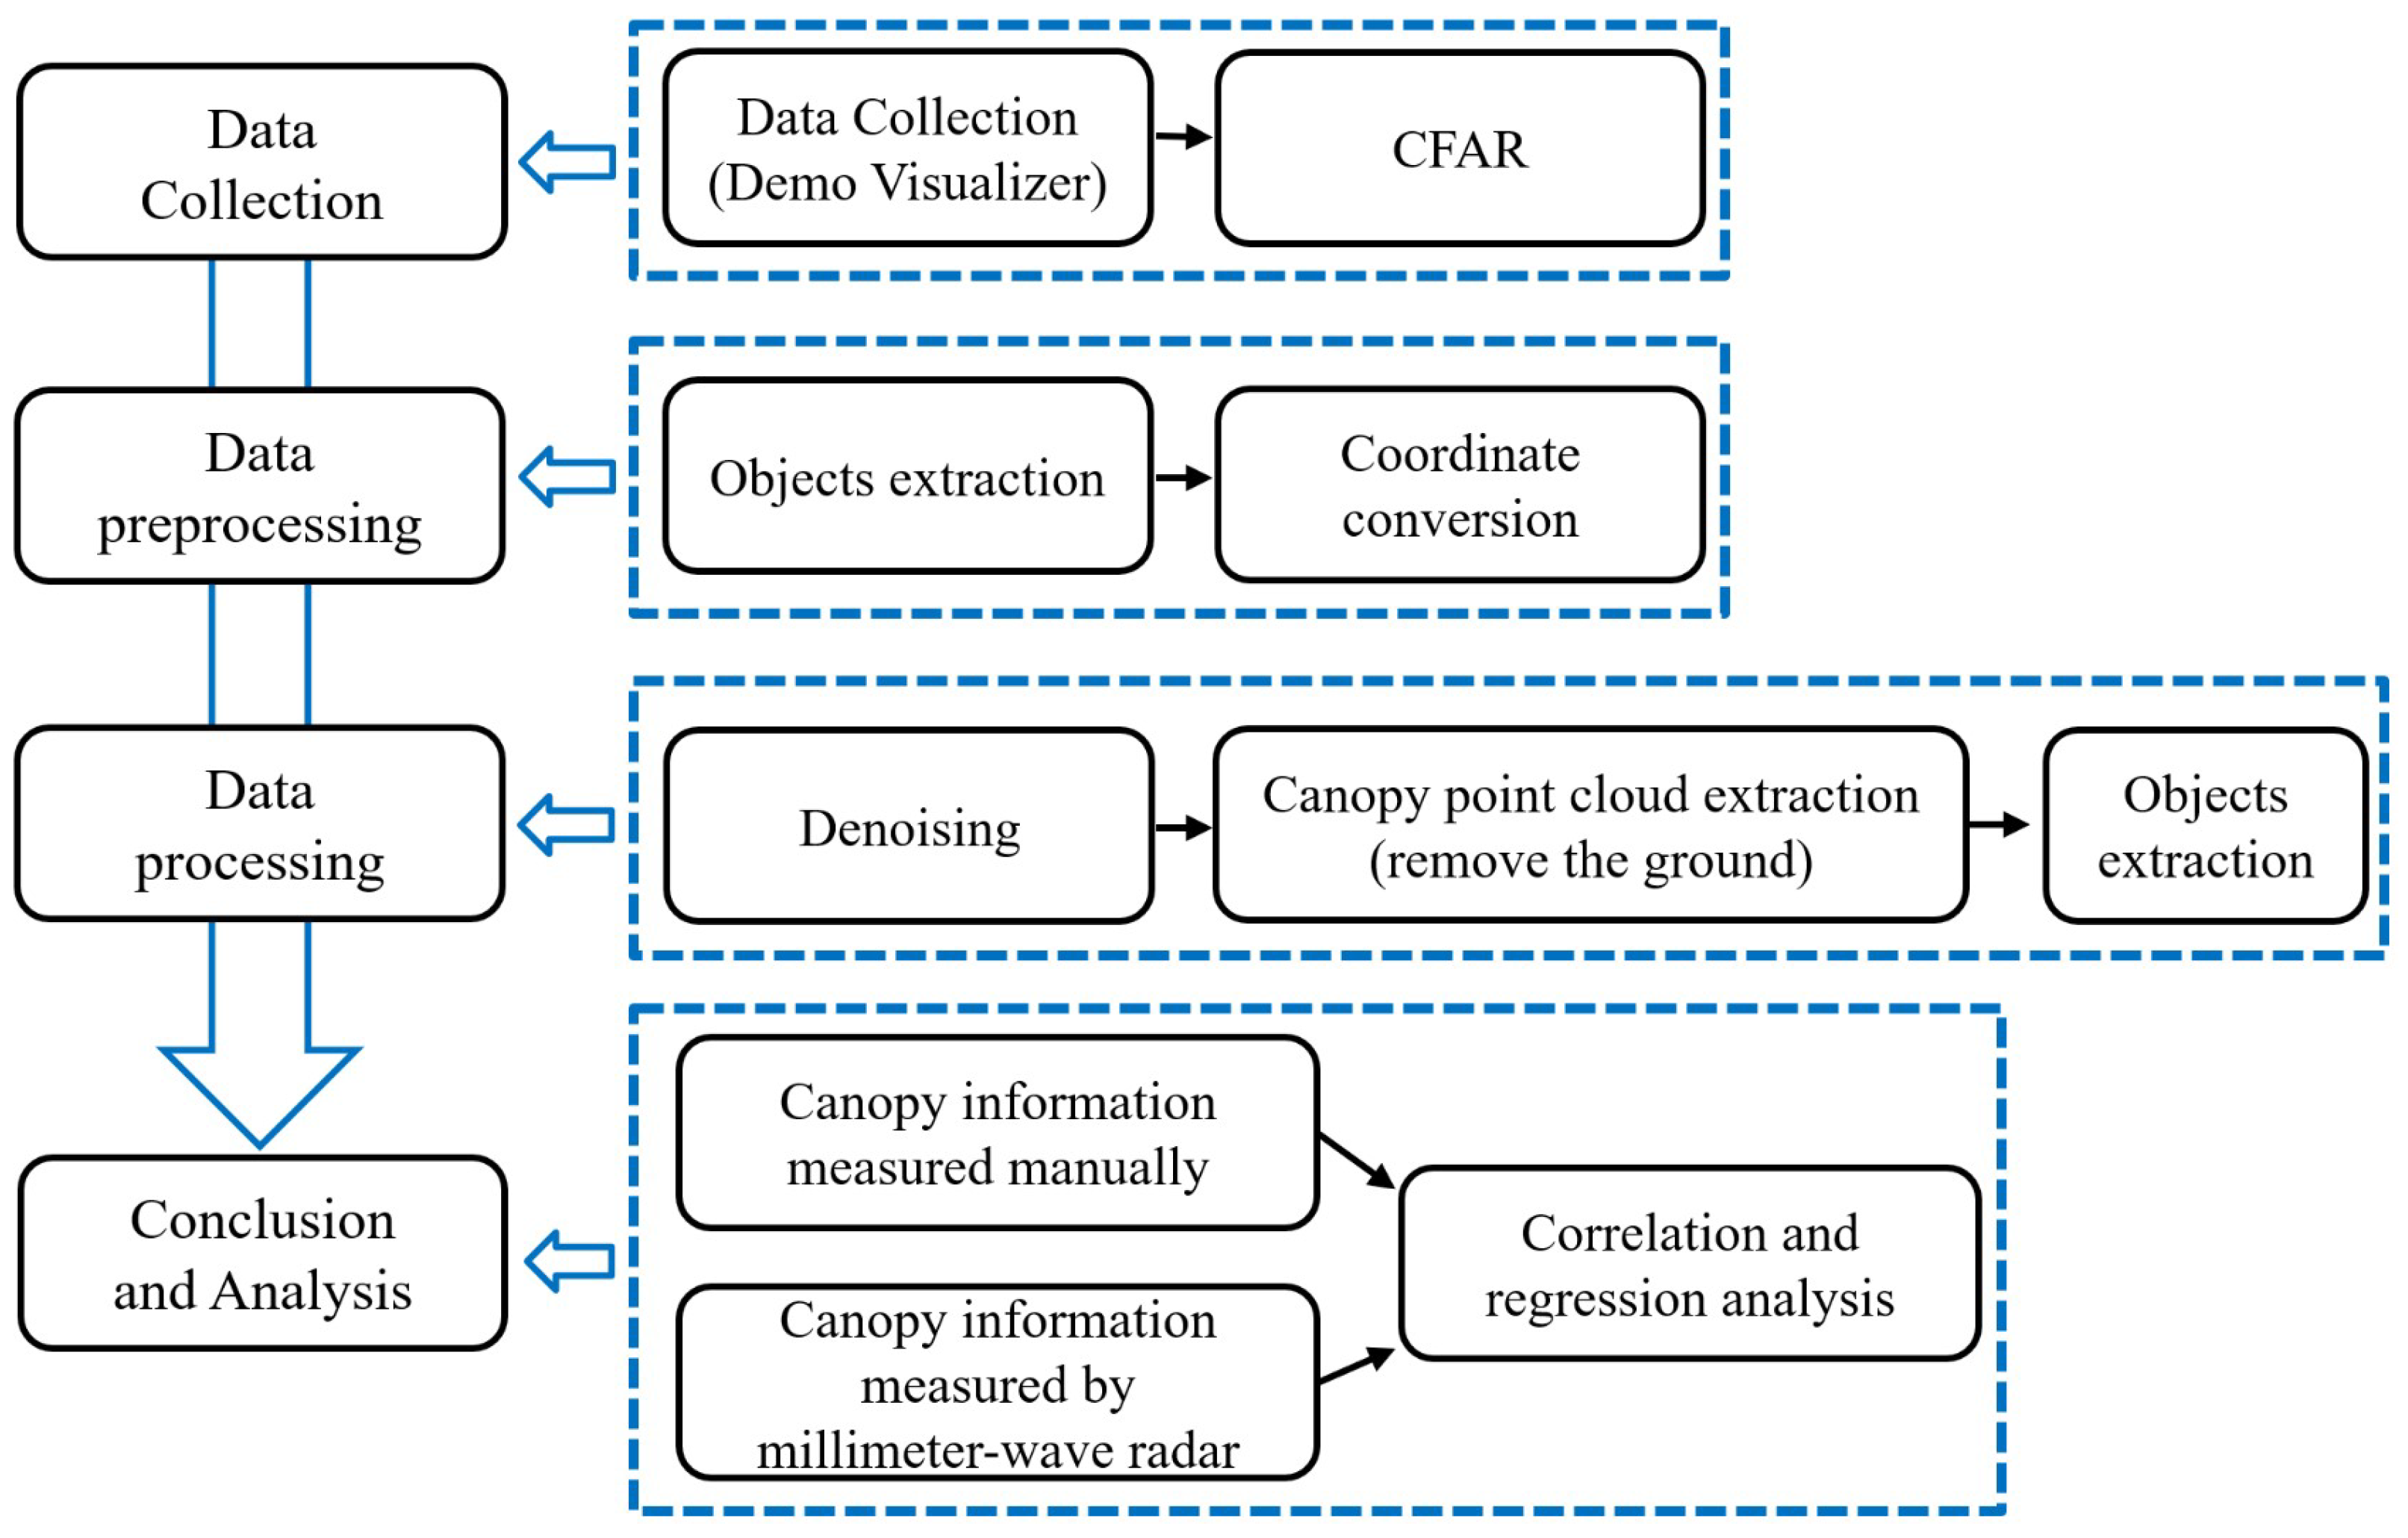
2.2. Data Processing
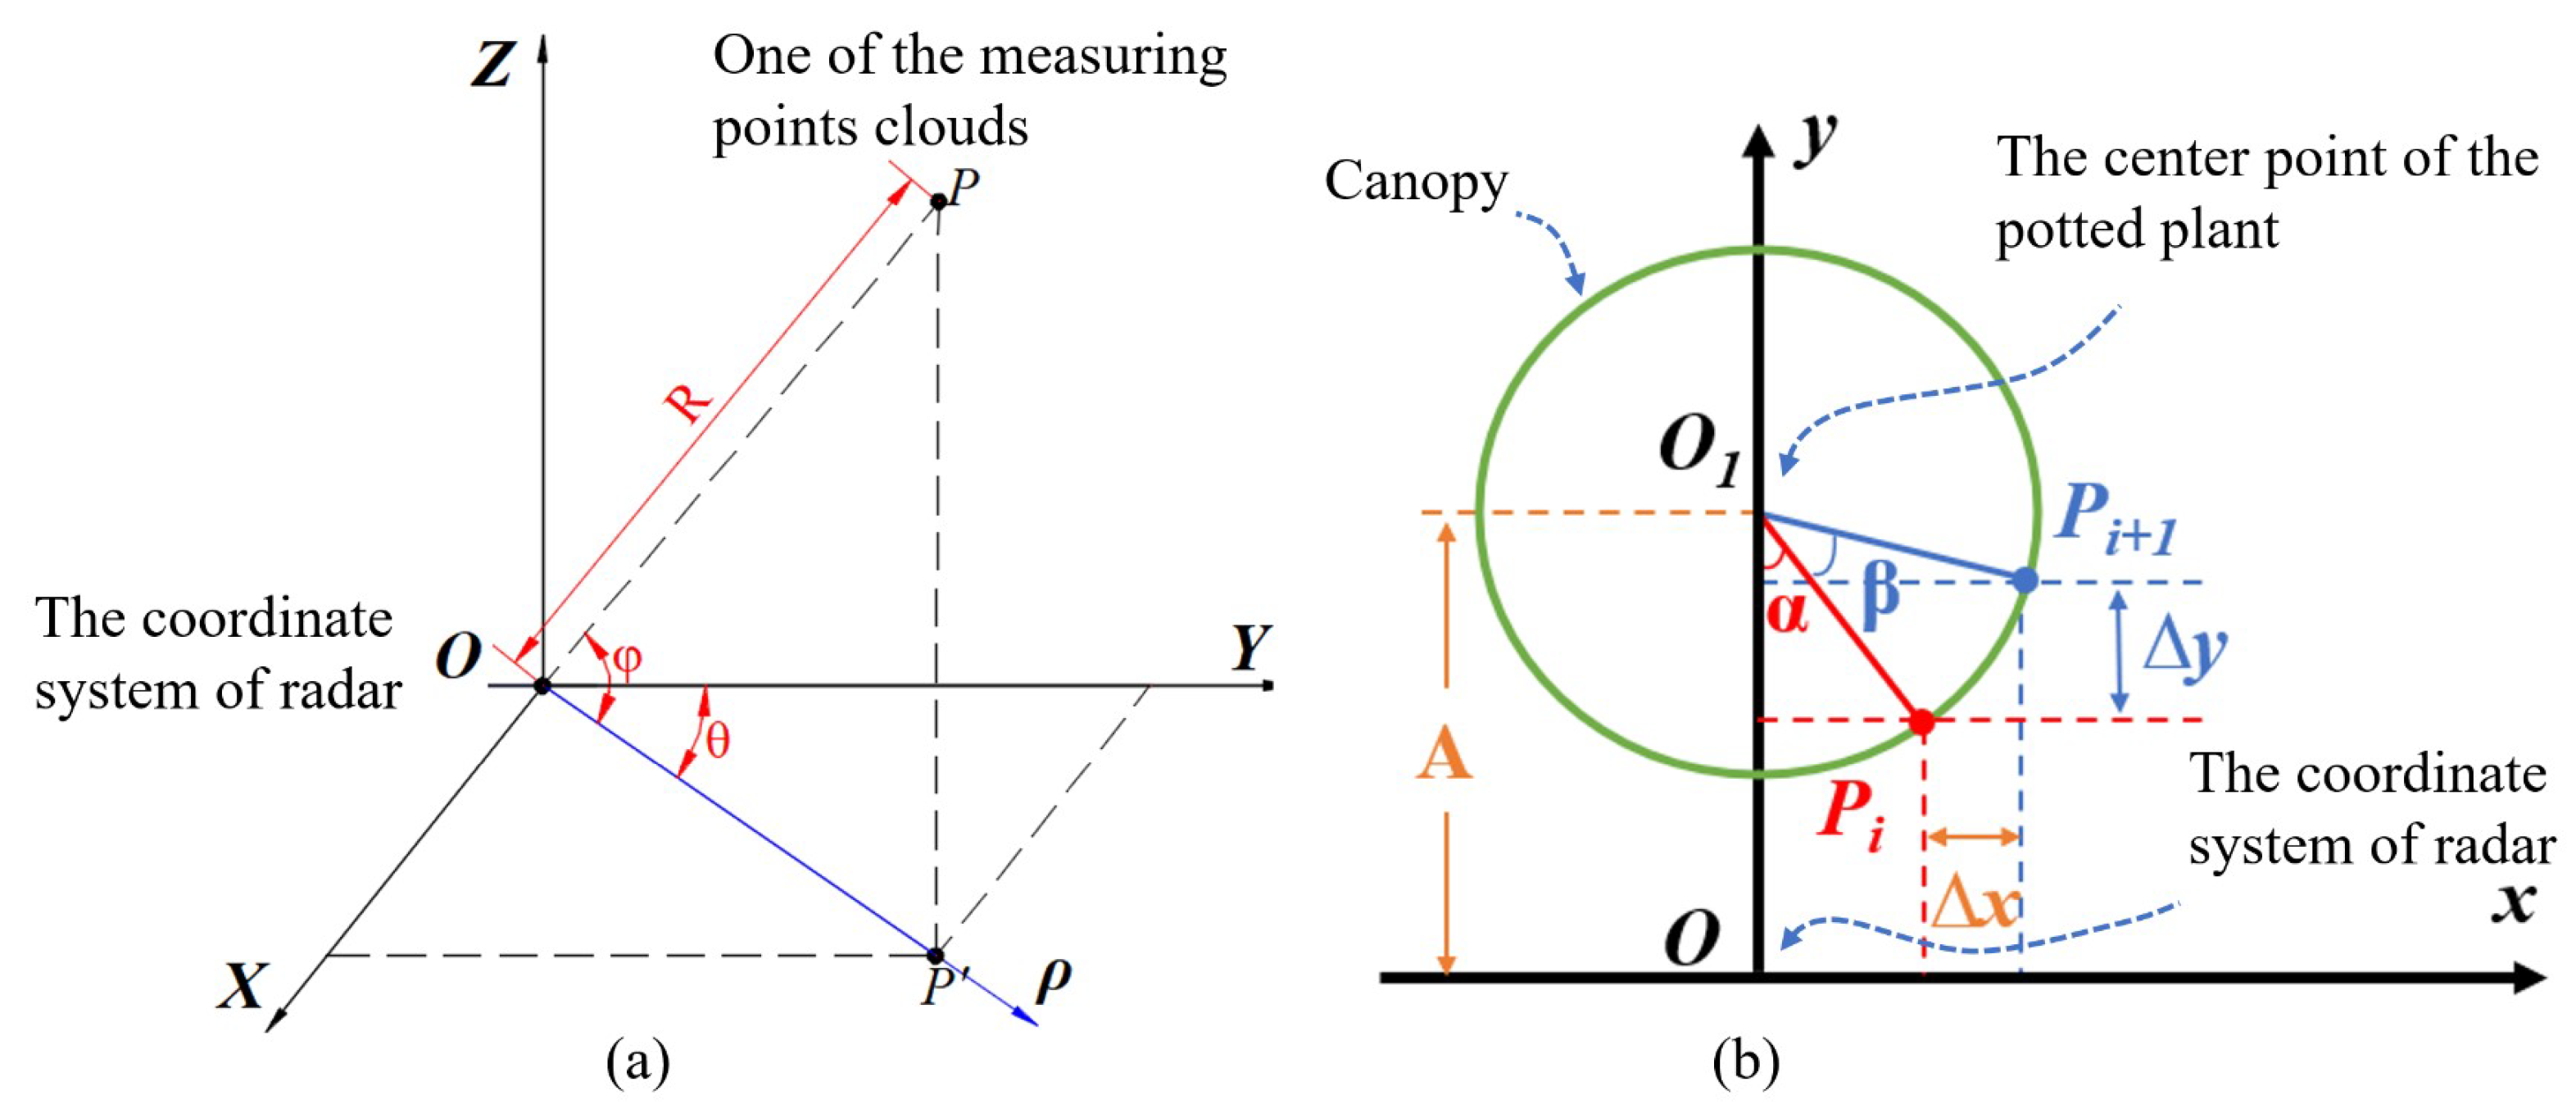
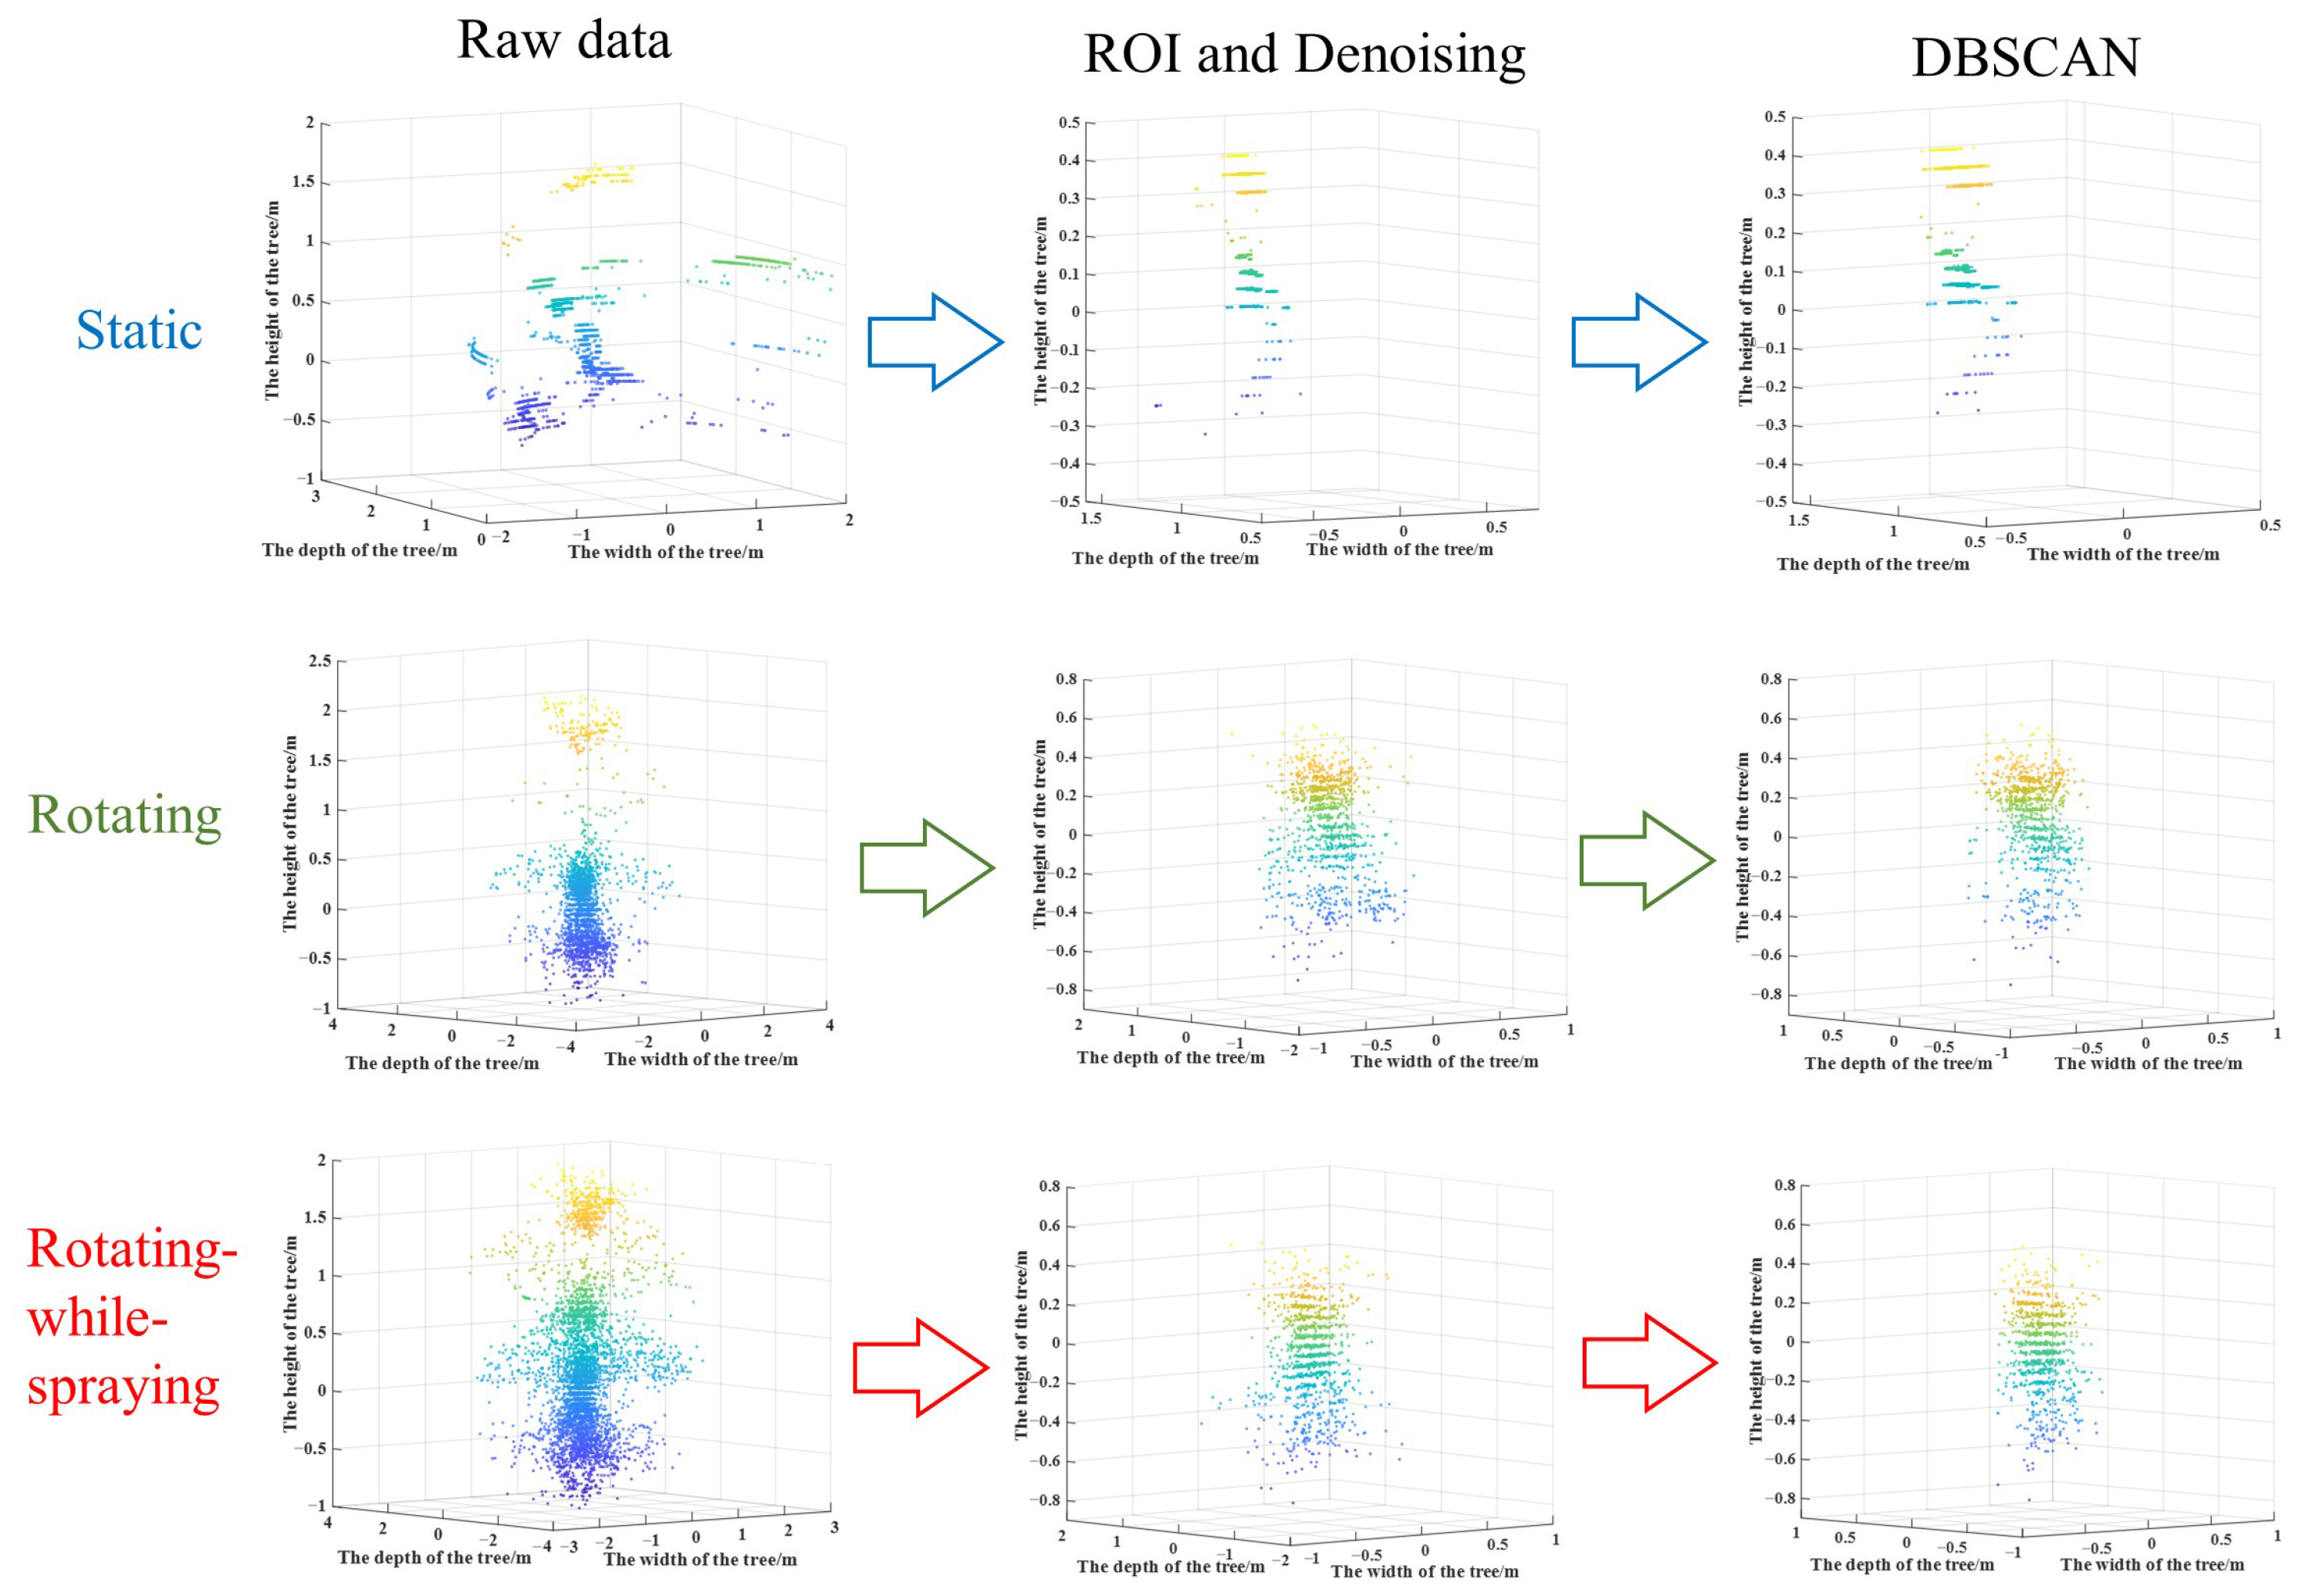
2.2.1. Point Cloud Data Preprocessing
2.2.2. Cluster Analysis
2.2.3. Calculation of Potted Plant Canopy Volume
3. Results and Discussion
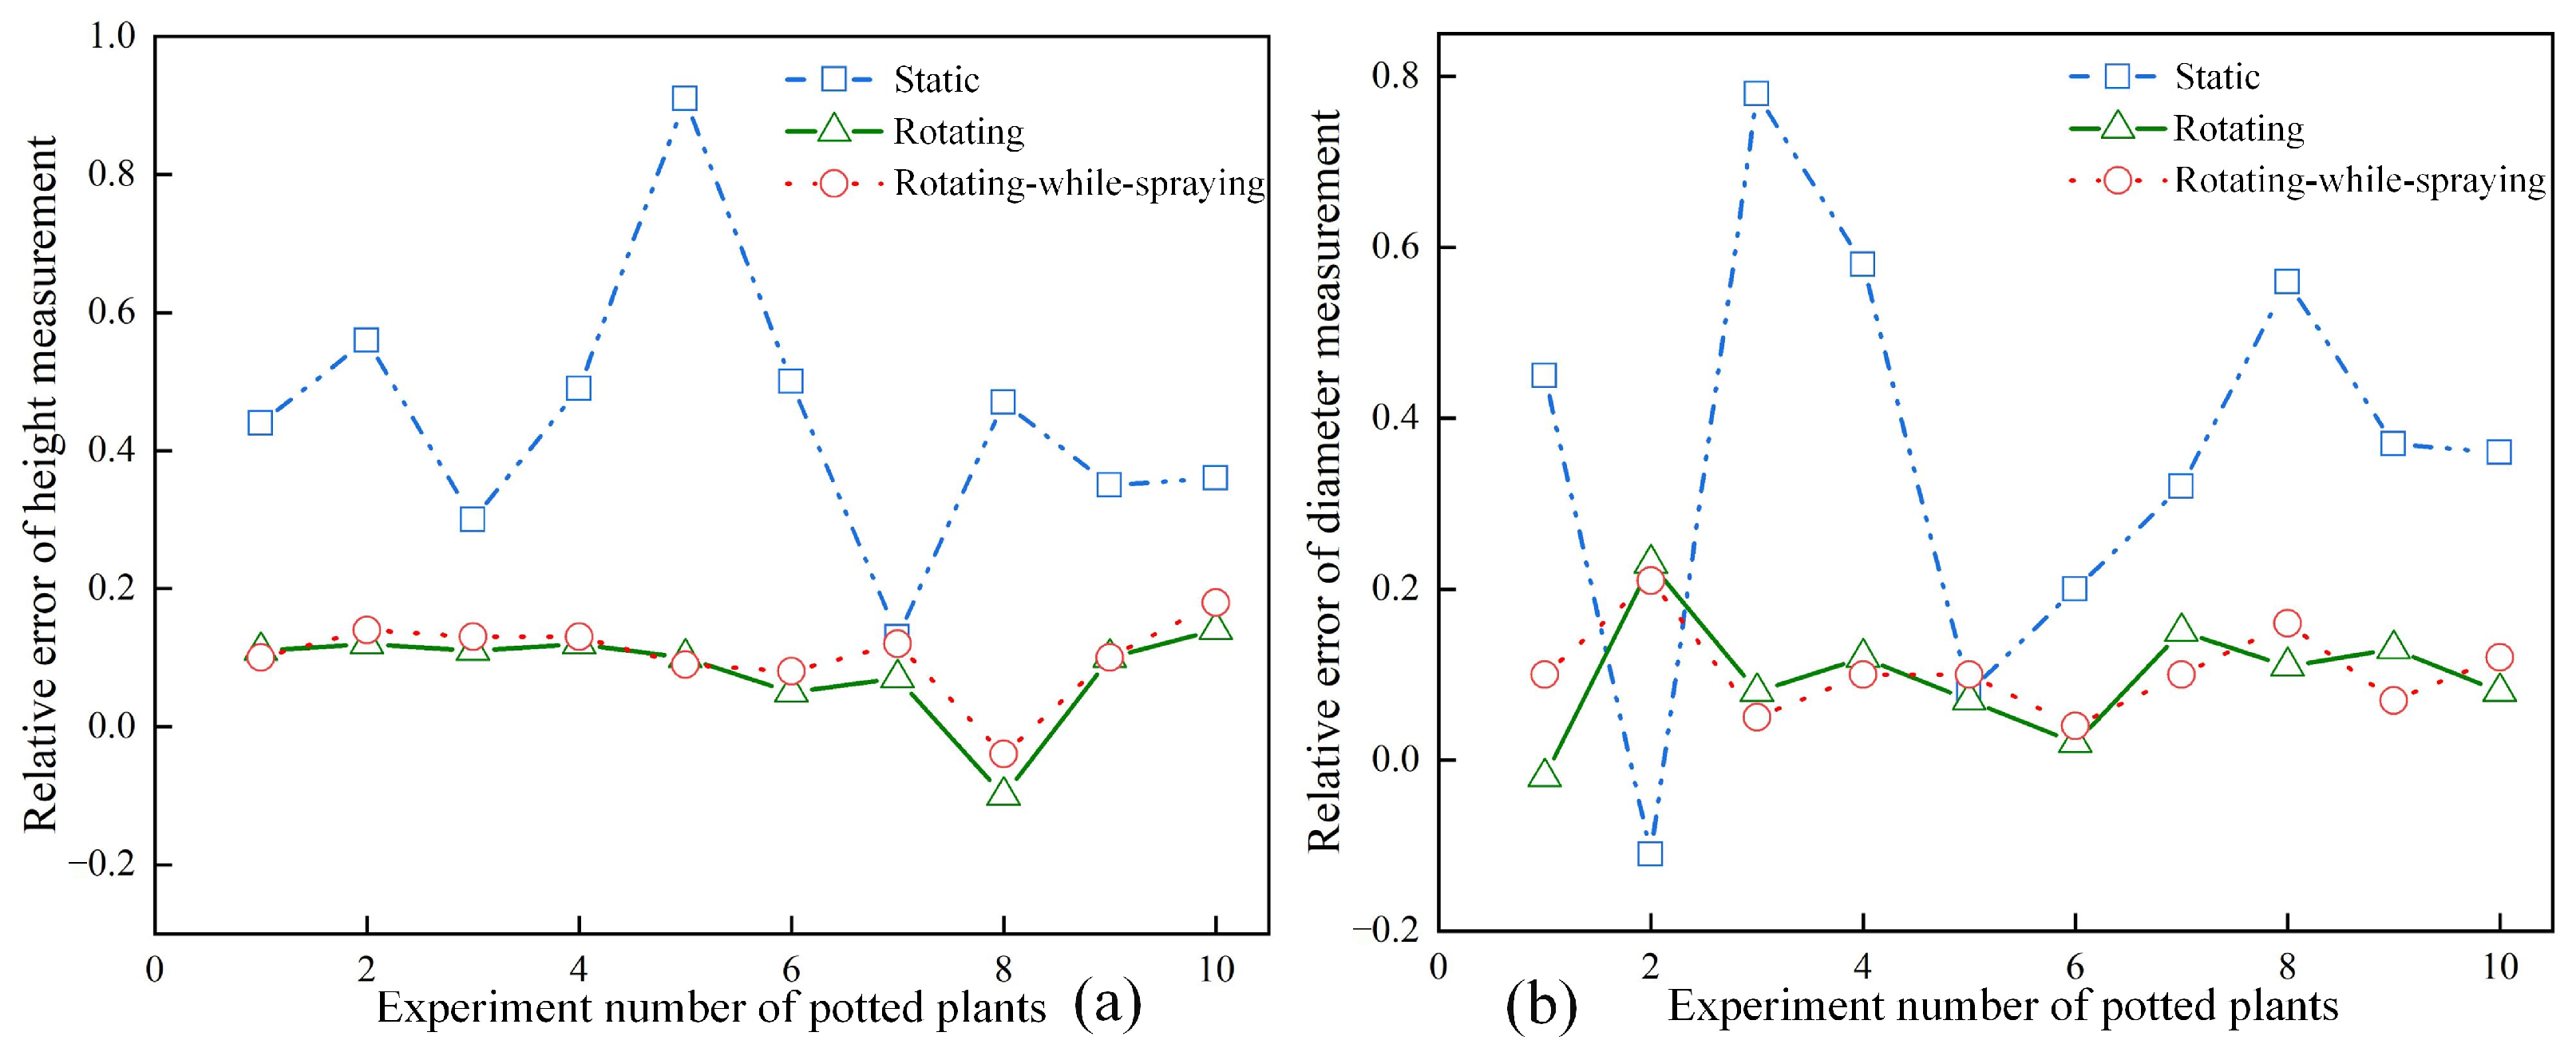
3.1. Canopy Identification Results for Potted Plants
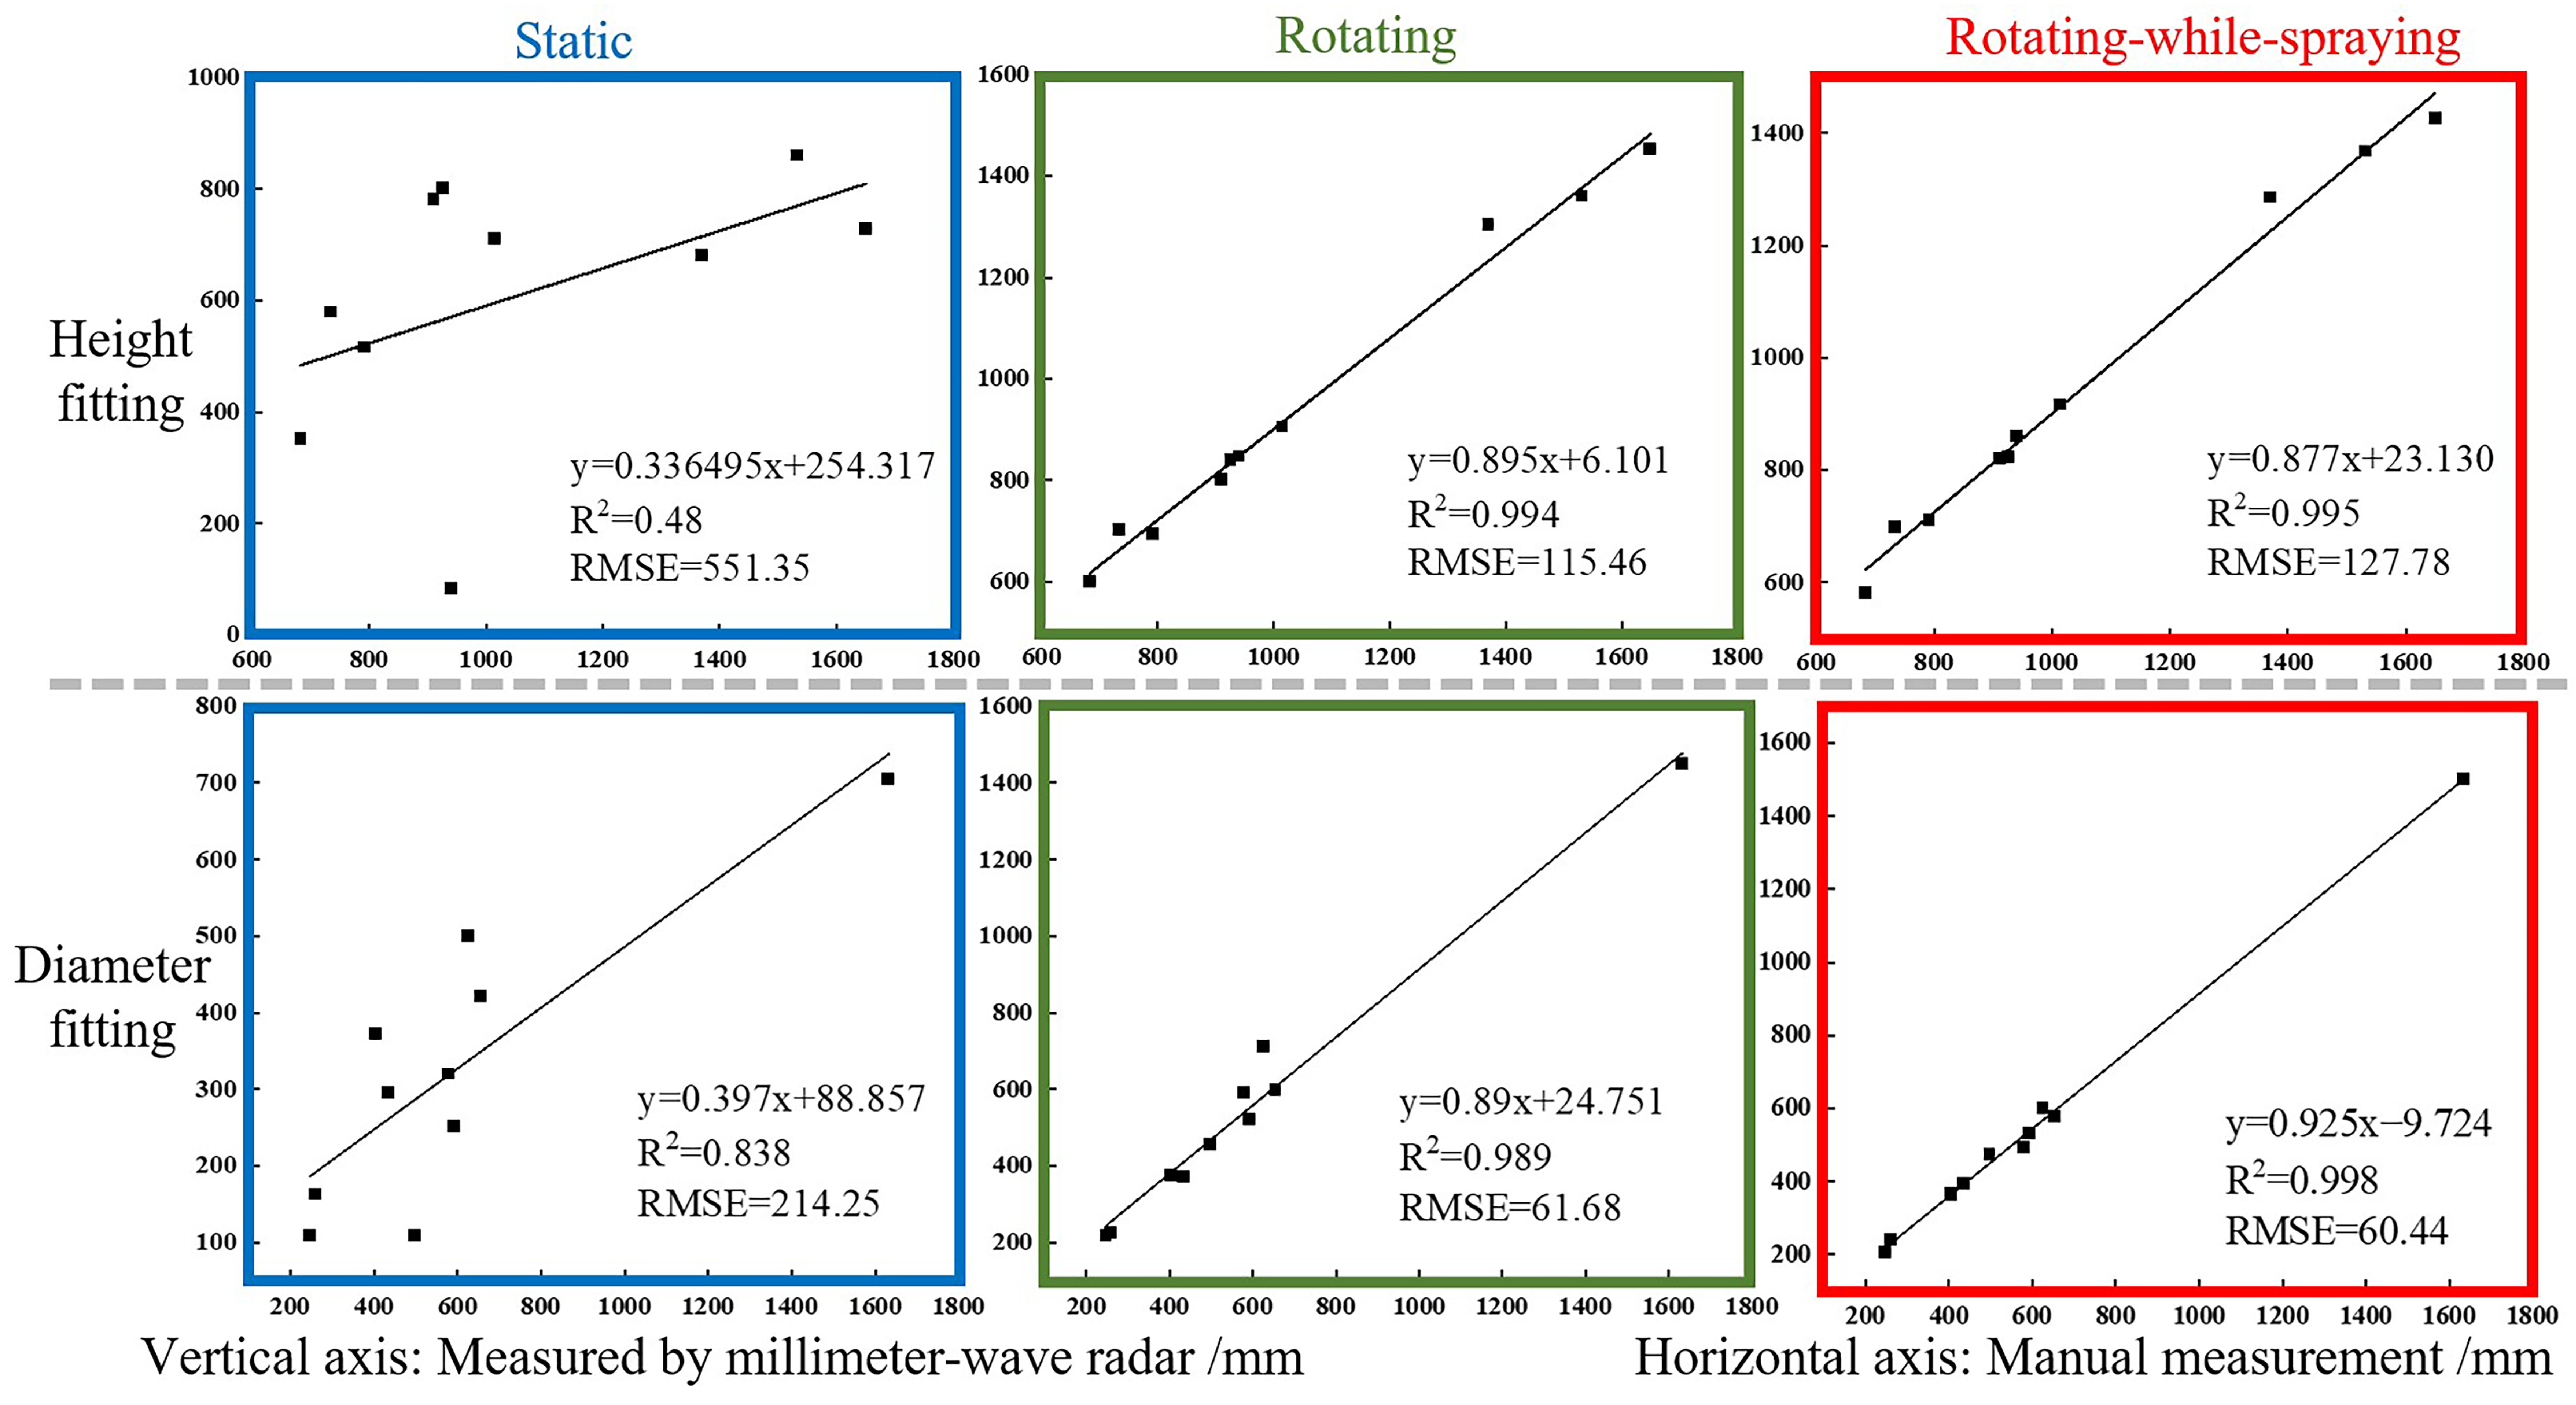
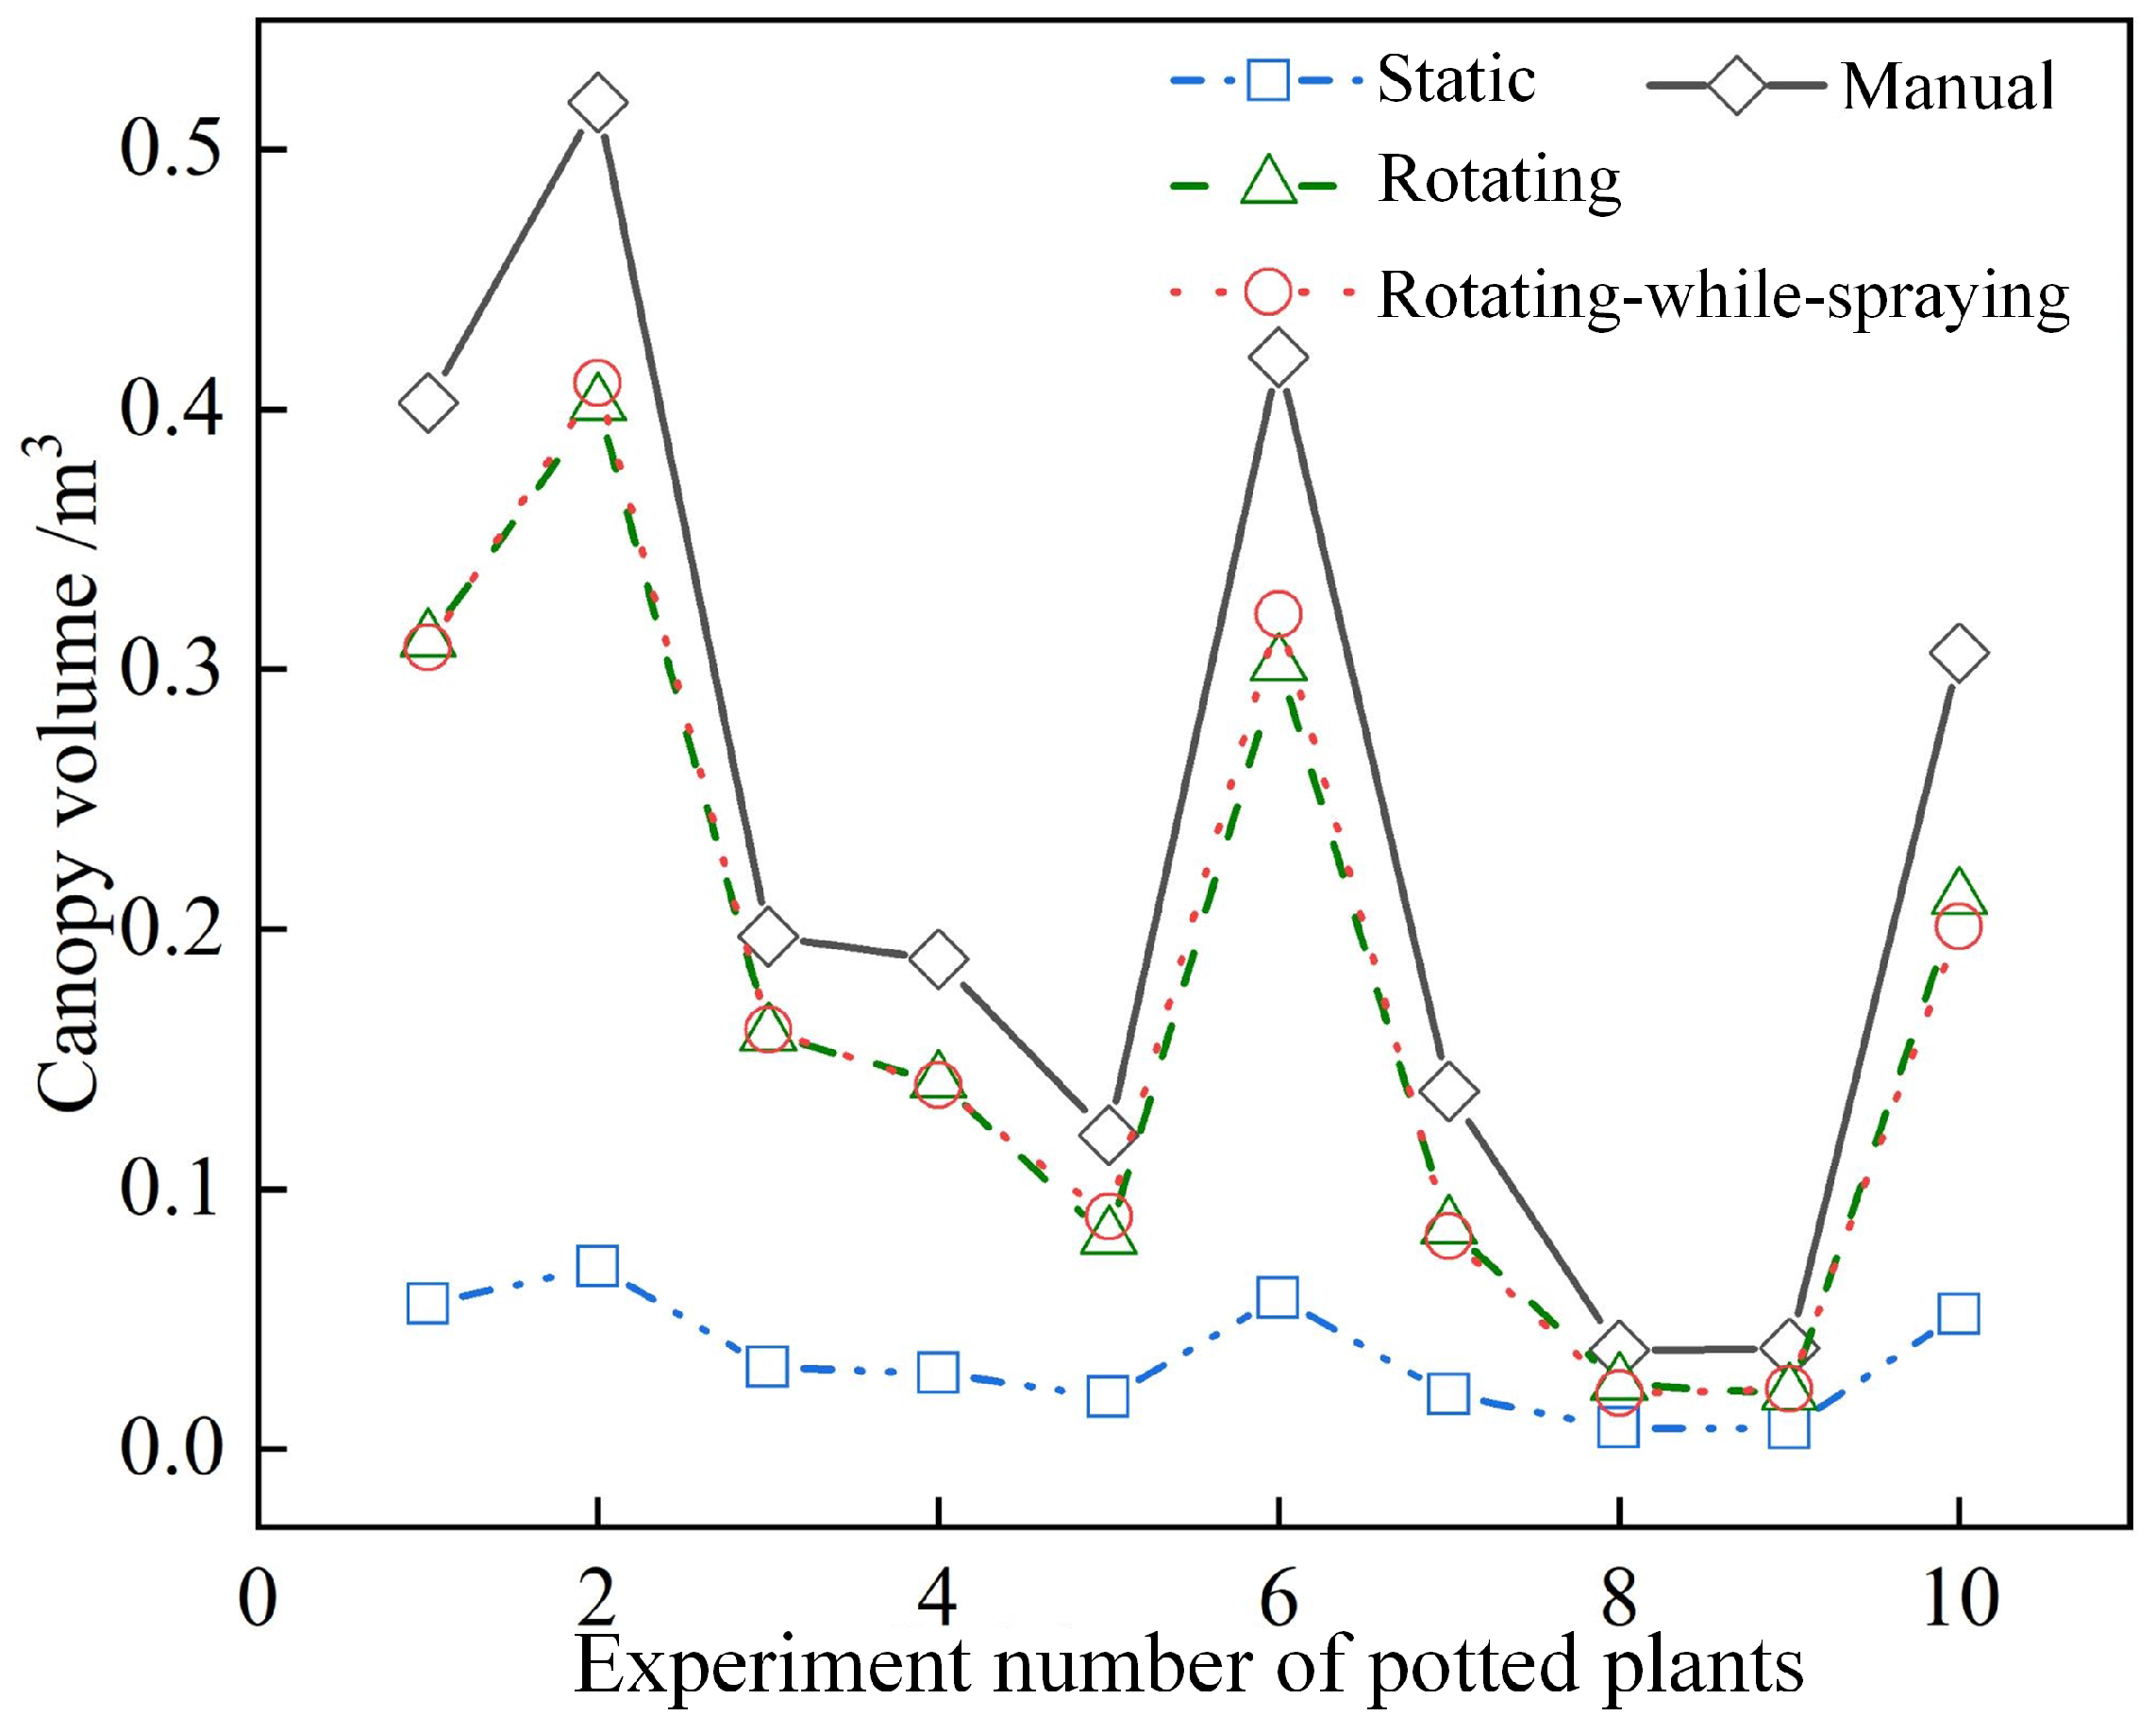
3.2. Three-Dimensional Reconstruction and Volume Calculation of Potted Plant Canopy
4. Conclusions
Author Contributions
Funding
Institutional Review Board Statement
Data Availability Statement
Conflicts of Interest
References
- Cheng, J.; Wang, Q.; Li, D.; Yu, J. Comparative Analysis of Environmental and Economic Performance of Agricultural Cooperatives and Smallholder Farmers for Apple Production in China. Agriculture 2022, 12, 1281. [Google Scholar] [CrossRef]
- Zhou, H.; Zhang, J.; Ge, L.; Yu, X.; Wang, Y.; Zhang, C. Research on volume prediction of single tree canopy based on three-dimensional (3D) LiDAR and clustering segmentation. Int. J. Remote Sens. 2021, 42, 738–755. [Google Scholar] [CrossRef]
- Zwertvaegher, I.; Foque, D.; Dekeyser, D.; Van Weyenberg, S.; Nuyttens, D. Comparison of spray configurations in a spray cabin design for ornamental potted plants: A proof-of-concept study. Trans. Asabe 2017, 60, 647–656. [Google Scholar] [CrossRef]
- Iost Filho, F.H.; Heldens, W.B.; Kong, Z.; de Lange, E.S. Drones: Innovative Technology for Use in Precision Pest Management. J. Econ. Entomol. 2020, 113, 1–25. [Google Scholar] [CrossRef]
- Gu, C.; Zhao, C.; Zou, W.; Yang, S.; Dou, H.; Zhai, C. Innovative Leaf Area Detection Models for Orchard Tree Thick Canopy Based on LiDAR Point Cloud Data. Agriculture 2022, 12, 1241. [Google Scholar] [CrossRef]
- Rajmis, S.; Karpinski, I.; Pohl, J.P.; Herrmann, M.; Kehlenbeck, H. Economic potential of site-specific pesticide application scenarios with direct injection and automatic application assistant in northern Germany. Precis. Agric. 2022, 23, 2063–2088. [Google Scholar] [CrossRef]
- Foque, D.; Nuyttens, D. Effect of air support and spray angle on coarse droplet sprays in ivy pot plants. Trans. Asabe 2011, 54, 409–416. [Google Scholar] [CrossRef]
- Campos, J.; Garcia-Ruiz, F.; Gil, E. Assessment of Vineyard Canopy Characteristics from Vigour Maps Obtained Using UAV and Satellite Imagery. Sensors 2021, 21, 2363. [Google Scholar] [CrossRef]
- Kim, T.; Kim, H.; Baik, K.; Choi, Y. Instance-Aware Plant Disease Detection by Utilizing Saliency Map and Self-Supervised Pre-Training. Agriculture 2022, 12, 1084. [Google Scholar] [CrossRef]
- Quan, P.; Lou, Y.; Lin, H.; Liang, Z.; Di, S. Research on Fast Identification and Location of Contour Features of Electric Vehicle Charging Port in Complex Scenes. IEEE Access 2022, 10, 26702–26714. [Google Scholar] [CrossRef]
- Berk, P.; Stajnko, D.; Belsak, A.; Hocevar, M. Digital evaluation of leaf area of an individual tree canopy in the apple orchard using the LIDAR measurement system. Comput. Electron. Agric. 2020, 169, 105158. [Google Scholar] [CrossRef]
- Debnath, S.; Paul, M.; Debnath, T. Applications of LiDAR in Agriculture and Future Research Directions. J. Imaging 2023, 9, 57. [Google Scholar] [CrossRef] [PubMed]
- Gomez Selvaraj, M.; Vergara, A.; Ruiz, H.; Safari, N.; Elayabalan, S.; Ocimati, W.; Blomme, G. AI-powered banana diseases and pest detection. Plant Methods 2019, 15, 92. [Google Scholar] [CrossRef]
- Espineira, J.P.; Robinson, J.; Groenewald, J.; Chan, P.H.; Donzella, V. Realistic LiDAR With Noise Model for Real-Time Testing of Automated Vehicles in a Virtual Environment. IEEE Sens. J. 2021, 21, 9919–9926. [Google Scholar] [CrossRef]
- Golovachev, Y.; Etinger, A.; Pinhasi, G.A.; Pinhasi, Y. Millimeter Wave High Resolution Radar Accuracy in Fog Conditions-Theory and Experimental Verification. Sensors 2018, 18, 2148. [Google Scholar] [CrossRef]
- Huang, J.T.; Lu, C.L.; Chang, P.K.; Huang, I.C.; Hsu, C.C.; Ewe, Z.L.; Huang, P.J.; Wang, H.C. Cross-Modal Contrastive Learning of Representations for Navigation Using Lightweight, Low-Cost Millimeter Wave Radar for Adverse Environmental Conditions. IEEE Robot. Autom. Lett. 2021, 6, 3333–3340. [Google Scholar] [CrossRef]
- Rouveure, R.; Faure, P.; Monod, M.O. PELICAN: Panoramic millimeter-wave radar for perception in mobile robotics applications, Part 1: Principles of FMCW radar and of 2D image construction. Robot. Auton. Syst. 2016, 81, 1–16. [Google Scholar] [CrossRef]
- Liu, W.; Wang, C.; Yan, D.; Chen, W.; Luo, L. Estimation of Characteristic Parameters of Grape Clusters Based on Point Cloud Data. Front. Plant Sci. 2022, 13, 885167. [Google Scholar] [CrossRef]
- Smithson, M.; Ooi, M.P.L.; Gris, L.; Kuang, Y.C.; Manley-Harris, M.; Lim, S.H. Investigating the Use of Low-cost and Low-power Millimeter Wave RADAR to Improve Quality of Tomato Harvesting. In Proceedings of the 2021 IEEE International Instrumentation and Measurement Technology Conference (I2MTC), Glasgow, UK, 17–20 May 2021; pp. 1–6. [Google Scholar] [CrossRef]
- Nashashibi, A.; Ulaby, F.; Frantzis, P.; De Roo, R. Measurements of the propagation parameters of tree canopies at MMW frequencies. IEEE Trans. Geosci. Remote Sens. 2002, 40, 298–304. [Google Scholar] [CrossRef]
- Li, Y.; Liu, Y.; Wang, Y.; Lin, Y.; Shen, W. The Millimeter-Wave Radar SLAM Assisted by the RCS Feature of the Target and IMU. Sensors 2020, 20, 5421. [Google Scholar] [CrossRef]
- Solatzadeh, Z.; Zaimbashi, A. Accelerating Target Detection in Passive Radar Sensors: Delay-Doppler-Acceleration Estimation. IEEE Sens. J. 2018, 18, 5445–5454. [Google Scholar] [CrossRef]
- Zhang, X.; Liang, J.; Wang, N.; Chang, T.; Guo, Q.; Cui, H.L. Broadband Millimeter-Wave Imaging Radar-Based 3-D Holographic Reconstruction for Nondestructive Testing. IEEE Trans. Microw. Theory Tech. 2020, 68, 1074–1085. [Google Scholar] [CrossRef]
- Luchi, D.; Rodrigues, A.L.; Varejao, F.M. Sampling approaches for applying DBSCAN to large datasets. Pattern Recognit. Lett. 2019, 117, 90–96. [Google Scholar] [CrossRef]
- Chen, Y.; Zhou, L.; Bouguila, N.; Wang, C.; Chen, Y.; Du, J. BLOCK-DBSCAN: Fast clustering for large scale data. Pattern Recognit. 2021, 109, 107624. [Google Scholar] [CrossRef]
- Todo, C.; Ikeno, H.; Yamase, K.; Tanikawa, T.; Ohashi, M.; Dannoura, M.; Kimura, T.; Hirano, Y. Reconstruction of Conifer Root Systems Mapped with Point Cloud Data Obtained by 3D Laser Scanning Compared with Manual Measurement. Forests 2021, 12, 1117. [Google Scholar] [CrossRef]
- Wu, S.; Wen, W.; Xiao, B.; Guo, X.; Du, J.; Wang, C.; Wang, Y. An Accurate Skeleton Extraction Approach From 3D Point Clouds of Maize Plants. Front. Plant Sci. 2019, 10, 248. [Google Scholar] [CrossRef]
- Wang, M.; Dou, H.; Sun, H.; Zhai, C.; Zhang, Y.; Yuan, F. Calculation Method of Canopy Dynamic Meshing Division Volumes for Precision Pesticide Application in Orchards Based on LiDAR. Agronomy 2023, 13, 1077. [Google Scholar] [CrossRef]
- Zhu, T.; Ma, X.; Guan, H.; Wu, X.; Wang, F.; Yang, C.; Jiang, Q. A calculation method of phenotypic traits based on three-dimensional reconstruction of tomato canopy. Comput. Electron. Agric. 2023, 204, 107515. [Google Scholar] [CrossRef]


| Parameter | Value |
|---|---|
| Operational frequency band/GHz | 77–81 |
| Refresh rate/Hz | 10 |
| Horizontal beam width/° | ±60 |
| Vertical beam width/° | ±25 |
| Measuring range/m | <9 |
| Range resolution/cm | 4 |
| Horizontal angle resolution/° | 15 |
| Range accuracy/cm | ±2 |
| Horizontal measurement accuracy/° | ±1 |
| Vertical measurement accuracy/° | ±2 |
| State | ||||
|---|---|---|---|---|
| Static | 0.48 | 551.35 | 0.838 | 214.25 |
| Rotating | 0.994 | 115.46 | 0.989 | 61.68 |
| Rotating and Spring | 0.995 | 127.78 | 0.998 | 60.44 |
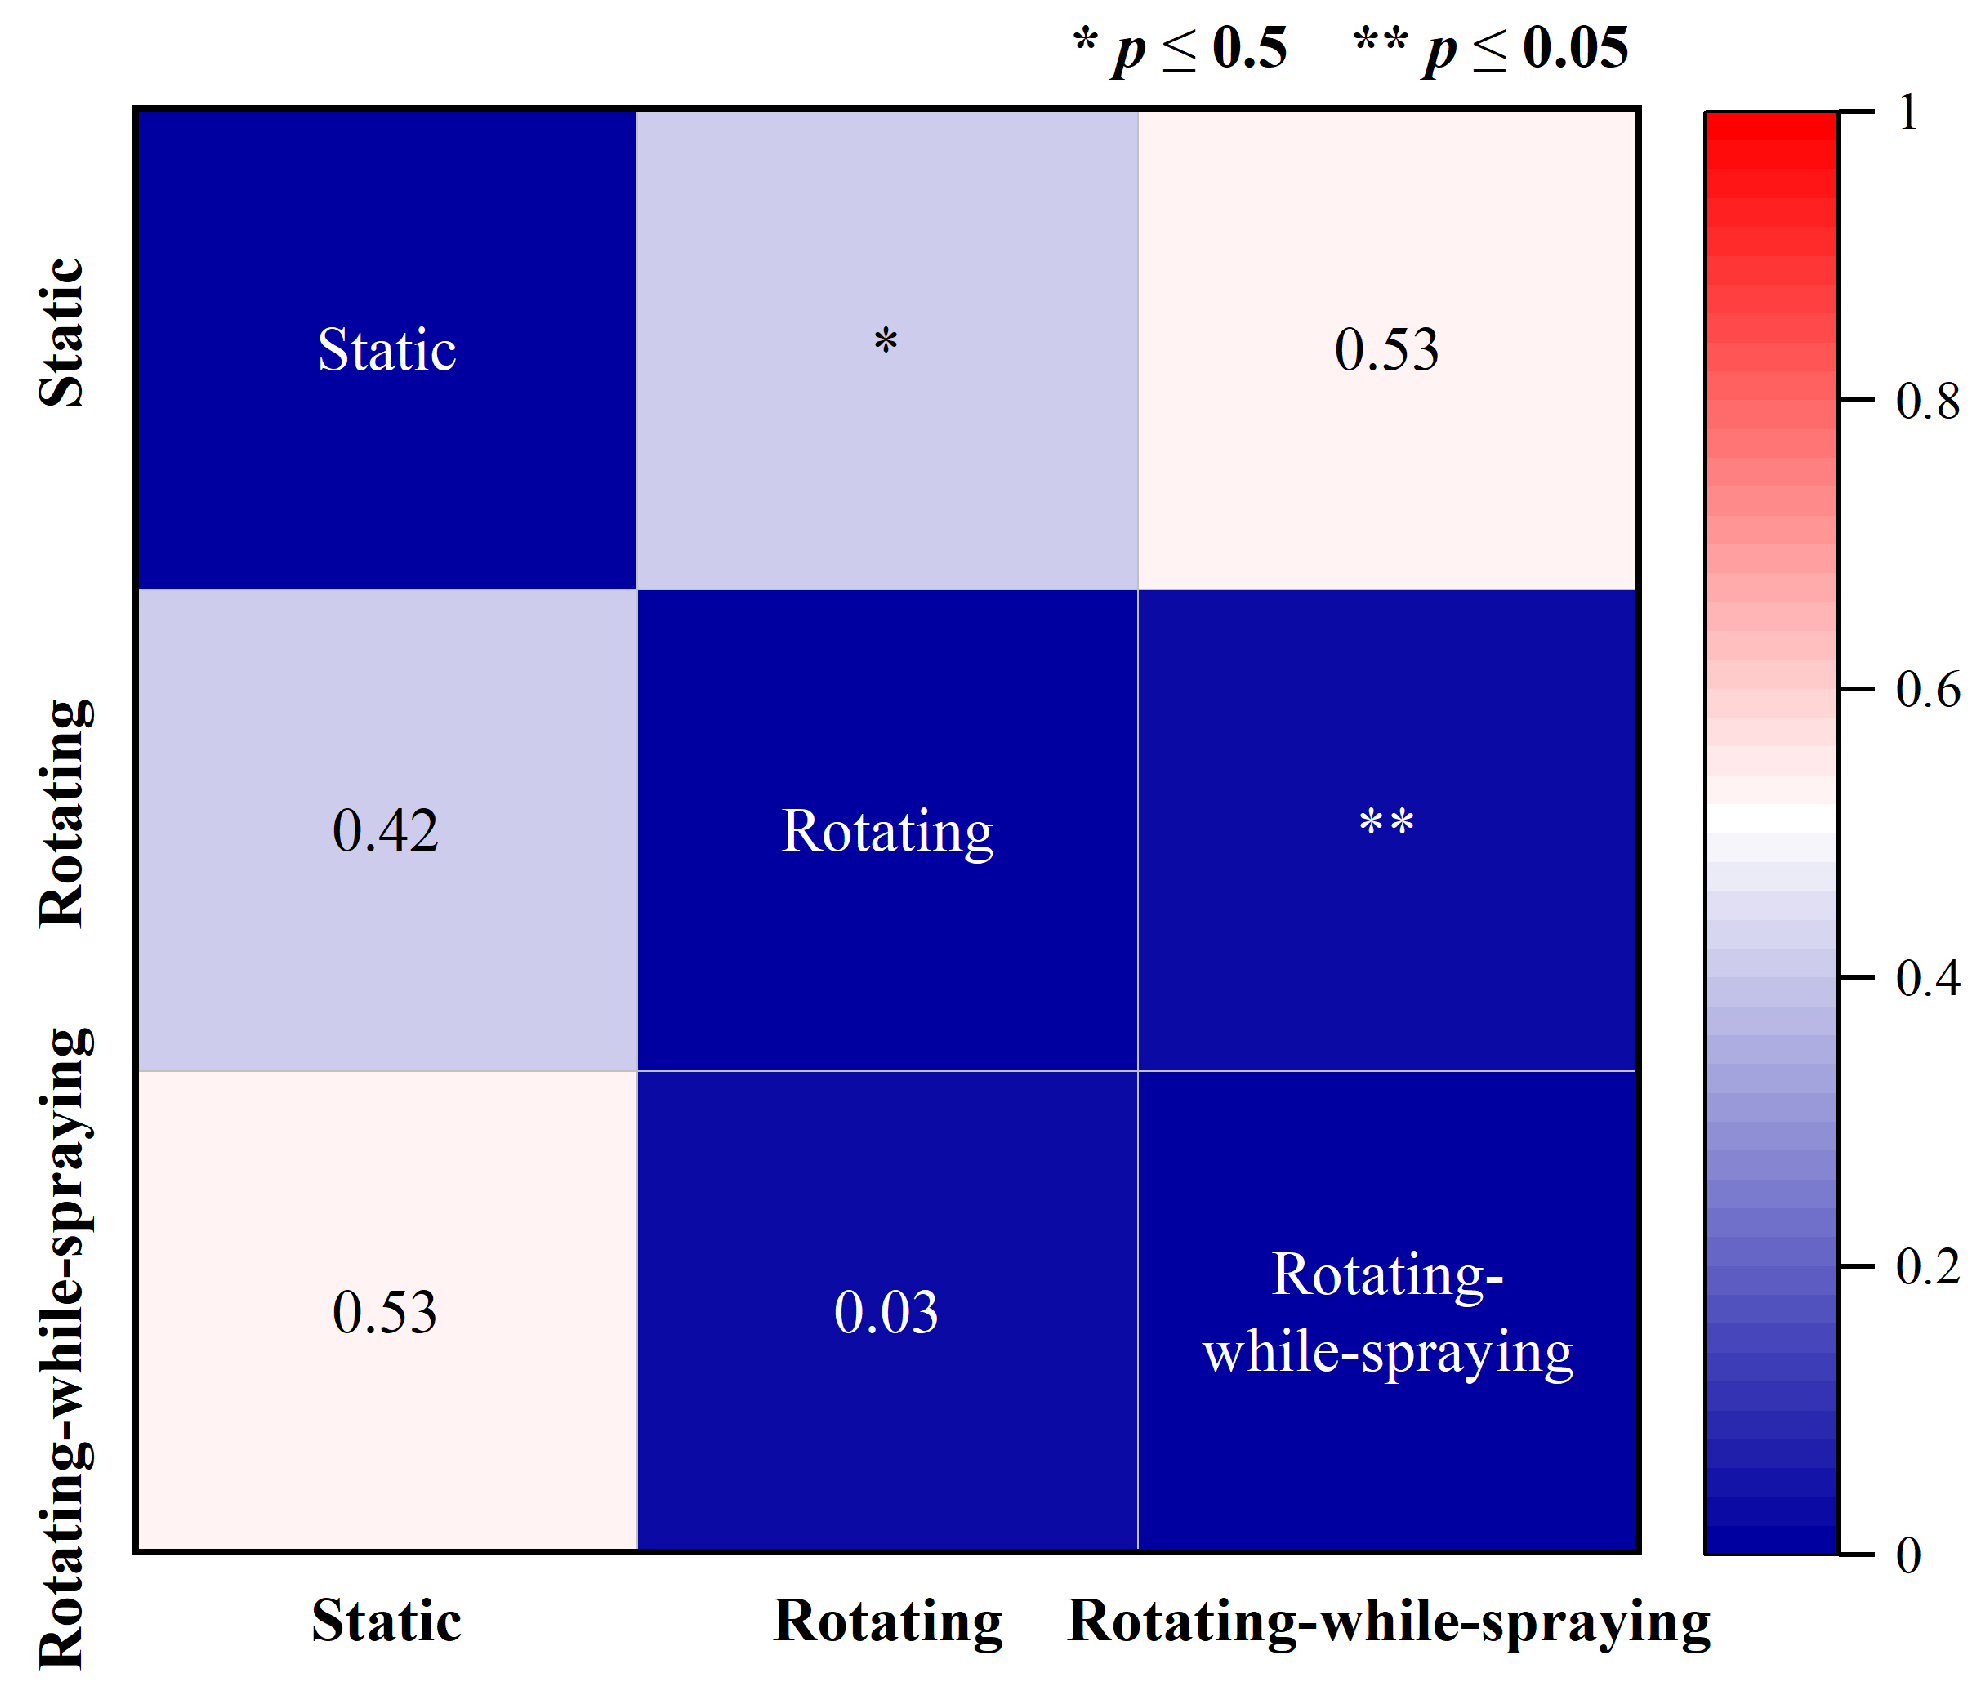
| Alpha | ||
|---|---|---|
| 0.1 | 0.48 | 0.84 |
| 0.3 | 0.75 | 0.92 |
| 0.6 | 0.99 | 0.98 |
| 1 | 0.89 | 0.91 |
Disclaimer/Publisher’s Note: The statements, opinions and data contained in all publications are solely those of the individual author(s) and contributor(s) and not of MDPI and/or the editor(s). MDPI and/or the editor(s) disclaim responsibility for any injury to people or property resulting from any ideas, methods, instructions or products referred to in the content. |
© 2023 by the authors. Licensee MDPI, Basel, Switzerland. This article is an open access article distributed under the terms and conditions of the Creative Commons Attribution (CC BY) license (https://creativecommons.org/licenses/by/4.0/).
Share and Cite
Zhang, Z.; Huang, C.; Xu, X.; Ma, L.; Yang, Z.; Duan, J. Three-Dimensional Structure Measurement for Potted Plant Based on Millimeter-Wave Radar. Agriculture 2023, 13, 2089. https://doi.org/10.3390/agriculture13112089
Zhang Z, Huang C, Xu X, Ma L, Yang Z, Duan J. Three-Dimensional Structure Measurement for Potted Plant Based on Millimeter-Wave Radar. Agriculture. 2023; 13(11):2089. https://doi.org/10.3390/agriculture13112089
Chicago/Turabian StyleZhang, Zhihong, Chaowei Huang, Xing Xu, Lizhe Ma, Zhou Yang, and Jieli Duan. 2023. "Three-Dimensional Structure Measurement for Potted Plant Based on Millimeter-Wave Radar" Agriculture 13, no. 11: 2089. https://doi.org/10.3390/agriculture13112089