Abstract
The aim of this research was to assess the influence of partially substituting post-extraction soybean meal with distillers dried yeast on the efficiency of broiler chicken fattening and the intestinal microflora.I Inactive distillers dried yeast Saccharomyces cerevisiae, cultivated on wheat extract, was employed in the study. The research was conducted on 112 Ross 308 line cockerels subjected to a 35-day fattening period, during which they were fed Starter (days 1–10), Grower (days 11–27), and Finisher (days 28–35) diets. Broiler chickens were randomly divided into four groups: control and three experimental groups with varying levels of distillers dried yeast—3%, 6%, and 9%. Cockerels in the control group (Starter diet) exhibited higher feed consumption compared to those receiving 3% yeast in their diet. Cockerels in the group receiving 3% yeast (Grower diet) demonstrated better feed conversion compared to those receiving 9% yeast in their diet. The study revealed that regardless of the broiler chicken fattening period, there was a decrease in the overall number of isolated microorganisms in the feces with an increase in the proportion of distillers dried yeast in the diet. This was confirmed by the total number of bacteria, anaerobic bacteria, Enterobacteriaceae, E. coli, Enterococcus sp., and S. aureus. Based on cluster analysis (dendrogram), it was observed that only a 9% addition of yeast to the diet significantly influenced the quantitative and qualitative composition of the fecal microbiota of broiler chickens. In summary, a properly balanced feed with distillery yeast can be used as a good source of energy and protein in feed mixtures for broilers, serving as a cost-effective alternative to soybean meal. However, for optimal production results and feed costs, the inclusion of yeast in the feed should not exceed 3%.
1. Introduction
Antibiotics have been used in poultry for several decades to protect birds from pathogenic microorganisms while simultaneously improving production outcomes [1,2]. This improvement manifests as enhanced appetite and feed utilization efficiency, stimulation of the immune system, increased vitality, and regulation of gut microbiota primarily by combating bacterial infections [3]. However, this practice is associated with the development of bacterial resistance and the associated threat to public health [4], as well as residues in animal-derived products and environmental contamination [5]. Consequently, many countries have banned the use of antibiotics as growth promoters. However, this has not changed the fact that the use of therapeutic antibiotics remains high. According to the European Medicines Agency’s report [6], in 31 European countries, the consumption of antimicrobial drugs in veterinary medicine amounted to 5219.6 tons. This was in consideration of a total animal mass of 61,825,100 tons, resulting in 84.4 mg of active substance per population correction unit (PCU). In light of the above, efforts are being made to find a solution to reduce or eliminate the use of antimicrobial agents, including antibiotics.
The rising costs of conventional feeds, which account for 65–75% of production costs, necessitate intensive research into the utilization of alternative, cost-effective feed sources without compromising their nutritional value [7,8]. Additionally, in some countries, there is strong pressure to limit or even prohibit the use of genetically modified components (GMO) in animal feeds, especially in the case of the widely used high-protein soybean meal, which may contribute to increased feed production costs [9].
Research indicates that the reduction in the use of antimicrobial agents and the cost of high-protein feeds in animal nutrition, including broiler chickens, can be achieved by the utilization of feed yeast [10,11]. Yeasts, primarily Saccharomyces cerevisiae, are considered potential feed additives with probiotic (for live, active cells) and prebiotic (for dead, inactive cells) properties that have a beneficial impact on health, improving feed utilization and digestibility, thus enhancing production outcomes [12,13] and reducing the adverse environmental effects of animal production [14]. It has been demonstrated that mannans and β-glucans present in yeast cell walls can bind and block enteropathogens, potentially enhancing nutrient utilization and stimulating the growth of beneficial gut microorganisms while reducing colonization by pathogenic bacteria [15,16]. European countries and the United States Food and Drug Administration have recognized Saccharomyces cerevisiae as a safe feed additive for animals, and it has been listed as Generally Recognized As Safe (GRAS) [10]. It is worth noting that yeast is resistant to antibiotics like sulfonamides, which increases their survivability in the host’s gastrointestinal tract [17].
Previous studies provide no unequivocal results regarding the use of feed yeast supplementation in broiler chicken nutrition. The discrepancies can be attributed to the application of different types and doses of yeast, the timing of their administration, the use of live or dead yeast cells, and variations in feed formulations [14]. Another limiting factor in the use of feed yeast in animal nutrition is the presence of nucleic acids in yeast [15]. However, in the majority of available research, a favorable influence of yeast on the gastrointestinal microbiome has been observed, characterized by a higher count of LAB (lactic acid bacteria) and lower levels of E. coli, as well as improved production outcomes in broiler chickens and reduced mortality rates [18,19,20,21].
The aim of this study was to determine the impact of different proportions of distillers yeast on production outcomes and the microbiological fractions of broiler chicken feces.
2. Materials and Methods
2.1. Chicken and Experimental Designs
The research was conducted in the experimental facility of the University of Life Sciences in Wrocław, Poland. All procedures involving broiler chickens were carried out in accordance with the requirements of the European Union [22]. A total of 112 one-day-old Ross 308 male cockerels, with an average body weight of 40.72 ± 0.47 g, were subjected to a 35-day fattening period. The cockerels were randomly assigned to one of four groups, with 28 birds in each group. These groups differed in the amount of dried, inactive distillers yeast added to their feed, the characteristics of which are presented in Table 1 and Table 2. The analyzed distillers yeast originated from a technological process involving the extraction of yeast from pure cultures of Saccharomyces cerevisiae cultivated on wheat extract.

Table 1.
Chemical content of yeast distillers.
Table 2.
Content of free and bound monosaccharides in yeast distillers.
All broiler chickens were fed full-potency, balanced feed mixtures (Table 3 and Table 4) with ad libitum access to feed and water.
Table 3.
Composition and value of feed mixes for broiler chickens depending on fattening period.
Metabolizable energy (ME) was calculated according to both Polish Nutritional Recommendations and Nutritional Value of Poultry Feed guidelines [23], meeting the nutritional requirements of Ross 308 broiler chickens [24]. It effectively conveys how the metabolizable energy was calculated and its alignment with nutritional environments. The feed cost calculations were performed according to the optimization of mixtures at the cost of 1 ton of finished product using raw material prices as of March 16, 2022, based on stock exchange prices quoted on the European feed exchange MATIF. Total feed costs per kg of gain (Polish currency − PLN) = Total feed costs (PLN/kg) × FCR were determined.
The control group (A) of broiler chickens was fed a feed mixture without the addition of distillers yeast. Group B received a feed mixture with a 3% yeast supplement, group C received a feed mixture with a 6% yeast supplement, and group D received a feed mixture with a 9% yeast supplement. A total of 112 one-day-old Ross 308 broiler chicken males (46.4 ± 1.2 g) were randomly divided into four dietary treatment groups, with each treatment group of 28 birds further divided into 7 replicates with 4 birds per cage. The room temperature gradually decreased from 32 °C (day 1) to 21 °C (day 35). The lighting program consisted of 18 h of light and 6 h of darkness. Broilers were fed Starter (1–10 days of life), Grower (11–27 days of life), and Finisher (28–35 days of life) feed mixtures. All feed mixtures were prepared for the entire fattening period, i.e., Starter, Grower, and Finisher.
Table 4.
Saccharide content after hydrolysis by Saeman [25], lactic acid and [(1-3)(1-4)]-β-D-glucans content and pH.
Table 4.
Saccharide content after hydrolysis by Saeman [25], lactic acid and [(1-3)(1-4)]-β-D-glucans content and pH.
| Item (mg/g) | Distillers Yeast | Starter | Grower | Finisher | |||||||||
|---|---|---|---|---|---|---|---|---|---|---|---|---|---|
| A | B | C | D | A | B | C | D | A | B | C | D | ||
| Rha | 0.7 | 0.6 | 0.7 | 0.7 | 0.5 | 0.6 | 0.4 | 0.5 | 0.3 | 0.7 | 0.6 | 0.3 | 0.3 |
| Fuc | 0.0 | 0.7 | 0.5 | 0.3 | 0.3 | 0.4 | 0.3 | 0.3 | - | 0.6 | 0.4 | 0.2 | 0.2 |
| Ara | 43.6 | 16.7 | 16.9 | 17.4 | 18.0 | 16.7 | 16.9 | 17.0 | 18.5 | 16.4 | 16.8 | 16.4 | 18.7 |
| Xyl | 63.8 | 18.5 | 19.1 | 19.4 | 20.4 | 18.4 | 19.9 | 20.6 | 26.0 | 17.1 | 19.5 | 21.2 | 24.5 |
| Man | 14.1 | 5.4 | 5.0 | 5.2 | 5.3 | 5.1 | 5.4 | 5.7 | 5.5 | 4.0 | 4.1 | 4.3 | 4.5 |
| Gal | 6.2 | 19.1 | 18.9 | 17.3 | 15.4 | 17.8 | 15.0 | 14.8 | 11.4 | 22.0 | 15.4 | 12.7 | 12.0 |
| Glc | 36.2 | 315.4 | 337.5 | 320.4 | 332.1 | 402.1 | 436.8 | 395.2 | 431.5 | 404.6 | 430.5 | 433.8 | 422.5 |
| UA | 15.0 | 13.4 | 16.5 | 12.3 | 21.2 | 19.7 | 17.9 | 15.8 | 15.5 | 10.4 | 12.8 | 19.7 | 18.0 |
| Total | 179.6 | 389.8 | 414.1 | 393.0 | 413.2 | 480.8 | 512.6 | 469.9 | 508.7 | 475.8 | 500.1 | 508.6 | 500.7 |
| β-glukans | 4.8 | 1.3 | 1.3 | 1.4 | 2.2 | 2.0 | 1.9 | 1.8 | 1.9 | 1.1 | 1.0 | 1.0 | 1.0 |
| L- | 2.2 | 1.0 | 1.2 | 0.9 | 1.1 | 0.6 | 0.8 | 0.7 | 1.0 | 0.5 | 0.5 | 0.6 | 0.5 |
| D- | 4.2 | 1.1 | 2.2 | 1.3 | 1.7 | 0.8 | 1.6 | 1.4 | 1.8 | 0.8 | 0.8 | 1.0 | 1.0 |
| pH | 5.1 | 6.0 | 5.9 | 5.9 | 5.8 | 6.0 | 5.9 | 5.8 | 5.7 | 5.8 | 6.0 | 6.0 | 6.0 |
Explanation of abbreviations Rha, Fuc, Ara, Xyl, Man, Gal, Glc—see Table 2, UA—uronic acids; L-Lactic acid and D-Lactic acid. A—control group; B—diet with 3% yeast; C—diet with 6% yeast; D—diet with 9% yeast.
2.2. Fattening Efficiency Analysis
For each group of broiler chickens, body weight was determined on days 1, 10, 27, and 35 of life. Daily cage inspections were conducted to record the number of dead birds. Based on these data, the mortality rate (MR) for the entire fattening period was calculated as follows:
MR = (A/B) × 100%
A—the number of broiler chickens that died during the entire fattening period,
B—the total number of live broiler chickens during the entire fattening period.
For all groups of broiler chickens, feed consumption and body weight gains were determined in individual fattening periods, i.e., Starter, Grower, and Finisher. This information was used to calculate the Feed Conversion Ratio (FCR) and European Production Efficiency Factor (EPEF).
FCR = A/B
A—feed consumption in a given fattening period [g],
B—body weight gain in a given fattening period [g].
EPEF = (body weight (kg) × survivability (%))/(age (days) × feed intake in total per one bird (kg)) × 100
2.3. Characteristics of Yeast and Feed Mixtures
The chemical composition of distillers yeast and feed mixtures was analyzed following the methods outlined by the Association of Official Analytical Chemists [26]. The analyses included the following determinations:
- Dry matter: Determined by drying samples at 105 °C until a constant weight was achieved (AOAC, 930.15) using a Zalmed SML 32/250 dryer (Poland);
- Crude ash: Determined by incinerating samples at 550 °C (AOAC, 942.05) using a muffle furnace;
- Crude protein: Determined using the Kjeldahl method (AOAC, 984.13) with a Foss Tecator Kjeltec 2300 apparatus (Hillerod, Denmark);
- Crude fat: Determined by ether extraction (AOAC, 920.10) using a Büchi Extraction System B-811 (Switzerland);
- Crude fiber: Determined according to AOAC (978.10) using a Foss Fibertec 1020 instrument (Sweden);
- Sodium and calcium content (AOAC, 975.03): Determined using a Varian AA240FS atomic absorption spectrometer (USA);
- Phosphorus content (AOAC 985.0): Determined using a dual-beam spectrophotometer, Dynamica Halo DB-20 (UK);
- Amino acid profile (AOAC, 994.12), excluding tryptophan, determined using an Amino acid analyzer AAA 400 (Ingos, Czech Republic);
- Tryptophan: Determined at a wavelength of 590 nm (AOAC, 988.15) using a spectrophotometer 2000 RS (Aqualytic, Dortmund, Germany);
- Uronic acids: A spectrophotometric method based on Blumenkrantz and Asboe-Hansen [27] was used. Absorbance was measured at 520 nm using a spectrophotometer VIS-7220G (Beijing Beifen-Ruili Analytical Instrument, China);
- Beta-glucans: Determined spectrophotometrically using a Megazyme K-BGLU test [28]. The resulting D-glucose, after reaction with the GOPOD reagent (glucose oxidase/peroxidase), was measured at 510 nm using a spectrophotometer VIS-7220G [26,29,30]. This method is specific for [(1-3)(1-4)-β-D-glucan with mixed-linkage;
- Glucans and mannans: Determined by analyzing sugars (glucose, rhamnose, fucose, arabinose, xylose, mannose, galactose) after acid hydrolysis according to the Saeman et al. [25] method, followed by the determination of volatile acetylated alditols using GC-FID [31,32] with a GC-2010 Plus Shimadzu apparatus (Tokyo, Japan);
- Lactic acid: Determined enzymatically using the commercial D-/L-Lactic acid, UV method (nzytech genes&enzymes, Portugal) in feed samples. For this determination, 96-well titration plates with a sample volume of 0.224 mL were used. Absorbance readings, based on the selective activity of D-Lactic acid dehydrogenase (D-LDH) and (L-LDH), were measured at a wavelength of 340 nm using an Epoch spectrophotometer (BioTek);
- pH: Determined using an AD1020 Adwa pH meter (Hungary). Homogenates of feed mixtures and yeast with deionized water were prepared for pH measurements.
- Additionally, the following parameters were determined in distillers yeast only:
- Neutral detergent fiber (NDF) and acid detergent fiber (ADF): Determined according to AOAC (973.18) using a Foss Fibertec 2010 apparatus (Hoganas, AB, Sweden);
- Acid detergent lignin (ADL): Determined according to AOAC (973.18), Van Soest method [33].
- Lignin: Determined according to AOAC 973.18 by incinerating samples at 550 °C using a muffle furnace;
- Free and bound matrix sugars (rhamnose, fucose, arabinose, xylose, mannose, galactose, glucose): In the first case, direct analysis of yeast extract was performed by GC-FID to determine volatile acetylated alditols [31,32] using Shimadzu GC-2010 Plus (Tokyo, Japan).
- Cellulose: Its content was obtained by subtracting the glucose content from the analysis with prehydrolysis from the glucose content obtained using the Saeman et al. method [30].
- Color parameters: Lightness (L*), redness (a*), yellowness (b*), and chroma (C*) were determined using a HunterLab Mini Scan XE Plus 45/0 (HunterLab Inc., Reston, VA, USA) equipped with a standard illuminant D65 and 10° Standard Observer.
- Protein solubility in KOH: Defined according to Araba and Dale [34] measured to evaluate protein quality. Higher protein solubility corresponds to higher protein quality or less heat-damaged products;
- Gross energy: Determined using a calorimeter KL-14 (Precyzja-Bit PPHU Sp. z o.o. Bydgoszcz, Poland).
2.4. Microbiological Determinations
The composition of feed and broiler chicken fecal microbiota was determined on the day of collection, specifically on days 10, 17, 27, and 35 of rearing. Fecal samples were collected from five cages for each of the four broiler chicken groups. The number of analyzed microorganisms was determined by a culturing method following the applicable PN-ISO standards and laboratory microbiological standards [35]. The analysis considered the total count of aerobic spore-forming bacteria (TAe) and total bacteria count (TBC), anaerobic bacteria (TAn), bacteria from the Enterobacteriaceae family (TEb), E. coli (TEc), Enterococcus (TEcc), Staphylococcus aureus (TSt), yeasts (TY), and bacteria belonging to the genera Lactobacillus (LAB), Lactococcus (LAC), and Bifidobacterium (TBif). Additionally, the presence of Salmonella sp. (Sal) and Campylobacter sp. (Camp) was determined. Commercial culture media were used for these determinations, including PEMBA (TAe), PCA (TBC), RCA (TAn), Chromcoli (TEb and TEc), Slantez–Bartley, and BEA (TEcc), Beard Parker (TSt), DRBC (TY), MRS agar (LAB), M-17 (LAC), SS (Sal), and COLUMBIA agar (Camp). For the determination of Bifidobacterium sp., MRS agar with lithium chloride (3.0 g/L), sodium propionate (200 mg/L), and cysteine (0.5 g/L) was used following Faleiro [36]. All cultures were incubated under conditions appropriate for each group of microorganisms: 37 °C/48 h under limited oxygen access (TAn, LAB, LAC, TBif, and Camp), 37 °C/48 h (TAe, TBC, TEb, TEc, TEcc, TSt, and Sal), and 24 °C/72 h (TY). The number of microorganisms was expressed as log cfu/g of the analyzed fecal sample.
Microbiological analysis was also conducted on feed samples used in the experiment. Depending on the broiler groups and their rearing stage (Starter-Finisher), five samples from each feed mixture and distillers yeast were taken for microbiological analysis. The determination of microbiological fractions followed the scope indicated for fecal samples, supplemented with the determination of the total mold count (TMC).
2.5. Mycotoxins in Feed
In the feed samples used for microbiological analysis, the presence of aflatoxins (AflaREAD) and ochratoxin A (OtaREAD) was determined. Quantitative toxin analysis was performed using ELISA analytical kits (ProGnosis Biotech, Larisa, Greece) with a detection limit of 0.1 ppm for AflaREAD and 5 ppm for OtaREAD. The extraction procedure and determination methods were in accordance with the manufacturer’s recommendations.
2.6. Statistical Analysis
Statistical calculations were performed using Statistica v.13.3. The obtained research results were checked for normal distribution using the Shapiro–Wilk test. Statistical analysis of the research results was carried out using one-way analysis of variance (ANOVA). The significance of differences between means was determined using Tukey’s test. In the case of non-normal distribution, the non-parametric Kruskal–Wallis test was applied. Similarity levels between the microbiota profiles of individual samples were determined using UPGMA (Unweighted Pair Group Method with Arithmetic Mean) cluster analysis with Pearson distribution.
3. Results
3.1. Characteristics of Yeasts and Feed Mixtures
The chemical composition, amino acid profile, and protein solubility characteristics in KOH as well as the content of free and bound carbohydrates, including Ramnose (Rha), Fucose (Fuc), Arabinose (Ara), and Xylose (Xyl), Mannose/Mannans (Man), Galactose (Gal), and Glucose/Glucans (Glc) of the analyzed distillers yeast are presented in Table 1, Table 2 and Table 3 presents the composition and value of feed mixtures depending on the fattening phase (Starter, Grower, Finisher) and the financial benefits resulting from the use of the analyzed distillers yeast in feed mixtures. Economic calculations showed that partially replacing soybean meal with distillers yeast in Starter, Grower, and Finisher feed mixtures allowed for a reduction in feed costs, depending on their proportion in the feed mixtures, e.g., for Finisher feed, the reduction ranged from 2.9% to 8.8%.
Compared to the control feed, the analyzed yeast had higher levels of Ara, Xyl, Man, and β-glucans, which, in the case of Ara and Xyl, increased in the feed mixtures with the increasing yeast content (Table 4). Yeast showed lower levels of Glc, Gal, and Fuc compared to the yeast-free feed, resulting in a decrease in the Gal and Fuc levels in the feed mixtures with increasing yeast content. In distillers yeast, the lactic acid content was slightly higher and the pH was lower compared to yeast-free feed, which had a minor impact on the diversity of feed mixtures with increasing yeast content.
3.2. Production Performance
Based on the analysis of characteristics and indicators of broiler chicken fattening efficiency, no significant differences were observed between the groups in terms of body weight and body weight gains, European Production Efficiency Factor (EPEF), and Mortality Rate (MR)—Table 5. However, significant differences were observed in feed consumption and feed conversion ratio (FCR) between the groups. Cockerels in the control group (Starter 1–10 days) had significantly higher feed consumption (285.30 g) compared to those receiving 3% yeast in their feed (254.20 g). For Grower, Finisher, and overall feed consumption, no significant differences were observed between the broiler groups. Cockerels fed with 9% yeast in the Grower feed (11–27 days) had a significantly higher FCR (1.55 g/g) compared to those receiving 3% yeast in their feed (1.35 g/g). In other fattening periods (Starter, Finisher), as well as overall, no significant differences were observed between the broiler groups in terms of BW (body weight), BWG (body weight gain), MR, and EPEF.
Table 5.
Production performance of broiler chickens.
3.3. Microbiological Tests of Feeds and the Digestive Tract
The analysis of feed mixtures in different fattening phases (from Starter to Finisher) did not show statistically significant differences between the analyzed groups in the determined counts of isolated microorganisms, including TBC, TAe, LAB, LAC, TYC, and TMC (Table 6).
Table 6.
Microbiotic variation of feed by broiler chicken group and for feed yeast.
All analyzed feeds contained aerobic spore-forming bacteria (TAe) and non-spore-forming bacteria (TBC), as well as some bacteria classified as lactic acid bacteria (LAB and LAC). None of the feed samples showed the presence of bacteria from the Enterobacteriaceae family, including E. coli and Salmonella sp., as well as Campylobacter sp., S. aureus, and Enterococcus sp. Regarding mycotoxin analysis, the presence of mold fungi representatives (TCM) was confirmed. Therefore, additional tests for aflatoxins and ochratoxin were considered necessary. None of the tested feed samples showed their presence.
The results of the analysis of fecal samples collected from broilers at all fattening stages did not show the presence of Salmonella sp., Campylobacter sp., and coagulase-positive S. aureus (Table 7). The comparison of the determined counts of microbial groups indicates that the addition of yeast to the feed had a significant impact on the total bacteria count (TBC) and Enterobacteriaceae (TEb), including E. coli (TEc), in all fattening stages (from Starter to Finisher). Compared to the control group of broilers, significant differences in TBC, TEb, and TEc counts were confirmed for broiler groups fed with Starter and Grower-1 feeds with 6% and 9% yeast additives. In the remaining two fattening stages (Grower-2 and Finisher), significantly lower counts of TBC, TEb, and TEc were observed only in the group receiving the highest amount of yeast (9%) in the feed compared to the other broiler groups. In the case of Gram-positive cocci—Enterococcus (TEcc), lower counts of TEcc were observed in the first fattening period (Starter) for broilers fed with 6% and 9% yeast additives. In the following fattening periods (Grower-1 and 2, as well as Finisher), significantly lower counts of cocci were confirmed only in the group receiving 9% yeast in the feed compared to the control group.
Table 7.
Quantitative and qualitative microbiota profile of fecal coliform.
In the Grower-2 and Finisher fattening periods, compared to the other fattening periods, the number of S. aureus was significantly lower in the broiler groups fed with 6% and 9% yeast additives. A similar trend was observed for Grower-1, with significant differences observed only between the control group and the group receiving 9% yeast in the feed. Regardless of the yeast content in the feed, the counts of lactic acid bacteria, such as LAB, LAC, and TBif, did not differ significantly.
The comparison of microbial fractions over the entire fattening period (1–35 days) showed that the addition of 6% and 9% yeast to the feed contributed to a reduction in the total bacterial count (TBC) and Enterobacteriaceae (TEb), including E. coli (TEc), compared to the control group. In the case of fecal Enterococcus (TEcc), lower counts were observed in the group of broilers fed with 9% yeast in the Starter feed.
In subsequent fattening periods (Grower-1 and 2, as well as Finisher), significantly lower counts of streptococci were confirmed only in the group receiving the highest amount of yeast (9%) in the feed compared to the other broiler groups. Regarding anaerobic bacteria (TAn), it was determined that the cfu of isolated anaerobic bacteria was significantly lower in the group receiving the highest yeast content (9%).
To illustrate the level of similarity between the microbiota profiles determined in different broiler groups, a cluster analysis was also conducted (Figure 1). In this case, the statistical analysis took into account not only the averages but also the distances between the individual data points. As a result of the statistical analysis, two independent groups (I and II) were identified, confirming the influence of yeast supplementation on the quantitative and qualitative structure of the determined microorganisms. This structure varied depending on the yeast content in the feed (A–D) and the fattening stage (1–4). Within the established groups, clusters I-A and I-B, as well as II-A and II-B, were distinguished. Cluster I-A included the control groups, regardless of the fattening stage, in which yeast was not added to the broiler feed (A-1, A-2, and A-3), and group B, which received feed with a 3% yeast additive (B-1). Cluster I-B combined the remaining broiler groups that received Starter feed (groups C and D) and Grower feed (groups B, C, and D) in two fattening stages (1 and 2). Group II grouped microbiological profiles determined in all broiler groups that received Finisher feed, regardless of the yeast content in the feed. Additionally, subgroup II-B was delineated for the broiler group fed with Finisher feed with a 9% yeast additive (D-4).
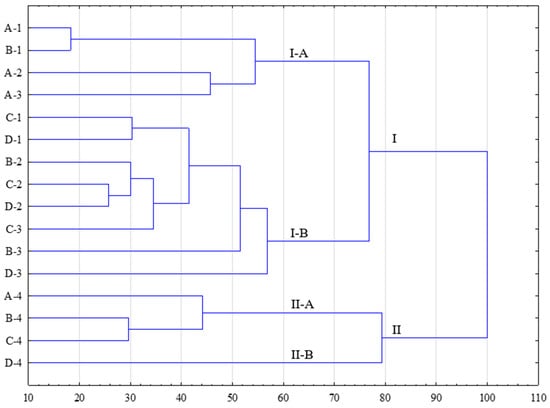
Figure 1.
Cluster analysis of microbiocenotic profiles for analyzed groups of broiler chickens. A—control group; B—diet with 3% yeast; C—diet with 6% yeast; D—diet with 9% yeast. 1—Starter; 2—Grower-1; 3—Grower-2; 4—Finisher.
Based on the analysis of similarity (dendrogram), it was determined that the variability in microbiological diversity in the broiler feces may not solely be the result of yeast supplementation in the feed. The separation of independent groups (I and II) indicates that macrobiotic stability is achieved in the final fattening stage (Group II). This fact is reflected in cluster II-A, within which only results obtained from broilers fed with Finisher feed were found. An important outcome of the conducted research was the distinction of results obtained in group D-4. This suggests that it is only with the addition of 9% yeast to the feed (II-B) that the quantitative and qualitative microbiota profile of the chickens is affected. Furthermore, the significance of adding 9% yeast can already be observed in the use of Grower-2 feed (D-3), where, similar to Group II, it is a part of cluster I-B but with a clear indication of microbiological distinctiveness.
The variation in individual microbiotic fractions is reflected in the overall profile of isolated microorganisms (Figure 2). Based on this, it can be indicated that with the growth of broiler chickens and the maturation of their digestive system, the overall number of isolated microorganisms in their feces decreases, which may also be influenced by the yeast content in the feed, although these differences are not statistically significant (p = 0.336).
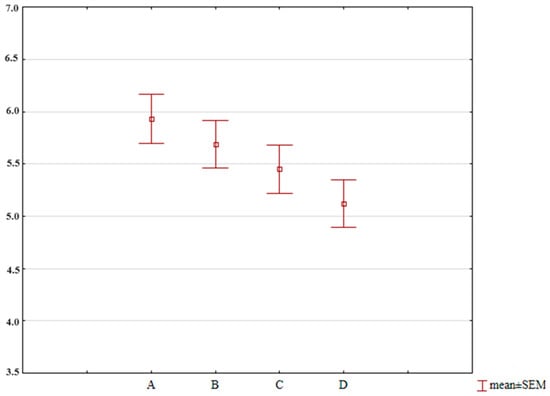
Figure 2.
Average microbial counts determined in groups of broiler chickens throughout the fattening period. A—control group; B—diet with 3% yeast; C—diet with 6% yeast; D—diet with 9% yeast.
4. Discussion
4.1. Fattening Efficiency
Although there are official and commercial definitions for various by-products of wheat distillation, the boundaries between these products may be somewhat unclear. In particular, the quantity of soluble substances mixed with distillation wort can vary greatly, and the presence of soluble substances has not been defined in nutritional studies [37]. Besides the variability in protein content resulting from the quality of the raw material, there are significant differences between wheat grains due to their preparation, fermentation process, the number of soluble fractions, duration and temperature of drying, and potential further fractionation of non-starch fractions [37,38,39].
An economic analysis of the replacement of mainly post-extraction soybean meal with distillers yeast showed a reduction in feed cost that was greater as the proportion of yeast increased. Also, when considering feed conversion ratio (FCR), the lowest feed cost per kg of gain was found in the groups of chickens that received the yeast supplement, but the lowest feed cost was found in the group of chickens that received 3% distillers yeast in their diet.
In our research, no significant impact of the distillery yeast used on the characteristics and indicators related to the productivity and survivability of broiler chickens was observed, except for feed consumption and feed conversion ratio (FCR). Cockerels from the group receiving 3% yeast in their feed had significantly lower feed consumption (Starter diet) compared to the control group and better feed conversion (FCR) compared to cockerels receiving 9% yeast in their feed (Grower diet). Furthermore, based on the average values, a trend can be observed that birds receiving 3% distillery yeast in their feed had higher body weight (27 and 35 days), body weight gain (1–35 days), better feed conversion (1–35 days), and higher EPEF compared to birds receiving 6% and 9% yeast additives and the control group. The obtained research results are in line with earlier studies by Możanowicz et al. [40], where it was found that adding distillery yeast to full-fledged mixtures for Hubbard broiler chickens in the final fattening phase (Finisher diet), regardless of the quantity used (2% or 4%), had a favorable effect on the production results of birds, such as body weight gains, feed intake, and utilization. However, the significance of differences obtained in production parameters of chickens receiving both 2% and 4% yeast suggests that during the fattening period, it is recommended to use 2% yeast in the feed mixture. Good production effects were achieved by using 0.5–3 g of live Saccharomyces cerevisiae yeast per 1 kg of feed mixture for growing broiler chickens [16].
Distillery yeast sludge (DYS) is the most common product among by-products of yeast fermentation as an alternative, cheaper source of protein, mainly for soybean and canola meal. In Sharif et al.’s study [8] on Japanese quails, feed consumption and body weight gain tended to increase up to 3% DYS, and better feed conversion ratios (FCR) were observed in birds fed a diet containing 1.5% and 3% DYS. Dry matter and crude protein digestibility decreased with increasing DYS levels (from 1.5% to 7.5%), and the cost of production per 100 g of body weight gain was also lower for birds fed a diet containing 3% DYS. The similarity between birds on the control diet and those on the 3% DYS diet in terms of dry matter digestibility suggests that DYS can be incorporated into the quail diet in amounts up to 3% without causing adverse effects related to dry matter digestibility. However, a decrease in crude protein digestibility at 3% DYS content in the feed may be due to the more favorable amino acid profile of soybean meal in the diet of the control group. According to these authors, increased feed intake in birds fed diets containing 1.5% and 3.0% DYS was probably due to the fact that distillery sludge is a rich source of vitamins, especially B vitamins, oligosaccharides, and other unidentified nutrients, all of which could contribute to increased feed palatability. In studies by other authors, reduced feed intake was noted in birds fed diets containing brewery or distillery yeast [41,42], which may be related to the fact that distillery sludge contains nucleic acids, which are the main cause of reduced feed intake. As the literature suggests, the use of distillery yeast sludge at higher doses in poultry is associated with increased consumption of nucleic acids in the diet, which may reduce uric acid excretion, leading to serious metabolic disturbances and anorexia. Concerns about using higher doses of yeast arise from the fact that it is accompanied by a high content of phenol and calcium, which negatively affects phosphorus absorption. The presence of higher amounts of non-starch polysaccharides and nucleic acids in higher doses of distillery yeast is a major cause of decreased production performance in birds [42,43].
In our research, the distillery yeast analyzed exhibited a protein solubility in KOH at a level of 51% and a lightness (L*) value of 38.57. In the study by Sharif et al. [8], dry matter and crude protein digestibility decreased with increasing distillery yeast content above 3%, with the best results observed in the control group. Cromwell et al. [44] and Cozannet et al. [45] suggest that in poultry nutrition, light DDGS (Dried Distillers Grains with Solubles) from wheat would be preferred because of its higher quality, which would be especially suitable for monogastric animals, as the content and availability of amino acids can be higher [46]. Due to the fact that DDGS darkens at high temperatures, those with L* values below 50 have low lysine digestibility, which may be related to drying conditions; the lowest values were observed in dark products with a probable occurrence of the Maillard reaction [47], suggesting that color may be a quick method to identify sources of DDGS with poor amino acid digestibility [39]. Confirmation of poor amino acid digestibility can be the protein solubility in KOH, with optimal values ranging from 75 to 85% [48]. High temperatures during technological processes (overheating) can trigger the Maillard reaction, of which the products may have toxic effects on animal organisms and reduce feed nutritional value and intake, ultimately deteriorating fattening efficiency.
4.2. Intestinal Microflora
Microbiotic relationships in the gastrointestinal tract undergo complex processes, especially interactions with the environment. It is widely recognized that a properly formed commensal microbiota plays a key role in shaping the immune response, inhibiting the proliferation of pathogenic microorganisms, and is an important factor in the protection against exogenous agents.
One of the most important factors influencing the development of the microbiome is diet. Ingredients in its composition that are indigestible by the host can provide a potential substrate for the development of microorganisms or can cause their inhibition. Our research has shown that regardless of the fattening period of broiler chickens, the overall number of isolated microorganisms in the feces decreases with an increase in the proportion of distillery yeast in the feed. This is evidenced by the significant reduction in TBC, fecal bacteria (TEb, TEc, and TEcc), and spore-forming bacteria, especially in groups of broiler chickens receiving 6% and 9% yeast. Similar observations were also made by Javadi et al. [49], who studied the effects of active and inactive S. cerevisiae on the microbial diversity of the gastrointestinal tract of Japanese quail.
However, the addition of distillery yeast to the feed did not have a significant impact on the number of microorganisms attributed to probiotic properties (LAB, LAC, and Tif). Furthermore, a cluster analysis conducted based on the results obtained from the counts of all microorganisms in broiler chicken groups may suggest that only the addition of 9% yeast to the feed has a real impact on the quantitative and qualitative profile of chicken microbiota. The results obtained confirm that the analyzed dry, inactive distillery yeast fulfills the function of a prebiotic by influencing the components of yeast cell walls to reduce the number of intestinal pathogens in poultry [50,51]. Studies show that prebiotic yeasts prevent the colonization of poultry intestines by intestinal pathogens, thus reducing competition between pathogens and host cells for nutrients [52].
The processes of microbiota regulation involving DYS are accompanied by a number of physiological changes. First, these prebiotics promote intestinal epithelial cell proliferation and mucin secretion [53]. The receptor in mucin competitively binds to type 1 fimbriae of Gram-negative bacteria.
However, yeasts that do not adhere to the intestinal epithelium and/or their derivatives block the adherence of enteropathogenic bacteria such as E. coli and Salmonella sp. to the intestinal epithelium. The study by Koc et al. [20] showed that the addition of S. cerevisiae to the diet significantly reduced E. coli in the ileal microbiota of broiler chickens, which was also found in our experiments. In addition, the effective “binding” of pathogenic bacteria and their consequent elimination from the gastrointestinal tract of broilers promotes the utilization of nutrients by microbiotic communities that support their homeostatic profile. In this case, the metabolic function of lactic acid bacteria (LAB) should be emphasized. A close relationship is observed especially in the case of Bifidobacterium sp., which, together with Lactobacillus sp., constantly compete with pathogenic microbes for space and nutrient resources. The ability to synthesize organic acids and bacteriocins in the case of Lactobacilli is an alternative pathway for the elimination of bacteria lacking fimbri tup 1, i.e., Clostridium perfringens or Campylobacter sp.
The antagonistic effect of LAB metabolites is also enhanced by the addition of DYS to the diet. Previous research has shown that the use of S. cerevisiae yeast can increase the number of lactic acid bacteria (LAB) and lactic acid content, thereby acidifying the intestinal environment, which negatively affects the growth of pathogenic bacteria such as E. coli [54]. In our research, we demonstrated that an increase in the proportion of distillery yeast resulted in an increase in lactic acid content and, subsequently, a decrease in the feed mixture pH. As indicated by studies by other authors, including yeast in poultry diets leads to a decrease in the pH of intestinal contents, which has a negative impact on pathogenic bacteria [10,11].
Previous observations of the effects of live and inactive yeast or its derivatives prove that they are potential alternatives to the antineoplastic growth promoters used in previous years. Bioactive components of yeast cells with antimicrobial properties are mainly mannans and glucans, β-glucans, nucleotides, and chitosan [10,11]. In our research, we generally observed higher levels of glucans and mannans in feed mixtures containing distillery yeast, although this was not confirmed for β-glucans. In our research, we generally observed higher levels of glucans and mannans in diets containing distillers dried yeast, although this has not been confirmed for β-glucans. This mainly contributes to stimulating the proliferation of desirable microorganisms, i.e., LAB, and reducing the burden of pathogenic microorganisms by their competitive exclusion.
5. Conclusions
This research showed that the use of dried, inactive distillers yeast at levels ranging from 3% to 9% increased the levels of glucans and mannans, and lactic acid and therefore lowered the pH of the diet, which likely resulted in a significant reduction in the total number of bacteria in the feces, including Enterobacteriaceae, E. coli, Enterococcus, and S. aureus, without affecting the numbers of lactic acid bacteria.
A properly balanced diet containing distillers yeast can be used as a good source of energy and protein in broiler diets and can serve as a cost-effective alternative to soybean meal. However, for optimal production results (feed consumption and feed conversion) and feed cost per kg of gain, the inclusion of yeast in the diet should not exceed 3%.
Author Contributions
Conceptualization and experimental design, A.R.; microbiological methodology and laboratory analysis, E.B.-W.; performed the experiment on animals, A.R., K.S. and I.T.; internal funding acquisition, investigation, internal project administration, A.R.; prepared the tables and figures, analyzed the measured data and performed the calculations, A.R., E.B.-W. and I.T.; writing—original draft, A.R. and E.B.-W. All authors have read and agreed to the published version of the manuscript.
Funding
This study was supported by internal Grant No. N090/0008/21, financed by Wrocław University of Environmental and Life Sciences, Poland. The APC/BPC is financed/co-financed by Wrocław University of Environmental and Life Sciences, Poland.
Institutional Review Board Statement
The study protocol did not require approval of from the Ethics Committee. The experimental protocol was approved by the Advisory Team for the Welfare of Animals of The Faculty of Biology and Animal Science of Wrocław University of Environmental and Life Sciences (Decision no. 3/2023).
Data Availability Statement
The data presented in this study are available on request from the corresponding author.
Conflicts of Interest
The authors declare no conflict of interest.
References
- Haque, M.H.; Sarker, S.; Islam, M.S.; Islam, M.A.; Karim, M.R.; Kayesh, M.E.; Shiddiky, M.J.; Anwer, M.S. Sustainable antibiotic-free broiler meat production: Current trends, challenges, and possibilities in a developing country perspective. Biology 2020, 9, 411. [Google Scholar] [CrossRef]
- Andrew Selaledi, L.; Mohammed Hassan, Z.; Manyelo, T.G.; Mabelebele, M. The current status of the alternative use to antibiotics in poultry production: An african perspective. Antibiotics 2020, 9, 594. [Google Scholar] [CrossRef]
- Peric, L.; Zikic, D.; Lukic, M. Application of alternative growth promoters in broiler production. Biotech. Anim. Husb. 2009, 25, 387–397. [Google Scholar] [CrossRef]
- Nhung, N.T.; Chansiripornchai, N.; Carrique-Mas, J.J. Antimicrobial resistance in bacterial poultry pathogens: A review. Front. Vet. Sci. 2017, 4, 126. [Google Scholar] [CrossRef]
- Carvalho, I.T.; Santos, L. Antibiotics in the aquatic environments: A review of the European scenario. Environ. Int. 2018, 94, 736–757. [Google Scholar] [CrossRef]
- European Medicines Agency. Agency. Sales of Veterinary Antimicrobial Agents in 31 European Countries in 2021. Trends from 2010 to 2021. Twelfth ESVAC Report. Luxembourg: Publications Office of the European Union. 2021. Available online: https://www.ema.europa.eu/en/documents/report/sales-veterinary-antimicrobial-agents-31-european-countries-2021-trends-2010-2021-twelfth-esvac_en.pdf (accessed on 1 July 2022).
- Esonu, B.O.; Ogbonna, U.D.; Anyanwu, G.A.; Emenalom, O.O.; Uchegbu, M.C.; Etuk, E.B.; Udedibie, A.B.I. Evaluation of performance, organ characteristics and economic analysis of broiler finisher fed dried rumen digesta. Int. J. Poult. Sci. 2006, 5, 1116–1118. [Google Scholar] [CrossRef]
- Sharif, M.; Shoaib, M.; Rahman, M.A.U.; Ahmad, F.; Rehman, S.U. Effect of distillery yeast sludge on growth performance, nutrient digestibility and slaughter parameters in Japanese quails. Sci. Rep. 2018, 8, 8418. [Google Scholar] [CrossRef] [PubMed]
- Grela, E. Feed alternative to soybean protein in pigs and poultry nutrition. Życie Wet. 2020, 95, 480–486. [Google Scholar]
- Bilal, R.M.; Hassan, F.U.; Saeed, M.; Rafeeq, M.; Zahra, N.; Fraz, A.; Saeed, S.; Khan, M.A.; Mahgoub, H.A.M.; Farag, M.R.; et al. Role of yeast and yeast-derived products as feed addtives in broiler nutrition. Anim. Biotech. 2023, 34, 392–401. [Google Scholar] [CrossRef] [PubMed]
- Fathima, S.; Shanmugasundaram, R.; Sifri, M.; Selvaraj, R. Yeasts and yeast-based products in poultry nutrition. J. Appl. Poult. Res. 2023, 32, 100345. [Google Scholar] [CrossRef]
- Haldar, S.; Ghosh, T.K.; Bedford, M.R. Effects of yeast (Saccharomyces cerevisiae) and yeast protein concentrate on production performance of broiler chickens exposed to heat stress and challenged with Salmonella enteridis. Anim. Feed Sci. Technol. 2011, 168, 61–71. [Google Scholar] [CrossRef]
- Cheng, G.; Hao, H.; Xie, S.; Wang, X.; Dai, M.; Huang, L.; Yuan, Z. Antibiotic alternatives: The substitution of antibiotics in animal husbandry. Front. Microbiol. 2014, 5, 217. [Google Scholar] [CrossRef] [PubMed]
- Ogbuewu, I.P.; Okoro, V.M.; Mbajiorgu, E.F.; Mbajiorgu, C.A. Yeast (Saccharomyces cerevisiae) and its effect on production indices of livestock and poultry—A review. Comp. Clin. Pathol. 2019, 28, 669–677. [Google Scholar] [CrossRef]
- Vohra, A.; Syal, P.; Madan, A. Probiotic yeasts in livestock sector. Anim. Feed Sci. Technol. 2016, 219, 31–47. [Google Scholar] [CrossRef]
- Elghandour, M.M.Y.; Tan, Z.L.; Abu Hafsa, S.H.; Adegbeye, M.J.; Greiner, R.; Ugbogu, E.A.; Cedillo Monroy, J.; Salem, A.Z.M. Saccharomyces cerevisiae as a probiotic feed additive to non- and pseudo-ruminant feeding: A review. J. Appl. Microbiol. 2019, 128, 658–674. [Google Scholar] [CrossRef]
- Ghazanfar, S.; Khalid, N.; Ahmed, I.; Imran, M. Probiotic yeast: Mode of action and its effects on ruminant nutrition. In Yeast—Industrial Applications; IntechOpen: Rijeka, Croatia, 2017; pp. 179–202. [Google Scholar] [CrossRef]
- Gheisari, A.; Kholeghipour, B. Effect of dietary inclusion of live yeast (Sachharomyces cerevisiae) on growth performance, immune response and blood parameters of broiler chickens. In Proceedings of the 12th European Poultry Conference, Verona, Italy, 10–14 September 2006. [Google Scholar]
- Oyedeji, J.O.; Ajayi, H.I.; Egere, T. The effect of increasing level of yeast culture (Levucel SB) in a high fibre diet, on the performance and nutrient retention of broiler chicken. Asian J. Poul. Sci. 2008, 2, 53–57. [Google Scholar] [CrossRef][Green Version]
- Koc, F.; Samli, H.; Okur, A.; Ozduven, M.; Akyurek, H.; Senkoylu, N. Effects of Saccharomyces cerevisiae and/or mannanoligosaccharide on performance, blood parameters and intestinal microbiota of broiler chicks. Bulg. J. Agric. Sci. 2010, 16, 643–650. [Google Scholar]
- Pizzolitto, R.P.; Armando, M.R.; Salvano, M.A.; Dalcero, A.M.; Rosa, C.A. Evaluation of Saccharomyces cerevisiae as an antiaflatoxicogenic agent in broiler feedstuffs. Poult. Sci. 2013, 92, 1655–1663. [Google Scholar] [CrossRef]
- European Union Council. Directive 86/609/EEC on the Protection of Animals Used for Experimental and Other Scientific Purposes; EU Commission: Brussels, Belgium, 1986. [Google Scholar]
- Smulikowska, S.; Rutkowski, A. (Eds.) Recommended Allowances and Nutritive Value of Feedstuffs for Poultry, 5th ed.; The Kielanowski Institute of Animal Physiology and Nutrition, Polish Academy of Sciences: Jabłonna, Poland, 2018; Polish Branch of WPSA. (In Polish) [Google Scholar]
- AviagenTM EPI. Broiler—Ross 308. 2019. Available online: https://modernhatch.eu/wp-content/uploads/2021/01/Ross-308-broiler-PO-AND-NS-2019-PL.pdf (accessed on 1 July 2022).
- Saeman, J.F.; Moore, W.E.; Mitchel, R.L.; Millet, M.A. Techniques for the determination of pulp constituents by quantitative paper chromatography. TAPPI 1954, 37, 336–343. [Google Scholar]
- Association of Official Analytical Chemists (AOAC). Official Methods of Analysis, 20th ed.; AOAC: Rockville, MD, USA, 2016. [Google Scholar]
- Blumenkrantz, N.; Asboe-Hansen, G. New method for quantitative determination of uronic acids. Anal. Biochem. 1973, 54, 484–489. [Google Scholar] [CrossRef]
- McCleary, B.V.; Mugford, D.C.; Camire, M.C.; Gibson, T.S.; Harrigan, K.; Janning, M.; Meuser, F.; Williams, P. Determination of β-glucan in barley and oats by streamlined enzymatic method: Summary of collaborative study. J. AOAC Int. 1997, 80, 580–583. [Google Scholar] [CrossRef]
- AACC Approved Methods of Analysis, 11th ed.; AACC International: St. Paul, MN, USA, 2010.
- ICC. International Association for Cereal Science and Technology (ICC) Standard Method no. 166. Determination of ß–Glucan in Barley, Oat and Rye; ICC Secretariat: Vienna, Austria, 1998. [Google Scholar]
- Englyst, H.N.; Cummings, J.H. Simplified method for the measurement of total non-starch polysaccharides by gas-liquid chromatography of constituent sugars as alditol acetates. Analyst 1984, 109, 937–942. [Google Scholar] [CrossRef]
- Renard, C.M.G.C. Variability in cell wall preparations: Quantification and comparison of common methods. Carbohydr. Polym. 2005, 60, 515–522. [Google Scholar] [CrossRef]
- Van Soest, P.J. The use detergents in the analysis of fibrous feeds: II. A rapid method for the determination of fiber and lignin. J. Assn. Off. Agr. Chem. 1963, 46, 829–835. [Google Scholar] [CrossRef]
- Araba, M.; Dale, N.M. Evaluation of protein solubility as an indicator of overprocessing of soybean meal. Poult. Sci. 1990, 69, 76. [Google Scholar] [CrossRef]
- ISO 7218:2008; Microbiology of Food and Animal Feeding Stuffs—General Requirements and Guidance for Microbiological Examinations. International Organization for Standardization: Geneva, Switzerland, 2008.
- Faleiro, L.R.; Pereira, B.S.; Lacerda, I.C.; Nicoli, J.R.; Souza, T.C.; Nunes, Á.C.; Alvim, L.B.; de Souza, M.R.; Oliveira, E.S. Evaluation of culture media for selective enumeration of Bifidobacterium spp. in combination with different strains of Streptococcus thermophilus isolated from commercial yogurt starter cultures. Afr. J. Microbiol. Res. 2015, 9, 281–373. [Google Scholar] [CrossRef]
- Newkirk, R. Wheat DDGS Feed Guide: Wheat Dried Distiller Grains with Solubles. In Feed Opportunities from the Biofuels Industries (FOBI), 1st ed.; Canadian International Grains Institute (Cigi): Winnipeg, MB, Canada, 2011. [Google Scholar]
- Belyea, R.L.; Rausch, K.D.; Clevenger, T.E.; Singh, V.; Johnston, D.B.; Tumbleson, M.E. Sources of variation in composition of DDGS. Anim. Feed Sci. Technol. 2010, 159, 122–130. [Google Scholar] [CrossRef]
- Cozannet, P.; Primot, Y.; Gady, C.; Métayer, J.P.; Calluc, P.; Lessire, M.; Skiba, F.; Noblet, J. Ileal digestibility of amino acids in wheat distillers dried grains with solubles for pigs. Anim. Feed Sci. Technol. 2010, 158, 177–186. [Google Scholar] [CrossRef]
- Możanowicz, N.; Król, B.; Słupczyńska, M.; Hikawczuk, T.; Sierżant, K.; Wilk, M. Growth performance and gastrointestinal tract allometry of broiler chickens fed with complete feed mixtures including distiller’s and brewer’s yeast. Res. Pap. Wrocław Univ. Econ. 2018, 542, 122–131. [Google Scholar] [CrossRef]
- Oliva-Teles, A.; Gonçalves, P. Partial replacement of fishmeal by brewers yeast (Saccharomyces cerevisae) in diets for sea bass (Dicentrarchus labrax) juveniles. Aquaculture 2001, 202, 269–278. [Google Scholar] [CrossRef]
- Rameshwari, K.S.; Karthikeyan, S. Distillery yeast sludge (DYS) as an alternative feed resource in poultry. Int. J. Poult. Sci. 2005, 4, 787–789. [Google Scholar] [CrossRef]
- Tuse, D. Single-cell protein: Current status and future prospects. Crit. Rev. Food Sci. Nutr. 1984, 19, 273–325. [Google Scholar] [CrossRef]
- Cromwell, G.L.; Herkelman, K.L.; Stahly, T.S. Physical, chemical, and nutritional characteristics of distillers dried grains with solubles for chicks and pigs. J. Anim. Sci. 1993, 71, 679–686. [Google Scholar] [CrossRef] [PubMed][Green Version]
- Cozannet, P.; Lessire, M.; Métayer, J.P.; Gady, C.; Primot, Y.; Geraert, P.A.; Le Tutour, L.; Skiba, F.; Noblet, J. Nutritive value of wheat and maize distillers dried grains with solubles for poultry. Inra Prod. Anim. 2010, 23, 405–414. [Google Scholar] [CrossRef]
- Noblet, J.; Cozannet, P.; Skiba, F. Nutritional value and utilization of wheat dried distillers grain with solubles in pigs and poultry—Chapter 9. In Biofuel Co-Products as Livestock Feed: Opportunities and Challenges; Makkar, H.P.S., Ed.; FAO: Rome, Italy, 2012. [Google Scholar]
- González-Vega, J.C.; Kim, B.G.; Htoo, J.K.; Lemme, A.; Stein, H.H. Amino acid digestibility in heated soybean meal fed to growing pigs. J. Anim. Sci. 2011, 89, 3617–3625. [Google Scholar] [CrossRef]
- Van Eys, J.E.; Ruiz, N. Quality Manual and Analysis for Soybean Products in the Feed Industry, 3rd ed.; USSE: Chesterfield, MO, USA, 2021. [Google Scholar]
- Javadi, A.; Mirzaei, H.; Safarmashaei, S.; Vahdatpour, S. Effects of probiotic (live and inactive Saccharomyces cerevisiae) on meat and intestinal microbial properties of Japanese quails. Afr. J. Biotechnol. 2012, 11, 12083–12087. [Google Scholar] [CrossRef]
- Shanmugasundaram, R.; Sifri, M.; Jeyabalan, R.; Selvaraj, R.K. Effect of yeast cell product (CitriStim) supplementation on turkey performance and intestinal immune cell parameters during an experimental lipopolysaccharide injection. Poult. Sci. 2014, 93, 2763–2771. [Google Scholar] [CrossRef]
- Markazi, A.D.; Perez, V.; Sifri, M.; Shanmugasundaram, R.; Selvaraj, R.K. Effect of whole yeast cell product supplementation (CitriStim) on immune responses and cecal microflora species in pullet and layer chickens during an experimental coccidial challenge. Poult. Sci. 2017, 96, 2049–2056. [Google Scholar] [CrossRef]
- Fathima, S.; Shanmugasundaram, R.; Adams, D.; Selvaraj, R.K. Gastrointestinal microbiota and their manipulation for improved growth and performance in chickens. Foods 2022, 11, 1401. [Google Scholar] [CrossRef]
- Kim, Y.S.; Ho, S.B. Intestinal goblet cells and mucins in health and disease: Recent insights and progress. Curr. Gastroenterol. Rep. 2010, 12, 319–330. [Google Scholar] [CrossRef] [PubMed]
- Wulandari, S.; Syahniar, T.M. The effect of adding probiotic Saccharomyces cerevisiae on dietary antibiotic-free on production performance and intestinal lactic acid bacteria growth of broiler chicken. IOP Conf. Ser. Environ. Earth. Sci. 2018, 207, 012034. [Google Scholar] [CrossRef]


Disclaimer/Publisher’s Note: The statements, opinions and data contained in all publications are solely those of the individual author(s) and contributor(s) and not of MDPI and/or the editor(s). MDPI and/or the editor(s) disclaim responsibility for any injury to people or property resulting from any ideas, methods, instructions or products referred to in the content. |
© 2023 by the authors. Licensee MDPI, Basel, Switzerland. This article is an open access article distributed under the terms and conditions of the Creative Commons Attribution (CC BY) license (https://creativecommons.org/licenses/by/4.0/).