Article

The Evaluation of the Water Consumption and the Productive Parameters of a Table Grapevine, Cardinal Cultivar, Grafted onto Two Rootstocks

Department of AGRARIA, Mediterranean University of Reggio Calabria, 89124 Reggio Calabria, Italy
*
Author to whom correspondence should be addressed.
Agriculture 2023, 13(11), 2101; https://doi.org/10.3390/agriculture13112101
Submission received: 29 September 2023 / Revised: 27 October 2023 / Accepted: 31 October 2023 / Published: 6 November 2023
(This article belongs to the Section Agricultural Water Management)

Abstract

:
This trial was carried out over two years in southern Italy. Two grapevine rootstocks, 110R and SO4, were compared to evaluate their ability to extract water from the soil and the effect on the yield and quality of the Cardinal grapevine table cultivar. Therefore, a new approach to plant water consumption based on sap flow was adopted. The earlier and faster water refilling of the xylem in Cardinal onto 110R (C/110R) appears responsible for the earlier evolution of the phenological phases than Cardinal onto SO4 (C/SO4). The maximum length of the principal shoot was reached in Cardinal/110R compared to the C/SO4, while a higher number of lateral shoots with lower internode changed the canopy architecture and light distribution in the C/SO4. The 110R used more water compared to the SO4. It was possible to quantify the real transpired flux of the plant per day: the sap flow was 12.3 L.plant−1.d−1 and 11.7 L.plant−1.d−1 in C/110R in the first and second year, respectively, while it was 14% lower in the alternative graft combination. The overall lower C/SO4 water status does not compromise the production result, with similar or higher-quality aspects compared to the alternative graft combination C/110R, which can be also attributed to the strong resilience of Cardinal to water deficit.

1. Introduction

Grafting is a propagation method that has been used for millennia [1] and is currently widely used in grapevine culture. The graft of Vitis vinifera scion onto a rootstock of Vitis spp. of American origin (Vitis berlandieri Planch, Vitis riparia Michx., and Vitis rupestris Scheele) or their interspecific hybrids has been a necessary propagation method to counteract phylloxera damage on grapevines since the end of the 19th century [2]. Indeed, this insect damages the root system of Vitis vinifera but not that of Vitis of American origin, because this latter is poorly suited to the production of quality grapes. Therefore, the graft on phylloxera-resistant rootstock has become an essential practice for planting new vineyards [3], and subsequently, it has allowed overcoming other biotic and abiotic adversities, such as drought [4]. The soil–plant–air continuum is interconnected by a continuous film of water [5], and optimal transport is compromised by drought conditions, a problem in the Mediterranean environment, where water is the most limiting resource for agriculture. In particular, grapevine plants are often exposed to water deficits during the growth period, and this phenomenon has been exacerbated in recent years due to the effect of climate change [6]. However, the water uptake could be increased in the vine by using a drought-tolerant rootstock [7,8,9,10] such as V. Rupestris or its hybrid. Previous studies indicated that the 110R hybrid rootstock had a strong drought tolerance with its deep-growing and well-branched root system in the field [9,11], and the root hydraulic conductivity is also very important [10] to overcome soil drought conditions. A cyclic correlation is generated between the shoot and the root system: the behaviour of the shoot depends on the substances absorbed and synthesised by the root (hormones), and the behaviour of the root system depends on the substance synthesised in the shoot. This correlation is modified in graft plants. Indeed, the graft of scion onto a rootstock generates a new individual with two different genotypes, whose behaviour will depend on the mutual interaction between them. Therefore, the same scion genotype may have a different result when grafted onto two different rootstocks in the same cultivation conditions. Climate change is upsetting the established relationships between plants and the environment, and the use of rootstock should be re-evaluated using the new technology available. Indeed, evaluations of drought tolerance induced by rootstocks have been based primarily on vegetative vigour (trunk circumference), fruit attributes (berry size, berry colour estimate, total soluble solids, and total acids) and yield [12]. More recent studies have incorporated physiological indicators, such as stomatal conductance [13,14], leaf water potential [15,16,17,18], root hydraulic conductivity [10], and recently, sap flow measurements [19]. The sap flow with HFD (heat field deformation) technology allowed the more accurate study of water pathways in the xylem and hence a more accurate evaluate of drought resistance. During the day, water moves from the roots to the canopy, and there is subsequent loss to air (daytime transpiration (Ed)). During the night, there can be two water pathways: from the roots to the canopy, with subsequent loss to air (nighttime transpiration (En)), and movement from one part of the root system to another, with subsequent loss to the soil (hydraulic Redistribution (HR)) [20]. In this trial, two hybrid rootstocks [(V. berlandieri Planch × V. rupestris Scheele) and (V. berlandieri Planch × V. riparia L.)] were compared to evaluate the ability to extract water from the soil and the effect on the yield and grape quality of a table cultivar in a Mediterranean environment, where temperatures in recent years have increased. Furthermore, a new approach based on sap flow measurement integrated with a tomograph image was used to evaluate plant water consumption with the goal of saving water in the context of climate change.

2. Materials and Methods

2.1. Experimental Site, Plant Material and Experimental Design

The experiment was conducted over two years (2021–2022) on Maiorana Farm, in Curinga (CZ), Italy (38°51′42.8″ N, 16°15′45.8″ E). The table grapevine plants of the Cardinal cultivar were grafted onto 110R (Vitis berlandieri Planch × Vitis rupestris Scheele) and SO4 (Selection OPPENHEIM 4) (Vitis berlandieri Planch × Vitis riparia L.) rootstock and were planted in the spring of 2006 in subacidic (pH 6) sandy soil, containing 2.12% organic matter and 1.6 g·kg−1 nitrogen content. The plants were spaced 2 m × 2 m apart (2500 plants ha−1), and the vines were trained to the Tendone system with 4 cordons, and spurs pruned to two buds. Water was administered every two days with 4 drippers per plant at 4 L.h−1 per 1 h (16 L.day−1) every three days. Cardinal grape is a popular table grape. It was obtained by E. Snyder and F. Harmon in 1936 at the Horticultural Field Station in Fresno, California (USA), and is considered among the best red table grapes [21,22].
The Cardinal has a strong vigour and a horizontal bearing. It can be pruned short and must be trained. It is susceptible to millerandage and coulure. It is susceptible to phomopsis and to downy mildew. Harvest happens nine days after Chasselas, while the grape maturity occurs very early season, 1 week before Chasselas. The bunch is large, and loose, with a long and not very lignified peduncle. The berry is very large, but irregular in colour. The skin is moderately thick, and the pulp is firm. This simple-flavoured variety displays interesting gustatory qualities. Finally, the berry is susceptible to bursting. The Cardinal grape is a valuable source of group A, B, and C vitamins. Tannins are found exclusively in the peel as well as polyphenols [21].
The 110R (I-VCR 114) rootstock was obtained from Richter by hybridizing Berlandieri Rességuier No. 2 with Rupestris Martin. It is resistant to phylloxera cryptogamic diseases, while its resistance to Meloidogyne incognita and Meloidogyne arenaria nematodes is medium.
It is moderately adapted to limestone and its resistance to iron chlorosis is variable depending on the grafts used. It can resist up to 17% of ‘active’ limestone and has a soil chlorosant power (SPC) of 30. This rootstock is very well adapted to drought, but is very sensitive to water excess. It is particularly adapted to dry, poor, stony, with no or very little limestone soils.
The 110R confers a strong vigour, induces good fertility, and delays the growth cycle and maturation. Furthermore, it roots fairly easily and has shown no inconvenience in grafting with European vines [22].
The rootstock named SO4 (Oppenheim 4) was selected by Sigmund Teleki and Heinrich Fuhr in 1896 in Germany. It belongs to the series of rootstocks derived from V. berlandieri × V. riparia Teleki. The clone used in the vineyard under consideration is I-ISV-VCR 105. It is a medium-vigour rootstock that can also be appropriately used in heavy soils, as long as it is not asphyxiated or excessively chlorotic.
Regarding abiotic factors, this rootstock resists up to 35% of ‘total’ limestone, 17% of ‘active’ limestone, has an SPC of 30, and its resistance to iron chlorosis can thus be considered moderate. Therefore, it is well suited to acidic soils and it is fairly tolerant to chlorides. Its use is not recommended for varieties susceptible to rachis desiccation and in soils with an unbalanced ratio of magnesium, potassium and calcium. The resistance to drought is moderate, but its adaptation to humidity is low to medium. The SO4 is quite compatible with grafts. The varieties grafted onto SO4 have high yields, starting from the first years after planting. Finally, SO4 induces good sugar content in the fruits [22]. The experiment consisted of three blocks, with four vines per block and per graft combination.

2.2. Phenological Surveys

The main phenophases were monitored every week, using the BBCH scale (Biologische Bundesanstalt, Bundessortenamt, and Chemical industry). The observations were started on 3 March 2021 and 4 March 2022 (BBCH 00) and concluded on 22 July 2021 and 22 July 2022 (BBCH 89), respectively. Shoot growth was monitored every week on alternating spurs distributed on two cordons oriented east and west. For each shoot measured, the number of nodes and the number of anticipated shoots (lateral shoots) were detected before harvesting; at this time, a sample of 24 leaves (2 leaves per plant were randomly selected) was taken from each graft combination, and the leaf area was determined in the laboratory using an area meter (Li-Cor 3100, LI-COR, Lincoln, NE, USA). Finally, the leaf area per shoot, leaf area per plant, and the LAI (Leaf Area Index) were calculated.

2.3. Gas Exchange and Radiometric Measurements

The gas exchange and PPFD (photosynthetic photon flux density) measurements were carried out on a clear sunny summer day (from 11:00 a.m. to 01:00 p.m.), on four days during the last week of the summer months (June, July, and August) in both years. Gas exchange measurements (net assimilation of CO2, (Pn), stomatal conductance (gs), and internal CO2 concentration (Ci)) were performed on completely developed leaves located in the central layer of the canopy (six leaves × four plants × three blocks) using a portable photosynthesis system (Li-Cor 6400XT; LI-COR Biosciences, Lincoln, NE, USA). Subsequently, on the same leaves, the SPAD index was measured using a SPAD 502 instrument (Spectrum Technologies Inc., Aurora, IL, USA). It was possible to measure the PPFD inside the canopy as well as the radiation that reached the ground. The measurements were conducted at noon on the last day of July, with a clear sky using a SunScan Probe (Mod. SS1, Delta-T Devices Ltd., Burwell, Cambridge, UK).

2.4. Tomography Measurements

The distribution of the conductive and resistive areas of the xylem was obtained using a tomograph (Picus TreeTronic3®, Argus, Berlin, Germany, UE) on the vines of the two grafted combinations. The electrical resistance of the wood is influenced by the moisture content of the wood tissue. In the course of the scans, the instrument transmits electrical voltages (Ω, ohm) to the wood up to 100 volts at all measuring points (PM) (up to 24) positioned around the circumference of the sample tested. The tomograph 5 software calculated the apparent electrical resistance of the xylem and output it as a tomograph, a 2D colour map.

2.5. Leaf Water Potential

The leaf water potential (ΨL) was determined on the same leaves on which the gas exchange and fluorescence measurements were conducted. The leaf water potential was expressed in units of pressure (bar) using a Schölander pressure chamber (PMS Instrument Company, Albany, OR, USA).

2.6. Sap Flow–HFD

A Sap Flow Meter HFD8-100s (ICT International, Armidale, NSW, Australia) was installed for xylem flow measurement. The HFD technique combines the most advantageous features of the previously developed methods, measuring asymmetric and symmetric temperature gradients (dTsym and dTas) around a heat source, and avoiding the limitations associated with the arrangement of previous sensors. In addition, the sensor configuration using the HFD method involves placing the upper thermometer of the asymmetrical thermocouple next to a heater, which allows it to track the heat dissipation and deformation in both the axial and tangential directions around a linear heater. The Sap Flow Meter HFD8-100 can measure high sap flow rates as well as low to zero and reverse sap flow. The needles have sensors distributed on all lengths with a spacing of 5 mm between them.
The HFD technique was first developed by Nadezhdina and is described in several papers [23,24,25,26].

2.7. Total Sap Flow Measurement

The measurement of the xylem flow detected by the Sap Flow Meter HFD8-100 was expressed in cm3.cm−2.h−1. The average value detected by the various sensors distributed every 0.5 cm along the probe (needle) of the Sap Flow HFD was calculated, which was then averaged over the entire day. This last parameter was multiplied by the conductive area (detected and determined with the tomograph) and was used to calculate the daily total sap flow.

2.8. Harvest

The yield per plant (weight and grapes number) was determined at harvest. Two grape bunches per vine (8 grape bunches per block per graft combination = 36 grape bunches per graft combination) were randomly collected and taken to the Colture Arboree Laboratory, AGRARIA Department, at the Mediterranean University of Reggio Calabria.

2.9. Winter Pruned

Each year at the end of January, the pruning material was weighed per plant.

2.10. Biometric Measurements, Maturation Indexes, and Nutraceutical Parameters

The fresh weight (FW) of the clusters and the rasp was determined using an analytical balance (BJ 610C, Precisa Instruments AG, Dietikon, Switzerland). For each grape bunch, the berries were detached, and the fresh weight of the rasp was measured. Furthermore, 100 berries were randomly taken per plant and were used to determine the height (H), diameter (D), and fresh weight using an electronic balance (Mettler-Toledo, Grelfensee, Switzerland). For each berry, the veraison surface was determined, for which purpose a scale of values was prepared: 0 (0% of the surface area covered), 1 (<50% of the surface area covered), 2 (>50% of the surface area covered), and 3 (100% of the surface area covered). Five groups of ten berries were used to extract juice. The juice was used to measure the total soluble solids (TSSs), using a handheld digital refractometer (PR-1; Atago, Tokyo, Japan), and titratable acidity (TA), using 10 mL of juice diluted with distilled water (1:1) and titrated to pH 8.2 with 0.1 N NaOH (%). The TSS/TA ratio was calculated. On five other groups of ten berries, the analyses of the total polyphenol content (TPC) and the total antioxidant capacity (TAC) were performed. The pulp portion (20 g), removed before juice extraction, was homogenized using an Ultraturrax blender (20.000 rpm, T 25 Basic; IKA, Werke, Germany, UE). The TPC and TAC were analysed separately using a Lambda 35 spectrophotometer (PerkinElmer Corporation, Waltham, MA, USA). Before measuring the TPC and TAC, standard curves were prepared for each test. The TPC (mg gallic acid equivalents g−1 FW) was determined using the Folin–Ciocâlteu method [27]. The TAC was determined using the modified TEAC assay and expressed as mmol Trolox, equivalent to g−1 FW [28,29].

2.11. Statistical Analysis

All data were subjected to two-way ANOVA tests (treatments and years), and the means were compared by using Tukey’s test when the ANOVA indicated significant (p ≤ 0.05) variable effects. All data analyses were performed using IBM® SPSS® Statistic version 22 (SPSS Inc. IBM Company, Armonk, NY, USA).

3. Results

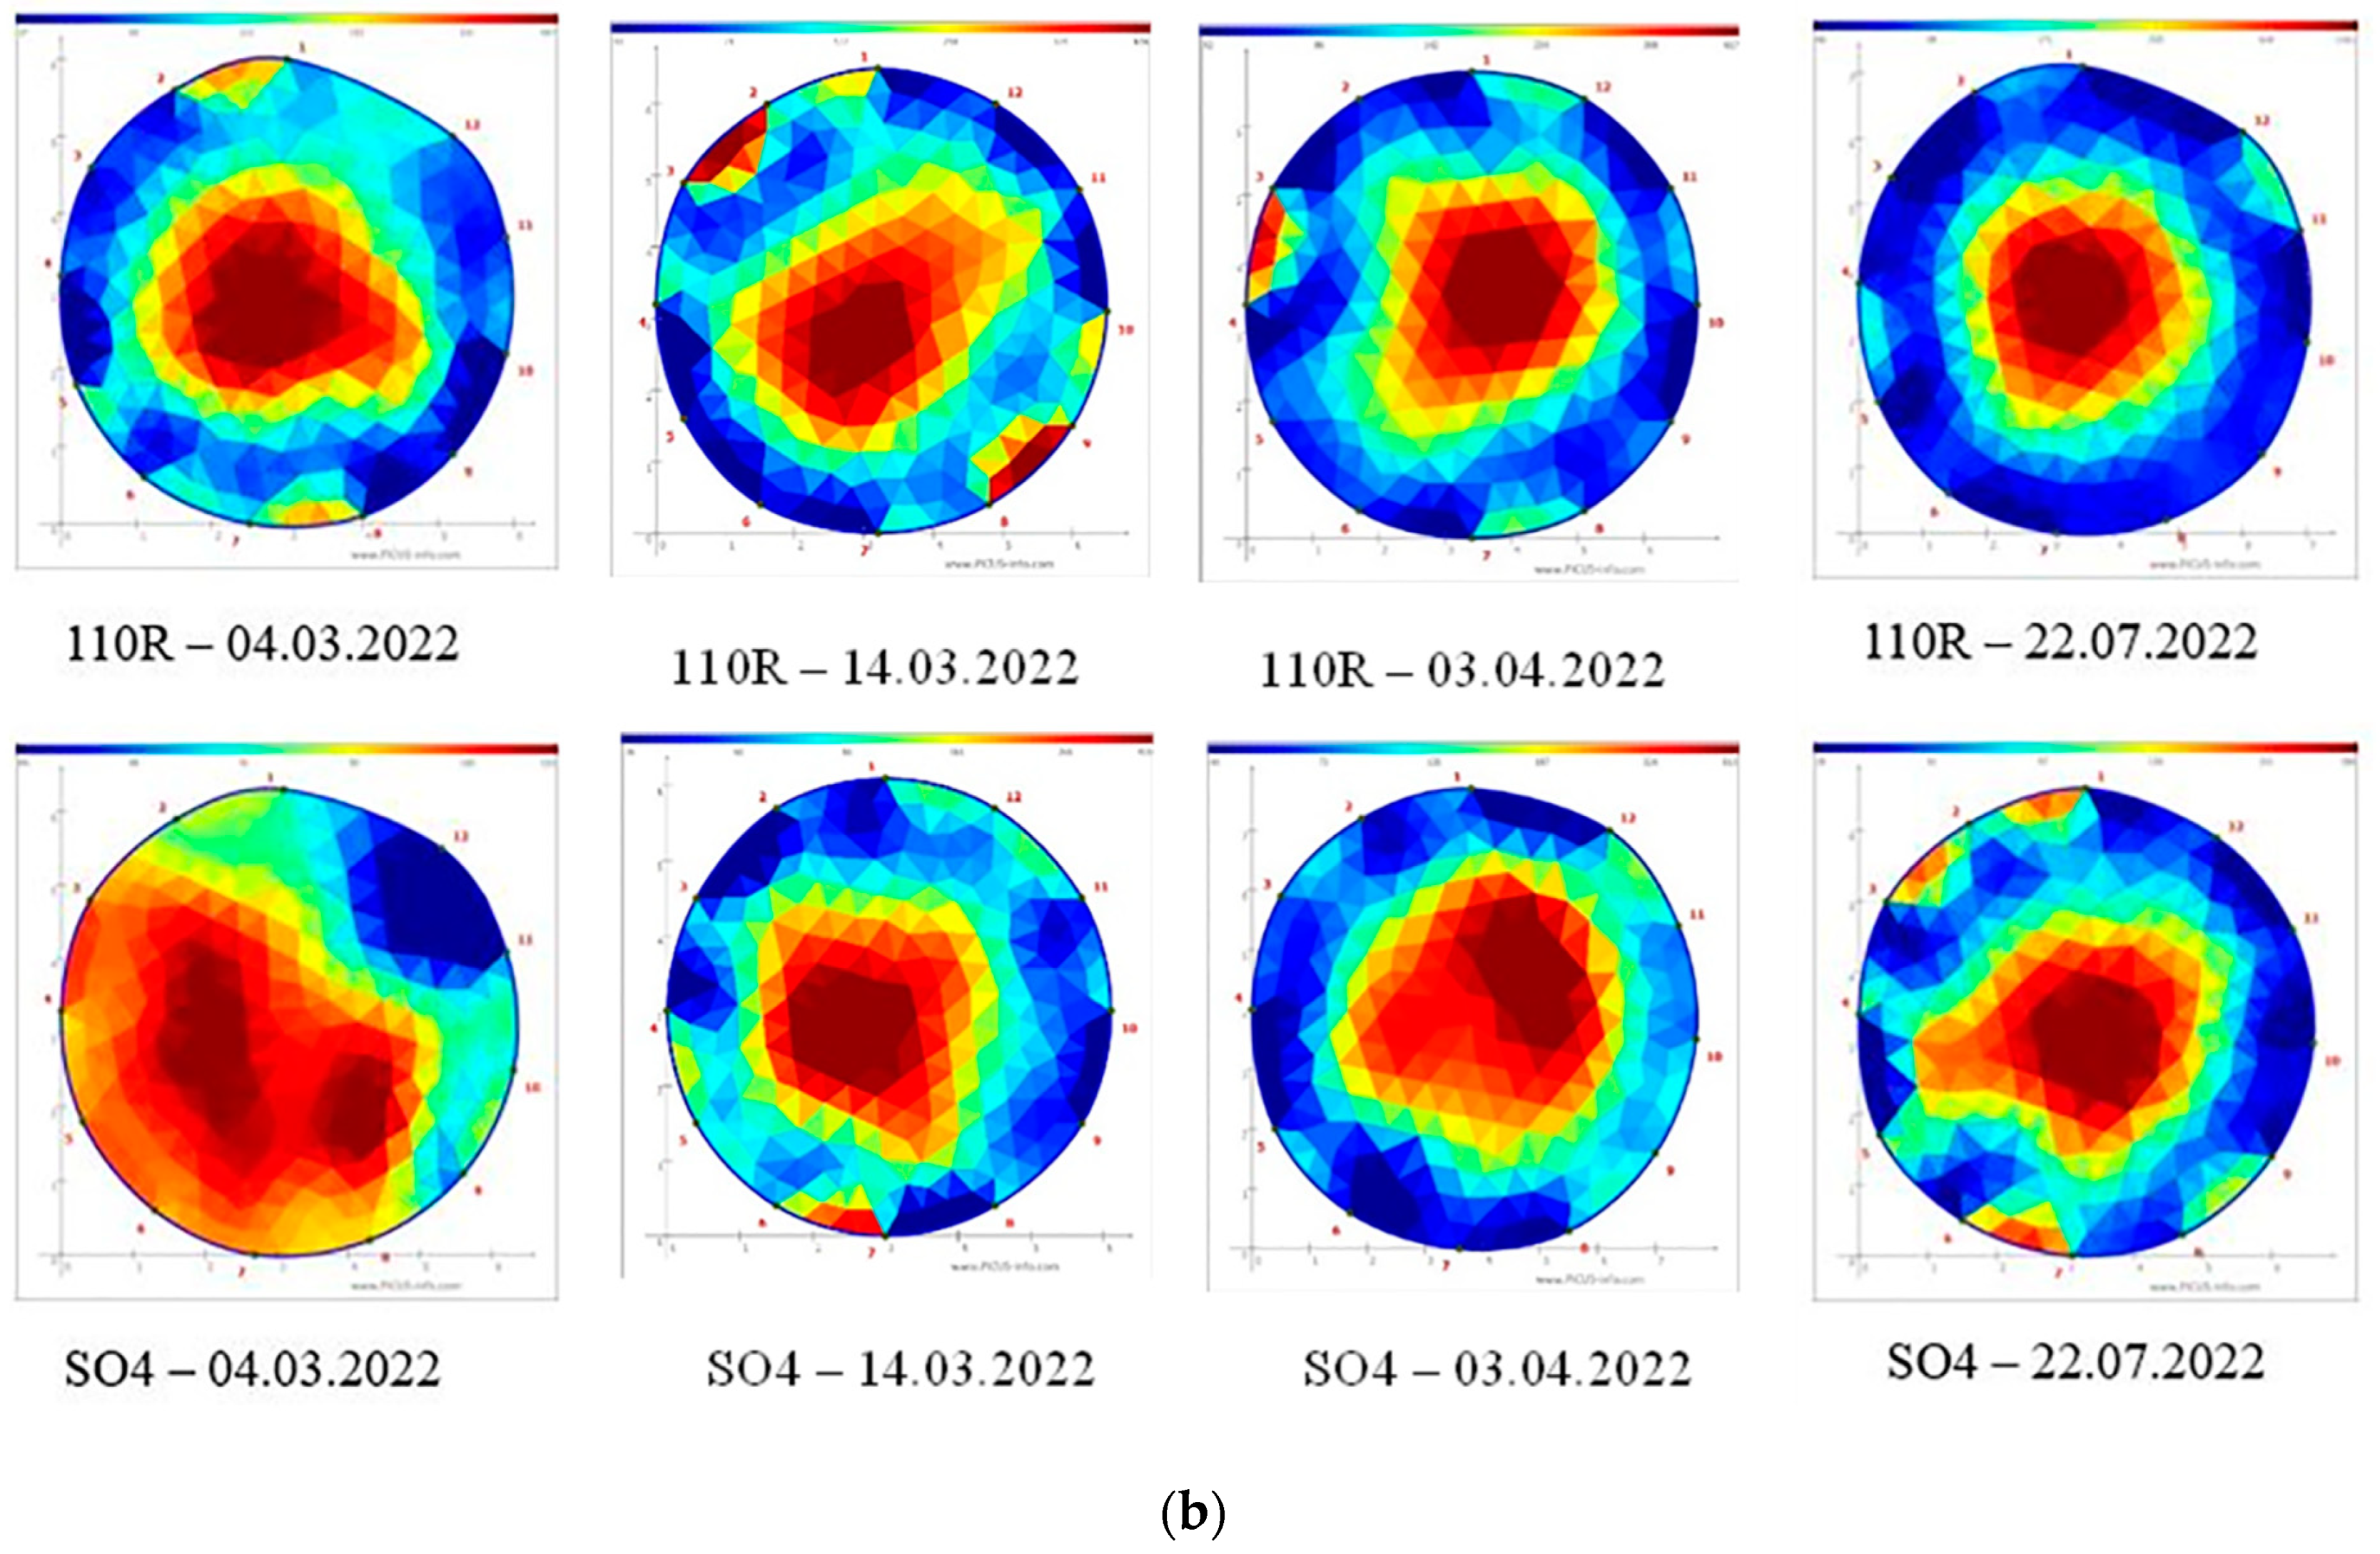
3.1. Conductive Xylem Area

No difference was observed with regard to the total xylem area between the two graft combinations. The water refilling showed the conductive xylem area. An earlier water refilling of the xylem (more bluish area compared to the reddish area in the tomographs), Figure 1, was observed in the Cardinal grafted onto 110R than in those grafted onto SO4 in the first ten days of March in both years.
In particular, the Cardinal onto 110R showed a refiling of the conductive xylem area (CXA) of 66% in 2021 and 61% in 2022, whereas the CXA was significantly lower in the plants grafted on SO4, 49% and 44% in 2021 and 2022, respectively (Table 1). Regarding the second ten days in March 2021, the tomographs showed an increase in the CXA in C/SO4 compared to the previous survey, reaching 54% of the total xylem area (Figure 1; Table 1). Instead, at the same time, the CXA value in Cardinal onto 110R was similar to the previous survey; however, it was still significantly higher than the C/SO4 graft combination (Table 1). This trend was observed in the next year too. At the end of April, the conductive area was always significantly higher in the C/110R than in the C/SO4 (Figure 1, Table 1). Finally, in the third ten days of July, the conductive xylem area was not different between the two graft combinations (Table 2).

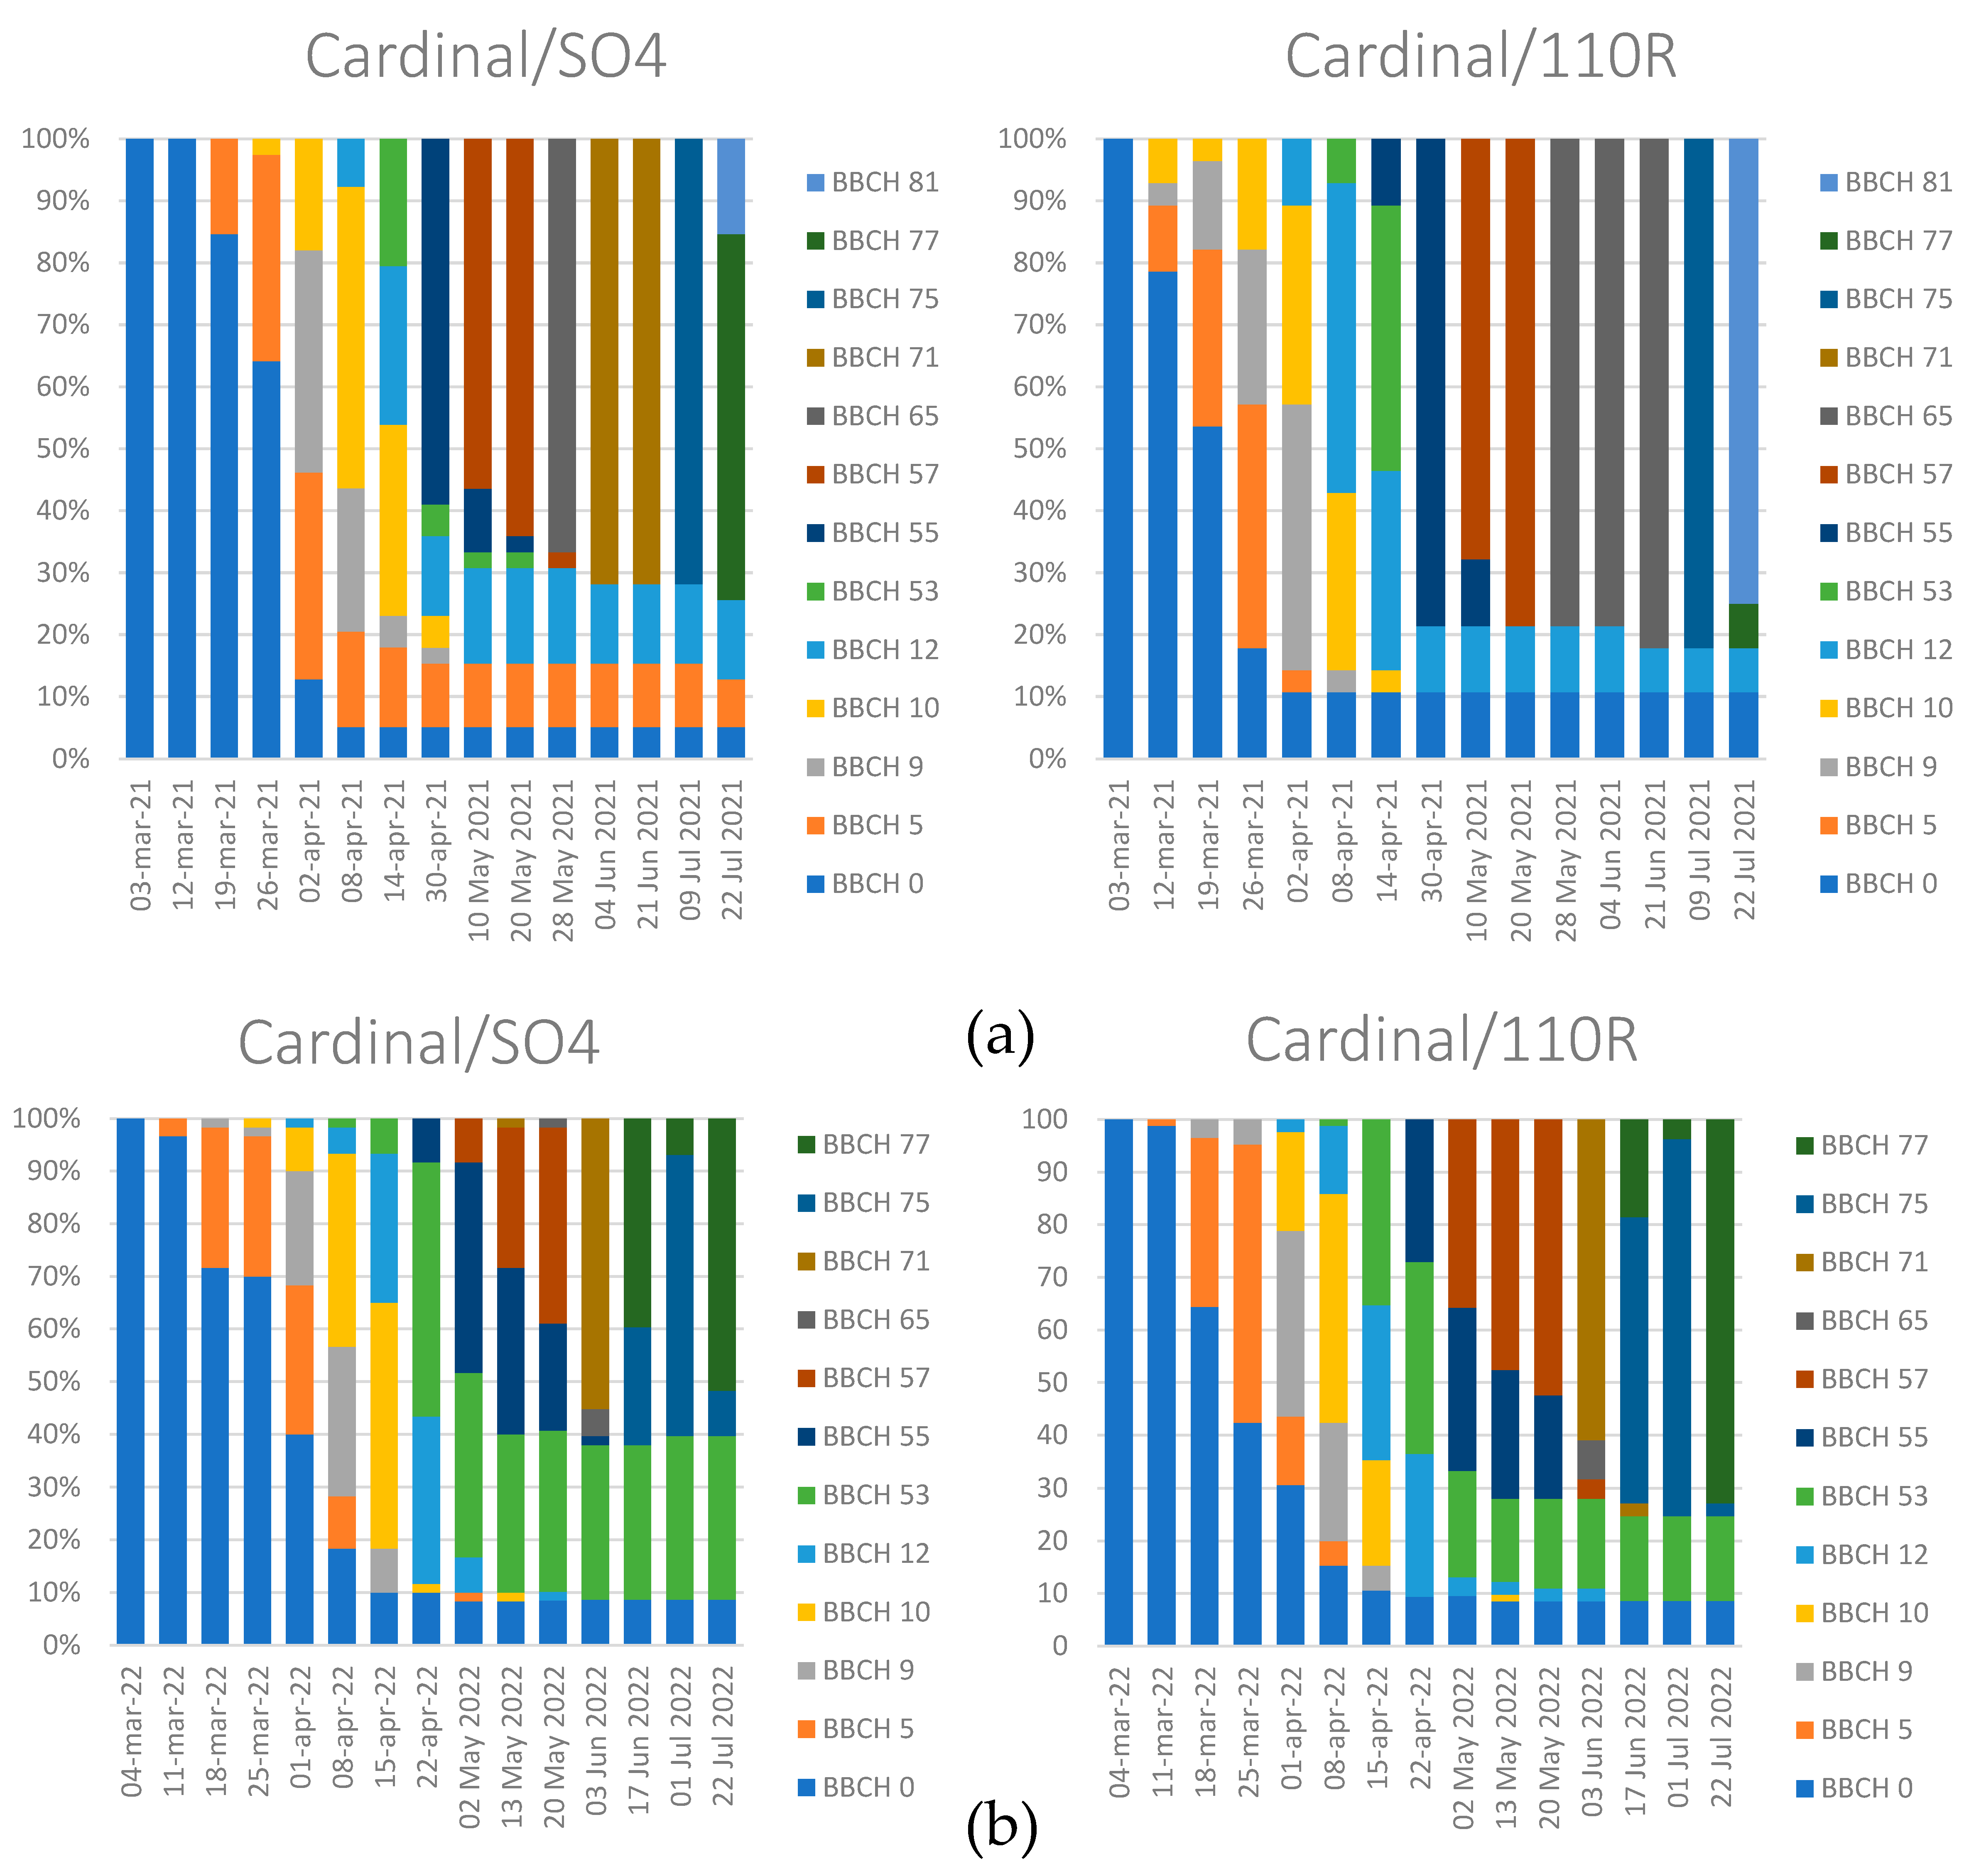
3.2. Phenophase Evolution

At the first ten days of March, no difference was observed in the phenological stage between the two graft combinations in the two years. Indeed, the buds were at BBCH 0 ‘winter bud’ in both grafting combinations (Figure 2). The differences in phenophase evolution between the two graft combinations were clear at the beginning of the second ten days of March in the first year and at the end of the second ten days of March in the next year; in fact, in the C/SO4, 15% and 27% of the buds were in the BBCH 5 phase in 2021 and 2022, respectively (Figure 2a,b), whereas in the C/110R, the buds were at a more advanced phenological stage, from the BBCH 5 phase to the BBCH10 phase, at 45% in 2021 and 36% in 2022. At the end of March, 64% and 70% of the C/SO4 buds were in the BBCH 0 stage in the first and second observation years, respectively (Figure 2a,b), whereas the percentage was lower for the alternative graft combination in both years: 18% in 2021 and 42% in 2022 (Figure 2a,b). There was a clear faster bud-break in the 110R than the SO4 at this time. At the end of April, the CXA was always significantly higher in the C/110R than in the C/SO4 (Figure 1, Table 1); however, the percentage of unbroken buds (BBCH 0) was similar between the two graft combinations. At the same time, the percentage of buds in the BBCH 55 stage was 20% higher in the C/110R than in the C/SO4 (58.97%) in the first year (Figure 2a), whereas the BBCH 55 stage was always higher in the C/110R (27.06%) than in the C/SO4 (8.33%) (Figure 2b) in the next year. During the first ten days of May, in 2021, the percentage of buds in the BBCH 57 stage reached 56% for the C/SO4, and it was 12% higher for the C/110R (Figure 2a). In the next year, the slow phenophase evolution of Cardinal onto SO4 was also observed. Indeed, the bud percentage at BBCH 57 phase was 26% and 48% in the C/SO4 and C/110 R, respectively (Figure 2b). In the second ten days of May, 64% of the C/SO4 and 78% of the 110R buds were in the BBCH 65 phase in the first observation year (Figure 2a); in the second year, the percentages were 32% and 58% for the C/SO4 and C/110R, respectively (Figure 2b). Therefore, the delay in the evolution of the phenophases was confirmed for both graft combinations. Finally, the percentage of buds in the BBCH 71 stage was 71% in the C/SO4 during the first days of June in the first observation year (Figure 2a), whereas the alternative graft combination had a higher percentage of buds in the more advanced stage (BBCH 75), 82%, on the same date (Figure 2a). In the next year, during the first days of June, the two graft combinations were at similar phenophases. Indeed, 55% and 61% of the buds were in the BBCH 71 stage in the SO4 and 110R graft combinations, respectively (Figure 2b). At the end of July, during the first year, a high percentage (58%) of the C/SO4 buds was in BBCH 77 stage, while 75% of the C/110R buds were in a more advanced stage, BBCH 81 (Figure 2a). In the following year, the percentage of buds in stage BBCH 81 was 20% higher in the C/110R than in the C/SO4 (Figure 2b). Therefore, the different evolution of the phenophases continued to be evident between the two grafting combinations: it was always delayed in the C/SO4 compared to the C/110R, but the percentage of sprouting was not different in both years (Table 3).

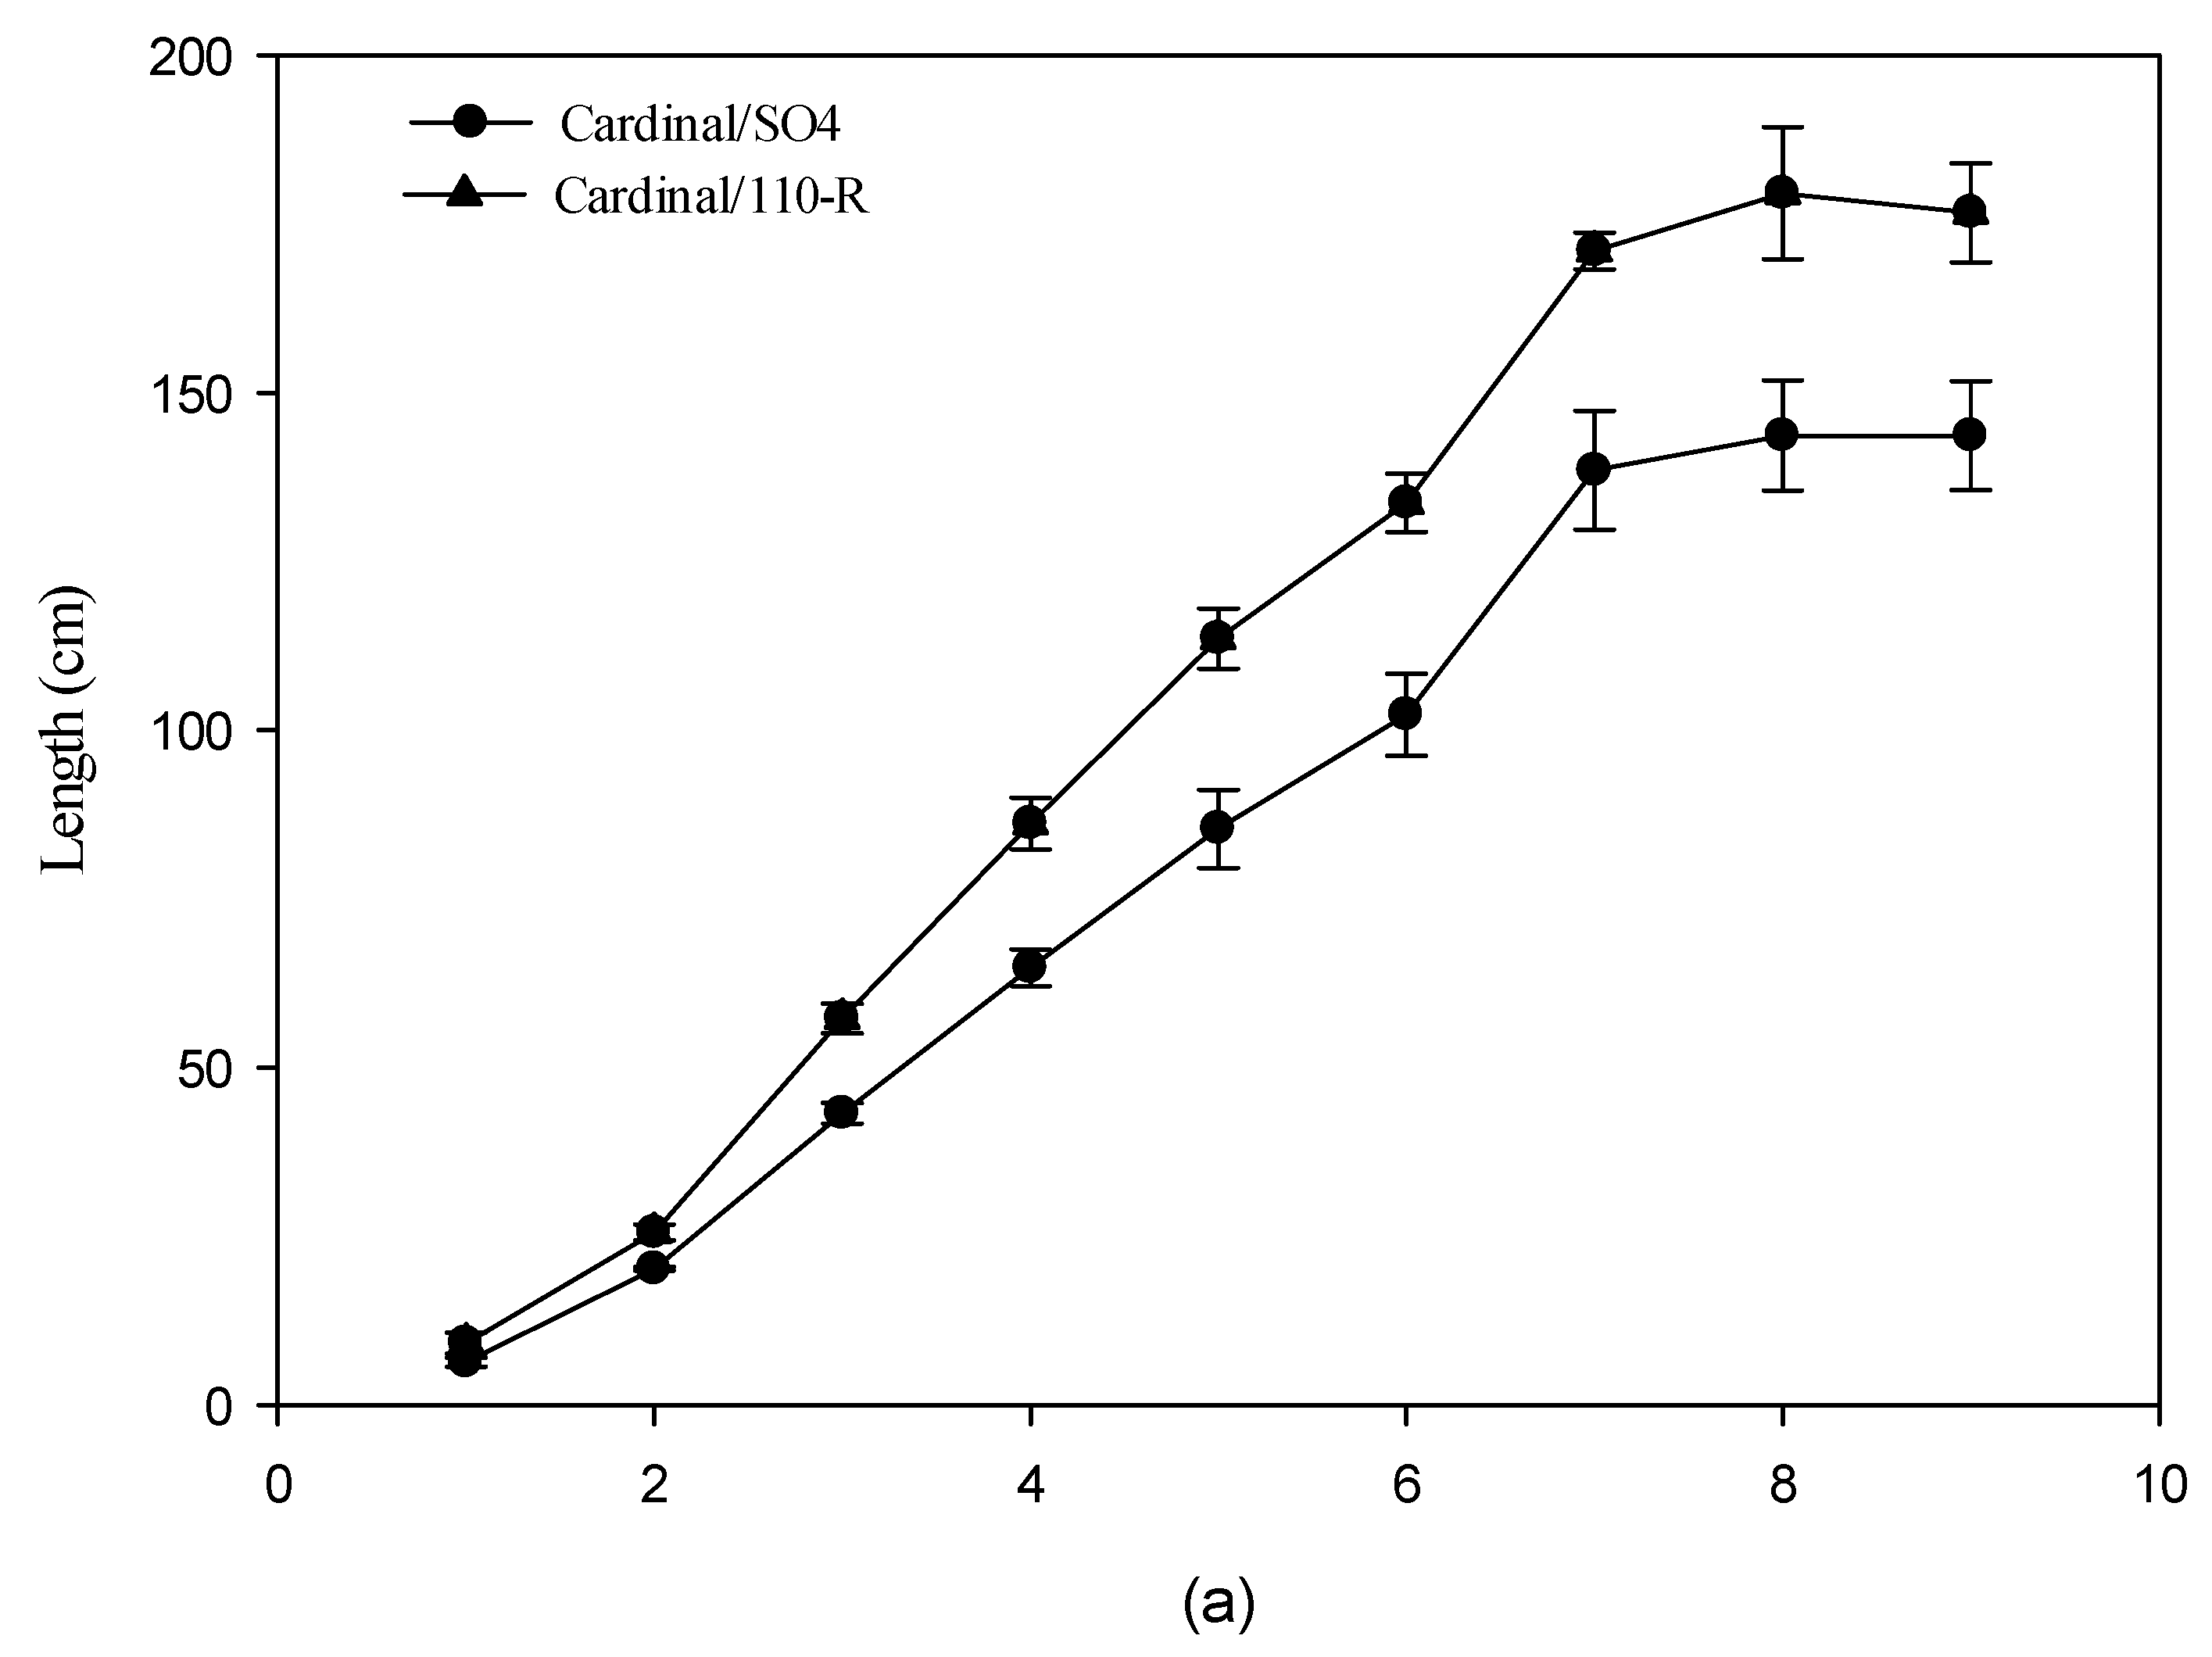
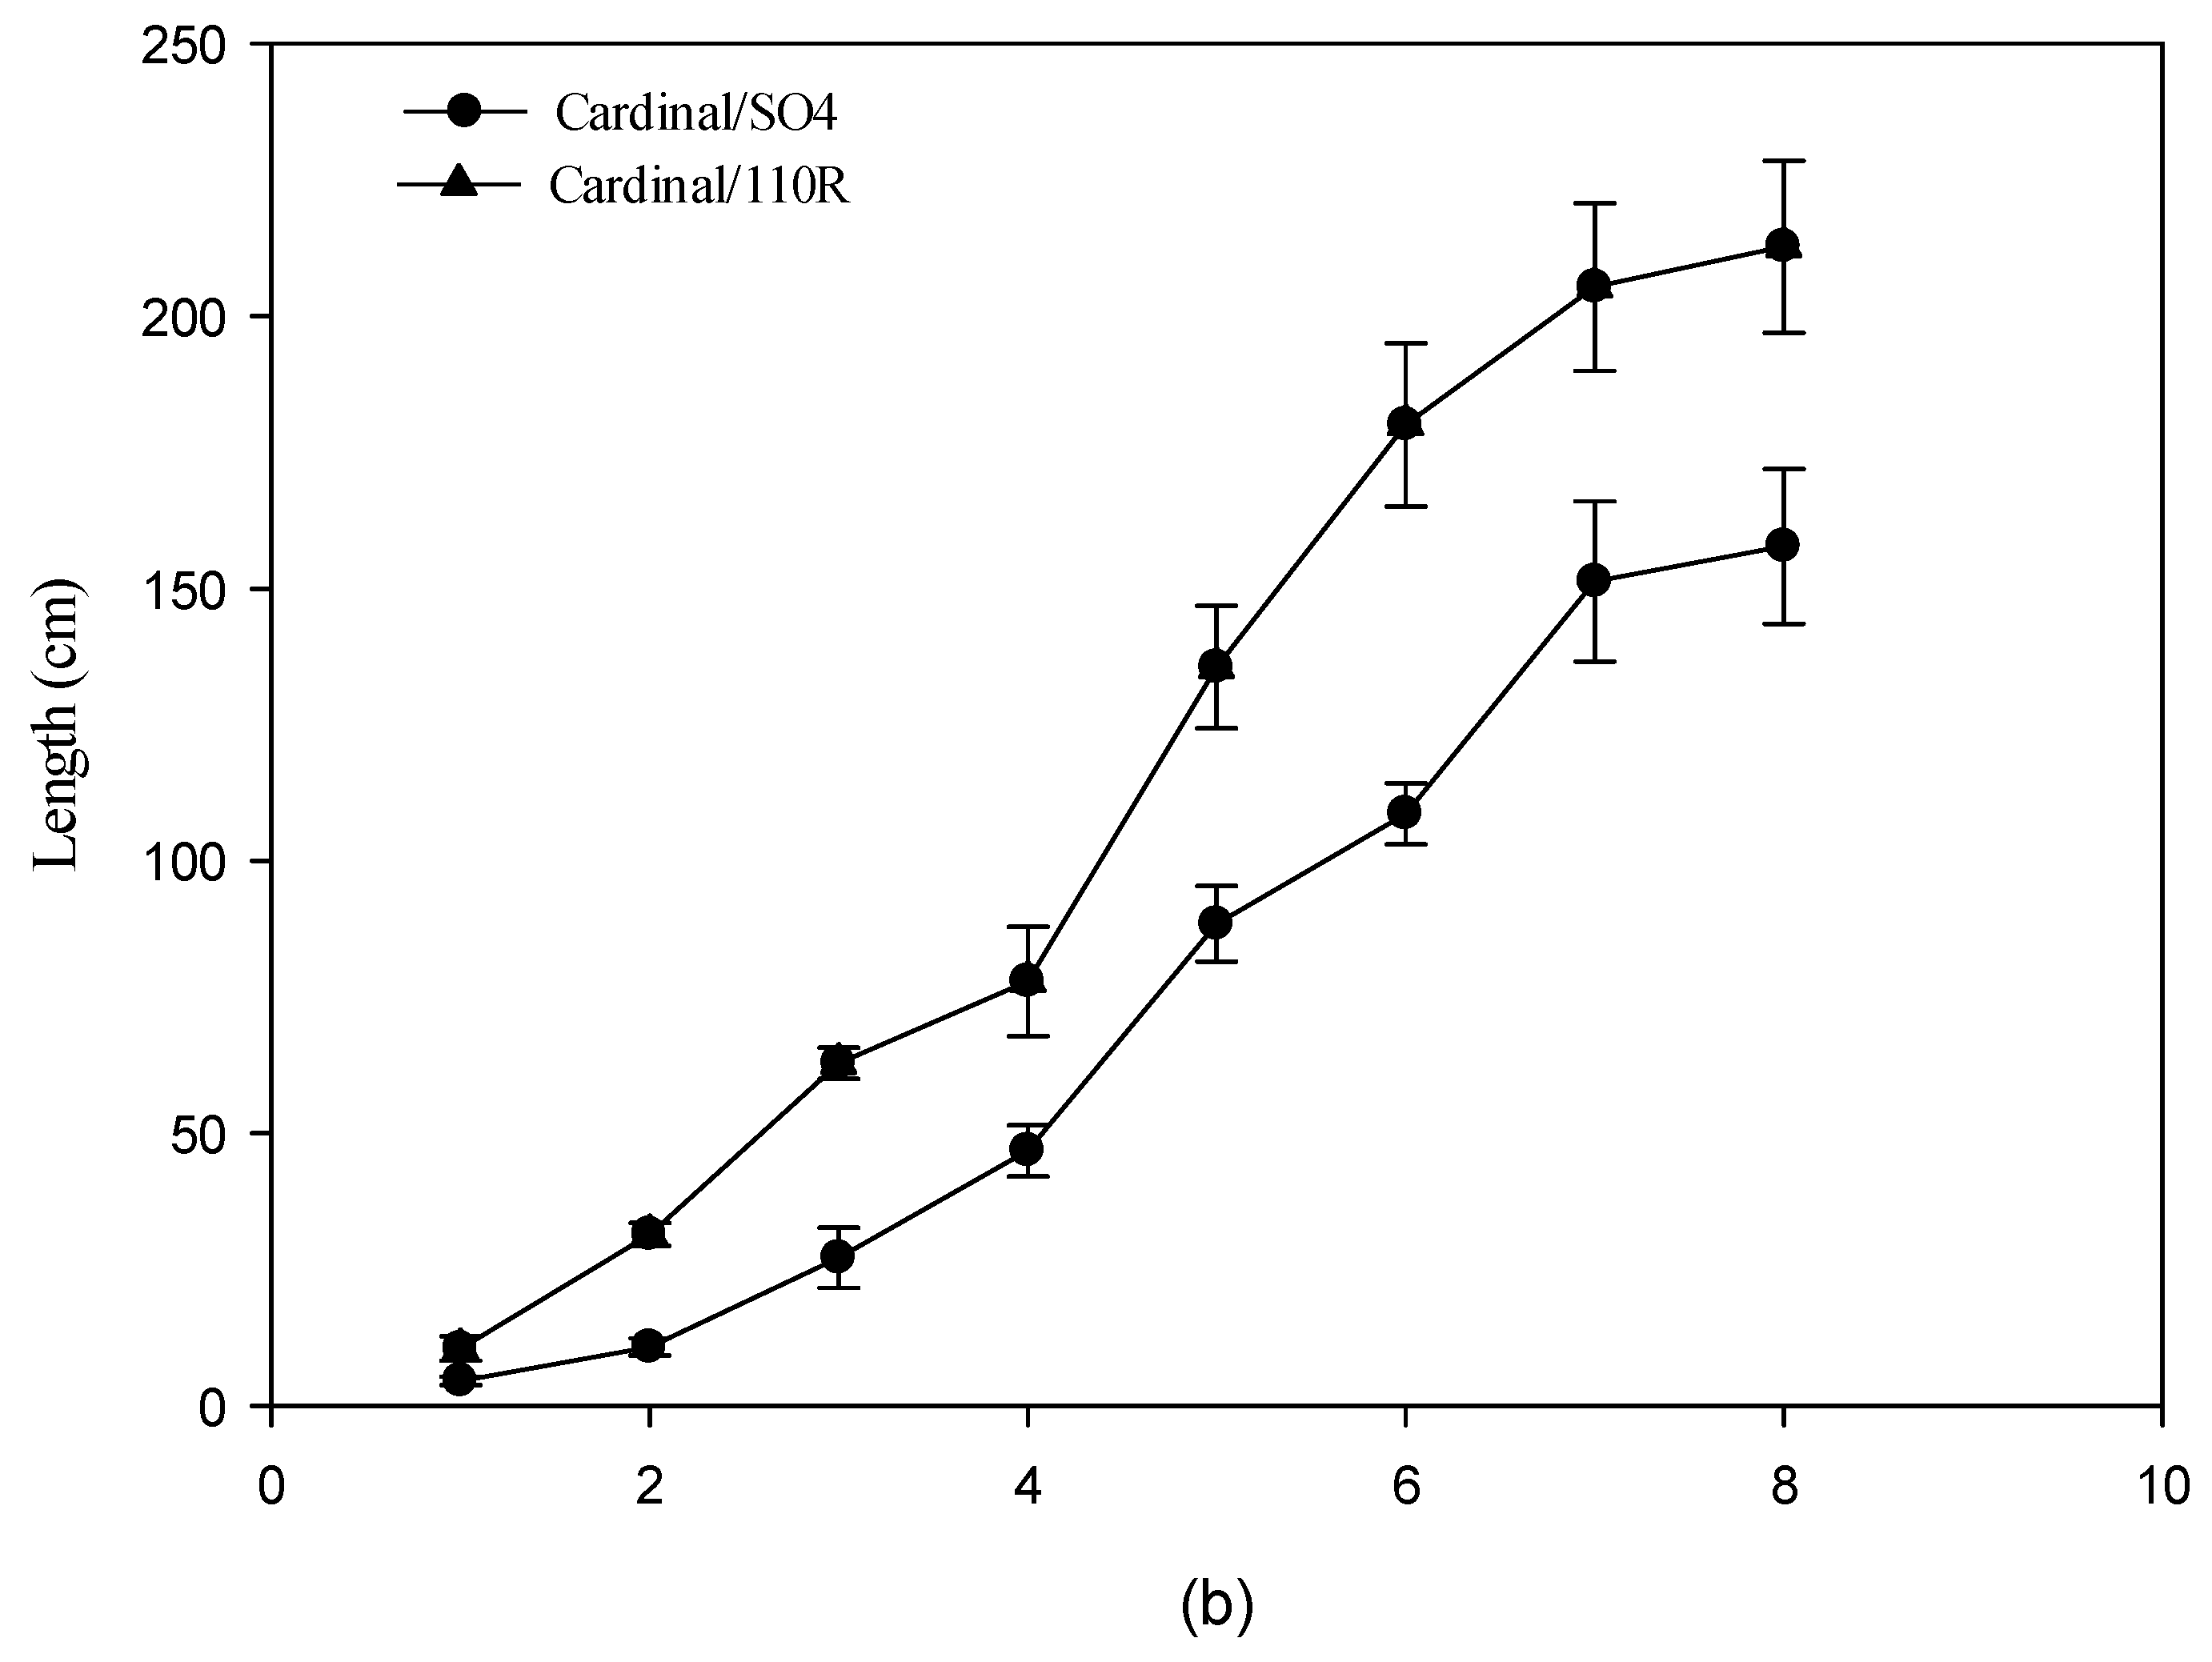
3.3. Vegetative Growth

The shoot growth trend, recorded weekly from the third ten days of April to the third ten days of July, was linear and showed a clear significant difference between the two grafting combinations in both years (Figure 3a,b). The maximum length was reached in the shoot of the Cardinal plants grafted onto 110R. Indeed, the growth stopped around 180 cm (2021) and 210 cm (2022) in the C/110 R (Figure 3a,b), whereas in the alternative graft combination, the shoot stopped its growth at a length of 145 cm in 2021 and at 160 cm in 2022 (Figure 3a,b). The percentage difference in shoot length between the two graft combinations was similar between two years, at about 35%. The final internode length was significantly higher in the C/110R than in the alternative graft combinations (17% and 13% in the first and second year, respectively) (Table 2). The overall number of leaves, overall leaf area per shoot (principal shoot and lateral shoot/s), and leaf area per plant were not statistically different between years (Table 2). The number of leaves and leaf area per principal shoot were significantly higher in the C/110 R than in the C/SO4. In contrast, the leaf number of the lateral shoots and their leaf area were higher in the C/SO4 than in the C/110R (Table 2). Furthermore, the branching of the principal shoot was higher in the C/SO4 than in the C/110R (Table 2). Therefore, the principal shoots of the Cardinal/SO4 were characterised by a significantly higher number of lateral shoots per unit measure of the primary shoot in both years. This aspect is very important because it causes a different architecture inside the canopy of the Tendone system between the two grafted combinations and different light distributions within the canopy. Finally, the total pruned material was significantly different between the two graft combinations; it was higher in the C/SO4 in both years (Table 2).

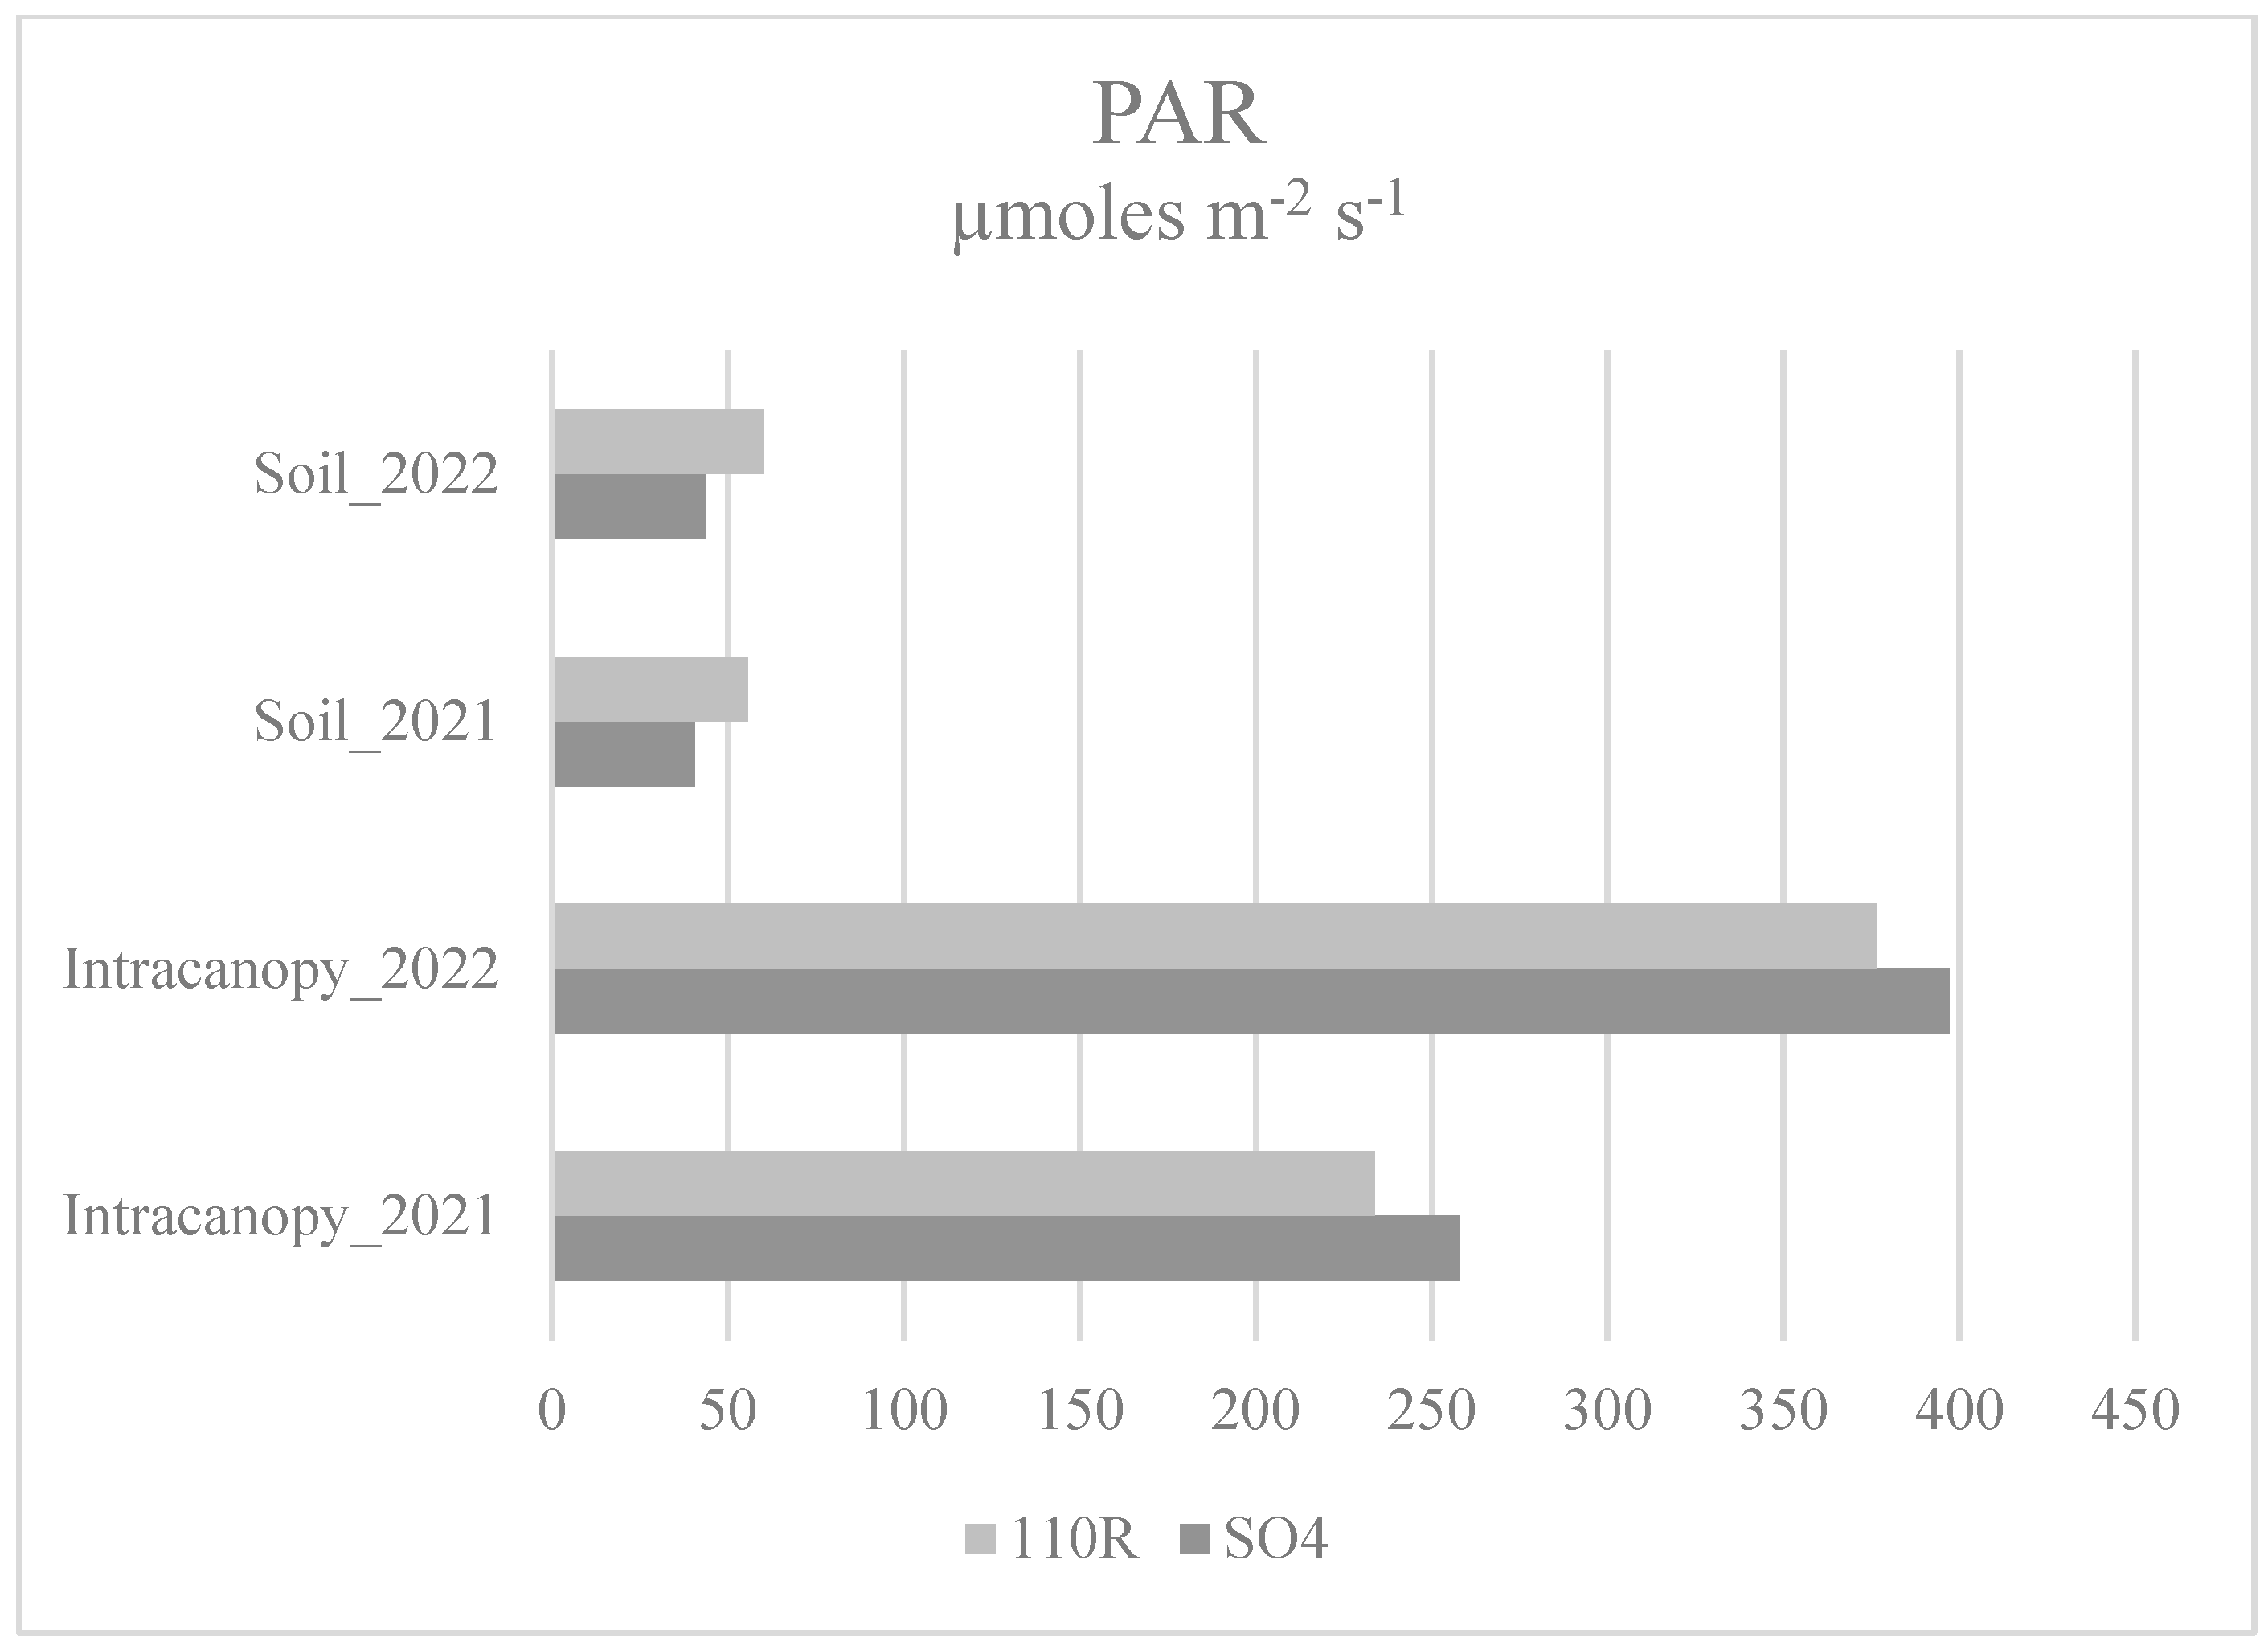
3.4. Light Distribution

The photon photosynthetic flux density (PPFD) measurement showed values that were 53% and 61% higher in the middle layer of the C/110R canopy than those found in the plants grafted onto SO4 in the first year and second year, respectively. The light that reached the soil was also 37% higher in the C/110R (Figure 4) in both years. Furthermore, the temperature measured on the berry surface showed a significant increase of approximately 1.3 °C on the bunches of C/110R than those of C/SO4 as an effect of the higher solar exposition of the berry. This effect was recorded in both years: 29.60 ± 0.29 C/110R in 2021; 28.27 ± 0.164 C/110R in 2022; 28.45 ± 0.33 C/SO4 in 2021; 27.15 ± 0.14 C/SO4 in 2022).

3.5. Gas Exchange Measurement

The Pn was statistically higher in the leaf of the C/110R than that of the C/SO4 in both years (15% and 30% in 2021 and 2022, respectively), as shown in Table 4. The stomatal conductance was also statistically higher in the C/110R graft combination (0.086 mol H2O m−2 leaf area s−1, 2021; 0.090 mol H2O m−2 leaf area s−1; 2022) than in the C/SO4 combination (0.073 mol H2O m−2 leaf area s−1, 2021; 0.072 mol H2O m−2 leaf area s−1, 2022), as shown in Table 5. In addition, the plants grafted onto SO4 showed lower leaf water potential (−5.62 ± 0.15, 2021; −5.37 ± 0.20, 2022) than those grafted onto 110R (−4.56 ± 0.11, 2021, −4.64 ± 0.10, 2022). Furthermore, no differences were observed in the Spad Index. Indeed, the values were similar between the two graft combinations over the two observation years (Table 4).

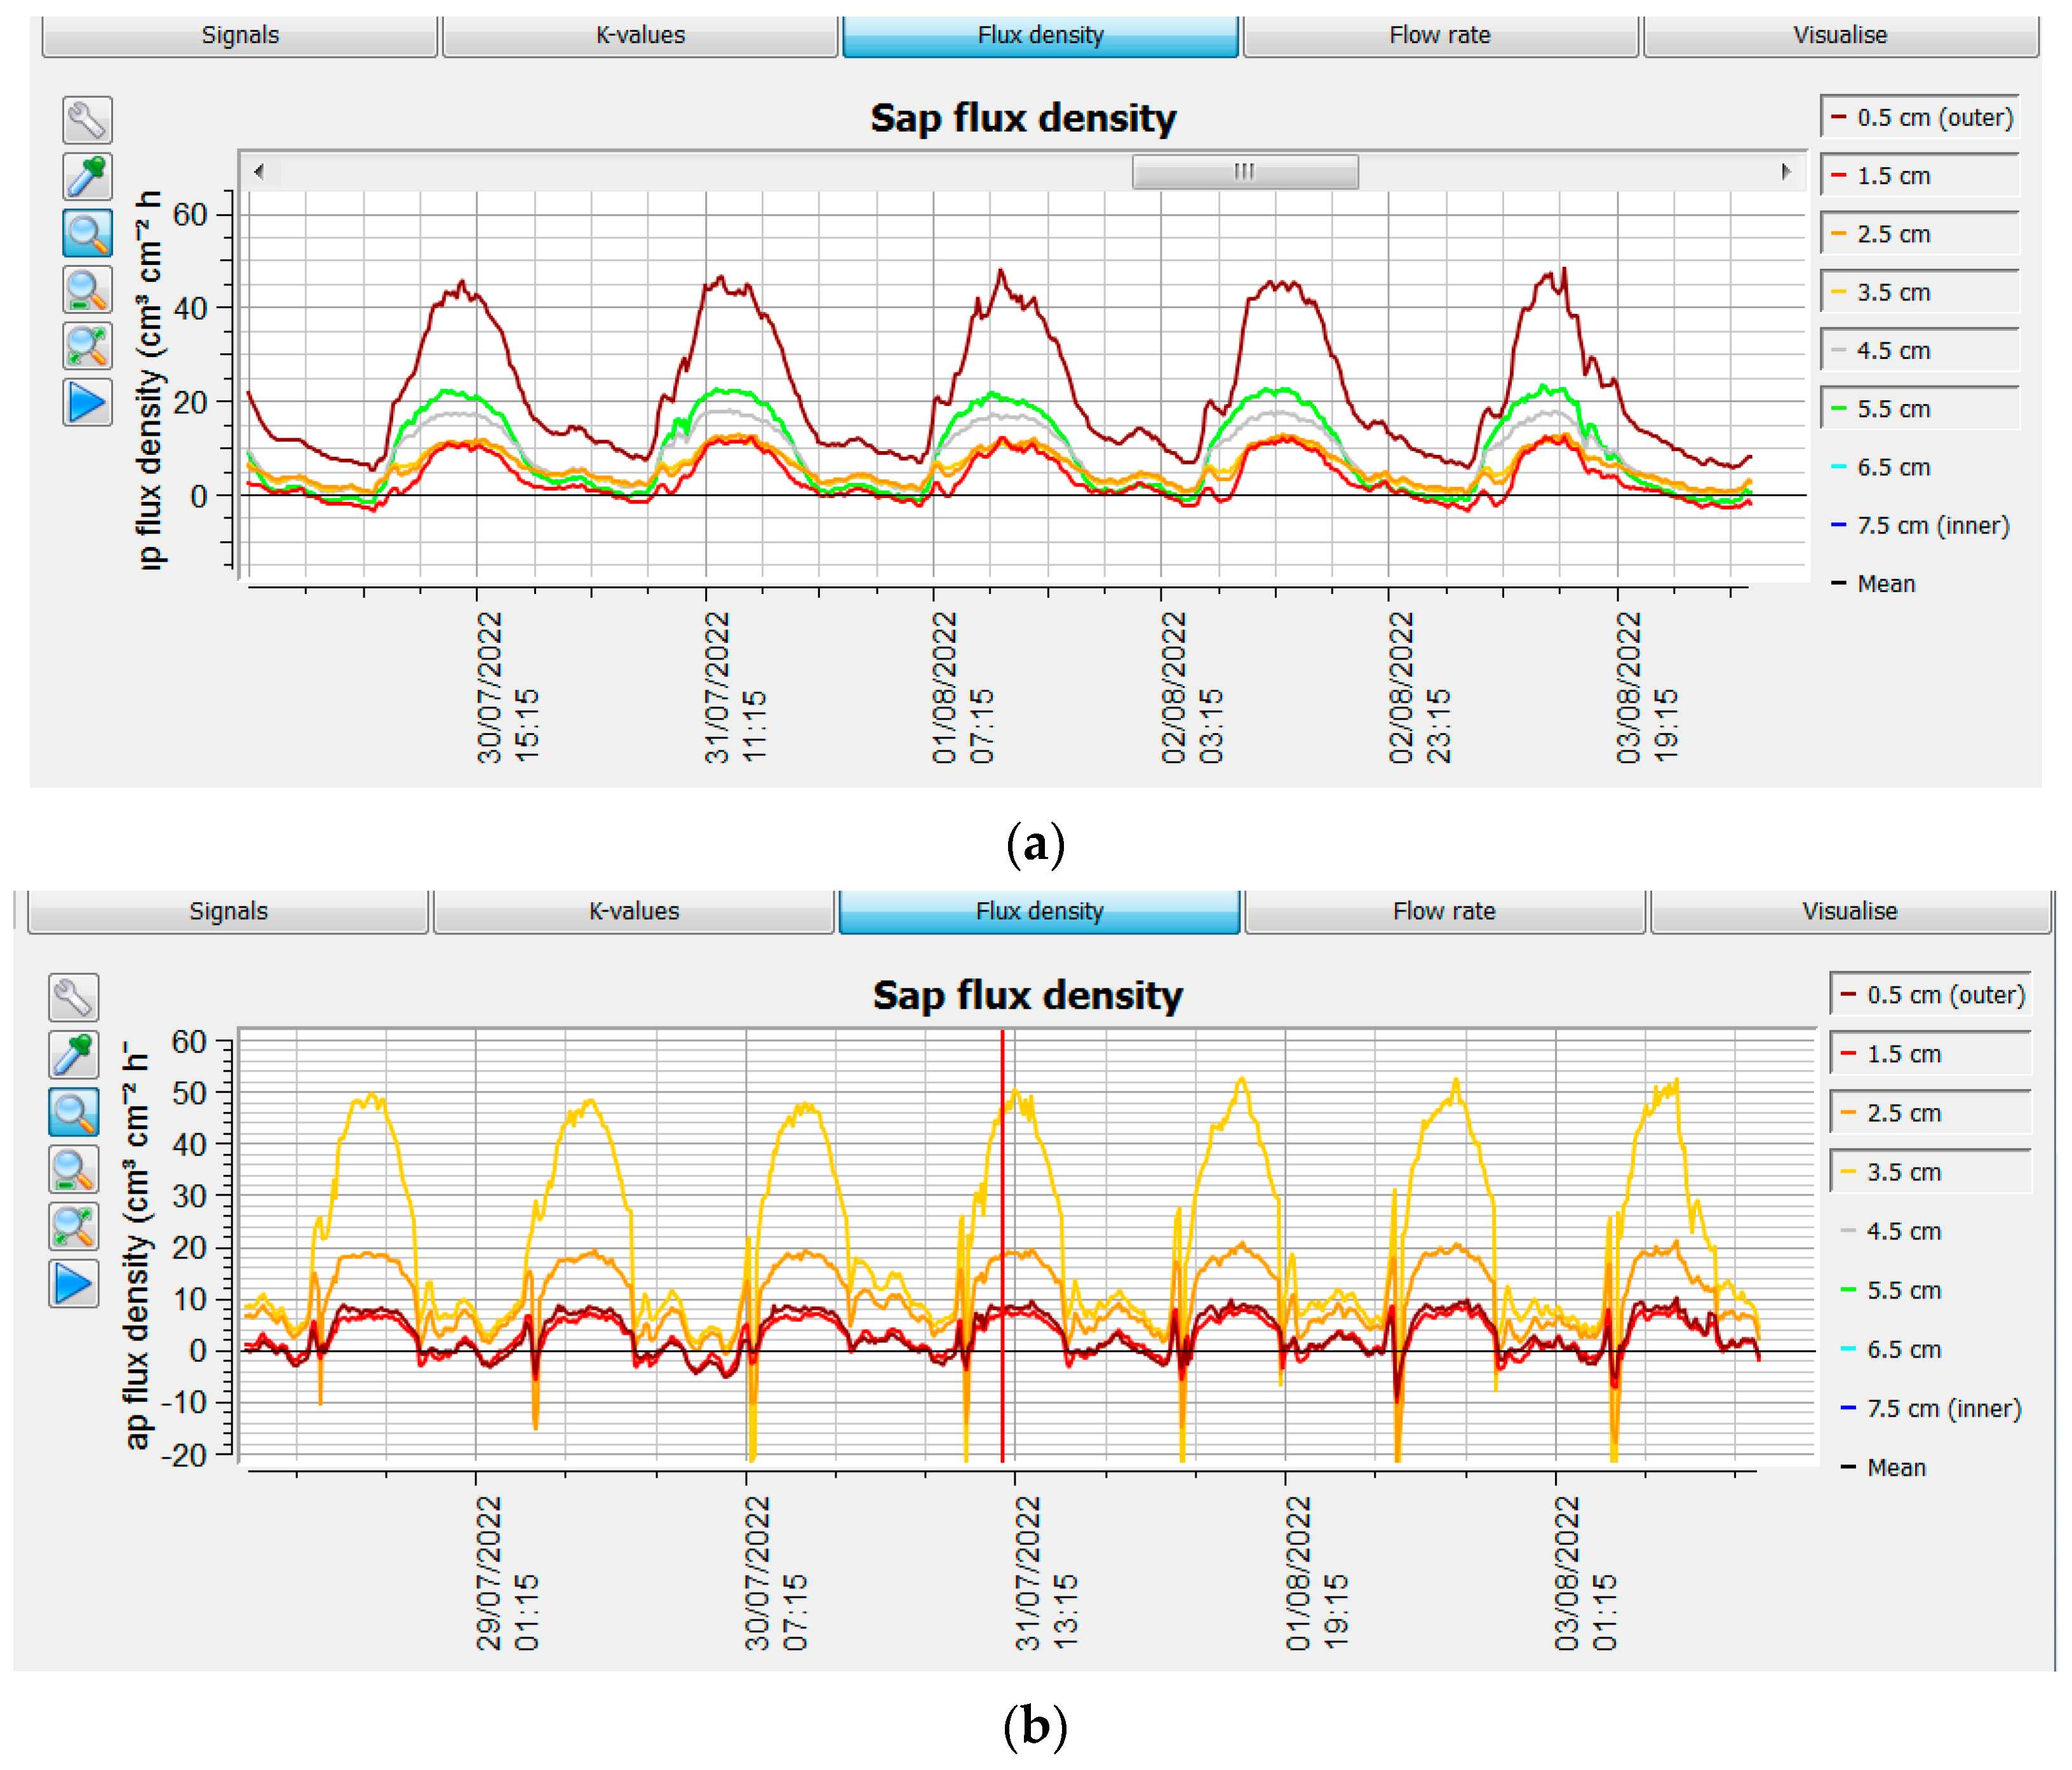
3.6. Sap Flow Measurements

Although no differences were observed in the xylem conductive area at the end of July (Figure 1; Table 1), differences appeared in the sap flow measurements along the needles of the sap flow meter (Figure 5). The higher water uptake of the C/110R than the C/SO4 was confirmed by the data obtained from the plant-based sap flow sensors (Table 3, Figure 5). In the C/SO4, the flow through the sap flow meter needles was only higher at 3.5 cm from the outside to the inside of the xylem, compared to the alternative grafted combination; at other needle points, the flux was always higher in the C/110 R. With the 110R rootstock, the xylem of the Cardinal was active from 0.5 cm to a xylem depth of 5.5 cm, whereas with the alternative rootstock, the flux was detected up to a xylem depth of 3.5 cm (Figure 5). Therefore, the overall flux was higher in the C/110 R than in the C/SO4. Considering the average sap flow measurement, the xylem flow was 20/25 % (2021–2022) higher on the Cardinal grafted onto 110R (25.34 cm3 cm−2 h−1), compared to the Cardinal grafted onto SO4 (20.33 cm3 cm−2 h−1) (Table 4). Then, it was possible to quantify the real transpired flux of the plant per day: the sap flow was 12.33 L.plant−1.d−1 and 11.74 L.plant−1.d−1 in the C/110R in the first and second year, respectively, whereas, it was 14% lower in the alternative graft combination in both years (Table 4). A nocturnal redistribution of the xylem flux from the epigeal to the hypogean portion was most evident in the C/SO4, with a negative peak at dawn.

3.7. Yield and Quality Parameters

No statistically significant differences were observed in the production parameters (yield, number of bunches per plant, bunch weight) between the two graft combinations: the number of bunches per plant averaged close to 60 in the first year and around 50 in the second year, and the production was 21% lower in the second year than first year (Table 3). The values were statistically higher in the first year (Table 3). The real fertility was also similar between the two graft combinations, but it was lower in the second year (Table 4). Regarding the biometric parameters, at harvest (BBCH 89), the bunch weight was not significantly different between the two graft combinations, but it was 16% lower in the second year (Table 3). This lower weight of bunches can be attributed to the lower berry number per bunch in the second year (Table 3). From the first to the second sample time, the biometric measurements of the berry showed no significant statistical differences between the two graft combinations (Table 5). Indeed, the berry reached the highest weight and size during the end of July for the 110R; whereas, the SO4 reached the highest biometric parameters at the beginning of August (Table 5). The lower pigmentation of peel was observed during the first and second weeks of July on the berries of the Cardinal grafted onto 110 R (Table 5). However, the colour peel did not show significant differences between the two graft combinations during the third ten days of July and at harvest (2.36 ± 0.11 in the C/110R and 2.50 ± 0.12 in the C/SO4). The behaviour of the biometric parameters was similar in both years, but it was different for degree ripening; however, no interaction was recorded for all the parameters reported in Table 6. The pattern of maturation index such as the total soluble solids and pH was similar between the graft combinations and between the years and increased from the first week of July to the first ten days of August in both years (Table 6). At the beginning of August, the TSSs were 14.74 °Brix (±0.72) in the C/SO4 and 14.48 °Brix (±0.30) in the 110R, and the pH was 3.50 in both graft combinations. Furthermore, the evolution during the samplings of titratable acidity and TSS/TA did not change between years, but it changed between the two graft combinations. Indeed, the titratable acidity reached an average lower concentration in the C/110R than in the C/SO4, by the end of July (Table 6). As a consequence of this, the sugar/acid ratio reached a value significantly higher in the 110R (23.66 ± 0.71) than in the C/SO4 (19.18 ± 0.75) at the end of July, without differences in both years. That indicates that the Cardinal cultivar grafted onto 110R reached the organoleptic characteristics appreciated by consumers earlier. Indeed, at the last sampling, the SSR/TA ratio was 31.68 (±0.27) and 28.84 (±0.53) in the 110R- and SO4-grafted combinations, respectively (Table 6). No interaction of year x treatment was observed.

3.8. Nutraceutical Parameters

Regarding the nutraceutical analyses, the total polyphenol content values recorded in the pulp and peel of the berry overlapped between the two graft combinations (Table 7). No differences were observed between the two years, and no interaction was recorded. Instead, the value of the TPC was significantly higher in the C/110 R than the C/SO4 at the end of July, and the TAC of the peel was also significantly higher in the berries of the C/110 R than the C/SO4. At the beginning of August, the TPC decreased in the berries of both graft combinations; the TAC decreased also in the berries of the C/110 R but increased in the berries of the C/SO4, reaching values similar to the C/110 R. A weak correlation was found between TPC and TAC. Indeed, the Pearson’s coefficient was 0.39 and 042 in the C/110r and C/SO4, respectively.

4. Discussion

4.1. Phenophase Evolution

A delay of bud-break was observed in the Cardinal onto SO4 rootstock; however, there were no differences in the final bud-break percentage between the two graft combinations. It is known that growing buds require a carbohydrate supply, mostly mono- or disaccharides (i.e., glucose, fructose, and sucrose). In the weeks before the budburst, the xylem fills with water, and the pressure in the xylem builds to high levels [30]; in our experiment, this physiologic process appears earlier in the 110 R rootstock than in the SO4. Furthermore, it showed that in grapevine, there is low starch variation near the bud during bud-break, with an increase in starch degrading enzyme activity and a significant decrease in the starch reserves at distant locations [31,32,33,34], with enriched sap flow in the xylem containing sugars and phytohormones that are carried to the bud earlier in the 110 R than the SO4, with a delay of bud-break with this last rootstock; however, there were no differences in the final bud-break percentage between the two graft combinations. Indeed, regarding hormones, cytokinin can play a main role in this process. It is mainly produced in root tips, moves from the root tips to the bud through the xylem, and controls growth and shoot development [35]. A higher cytokinin content was found in the 110R rootstocks compared to the Kober 5BB [36], a progenitor of the SO4 used in our experiment, and a delay of bud-break with this last rootstock was also recorded in our experiment.

4.2. Conductive Xylem Area

The tomograph has shown that the SO4 is slower in xylem filling in spring compared to the 110R, and this can be one cause of the delayed bud break in the Cardinal cultivar onto SO4. It is possible to assume that the cytokinins synthesised in the root and the carbohydrate supply from reserves reach the distant buds earlier in the C/110 R than in the alternative combination, causing earlier sprouting.

4.3. Vegetative Growth

Many researchers have reported that the size of the root system is an important factor in determining shoot growth [37,38,39]. In our experiment, rootstock extensions affected the growth of the principal shoot with a leaf-number increase; therefore, the primary effect of the 110R rootstocks was on the cell extension of the shoot, with a longer length of the principal shoot and its internodes than the C/SO4. The early growth arrest in the C/SO4 may be responsible for more lateral shoots as the apical dominance becomes weaker or through higher hormonal root synthesis. However, no differences were observed in the overall leaf area of the principal shoot together with the lateral shoots between the two graft combinations. Additionally, the total leaf area of the lateral shoots was higher on the SO4 rootstock than on the 110 R; whereas the leaf of the principal shoot was higher in the C/110 R than the C/SO4, and the leaf area was higher in the C/110R too.

4.4. Light Distribution

The shorter internode and higher number of short lateral shoots induced on the Cardinal grafted to the SO4 caused a change in the canopy architecture with fewer gaps in the C/SO4 than in the C/110R-grafted vines, with a change in the final biomass removed with the pruned weight. The light exposure of a bunch generally stimulates anthocyanin accumulation in grape berries; conversely, high temperatures inhibit colour formation [40,41]. Ref. [37] reported that the optimal temperature range for anthocyanin accumulation was between 17 and 26 °C.

4.5. Gas Exchange

The gas exchange parameters and leaf water potential were always better in the 110R graft combination than in the SO4 rootstock, supporting the higher drought tolerance of the 110R rootstock [7]. Indeed, the overall xylem flux transpired by the plant was higher in the graft combination onto 110R than that onto SO4; this showed a higher root water extraction from the rhizosphere of the V. berlandieri × V. rupestris rootstocks. However, the Pn/gs and Pn/Ci detected in the leaf of Cardinal grafted onto 110R were similar to that recorded in the alternative graft combination.

4.6. Quality Parameters

During the ripening Cardinal, in July, the slower berry colouration of Cardinal/1110R was probably a consequence of the higher temperature (29.60 ± 0.29 °C) of the clusters more exposed to light than in the Cardinal/SO4 combination (28.27 ± 0.16 °C), as confirmed by previous studies [40]. Furthermore, it has been reported that more shaded bunches have a higher acidity [42]. Hence, the lower acidity recorded in the berries of the C/110R can be also attributed to the greater exposure of the grapes to the higher light and increasing temperature, compared to the grapes of plants grafted on SO4. Finally, the berries of C/110R reached a higher sweetness early compared to C/SO4 but with lower peel colouration compared to the alternative graft combination. The TPC and TAC in the pulp were stable during the entire sampling period. In contrast, the TPC and TAC in the peel were higher in the C/110R at the end of July. However, the Pearson’s coefficient showed a weak correlation between the TPC and TAC. Furthermore, at the beginning of August, the TPC in the peel decreased compared to the previous sample date in both graft combinations, but the TAC decreased only in the C/110R, while it increased in the C/SO4. Therefore, other nutraceutical components than those in the TPC compete to define the TAC in the peel. As regards the other qualitative parameters, the 110R rootstock influenced the ripening and sweetness as anticipated, but the rootstock did not influence the other maturation indexes, yield, and nutraceutical parameters.

4.7. Sap Flow

The behaviour of the sap flow change in the Cardinal when changing the rootstock was interesting. It is evident that the conductive part of the xylem detected by the sap flow needle was deeper in the Cardinal grafted onto 110R than in the combination with SO4, resulting in a higher daily water flow. Ref. [43] showed that grapevines can rehydrate ‘dry’ roots with water moved through the root system at night. Finally, in the C/SO4 combination, a flux perturbation was evident at sunrise caused by downward and upward flow, resulting in a negative peak. The redistribution of xylem flux from the Cardinal to the rootstock shows that the SO4 rootstock has less ability to uptake water than the C/1104, which can likely be attributed to its shallow root system; the SO4 had a deeper root system.

4.8. Biomass Production

The biomass production was higher in the C/SO4 than in the C/110 R, as shown by the pruned material weight. The higher pruned weight is attributed to the weight of the lateral shoot axes because the Cardinal grafted onto SO4 produced more lateral shoots than the110 R, but no differences were recorded in the overall leaf area per plant. Because no difference was recorded in the yield, it is hypothesised that the C/110R has a greater accumulation of dry matter in the reserve tissues, which contributed to the earlier spring vegetative resumption.

5. Conclusions

Under the conditions in which the experiment was carried out, with a moderate irrigation water supply, the Cardinal cultivar, with 110R, shows greater photosynthetic activity, greater stomatal conductance, and greater transpiration, probably due to the roots being distributed in the deep layers of the soil, guaranteeing a higher vine water potential than SO4. The ability of the 110 R to draw water from the deeper layers is confirmed by the absence of the phenomenon of the nocturnal redistribution of xylem flux, which is present in SO4. Furthermore, Cardinal grafted onto SO4 has a delayed sprouting, probably due to a lower presence of reserve substances and hormonal substances produced by the roots. However, the results show the resilience of this cultivar, which on SO4 was achieved by unchanged production, demonstrating greater water-use efficiency compared to the 110 R. The SO4 rootstock changed the architecture of the canopy and the distribution of light within it with better berry pigmentation. In contrast, the 110R achieved better organoleptic and nutraceutical parameters one week earlier than the alternative rootstock. The integrated sap-flow and tomography methodology allows accurate monitoring of the transpiration flow and a better understanding of the water relationships established in the Cardinal cultivar with the two hybrid rootstocks used. Therefore, the Cardinal cultivar, in arid environments where it is necessary to intervene with irrigation, grafted onto hybrid V. berlandieri × V. riparia, SO4, showed better water-use performance compared to the hybrid V. berlandieri × V. rupestris, 110 R. Indeed, the overall lower C/SO4 water status does not compromise the production result, with similar or better quality compared to the alternative graft combination C/110R, which can be also attributed to the strong resilience of Cardinal to a water deficit.

Author Contributions

A.D.: formal analysis, Data curation, validation, software, writing—original draft, writing—review and editing, visualization. V.V.: Validation, Software. T.O.: acquisition data and data curation. F.M.P.: acquisition data and data curation. R.Z.: visualization, project administration, funding acquisition. G.G.: conceptualization, methodology, formal analysis, validation, software, writing—original draft, writing—review and editing, visualization, project administration. All authors have read and agreed to the published version of the manuscript.

Funding

This research received no external funding.

Institutional Review Board Statement

Not applicable.

Data Availability Statement

The datasets generated and analyzed during the current experiment are available from the corresponding author on reasonable request.

Acknowledgments

The authors would like to extend their sincerest gratitude to Mario Maiorana and the staff nursery plant “Maiorana” for him collaboration with the authors, for hosting the trial, for the providing assistance, time, and logistical resources to to make this experimentation.

Conflicts of Interest

The authors declare no conflict of interest.

References

  1. Mudge, K.; Janick, J.; Scofield, S.; Goldschmidt, E.E. A history of grafting. Hortic. Rev. 2009, 35, 437–493. [Google Scholar]
  2. Gautier, A.T.; Chambaud, C.; Brocard, L.; Ollat, N.; Gambetta, G.A.; Delrot, S.; Cookson, S.J. Merging genotypes: Graft union formation and scion–rootstock interactions. J. Exp. Bot. 2019, 70, 747–755. [Google Scholar] [CrossRef] [PubMed]
  3. Granett, J.; Walker, A.M.; Kocsis, L.; Omer, A.D. Biology and management of grape Phylloxera. Annu. Rev. Entomol. 2001, 46, 387–412. [Google Scholar] [CrossRef] [PubMed]
  4. Galet, P.; Smith, J. Grape Varieties and Rootstock Varieties; Collection Avenir oenologie; Oenoplurimédia: Chaintré, France, 1998. [Google Scholar]
  5. Janott, M.; Gayler, S.; Gessler, A.; Javaux, M.; Klier, C.; Priesacket, E. A one-dimensional model of water flow in soil–plant systems based on plant architecture. Plant Soil 2011, 341, 233–256. [Google Scholar] [CrossRef]
  6. Jones, G.V. Climate, grapes, and wine: Structure and suitability in a changing climate. Acta Hortic. 2012, 931, 19–28. [Google Scholar] [CrossRef]
  7. Pongrácz, D.P. Rootstocks for Grapevines; David Philip Publisher: Cape Town, South Africa, 1983. [Google Scholar]
  8. Martínez-Ballesta, M.C.; Alcaraz-Lopez, C.; Muries, B.; Mota-Cadenas, C.; Carvajal, M. Physiological aspects of rootstock-scion interactions. Sci. Hortic. 2010, 127, 112–118. [Google Scholar] [CrossRef]
  9. Serra, I.; Strever, A.; Myburgh, P.; Deloire, A. The interaction between rootstocks and cultivars (Vitis vinifera L.) to enhance drought tolerance in grapevine. Aust. J. Grape Wine Res. 2014, 20, 1–14. [Google Scholar] [CrossRef]
  10. Gullo, G.; Dattola, A.; Vonella, V.; Zappia, R. Evaluation of water relation parameters in vitis rootstocks with different drought tolerance and their effects on growth of a grafted cultivar. J. Plant Physiol. 2018, 226, 172–178. [Google Scholar] [CrossRef]
  11. Sucu, S.; Yagcı, A. Determination of sapling yield and quality features in some rootstocks and Sultanı Çekırdeksız (Vitis vinifera L.) variety grafted on these rootstocks. Ege Üniv. Ziraat Fak. Derg. 2017, 54, 53–59. [Google Scholar] [CrossRef]
  12. Lider, L.L. A grape rootstock trial in the Napa Valley: A nine-year progress report of three stocks on bale loam soil. Am. J. Enol. Vitic. 1957, 8, 121–126. [Google Scholar] [CrossRef]
  13. Carbonneau, A. The early selection of grapevine rootstocks for resistance to drought conditions. Am. J. Enol. Vitic. 1985, 36, 195–198. [Google Scholar] [CrossRef]
  14. Iacono, F.; Peterlunger, E. Rootstock-scion interaction may affect drought tolerance in Vitis vinifera cultivars. Implications in selection programs. Acta Hortic. 2000, 528, 543–554. [Google Scholar] [CrossRef]
  15. Ezzahouani, A.; Williams, L.E. The influence of rootstock on leaf water potential, yield, and berry composition of Ruby Seedless grapevines. Am. J. Enol. Vitic. 1995, 46, 559–563. [Google Scholar] [CrossRef]
  16. Choné, X.; Van Leeuwen, C.; Dubourdieu, D.; Gaudillère, J. Stem water potential is a sensitive indicator of grapevine water status. Ann. Bot. 2001, 87, 477–483. [Google Scholar] [CrossRef]
  17. Deloire, A.; Carbonneau, A.; Wang, Z.; Ojeda, H. Vine and water: A short review. J. Int. Sci. Vigne Vin. 2004, 38, 1–13. [Google Scholar] [CrossRef]
  18. Williams, L.E. Interaction of rootstock and applied water amounts at various fractions of estimated evapotranspiration (ETc) on productivity of Cabernet Sauvignon. Aust. J. Grape Wine Res. 2010, 16, 434–444. [Google Scholar] [CrossRef]
  19. Nadezhdina, N. A simplified equation for sap flow calculation based on the Heat-Field Deformation (HFD) measurements. Acta Hortic. 2012, 951, 11. [Google Scholar] [CrossRef]
  20. Howard, A.R.; Van Iersel, M.W.; Richards, J.H.; Donovan, L. Night-time transpiration can decrease hydraulic redistribution. Plant Cell Environ. 2009, 32, 1060–1070. [Google Scholar] [CrossRef]
  21. Antonacci, D.; Perniola, R. L’uva da Tavola, Collana Coltura e Cultura; Bayer CropScience: Milano, Italy, 2010; pp. 385–421. [Google Scholar]
  22. Galet, P. Cépages et Vignobles de France; Galet, P., Ed.; Dehan: Montpellier, France, 1988. [Google Scholar]
  23. Nadezhdina, N. Temperature gradients around a linear heater due to moving sap. In Proceedings of the 4th International Workshop on Measuring Sap Flow in Intact Plants, Zidlochovice, Czech Republic, 3–5 October 1998; Cermák, J., Nadezhdina, N., Eds.; Publishing House of Mendel University: Brno, Czech Republic, 1998; pp. 65–71. [Google Scholar]
  24. Nadezhdina, N.; Tributsch, H.; Èermák, J. Infra-red images of heat filed around a linear heater and sap flow in stems of lime trees under natural and experimental conditions. Ann. Sci. For. 2004, 61, 203–213. [Google Scholar] [CrossRef]
  25. Nadezhdina, N.; Èermák, J.; Neruda, J.; Prax, A.; Ulrich, R.; Nadezhdin, V.J.; Gašpárek, J.; Pokorny, E. Roots under the load of heavy machinery in spruce trees. Eur. J. For. Res. 2006, 125, 111–128. [Google Scholar] [CrossRef]
  26. Nadezhdina, N.; Vandegehuchte, M.; Steppe, K. Sap flux density measurements based on the heat field deformation method. Trees Struct. Funct. 2012, 26, 1439–1448. [Google Scholar] [CrossRef]
  27. Slinkard, K.; Singleton, V.L. Total phenol analysis: Automation and comparison with manual methods. Am. J. Enol. Vitic. 1997, 28, 49–55. [Google Scholar] [CrossRef]
  28. Pellegrini, N.; Re, R.; Yang, M.; Rice Evans, C. Screening of dietary carotenoids and carotenoid-rich fruit extracts for antioxidant activities applying the ABTS+ radical cation decolorization assay. Methods Enzimol. 1999, 299, 589–603. [Google Scholar]
  29. Re, R.; Pellegrini, N.; Proteggente, A.; Pannala, A.; Yang, M.; Rice-Evans, C. Antioxidant activity applying an improved ABTS radical cation decolorization assay. Free Radic. Biol. Med. 1999, 26, 1231–1237. [Google Scholar] [CrossRef] [PubMed]
  30. Sperry, J.S.; Holbrook, N.M.; Zimmermann, M.H.; Tyree, M.T. Spring filling of xylem vessels in wild grapevine. Plant Physiol. 1987, 83, 414–417. [Google Scholar] [CrossRef]
  31. Maurel, K.; Leite, G.B.; Bonhomme, M.; Guilliot, A.; Rageau, R.; Pétel, G.; Sakr, S. Trophic control of bud break in peach (Prunus persica) trees: A possible role of hexoses. Tree Physiol. 2004, 24, 579–588. [Google Scholar] [CrossRef]
  32. Bonhomme, M.; Peuch, M.; Ameglio, T.; Rageau, R.; Guilliot, A.; Decourteix, M.; Alves, G.; Sakr, S.; Lacointe, A. Carbohydrate uptake from xylem vessels and its distribution among stem tissues and buds in walnut (Juglans regia L.). Tree Physiol. 2010, 30, 89–102. [Google Scholar] [CrossRef]
  33. Keller, M.; Zhang, Y.; Shrestha, P.M.; Biondi, M.; Bondada, B.R. Sugar demand of ripening grape berries leads to recycling of surplus phloem water via the xylem. Plant Cell Environ. 2015, 38, 1048–1059. [Google Scholar] [CrossRef]
  34. Rubio, S.; Noriega, X.; Pérez, F.J. ABA promotes starch synthesis and storage metabolism in dormant grapevine buds. J. Plant Physiol. 2019, 234–235, 1–8. [Google Scholar] [CrossRef]
  35. Van Staden, J.; Davey, J.G. The synthesis, transport and metabolism of endogenous cytokinins. Plant Cell Environ. 1979, 2, 93–106. [Google Scholar] [CrossRef]
  36. Nikolaou, G.; Neocleous, D.; Christou, A.; Kitta, E.; Katsoulas, N. Implementing sustainable irrigation in water-scarce regions under the impact of climate change. Agronomy 2020, 10, 1120. [Google Scholar] [CrossRef]
  37. Jones, T.H.; Cullis, B.R.; Clingeleffer, P.R.; Rühl, E.H. Effects of novel hybrid and traditional rootstocks on vigour and yield components of Shiraz grapevines. Aust. J. Grape Wine Res. 2009, 15, 284–292. [Google Scholar] [CrossRef]
  38. Tandonnet, J.P.; Cookson, S.J.; Vivin, P.; Ollat, N. Scion genotype controls biomass allocation and root development in grafted grapevine. Aust. J. Grape Wine Res. 2010, 16, 290–300. [Google Scholar] [CrossRef]
  39. Gambetta, G.A.; Manuck, C.M.; Drucker, S.T.; Shaghasi, T.; Fort, K.; Matthews, M.A.; Walker, M.A.; McElrone, A.J. The relationship between root hydraulics and scion vigour across Vitis rootstocks: What role do root aquaporins play? J. Exp. Bot. 2012, 63, 6445–6455. [Google Scholar] [CrossRef] [PubMed]
  40. Pirie, A.; Mullins, M.G. Changes in anthocyanin and phenolics content of grapevine leaf and fruit tissues treated with sucrose, nitrate, and abscisic acid. Plant Physiol. 1976, 58, 468–472. [Google Scholar] [CrossRef] [PubMed]
  41. Dokoozlian, N.K. Grape berry growth and development. In Raisin Production Manual; Christensen, L.P., Ed.; UCANR Publications: Oakland, CA, USA, 2000; pp. 30–37. [Google Scholar]
  42. Jogaiah, S.; Striegler, K.R.; Bergmeier, E.; Harris, J. Influence of cluster exposure to sun on fruit composition of ‘Norton’ Grapes (Vitis aestivalis Michx) in Missouri. Int. J. Fruit. Sci. 2012, 12, 410–426. [Google Scholar] [CrossRef]
  43. Bauerle, T.L.; Richards, J.H.; Smart, D.R.; Eissenstat, D.M. Importance of internal hydraulic redistribution for prolonging lifespan of roots in dry soil. Plant Cell Environ. 2008, 31, 177–186. [Google Scholar] [CrossRef]
Figure 1. Representative tomographs of the different periods, years and combinations of grafting: (a) 2021; (b) (2022). In the figures, the red bands degrading to yellow indicate areas of resistivity; conversely, the blue bands degrading to light blue indicate areas of conductivity.
Agriculture 13 02101 g001aAgriculture 13 02101 g001b
Figure 2. Evolution of phenological stages on the BBCH scale basis in table grapevine Cardinal cultivar grafted on two rootstocks: SO4 and 110R [2021 (a) and 2022 (b)].
Agriculture 13 02101 g002
Figure 3. Elongation of shoot in the table grapevine Cardinal cultivar grafted onto SO4 and 110 R rootstocks during two vegetative seasons: 2021 (a), 2022 (b).
Agriculture 13 02101 g003aAgriculture 13 02101 g003b
Figure 4. PAR value measured inside the canopy of the table grapevine cultivar Cardinal grafted onto SO4 and 110R rootstocks and PAR value intercepted from the soil after crossing the canopy.
Agriculture 13 02101 g004
Figure 5. Sap flow measurements in stem of table grapevine Cardinal cultivar grafted onto 110 R (a) and SO4 (b)rootstocks during five summer days.
Agriculture 13 02101 g005
Table 1. Refilling of active conductive xylem areas (CXA) percentage (%) on a tomograph basis at different measurement times in table grapevine Cardinal cultivar grafted onto SO4 and 110R rootstocks in two observation years.
Graft CombinationCXA
First Ten Days MarchSecond Ten Days MarchThird Ten Days AprilThird Ten Days July
20212022202120222021202220212022
C/110R%66.47 a
(±1.71)
60.73 a
(±0.44)
68.61 a
(±2.29)
61.22 a
(±0.47)
67.72 a
(±1.05)
65.33 a
(±1.56)
65.03 n.s.
(±2.60)
70.88 n.s.
(±1.26)
C/SO449.39 b
(±2.33)
44.12 b
(±1.32)
53.91 b
(±2.17)
56.15 b
(±0.82)
61.56 b
(±2.80)
62.33 b
(±2.80)
62.97
(±1.91)
68.54
(±0.66)
Different letters indicate significant differences (p ≤ 0.05); n.s. = non-significant.
Table 2. Number and leaf area for principal shoot, lateral shoot, leaf area per plant, LAI, internode of principal shoot length, and pruned weight of table grapevine Cardinal cultivar grafted onto 110R and SO4 rootstocks.
Graft CombinationYearNumber of Leaves per Principal Shoot (PS)
Total Leaf Area per Principal Shoot
m2
Number of Leaves per Lateral Shoot n°Leaf Area per Lateral Shoot (cm2)Total Number of Leaves per Shoot (PS + LS)
Total Leaf Area per Shoot (PS + LS)
m2
Area of Single Leaf
cm2
Leaf Area per Vine
m2
Lateral Shoot
%
LAIInternode Length
(cm)
Winter Pruning Residue
(kg pianta−1)
SO42116.30 ± 1.9 d0.12 ± 0.02 d27.53 b0.217267 b43.83 ± 10.83 n.s.0.33 ± 0.05 n.s.78.92 ± 6.47 n.s.2.66 ±1.1 b20.1 ± 1.5 a0.66 ± 0.05 b7.33 ± 0.12 b3.10 ± 0.30 a
110R19.18 ± 0.4 c0.15 ± 0.015 c17.48 c0.137358 d36.66 ± 6.900.28 ± 0.0578.58 ± 3.872.22 ± 2.8 c14.53 ± 1.8 b0.55 ± 0.04 c8.59 ± 0.15 a2.50 ± 0.20 b
SO42221.61 ± 2.2 b0.21 ± 0.01 b29.73 a0.293376 a51.34 ± 10.830.40 ± 0.0698.68 ± 3.13 n.s.3.62 ± 2.1 a19 ± 1.1 a0.93 ± 0.07 a7.47 ± 0.14 b3.80 ± 0.40 a
110R25.02 ± 1.5 a0.24 ± 0.01 a16.26 d0.158194 c41.28 ± 6.900.32 ± 0.0497.29 ± 2.172.62 ± 2.4 b15 ± 1.2 b0.66 ±0.04 b8.48 ± 0.18 a2.30 ± 0.30 b
year n.s.n.s.n.s.n.s.n.s.n.s.n.s.n.s.n.s.n.s.n.s.n.s.
I = Y × T n.s.n.s.n.s.n.s.n.s.n.s.n.s.n.s.n.s.n.s.n.s.n.s.
Different letters indicate significant differences (p ≤ 0.05); n.s. = non-significant. I = interaction treatment × year.
Table 3. Yield per plant, number of clusters and berries, sprouting percentage and real fertility in table grapevine Cardinal cultivar grafted onto 110 R and SO4 rootstocks (2021 and 2022).
YearGraft CombinationNumber of Clusters per PlantYield per Plant
Kg. plant−1
Bunch Weight
g
N° of Berries per BunchBud-Break
%
Real Fertility R.F.
2021C/SO459.18 ± 4.37 a21.3 ± 1.9 a362 ± 25 n.s.51 ± 5 n.s.95.60 ± 2.23 n.s.0.77 ± 0.12 a
C/110R63.75 ± 3.3 a25.9 ± 2.4 a393 ± 2256 ± 489.70 ± 2.060.87 ± 0.11 a
2022C/SO448.00 ± 4.19 b18.44 ± 1.5 b326.05 ± 18.6454 ± 292.38 ± 3.150.66 ± 0.06 b
C/110R53.83 ± 5.90 b18.59 ± 1.76 b305.59 ± 21.6459 ± 492.36 ± 2.890.73 ± 0.04 b
Year***n.s.n.s.n.s.
I = T × Yn.s.n.sn.s.n.s.n.s.n.s.
Different letters and asterisk indicate significant differences (p ≤ 0.05); n.s. = non-significant. I = interaction treatment × year.
Table 4. Leaf gas exchange (net photosynthesis (Pn), stomatal conductance (gs), internal CO2 concentration (Ci), transpiration (E), Pn/E, and Pn/Ci ratio), SPAD index, leaf water potential (ΨLeaf), sap flow, and daily xylem flow, in table grapevine Cardinal cultivar grafted onto 110R and SO4 rootstocks in 2021 and 2022.
YearGraft CombinationPn
µmol CO2 m−2 s−1
gs
mol H2O m−2 s−1
Ci
ppm
E
mmol H2O m−2 s−1
Pn/EPn/CiSPADΨLeaf
Bar
Sap Flow
cm3 cm−2 h−1
Daily Xylem Flow
L cm−2 d−1
2021C/SO412.21
±0.87 b
0.073
±0.004 b
118.1
±17.80 b
3.102
±0.322 n.s.
3.93
±0.23 n.s.
0.10
±0.05 n.s.
36.88
±0.71 n.s.
−5.62
±0.15 b
25.74
±1.12 b
10.60
±0.4 b
C/110R13.83
±0.85 a
0.086
±0.008 a
128.45
±20.43 b
3.008
±0.212
4.59
±0.23
0.10
±0.02
36.14
±0.62
−4.56
±0.11 a
30.89
±1.35 a
12.33
±0.15 a
2022C/SO410.79
±1.13 c
0.072
±0.01 b
157.21
±33.40 a
3.296
±0.588 n.s.
3.60
±0.78 n.s.
0.10
±0.09 n.s.
37.20
±0.23
−5.37
±0.20 b
20.33
±1.24 c
10.21
±0.8 b
C/110R14.04
±1.97 a
0.090
±0.01 a
140.70
±14.28 a
3.239
±0.708
5.05
±0.28
0.07
±0.01
36.84
±0.38
−4.64
±0.10 a
25.34
±1.01 b
11.74
±0.5 a
Year n.s.n.s.*n.s.n.s.n.s.n.s.n.s.*n.s.
I = T × Yn.s.n.s.n.s.n.s.n.s.n.s.n.s.n.s.n.s.n.s.
Different letters and asterisk indicate significant differences (p ≤ 0.05); n.s. = non-significant. I = interaction treatment × year.
Table 5. Biometric parameters and degree of berry ripening in table grape Cardinal cultivar grafted on two different rootstocks: 110R and SO4 (2021 and 2022).
Time of SamplingGraft CombinationAverage Weight
g
Polar Diameter
mm
Equatorial Diameter
mm
Degree of Ripening
%
First week July
(12 July 2021
13 July 2022)
110R5.16 ± 0.21 d19.68 ± 0.25 d20.64 ± 0.30 c0.76 ± 0.14 f
SO44.91 ± 0.19 d19.56 ± 0.21 d20.04 ± 0.27 c1.06 ± 0.14 e
Second week July
19 July 2021
20 July 2022)
110R5.77 ± 0.26 c20.17 ± 0.27 c20.74 ± 0.33 c1.68 ± 0.14 d
SO45.87 ± 0.22 c20.33 ± 0.26 c20.62 ± 0.2 c1.98 ± 0.14 c
Third ten days July
(26 July 2021
26 July 2022)
110R7.24 ± 0.27 a22.24 ± 0.25 b22.54 ± 0.29 b2.26 ± 0.10 b
SO46.84 ± 0.22 b22.20 ± 0.24 b22.14 ± 0.27 b2.22 ± 0.12 b
First ten day August
(2 August 2021
3 August 2022)
110R7.58 ± 0.23 a23.05 ± 0.22 a22.83 ± 0.27 a2.36 ± 0.11 a
SO47.40 ± 0.24 a23.84 ± 0.23 a23.34 ± 0.28 a2.50 ± 0.12 a
Yearn.s.n.s.n.s.*
I = Year × Treatmentn.s.n.s.n.s.n.s.
Different letters and asterisk indicate significant differences (p ≤ 0.05); n.s. = non-significant. I = interaction treatment × year.
Table 6. Main ripening indices (total soluble solids (TSSs); titratable acidity (TA)), in table grape plants of Cardinal cultivar grafted on two different rootstocks: 110R and SO4 (2021 and 2022).
Time of SamplingGraft CombinationTSSs
(°Brix)
pHTA
(%)
TSS/TA
First week July
(12 July 2021
13 July 2022)
110R10.10 ± 0.31 d2.94 ± 0.03 d1.21 ± 0.05 a8.43 ± 0.68 c
SO410.40 ± 0.11 d2.94 ± 0.02 d1.28 ± 0.03 a8.14 ± 0.20 c
Second week July
(19 July 2021
20 July 2022)
110R11.60 ± 0.14 c3.13 ± 0.02 c0.79 ± 0.06 b14.97 ± 1.17 d
SO411.74 ± 0.19 c3.10 ± 0.02 c0.85 ± 0.03 b13.91 ± 0.60 d
Third ten days July
(26 July 2021
26 July 2022)
110R13.56 ± 0.31 b3.60 ± 0.33 a0.57 ± 0.01 d23.66 ± 0.71 b
SO413.42 ± 0.18 b3.28 ± 0.02 b0.670.02 c19.18 ± 0.75 c
First ten days August
(2 August 2021
3 August 2022)
110R14.48 ± 0.30 a3.50 ± 0.02 a0.46 ± 0.01 d31.68 ± 0.27 a
SO414.74 ± 0.31 a3.51 ± 0.02 a0.53 ± 0.04 d28.84 ± 0.53 a
Yearn.s.n.s.n.s.n.s.
I = T × Yn.s.n.s.n.s.n.s.
Different letters indicate significant differences (p ≤ 0.05); n.s. = non-significant. I = interaction treatment × year.
Table 7. Main nutraceutical parameters (total polyphenol content (TPC); total antioxidant capacity (TAC)) in table grape plants of Cardinal cv grafted on two different rootstocks: 110R and SO4 (2021 and 2022).
Time of SamplingGraft CombinationTPC Pulp
mg Gallic acid/gr. FW
TAC Pulp
µmoles trolox/gr. FW
TPC Peel
mg Gallic acid/gr. FW
TAC Peel
µmoles trolox/gr. FW
First week July
(12 July 2021
13 July 2022)
C/110R0.569 ± 0.049 n.s.1.204 ± 0.054 n.s.0.994 ± 0.086 n.s.26.691 ± 0.494 a
C/SO40.650 ± 0.0851.137 ± 0.2071.311 ± 0.17223.841 ± 0.041 b
Second week July
(19 July 2021
20 July 2022)
C/110R0.678 ± 0.036 n.s.1.114 ± 0.093 n.s.1.249 ± 0.067 n.s.25.859 ± 0.121 n.s.
C/SO40.615 ± 0.0381.589 ± 0.1501.172 ± 0.07325.680 ± 0.013
Third ten days July
(26 July 2021
26 July 2022)
C/110R0.590 ± 0.039 n.s.1.146 ± 0.068 n.s.1.427 ± 0.095 n.s.31.337 ± 0.887 a
C/SO40.659 ± 0.0401.469 ± 0.1381.239 ± 0.07525.703 ± 0.529 b
First ten days August
(2 August 2021
3 August 2022)
C/110R0.592 ± 0.048 n.s.1.074 ± 0.052 n.s.1.232 ± 0.099 n.s.28.244 ± 0.450 n.s.
C/SO40.524 ± 0.0101.066 ± 0.0621.072 ± 0.02227.407 ± 0.353
Yearn.s.n.s.n.s.n.s.
I = T × Yn.s.n.s.n.s.n.s.
Different letters indicate significant differences (p ≤ 0.05); n.s. = non-significant. I = (interaction treatment × year).
Disclaimer/Publisher’s Note: The statements, opinions and data contained in all publications are solely those of the individual author(s) and contributor(s) and not of MDPI and/or the editor(s). MDPI and/or the editor(s) disclaim responsibility for any injury to people or property resulting from any ideas, methods, instructions or products referred to in the content.

