Article

Simulation and Optimization Experiment: Working Process of a Cleaning Device for Flax Combine Harvester

College of Mechanical and Electrical Engineering, Gansu Agricultural University, Lanzhou 730070, China
*
Author to whom correspondence should be addressed.
The authors contributed equally to this work.
Agriculture 2023, 13(11), 2123; https://doi.org/10.3390/agriculture13112123
Submission received: 17 October 2023 / Revised: 29 October 2023 / Accepted: 3 November 2023 / Published: 10 November 2023
(This article belongs to the Section Agricultural Technology)

Abstract

:
The aim of this study was to investigate the effects of different working parameters on the cleaning efficiency of a cleaning device during the separation and cleaning process in a flax joint harvesting machine. To achieve this objective, CFD–DEM joint simulation technology was used to construct a CFD model of the cleaning device and a DEM model of the discharged flax material; the simulation results show the flax cleaning process. The Box–Behnken experimental design method was used to establish a mathematical model between the vibrating sieve frequency, vibrating sieve amplitude, fan wind speed, seed impurity rate, and cleaning loss rate to find the optimum combination of cleaning equipment parameters and to conduct a field verification test. The simulation test results show that, when the vibrating sieve frequency is 6 Hz, the vibrating sieve amplitude is 14.42 mm, the fan wind speed is 5.96 m/s, and the machine cleaning effect is the best; the simulation test was measured following a seed impurity rate of 2.97% and cleaning loss rate of 2.17%. The field test verification results show that, after optimizing the working parameters of the cleaning device, the cleaning loss rate is 3.58% and the impurity rate of the grain combine harvester is 3.16%, thus meeting the national and industry requirements. The test results and simulation results are highly consistent with the model, thereby verifying the reliability of the model. The results of the study provide a reference for the design and performance optimization of the flax combine cleaner.

1. Introduction

Flax, also known as linseed, is a prominent cash crop and oilseed in North and Northwest China. Its high value and versatile uses make it a valuable raw material for composite materials, food additives, and other products [1]. Gansu, in particular, is the foremost flax-producing region in China, with an average yearly planting area of roughly 9.70 × 10⁴ hm2 and an annual output of approximately 1.51 × 10⁵ t, ranking first in both planting area and yield nationwide [2]. However, due to the small difference between the impurities and the flaxseeds after threshing, the cleaning effect after using some flax combine harvesters in the market is not satisfactory, and there are some problems such as high impurity content and slow cleaning speed. Therefore, it is important to reduce the loss of flax in the cleaning process and improve the sorting quality [3].
The cleaning device is a critical component of flax combined harvesting machinery, and the rationality of the device structure and motion parameter design has a direct impact on the working performance of the entire machine [4]. Scholars have explored the optimization of the working performance and parameters of the cleaning device through unifying various test schemes. Zhang et al. [5] used CFD technology to carry out the structural optimization design and to test the cleaning machine. Wang et al. [6] employed the CFD–DEM coupling method to simulate the on-screen motion of corn threshed material under the combined effect of airflow and bionic screening. To predict the cleaning performance of rice combine harvesters, Xu et al. [7] created numerical simulations of the air–screen cleaning unit using coupled computational fluid dynamics and the discrete element method to study the gas–solid two-phase flow behavior of the threshed mixture. Hu et al. [8] employed CFD–DEM coupling equations to study the movement and sorting behavior of impure particles and safflower petals under different airflow angles. The studies indicate that the CFD–EDM gas–solid coupling test method is widely used to investigate the distribution of threshing material particles in the airflow field and optimize operational parameters. With the advancement of computer science and technology, this approach has emerged as a crucial tool for investigating multiphase flow and optimizing the structure of cleaning devices. The research object for this study was the 4LZ–4.0 hill–mountain flax combine harvester, with support from field test data of the cleaning device. CFD–DEM coupling method was used to numerically simulate the movement trajectory and spatial morphological changes of every flax component within the cleaning device of the prototype [9]. A mathematical model was derived through factor-level testing and response surface methodology to establish correlations between the impurity rate, cleaning loss rate, vibrating screen frequency, vibrating screen amplitude, and fan wind speed. After analyzing the impact of various operating parameters on the cleaning device’s performance, we identified optimal working parameters for use during its operation. We then confirmed the simulation results’ validity using actual field tests [10]. The established CFD–DEM coupling simulation model presented in this paper can predict the functioning of the flax cleaning device’s operating process. It is a valuable reference for designing and optimizing the flax cleaning device’s performance.

2. Materials and Methods

2.1. Structure and Operation of the Cleaning Device

The cleaning device as an important working part of the flax combine; its position in the threshing drum is at the bottom, mainly including a threshed material separation and cleaning device, centrifugal fan, vibrating sieve driving device, a fish scale sieve-opening–angle-adjusting device, an airflow-inclination-adjusting device, a first-level seed-conveying screw, a second-level seed conveying screw, and other components, as shown in Figure 1.
The cleaning device mainly consists of a centrifugal fan and a double-deck ladder-type vibrating screen. The fan is driven by the belt pulley, and the double-deck ladder-type vibrating screen is driven by the eccentric wheel-driving device, leading to a reciprocal translation motion. The main function of the cleaning device is to separate and select the components of the threshing material produced by the threshing drum, discharge the impurities, and leave the cleaner grains. In the operation process, the threshing material falls on the vibrating plate from the threshing drum; in the vibrating plate, the particles move to the back of the fence under the action of dispersion, which is possible because of the different specific gravities of the components; these are gradually layered in the fence, which is broken up to form a falling material curtain. The shaking plate causes the falling material to fall on the upper layer of the double-layer stepped vibrating screen; the material reaches the upper layer of the screen for the fish scale sieve; the fish scale sieve has good permeability, and can quickly separate out most of the large particles of the impurities in the threshed material, which are then transported to the rear of the discharge. Then, the seeds, light miscellaneous materials, capsule shells, and other small particles fall through the fish scale sieve gaps onto the next layer of the sieve. The lower layer of the sieve is woven and exhibits good cleaning performance. This can quickly sort the seeds from the falling material. The specific parameters of the flax combine cleaning equipment are shown in Table 1.

2.2. Determination of Key Parameters of the Cleaning Device

The wind sieve cleaning device operates using airflow and a vibrating screen which separate threshed material impurities. According to the results of existing research on wind sieve cleaning devices, the fan wind speed and the movement parameters of the vibrating screen have a significant impact on the cleaning performance. Higher wind speeds and vibrating screen movement parameters will ensure that short stalks, capsules, shells, and other impurities in the sieve will be in suspension; such conditions ensure that the flaxseeds are separated from the impurities and fall from the sieve surface [11]. The selection of appropriate fan speeds and vibrating screen movement parameters ensures that the device is effective; the production capacity of the key factors is significant in the cleaning operations to ensure that they effectively separate the impurities in the flax threshing material.

2.2.1. Determination of Fan Air Speed Range

Sorting the flax threshing material out from the flaxseed grain suspension required a speed of 4.55 m/s~8.64 m/s. The capsules, capsule shells, short stalks, and other impurities in the suspension require speeds in the following ranges: 6.46~10.90 m/s, 1.06~4.21 m/s, 3.23~4.75 m/s, and 1.93~3.14 m/s, respectively [2]. The differences in suspension velocities between materials comprise the main basis for the selection of parameters in the operation of a centrifugal fan. In order to achieve the effective separation of impurities in the flax threshing material, the airflow velocity inside the cleaning device should be greater than the suspension velocity of a given impurity, while avoiding high wind speeds caused by an increasing loss of flaxseed. The centrifugal fan outlet airflow velocity should be less than the suspension speed required by flaxseed. Such speeds can be inferred with reference to the relevant literature combined with field testing of flax cleaning devices. For example, when a cleaning device in a combined harvester has a centrifugal fan outlet flow velocity in the range of 3.5~7.5 m/s, the cleaning effect of the flax threshing material is better [12].

2.2.2. Vibrating Screen Amplitude Range Determination

The amplitude of the vibrating screen in the vibration process can produce a maximum offset distance. The amplitude of the vibrating screen has a direct impact on the screening effect in the process of cleaning equipment operation. A higher amplitude can increase the movement speed and impact of the material on the sieve surface, so that the cleaning process is complete and efficient. Additionally, a high amplitude can increase the jumping movement of the particles and can increase the number of collisions; this avoids the accumulation of the threshing material in the sieve holes, reducing clogging and the occurrence of the adhesion phenomenon; thus, the continuous working ability of the equipment is improved. However, if the amplitude of the vibrating sieve is too high, it can cause the particles to jump over the sieve holes, meaning that the material is thrown up further by the sieve surface and is not in contact with it for a longer period of time; this means that the number of times the material makes contact with the sieve surface reduces, making it difficult to disperse the material. Thus, some flaxseed grains will be discharged from the cleaning device together with the impurities, resulting in an increased flaxseed grain loss rate [13]. Field tests show that, when the flax cleaning device’s amplitude is in the range of 5~25 mm, the sieving effect in the upper and lower sieve surfaces is better, leading to reduced seed loss, and improved, relatively stable separation and cleaning operations.

2.2.3. Determining the Vibratory Screen Frequency Range

The frequency range of the vibrating screen directly affects the movement of the threshing material on the screen surface. Selecting an appropriate vibrating screen frequency can ensure that the material on the screen surface undergoes improved impact and penetration. Simultaneously, the threshing material in the screening process undergoes sufficient acceleration and moves downward, improving the screening efficiency of the cleaning device [14]. Therefore, in order to improve the operational performance of the cleaning device, the kinematics and dynamics of the material on the screen surface must be analyzed, as shown in Figure 2.
The equation of the motion of the flaxseed particles on the screen surface during the cleaning process is given by:
x = rcos ω t v = r ω sin ω t a = r ω 2 cos ω t
where x is the screen displacement, m; r is the crank radius, m; ω is the crank angular velocity, rad/s; t is the sieve surface movement time, s; v is the sieve surface speed, m/s; a is the sieve surface acceleration, m/s2.
The force applied to the flaxseeds on the sieve surface is analyzed in the vertical direction, and the equation of this motion is given by:
N = m g cos α + I sin ( α + β ) Q sin ( α + λ ) I = m r ω 2 cos ω t Q = k ρ A V 2
where N is the sieve surface support force, N; m is mass of flaxseeds, kg; α is the sieve surface inclination angle, (°); I is the inertia force of flaxseed, N; β is the vibration direction angle, (°); Q is the airflow force on the flaxseed, N; λ is the airflow direction angle, (°); k is the drag coefficient; ρ is the airflow density, kg/m3; A is the maximum cross-sectional area of the sieved material in the direction perpendicular to the relative velocity, m2.
To ensure that the flax threshing material jumps off the screen surface, the material is subjected to a screen surface normal reaction force, N, of 0:
N = m g cos α + m r ω 2 cos ω t sin ( α + β ) k ρ A V 2 sin ( α + λ )
m g cos α + m r ω 2 cos ω t sin ( α + β ) = k ρ A V 2 sin ( α + λ )
When the material jumps off the screen surface, the acceleration of the screen must meet the following:
r ω 2 g > V V p 2 · sin ( α + λ ) sin ( α + β ) cos α sin ( α + β )
where Vp is the floating speed of the material on the sieve surface, V p = g m / k ρ A .
At this point, the crank boundary speed is as follows:
n = 30 π · g · V V p 2 · sin ( α + λ ) sin ( α + β ) cos α sin ( α + β ) / r
Formula (6) can be used to calculate that the vibrating screen works at the lowest vibration frequency, 2 Hz. Related research shows that, when the vibrating sieve frequency is too high, the threshing material movement speeds up on the sieve surface. Shortening the residence time is not conducive to ensuring the penetration of the sieve. At the same time, it is easy to disperse the threshing material when it makes contact with the sieve surface if the collision of particles occurs with a large initial velocity. This is easy to attain through the use of a fish scale sieve plate in the cleaning part. Therefore, to reduce the loss rate during the cleaning process, the selected vibration frequency range is 2–10 Hz.

2.3. Performance Evaluation

2.3.1. Sample Preparation

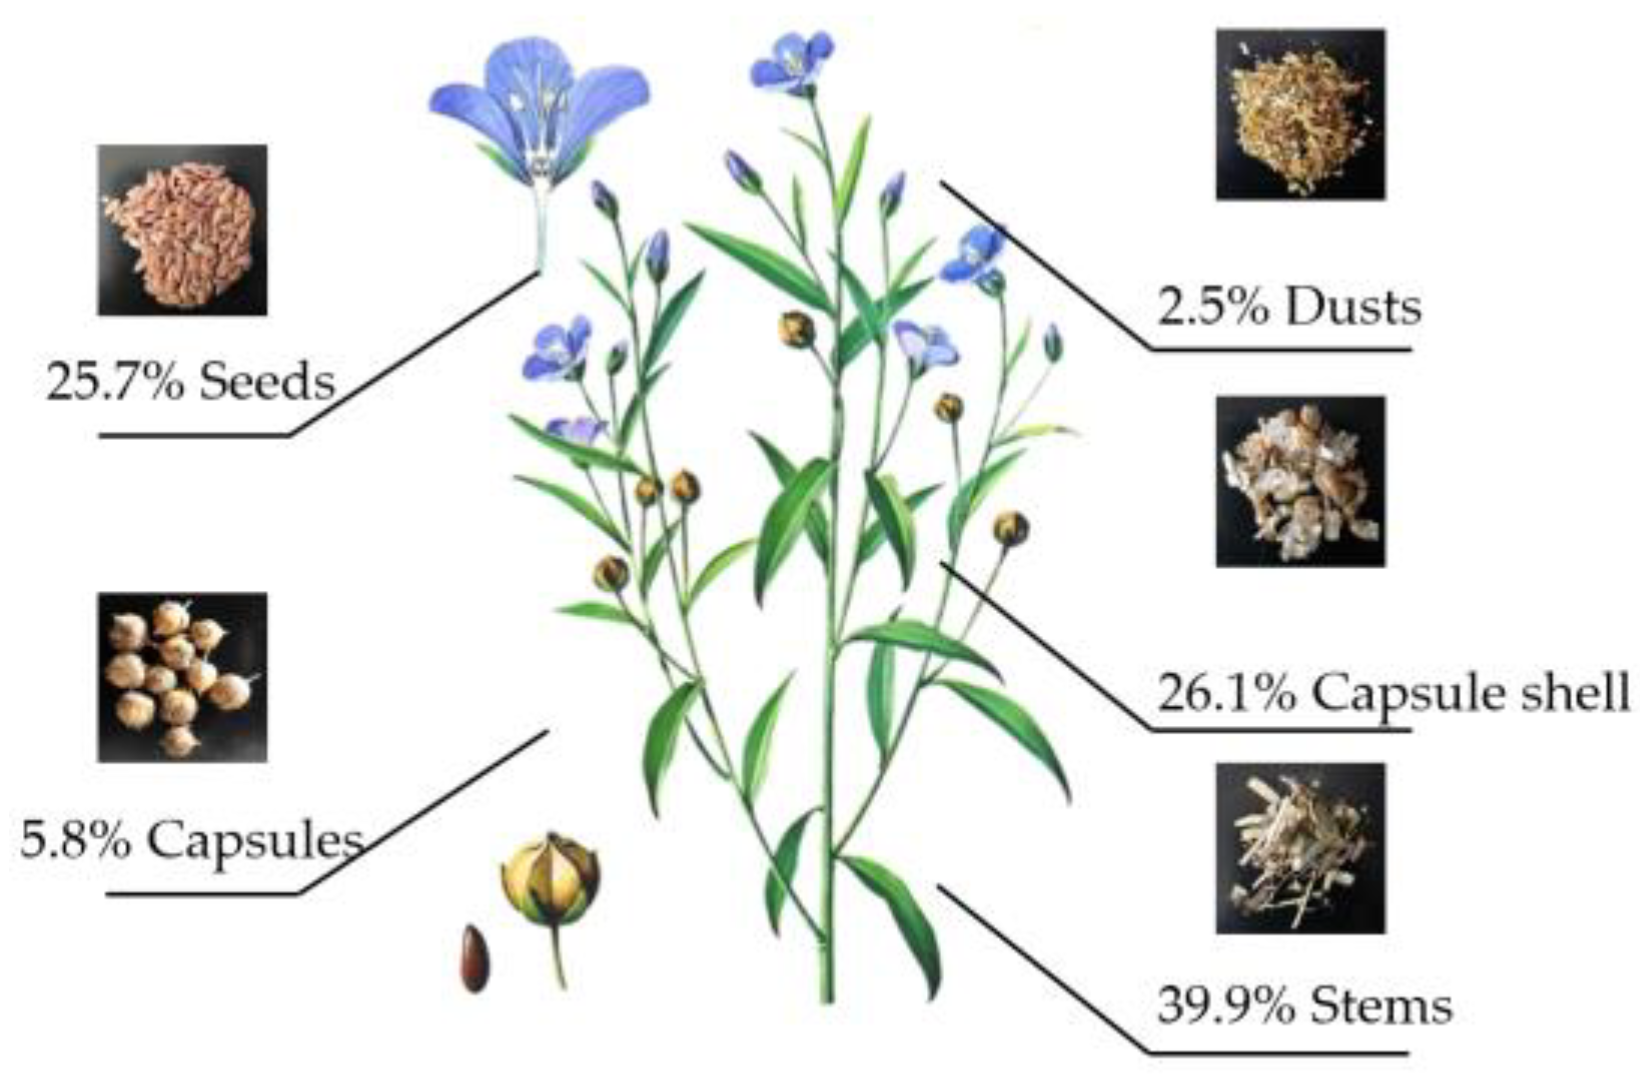
In this study, the test sample was Long ya 19 bred by Gansu Academy of Agricultural Sciences. The flax samples were threshed by the flax threshing device designed by the research group, and the threshing rate was 98.86% [15]. Five groups of flax samples, each group of 10 kg, were randomly selected for the threshing test. After flax threshing, five kinds of dislodged particles were collected for screening: the flaxseed grain, capsule shell, capsule, short stalks, and light debris. The proportion of different materials in each group was calculated. The average value was taken as the actual proportion; the results are shown in Figure 3.

2.3.2. Performance Indicators

In the simulation test, it was necessary to include the impurity rate and the loss rate of cleaning as a test index to determine the operational performance of the flax cleaning device. The impurity rate refers to the proportion of flaxseed grains in the threshing material after the completion of the cleaning operation, as shown in Equation (7). The loss rate refers to the proportion of flaxseed loss after material separation, as shown in Equation (8).
Y 1 = ( 1 N 1 N Z ) × 100 %
Y 2 = ( N N 1 N ) × 100 %
where Y1 is seed impurity rate, %; Y2 is the loss rate of cleaning, %; N1 is the number of flaxseeds collected after sorting; Nz is the total number of particles of flax threshed material; N is the total number of flaxseeds before sorting.

2.4. Coupled CFD–DEM Simulation

2.4.1. Establishment of Physical Modeling and Meshing of Cleaning Device

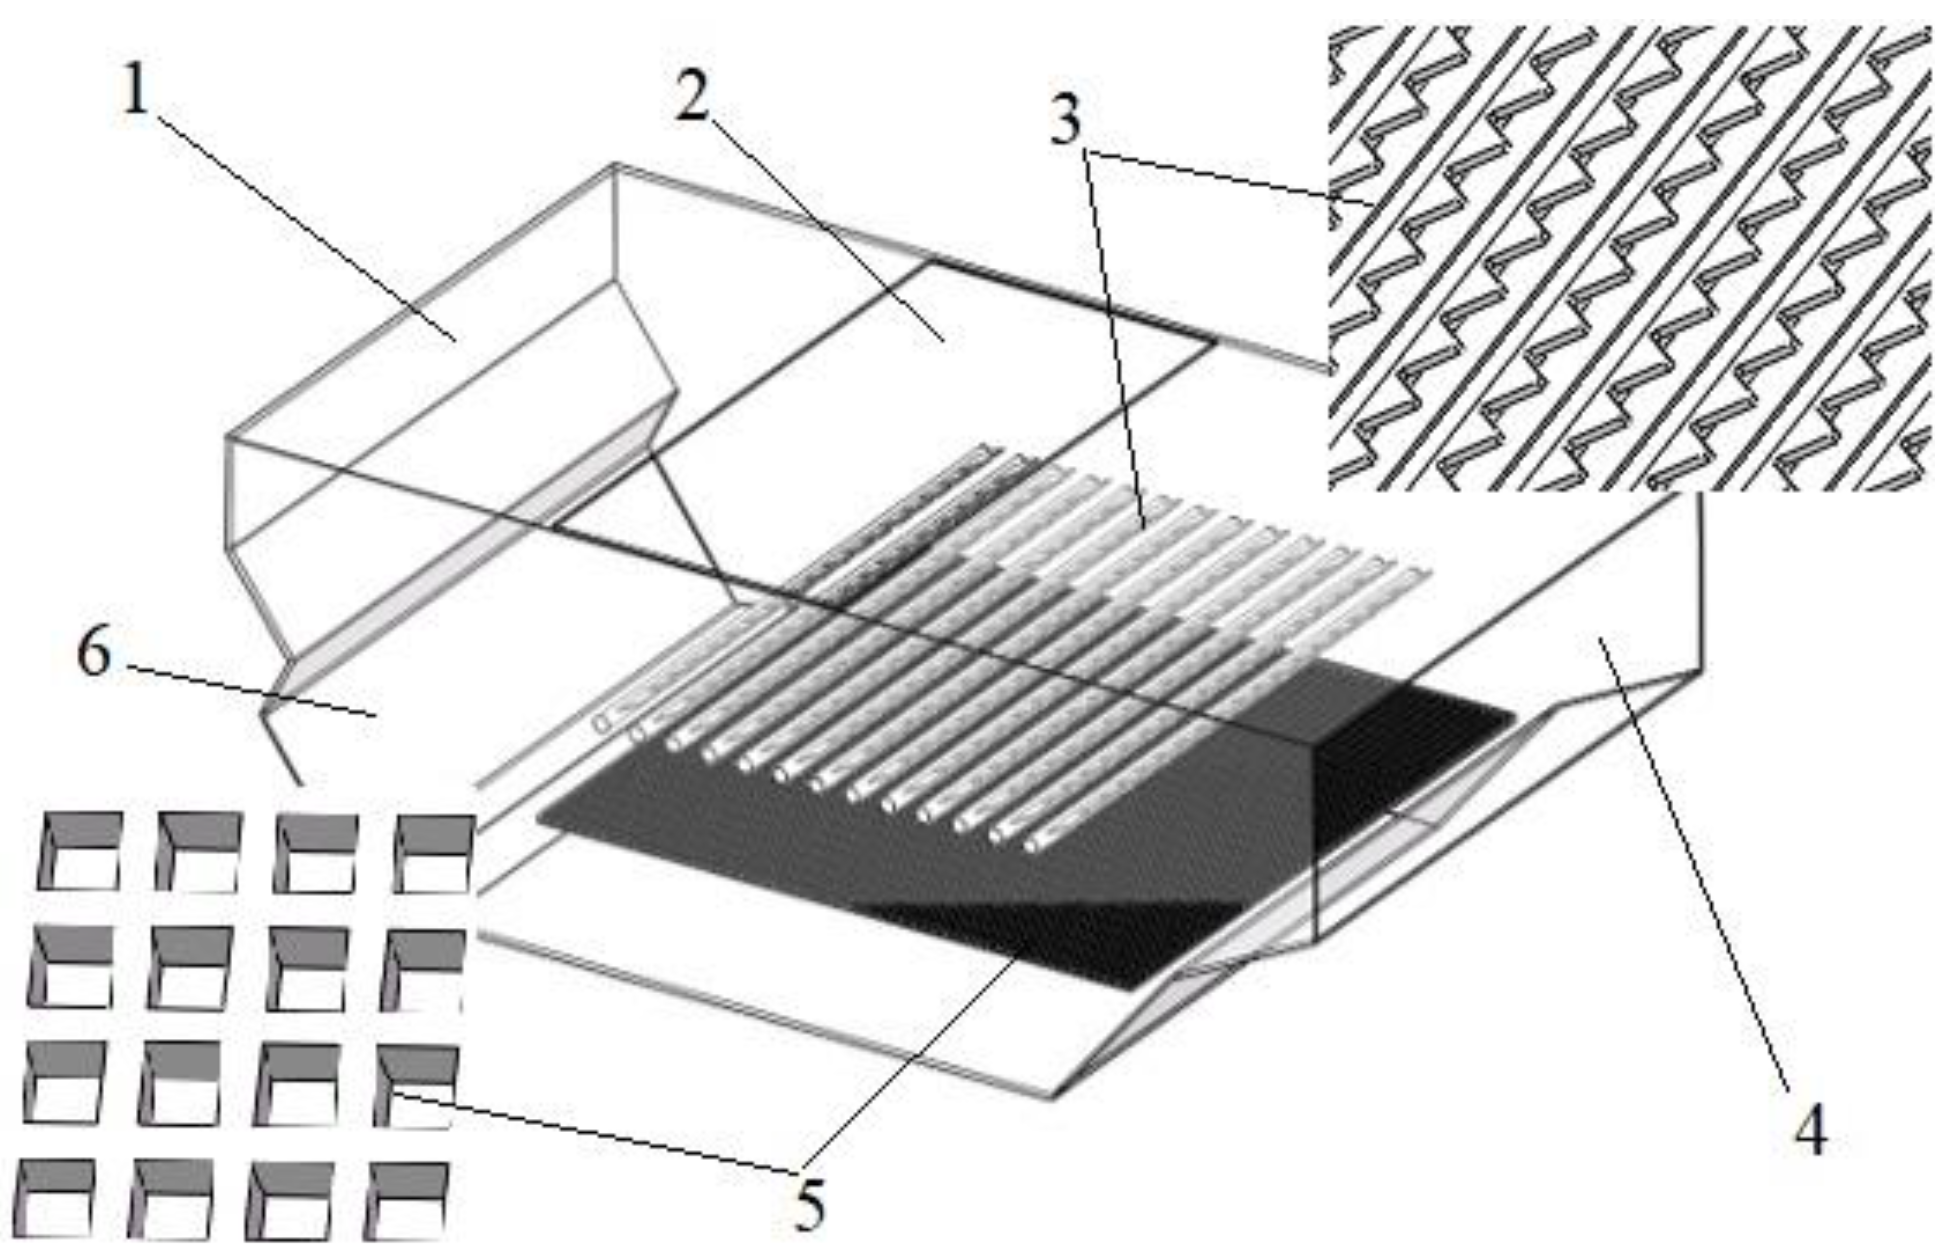
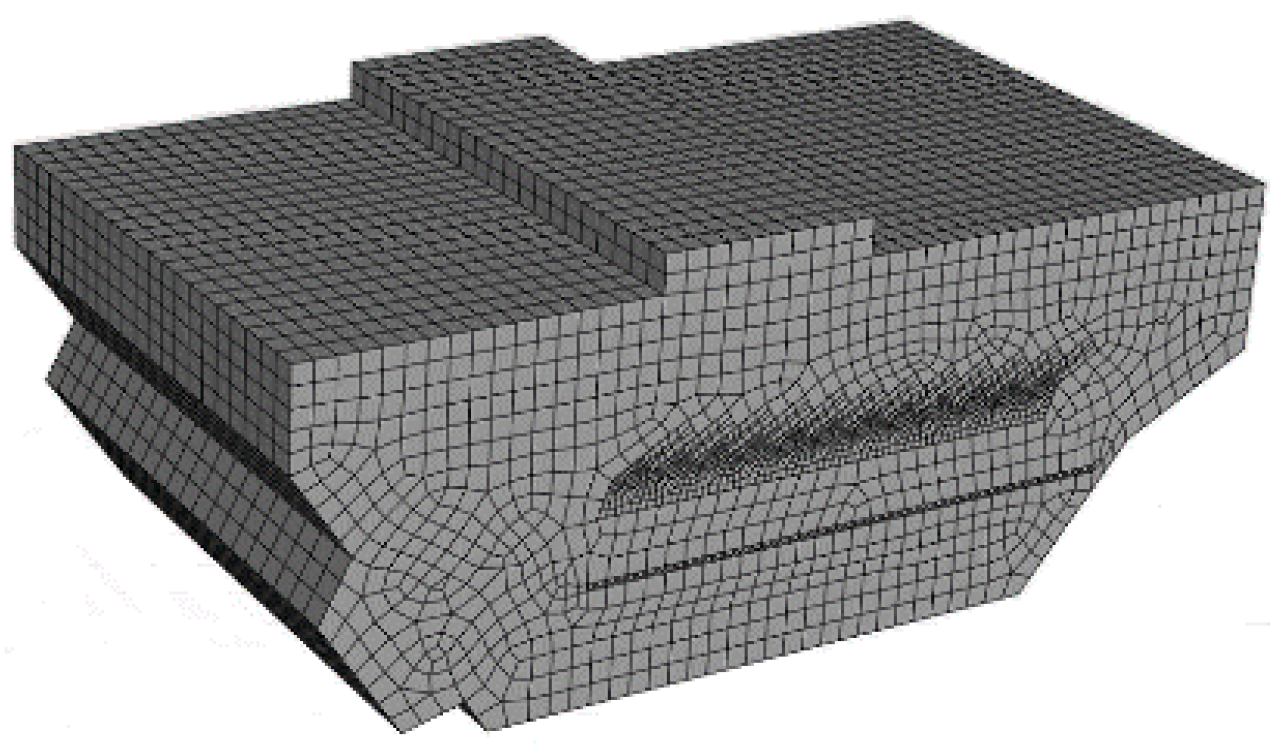
The cleaning device model of the flax combine was created in SolidWorks and the cleaning device was simplified. Parts that did not affect the simulation process, such as the cross-flow fan and drive pulley, were eliminated, and the three-dimensional model was saved in the “step” format and then imported into the geometry module in ANSYS Workbench. The fluid domain was extracted from the model. Then, the mesh was split in the Mesh module. In order to improve the accuracy of the simulation, tetrahedral structured mesh was used around the screen surface, and hexahedral structured mesh was used in the remaining areas, accounting for the computational power. Then, the screen surface was meshed; the mesh quality can be checked after the mesh division to meet the simulation requirements [16]. At the same time, the airflow inlet wall was named inlet, the airflow outlet wall was named outlet, the other walls were named wall, and the adjacent interface was set as interface. A total of 232,722 meshes were generated in the whole model. The CFD model setup and mesh partitioning of the cleaning system are shown in Figure 4 and Figure 5.

2.4.2. Parameter Settings in Fluent

The model was imported into Fluent, and in this study, humidity, temperature, and gas molecular interaction forces were neglected; air was used as the fluid medium with a density of 1.2 kg/m−3 and a viscosity of 1.8 × 10⁻⁵ Pa·s. The airflow was similar to an incompressible gas inside the cleaning device, so the k–ε model, which is applicable to turbulence, was chosen for transient calculations [17]. The operating pressure is 101.325 kPa and the gravitational acceleration is 9.81 m/s2. In the negative direction of the z-axis, the inlet boundary condition is set as the velocity inlet, and the outlet boundary condition is set as the pressure outlet, and the relative pressure is zero. The pressure-based SILPLE algorithm is used to solve the velocity and pressure fields. The momentum term is in the second-order windward format with a residual accuracy of 10−3 s [18].

2.4.3. Parameter Setting in EDEM

The particle phase parameters were calculated in EDEM during the convergence of Fluent calculations. The flax threshing material of each component can be divided into rhombic particles, elongated particles, square particles, and round particles according to the shape. Solidworks software was used to build a geometric model of the flax threshing material, and according to the outline of the geometric model of the flax threshing material, the coordinates and diameter of the filling ball were calculated in EDEM [19]. The flaxseed model was formed through the polymerization of 20 spherical particles, whose length, width, and height were 4.9, 2.6, and 1.0 mm, respectively; the capsule model was formed through the polymerization of 15 spherical particles, whose length, width, and height were 8.0, 8.0, and 9.0 mm, respectively; the capsule shell model was formed through polymerization of 9 spherical particles. Its length, width, and height are 6.0, 6.0, and 8.0 mm, respectively. The short stalk model is formed through stacking 10 spherical particles, whose length, width, and height are 21.0, 3.0, and 3.0 mm, respectively. The dust particles are formed through the polymerization of one spherical particle, whose length, width, and height are 4.0, 4.0, and 4.0 mm, respectively. The filling model of flax threshing material of each component is shown in Figure 6, and the mechanical properties between each material are shown in Table 2 [20].
Since the surface of each component threshing material in the cleaning system is smooth and non-sticky, the flaxseed grain and capsule shell models are ellipsoid–shaped from the superposition of round particles; the short stalk model is columnar; the Hertz–Mindlin (no slip) contact model is used for the particle–particle contact model in EDEM; the particle–geometry contact model is used for the Hertz–Mindlin (no slip) contact model. The geometry contact model was adopted as the Hertz–Mindlin (no slip) contact model [21]. The collision recovery coefficients between materials were set as follows: seed–seed, 0.25; seed–capsule, 0.27; seed–capsule shell, 0.3; seed–short stem, 0.3; seed–light impurity, 0.25; seed–wall, 0.5. The static coefficients of friction between materials were set as follows: seed–seed, 1.0; seed–capsule, 0.9; seed–capsule shell, 0.8; seed–short stalk, 0.8; seed–wall light impurities, 0.7; seed–wall, 0.58. The coefficient of the kinetic friction between each material was set to 0.01 [22]. In EDEM, a particle plant from the upper sieve 60 mm area was obtained to create a quadrilateral particle plant. At the same time, to meet the actual requirements, the particle plant size was set to 200 × 400 mm. The cleaning device was set to a feed rate of 0.04 kg/s. According to the ratio of each component of flax threshing material, the particle plant was set to generate 6800 seeds/s, 6150/s capsule shells, 150/s capsules, 1800/s light impurities, and 1250/s short stalks. The initial speed of the particles was set to the direction of the z–axis at 1 m/s.

2.4.4. CFD–DEM Coupling Parameter Settings

The UDF interface program was used to establish the CFD–DEM coupling relationship. The time step in EDEM was determined by the Rayleigh time step; in order to ensure the transfer of joint simulation data between Fluent and EDEM, the simulation time step and the data saving interval of the two must be an integer multiple [23]. Therefore, 20.08% of the Rayleigh time was used in EDEM for the calculations, and the time step was 4 × 10⁻⁷ s and the data saving interval was 0.01 s; the simulation time step in Fluent was 4 × 10⁻⁵ s, and the data were saved once every 500 time steps. The coupling interface was turned on after the simulation parameters of Fluent and EDEM were set, and the joint simulation was controlled using Fluent after the connection was successfully made to complete the simulation calculations.

3. Results

3.1. Box–Behnken Experimental Design

Based on the device’s operating parameters, as established in Section 2.2, this study employed the vibrating screen vibration frequency, the amplitude, and the fan wind speed as independent variables. Seed impurity content rate and cleaning loss rate served as response variables. Utilizing the Box–Behnken experimental design principles, the study established mathematical models for each three-factor, three-level response surface analysis, namely the responses of Y1, Y2, and their inter-factors, and their interactions. Table 3 depicts the coding for each experimental factor. Seventeen response surface analysis tests were conducted individually, and the results are displayed in Table 4, where X1, X2, and X3 represent the coded values of the testing variables. Data analysis and processing were conducted using Design Expert 13.0 software [24].

3.2. Experimental Results and Analysis

3.2.1. Regression Modeling and Testing

The numerical simulation test results are shown in Table 4, and the results were analyzed using software to obtain quadratic regression models for Y1 and Y2, respectively:
Y 1 = 3.04 0.57 X 1 + 0.24 X 2 0.35 X 3 + 0.52 X 1 X 2 0.083 X 1 X 3 + 0.31 X 2 X 3 + 0.33 X 1 2 + 0.89 X 2 2 + 0.41 X 3 2
Y 2 = 2.17 0.94 X 1 0.12 X 2 0.19 X 3 0.10 X 1 X 2 0.11 X 1 X 3 0.052 X 2 X 3 + 0.15 X 1 2 + 0.52 X 2 2 + 0.74 X 3 2
where Y1 is seed impurity rate; Y2 is the loss rate of cleaning; X1 is the vibration frequency (Hz); X2 is the vibration amplitude (mm); X3 is the fan wind speed (m/s).

3.2.2. Analysis of Variance of Regression Equations

According to the analysis of variance of the regression model, as presented in Table 5, the quadratic regression model of seed impurity rate p = 0.0005 indicates that the regression model is highly significant, and the misfit term’s value is p > 0.05. The quadratic regression model equation has the significance to accurately depict the correlation between the vibration frequency (X1), vibration amplitude (X2), wind speed (X3), and impurity rate of the seeds (Y1). Furthermore, the relationships within the model are capable of predicting the outcome of the optimization test. Among these factors, the primary factors influencing the seed impurity rate are the vibrating screen vibration frequency (X1) and the fan wind speed (X3), with a significant effect. The vibrating screen vibration amplitude (X2) also has an effect. In the secondary term, (X22) has a particularly significant impact on the seed impurity rate, while (X12) and (X32) have a significant impact. In the interaction term, the impacts of (X1X2) on the rate of seed impurity are notably significant, as are the impacts of (X2X3). Additionally, the combined effects of (X1X2) and (X2X3) exhibit particularly significant impacts on seed impurity rate. Moreover, (X2X3) demonstrates a significant impact on seed impurity rate, while (X1X3) has an insignificant impact. Based on the regression coefficients, it is evident that the primary factors affecting the impurity rate of the seeds, in decreasing order, are the vibration frequency of the double-deck vibrating screen (X1), the centrifugal fan wind speed (X3), and the vibration amplitude of the double-deck vibrating screen (X2).
Meanwhile, the quadratic regression model indicates a cleaning loss rate with a p–value of less than 0.0001, demonstrating the model’s high level of significance. Additionally, the misfit term has a p–value greater than 0. The quadratic regression model is significant, indicating an accurate description of the relationship between the vibrating screen’s vibrating frequency (X1), the vibrating amplitude (X2), the blower wind speed (X3), and the cleaning loss rate (Y2). These findings effectively predict the optimization experiment’s results. Among these terms, the impact of the vibrating screen vibration frequency (X1), the vibrating screen vibration amplitude (X2), and the fan wind speed (X3) as primary contributors to cleaning loss rates is significant. Additionally, secondary factors including (X12), (X22), and (X32) also have a noteworthy impact. Furthermore, the interaction term between (X1X2) and (X1X3) also significantly affected the cleaning loss rates, while the remaining terms did not produce a significant effect. Based on the regression coefficient sizes of each factor, the vibration frequency of the double-deck vibrating screen (X1), the wind speed of the centrifugal fan (X3), and the vibration amplitude of the double-deck vibrating screen (X2) were found to have the most impact on the cleaning loss rate, in descending order.

3.2.3. Resolution of Model Interaction Terms

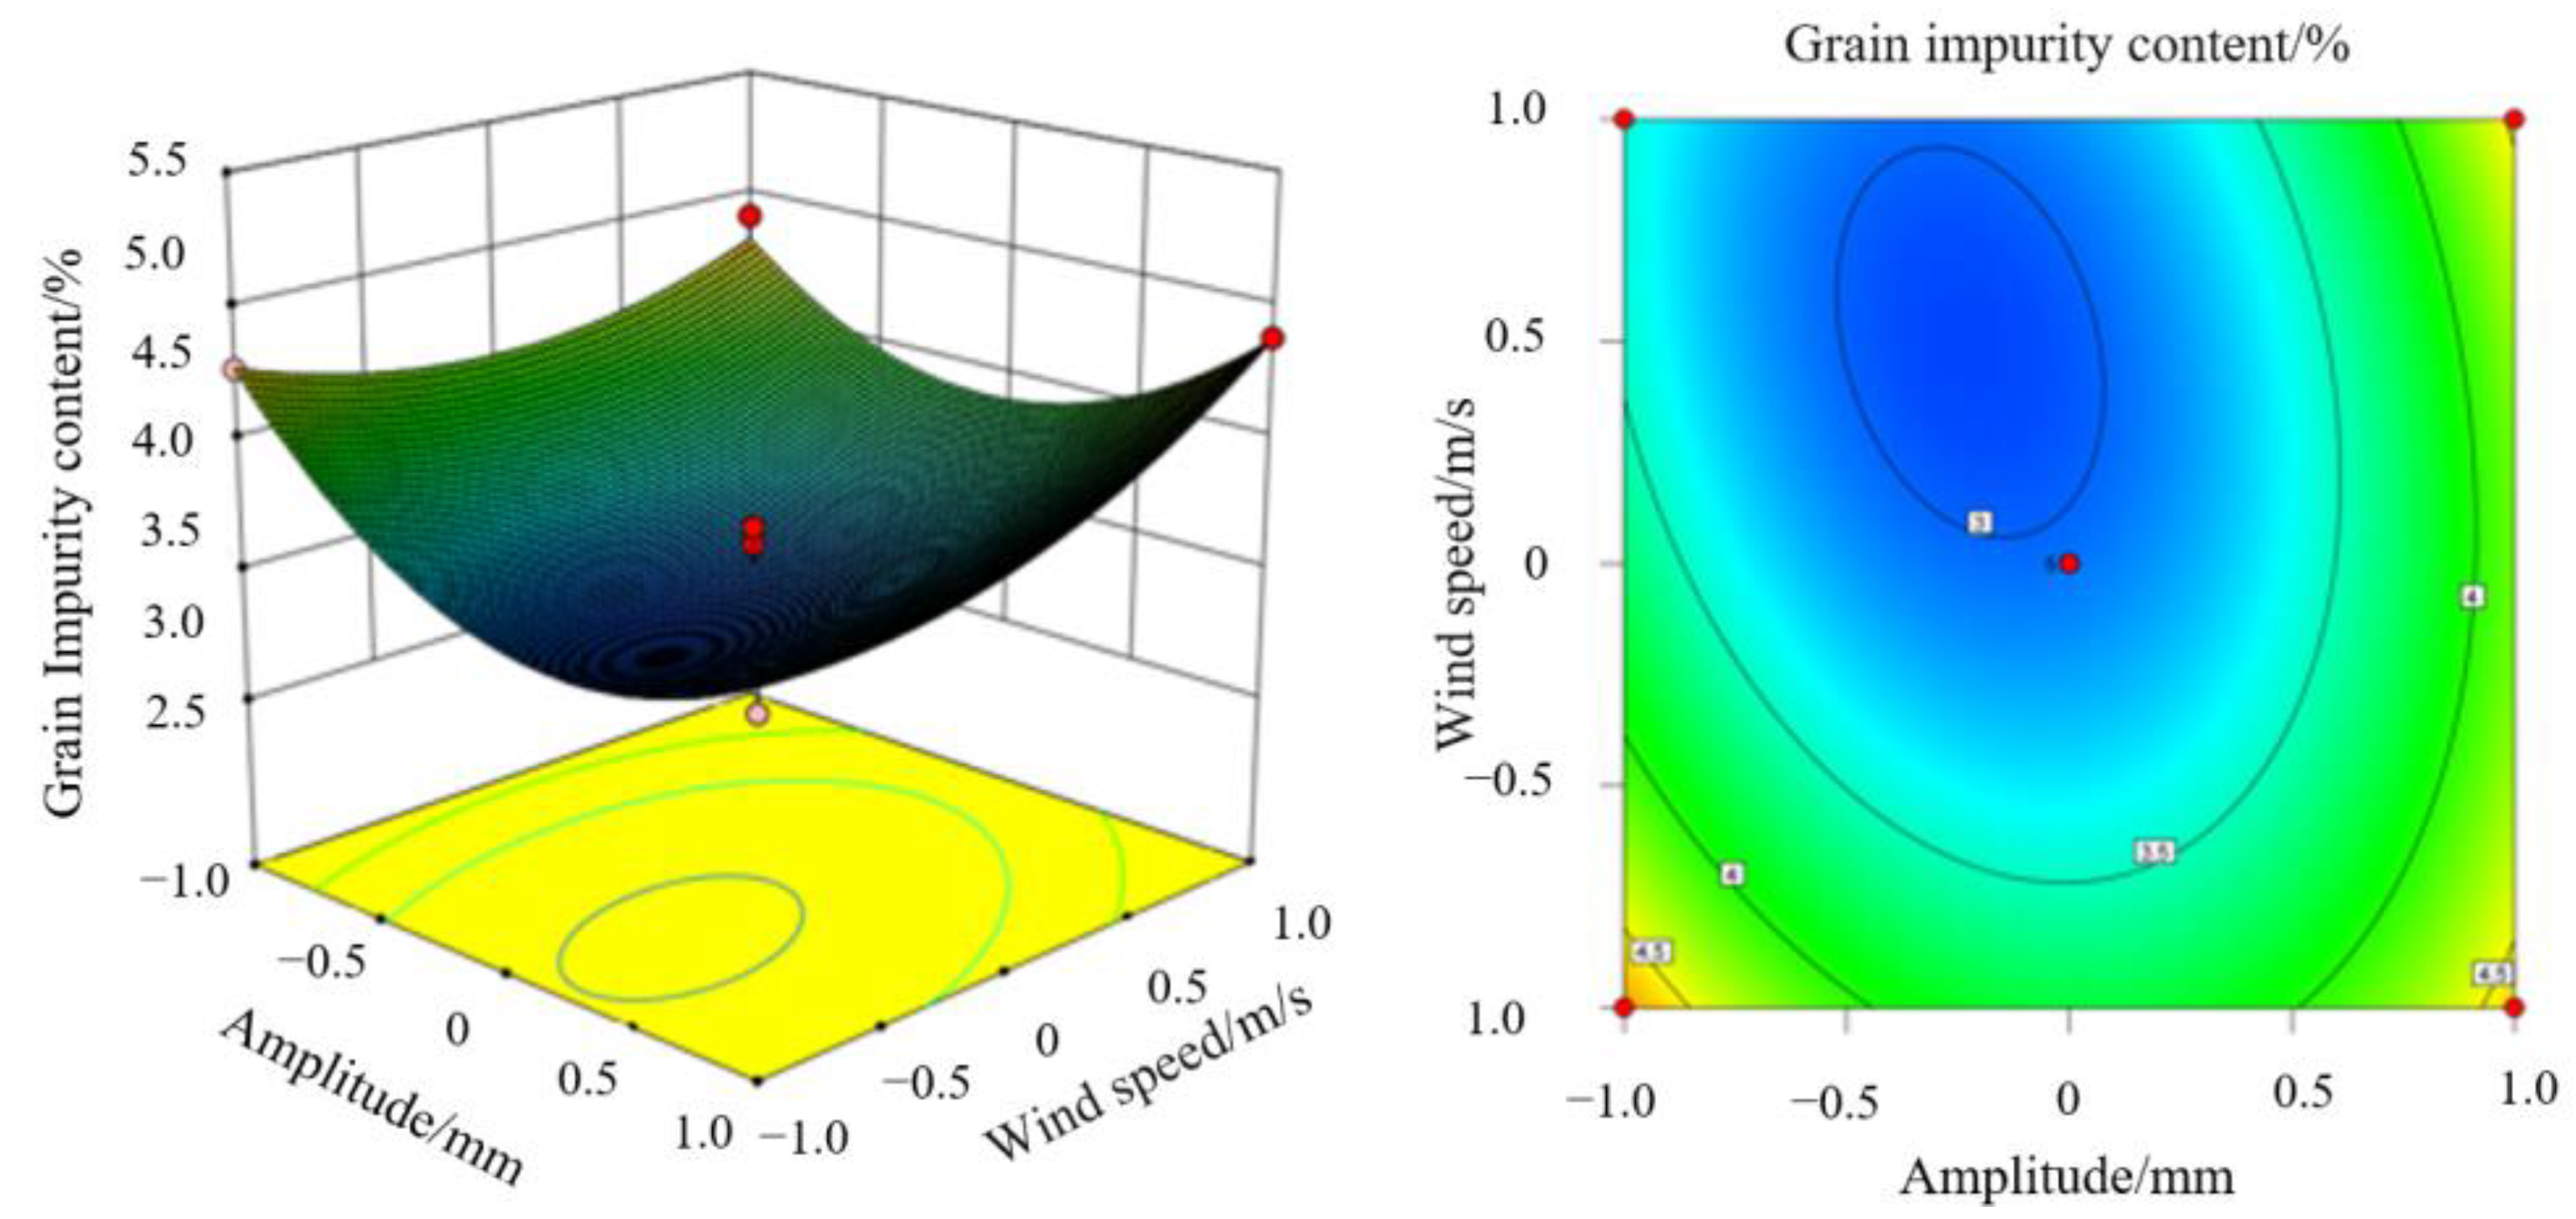
As shown in Figure 7, the impurity rate of seeds is lower when the vibration frequency of the vibrating screen is 10 Hz and the vibration amplitude is 10 mm. The impurity rate of seeds first decreases and then increases with the increase in vibrating screen amplitude as the vibration frequency increases, with the centrifugal fan wind speed fixed at 5.5 m/s. This is because, when the vibrating screen frequency and amplitude are low, the wind-sieve-type cleaning device operates with slow separation and cleaning processes. Therefore, a significant number of impurities in the flax threshing material pass through the sieve surface, resulting in a higher rate of seed impurities. At this point, the seed impurity rate is between 5% and 6%. With increasing vibration frequency and amplitude of the vibrating screen, more and more impurities are separated from the flax threshing material, resulting in a reduction in the grain impurity rate by between 3% and 4%. When the frequency of the vibrating screen increases to 10 Hz, its amplitude increases to 25 mm. Consequently, both the speed and amplitude of the vibrating screen movement become greater. As a result, the material collides with the screen surface with greater speed and its stay time on the surface becomes very short. These factors collectively facilitate faster separation and selection of materials during the separation process. The seeds discharged from the selection and separation devices contain more impurities. The operation of separating and selecting the seeds results in a lower content of impurities. However, due to this difference, the seeds with impurities have increased to a rate of 3%. Consequently, the impurity rate of seeds has risen to 3%~5%. The study shows that the vibrating screen’s vibration frequency and amplitude significantly affect the seed impurity rate during the operation of the wind sieve cleaning device in flax combine harvesters made for hilly and mountainous areas. The response surface contour density and shape further confirm this finding, which aligns with the analysis of variance results. Interestingly, the contour plot reveals that vibration frequency has a stronger impact on grain impurity rate compared to the vibration amplitude. This result corroborates the ANOVA results.
As demonstrated in Figure 8, during the interaction between the amplitude of the vibrating screen and the wind speed of the centrifugal fan, the impurity rate of the seeds is lower when the vibrating screen amplitude measures 15 mm and the centrifugal fan wind speed registers at 5.5 m/s. The results show that both the vibration amplitude of the vibrating screen and the wind speed of the centrifugal fan have a significant impact on the seed impurity rate of the cleaning device in the flax combine harvester. This is in line with the results of the analysis of variance. Moreover, the contour plot indicates that the vibration sieve frequency has a more significant effect on the impurity rate of the seeds than the centrifugal fan wind speed, as evidenced by the higher contour density in the direction of the vibration frequency.
Figure 9 shows that the cleaning loss rate is lowest at a vibrating screen frequency of 10 Hz and an amplitude of 15 mm in the interaction process between the two variables. Moreover, the cleaning loss rate initially decreases and then increases with increasing vibrating screen amplitude at a constant centrifugal fan wind speed of 5.5 m/s, as the vibration frequency increases. This occurs because the vibrating screen has low frequency and amplitude, the wind sieve cleaning device moves with small amplitude, and the screen surface moves at a low speed. This results in a low degree of discrete flax threshing material on the sieve surface, leading to more impurities being entrained with the seed. Therefore, the cleaning loss rate is higher, ranging from 3% to 4%. As the frequency and amplitude of the vibrating screen increase, the screen is able to separate the flax threshing materials, ultimately allowing the seeds to fall into the bin for collection. This process effectively reduces the rate of cleaning loss. When the frequency of the vibrating screen increased to 10 Hz, the amplitude rose to 25 mm. As a result, the speed and amplitude of the vibrating screen movement increased, causing poor contact between the material and the screen surface. Consequently, the operational effectiveness of separation and selection decreased. The flax threshing material also had a shorter stay time on the screen surface, and its backward movement was faster. As a consequence, seeds with impurities exited more separation and selection devices, leading to a loss rate of the selection process ranging from 1% to 3%. Based on the response surface contour density and shape, it is evident that the vibrating screen frequency and vibration amplitude greatly influence the seed impurity rate during operation of the wind sieve cleaning device of a flax combine harvester made for hilly and mountainous areas. This finding is in line with the analysis of variance results. Moreover, the contour plot indicates that the degree of vibration density is higher in the direction of the vibration frequency than the vibration amplitude, signifying that the frequency impacts the cleaning loss rate more significantly than the amplitude.
As demonstrated by Figure 10, during the interaction process of vibrating screen vibration frequency and centrifugal fan wind speed, the cleaning loss rate reduced when the vibrating screen vibration frequency was 10 Hz and centrifugal fan wind speed was 5.5 m/s. As the vibrating screen amplitude remained fixed at 15 mm, an increase in vibration frequency initially decreased the cleaning loss rate, but subsequently increased with an increase in centrifugal fan wind speed. This issue arises because of the low frequency of the vibrating screen and centrifugal fan speed. When the vibrating screen frequency was low, the flax threshing materials on the sieve surface were less dispersed, leading to ineffective cleaning of the clean grains by the separation cleaning device. The fan’s blowing speed is insufficient to expel the impurities caught in the airflow, causing an accumulation of dust and debris, which lowers the number of grains collected in the bin. This results in a high rate of grain loss during cleaning, up to 4%. When the fan speed increased to 5.5 m/s and the vibrating screen frequency rose to 6 Hz, the flax threshing material dispersed more uniformly across the sieve surface. This allowed the seeds to be effectively separated from the material, fall into the collection bin, and reduce the cleaning loss rate to 1–2%. As the fan wind speed and vibrating screen frequency increase, the airflow blows out impurities in the flax threshing material and some of the seeds from the device. Consequently, fewer seeds fall into the collection bin, resulting in a 3% increase in the loss rate of cleaning. The analysis reveals that there is a notable impact of both the vibration frequency of the vibrating screen and the centrifugal fan wind speed on the cleaning loss rate of the wind sieve in the operation of the hilly mountainous flax combine harvester. The results of the analysis of variance are aligned with the shape and density contour of the response surface, and the contour plots indicate higher intensity in the direction of vibration frequency compared to fan wind speed. These findings suggest that the effect of the vibration frequency of the vibrating screen on the cleaning loss rate is more significant than that of the fan wind speed.

3.2.4. Determination of Optimal Operating Parameters

Based on the results of quadratic regression and response surface analysis, this study aims to enhance the operational efficiency of a flax cleaning device using the vibrating screen vibration frequency (X1), the vibrating screen amplitude (X2), and the fan wind speed (X3) as independent variables. The optimization objective is to minimize the seed impurity rate (Y1) and cleaning loss rate (Y2). Within the limits of each experimental factor level, a full-factor quadratic regression equation for performance indicators was established. The equation was used to determine objective optimization and optimal working parameters under each test factor level [25].
m i n Y X = Y 1 X 1 X 2 X 3 Y 2 X 1 X 2 X 3
1 X 1 1 1 X 2 1 1 X 3 1
The Design Expert software’s optimization solver was employed to optimize and solve regression equation models (9) and (10) those under the object (11). The significance of the kernel impurity content (++++) and the cleaning loss rate (+++++) were considered. This led to the calculation of the optimized test indexes Y1 and Y2 at 2.97% and 2.17%, respectively. The ideal combination of parameters for the cleaning equipment tested is as follows: vibration frequency of the vibrating screen set at 6 Hz, vibration screen amplitude at 14.42 mm, and centrifugal fan wind speed at 5.96 m/s.

3.2.5. Transportation of Materials under Optimal Operating Parameters

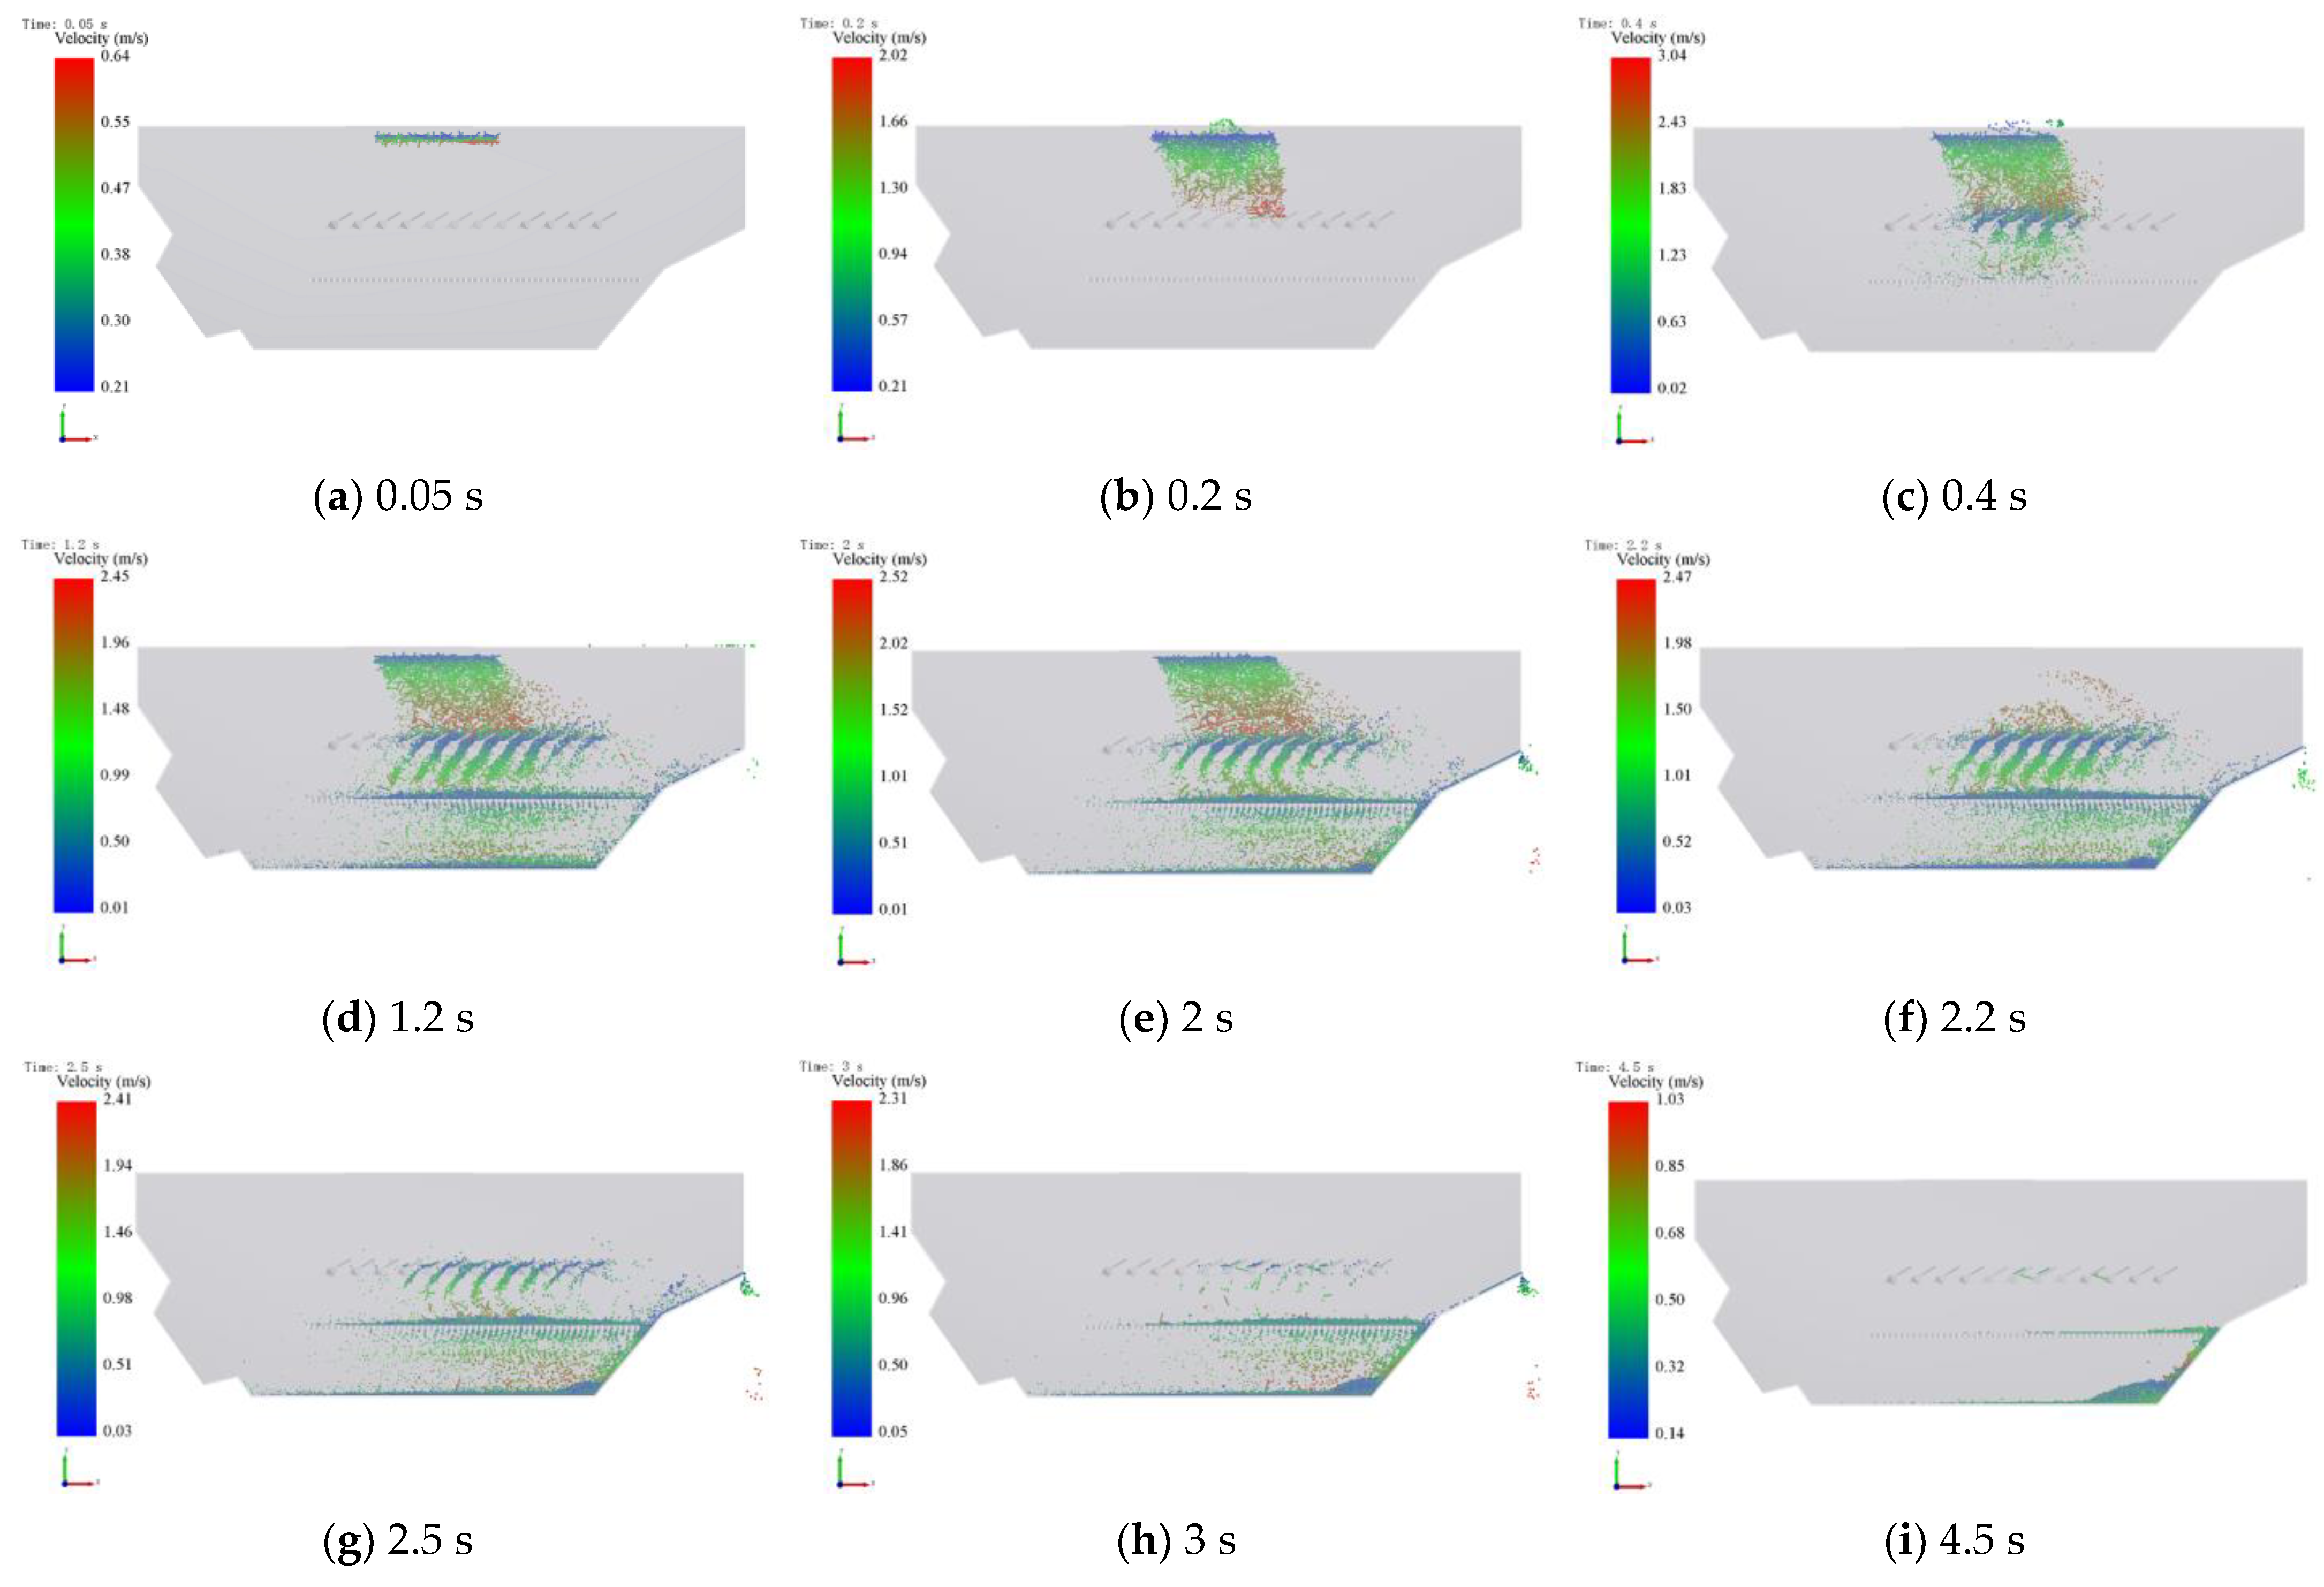
As depicted in Figure 11, the cleaning device operates under optimal parameters for the separation, cleaning, and transportation of flax threshing material. At t = 0.05 s, the airflow field operation of the cleaning device becomes stable and the flax threshing material particles begin to move downwards. This coupling simulation closely approximates the actual operating conditions of the flax combine harvester’s (made for hilly and mountainous areas) wind-sieve-type cleaning device. At 0.2 s, the flax threshing material is transported downwards to the fish scale screen surface. During this process, the lighter impurities within the flax threshing material begin to move backwards as a result of the airflow field. By 0.4 s, the larger mass of seeds, capsules, and stalks in the flax threshing materials have passed through the fish scale sieve and down to the woven screen surface. In the time interval of 0.4–2.0 s, the cleaning device stabilizes the operational process. The sieve separates most of the flax threshing material from the seeds. Due to gravity, some larger quality capsules and capsule shells fall through the sieve holes and collect in the silo. Meanwhile, smaller quality capsules and light debris get blown out from the wind-sieve-type cleaning device by the airflow present in the airflow field. When t = 2.2 s, no particles are produced by the particle plant. The simulation of a flax combine harvester made for hilly and mountainous areas shows that the machine harvesting is complete, and the threshing material is subjected to the airflow field and the vibrating screen to complete the separation and cleaning operations.
Using Factor-Level Test 11 as an example, we compared the general operating parameters with the optimal operating parameters of the flax cleaning device in the simulation results of the process. From Figure 12, we can observe that in the general operating parameters, there is sieve surface buildup on the threshing material. The resulting speed of the threshing material cloud was also analyzed. A thicker material layer, along with short stalks, capsule shells, and other impurities, hinders the passage of flaxseed grains through the sieve. Settlement or compaction of these impurities on the sieve surface further exacerbates the problem, resulting in a higher loss rate during cleaning operations. Under optimal operational parameters, the vibrating screen separates the material by causing seeds to sink, while stalks and capsule shells float, creating a layering effect. The material is suspended and fluffy on the screen surface with a thin layer and minimal air resistance.

4. Field Validation Tests

To further verify the operational performance of the flax cleaning device under optimal parameter combinations, a field work performance test of the entire flax combine harvester was conducted at Article Hill Farm in Tiao Shan County, Gansu Province in August 2023. The experimental material used was Longya 19, which had an average plant height of 503 mm and a flaxseed water content of 5.66%. The test was carried out in conformity with relevant standards such as GB/T 8097–2008 for “Harvesting Machinery Combine Test Methods” [26], as presented in Figure 13.
According to testing standards, as well as the specific characteristics of flax cultivation in Gansu Province and the demands of mechanized flax harvesting in the hilly and mountainous areas of the Northwest Dry Zone, the flax combine harvester is required to maintain an impurity rate and loss rate of no more than 5% [27]. Upon testing, the machine demonstrated smooth operation without any instances of winding, blocking, or other malfunctions. At the conclusion of the test, results are presented in the Table 6 after calculating indicators using Formulas (7) and (8). Figure 13 illustrates that during field operations, miscellaneous residues are consistently and uniformly discharged without any accumulation of threshing materials on the sieve surface. Additionally, the machine-harvested flax retained its original shape with fewer breakages. The seed impurity rate and cleaning loss rate meet the requirements of the relevant test standards. The analysis of the movement trajectory and position distribution of the threshing material through experimental knot comparison reveals the movement trajectory of the material within the cleaning device aligns closely with the simulation test analysis results. This verifies the reliability and feasibility of the simulation model.

5. Conclusions

(1)
Through an analysis of the working process of the Hu combine harvester cleaning device, this study aimed to determine the key parameters of the flax combine harvester cleaning device operating range. Based on an EDEM, this study established a discrete element model of each component of the flax threshing material. Fluent was used to establish the computational domain of the fluid. CFD–DEM joint simulation of the movement process of flax threshing materials in the device was used for numerical simulation tests.
(2)
Combined with Box–Behnken experimental design principle, the three-factor three-level response surface analysis method was adopted to carry out a simulation test of the operation of the cleaning device under different combinations of working parameters. A quadratic regression model of the impurity rate of the grains and the loss rate of cleaning was obtained with the help of Design Expert 13.0 software. The effects of the vibrating screen frequency, the vibrating screen amplitude, and the fan wind speed on the response values were analyzed. The optimal combination of working parameters of the cleaning device was obtained: vibrating screen frequency of 6 Hz, vibrating screen amplitude of 14.42 mm, and wind speed of centrifugal fan of 5.96 m/s. Under the optimal combination of working parameters, the impurity rate of the grains after the completion of the operation of the cleaning device was 2.97%, and the loss rate of the cleaning device was 2.17%.
(3)
The field verification test showed that with the water content of the flax grain at 5.66%, and utilizing the optimal operating parameters—a cleaning loss rate of 3.58%, a grain impurity rate of 3.16%—the test results increased by 0.61% and 0.99%, respectively, compared with the simulation test results. These results meet the requirements of flax combine harvester operation. Through the experimental knot comparison analysis of the movement trajectory and the position distribution of the threshing material, it can be seen that the movement trajectory of the material in the cleaning device is highly consistent with the results of the simulation test analysis, which verifies the reliability and feasibility of the simulation model.

Author Contributions

Conceptualization, P.X. and F.D.; methodology, Z.Y.; software, P.X. and Z.Y.; validation, R.S., Y.Z. and W.Z.; formal analysis, P.X.; investigation, F.D.; resources, P.X. and X.S.; data curation, Z.Y.; writing—original draft preparation, F.D. and P.X.; writing—review and editing, F.D. and P.X.; visualization, P.X.; supervision, F.D.; project administration, W.Z.; funding acquisition, F.D. All authors have read and agreed to the published version of the manuscript.

Funding

This research was funded by Ministry of Finance and Ministry of Agriculture and Rural Affairs: National System of Modern Agricultural Industry Technology (Grant No. CARS–14–1–28), Fuxi Young Talents Fund of Gansu Agricultural University (Grant No. Gaufx–03Y01), Gansu Agricultural University Youth Mentor Fund Project (Grant No. GAU–QDFC–2021–08).

Data Availability Statement

The data presented in this study are available on request from the corresponding author.

Conflicts of Interest

The authors declare no conflict of interest.

References

  1. Goyal, A.; Sharma, V.; Upadhyay, N.; Gill, S.; Sihag, M. Flax and flaxseed oil: An ancient medicine & modern functional food. Int. J. Food. Sci. Tech. 2014, 51, 1633–1653. [Google Scholar]
  2. Dai, F. Study on the Separating—Cleaning Mechanism and Key Technology of Flax Threshing Material. Ph.D. Thesis, Gansu Agricultural University, Lanzhou, China, 2020. [Google Scholar]
  3. Dudarev, I. A review of fibre flax harvesting: Conditions, technologies, processes and machines. J. Nat. Fibers 2022, 19, 4496–4508. [Google Scholar] [CrossRef]
  4. Wu, J.; Tang, Q.; Mu, S.; Yang, X.; Jiang, L.; Hu, Z. Design and Test of Self–Leveling System for Cleaning Screen of Grain Combine Harvester. Agriculture 2023, 13, 377. [Google Scholar] [CrossRef]
  5. Zhang, C.; Geng, D.; Xu, H.; Li, X.; Ming, J.; Li, D.; Wang, Q. Experimental Study on the Influence of Working Parameters of Centrifugal Fan on Airflow Field in Cleaning Room. Agriculture 2023, 13, 1368. [Google Scholar] [CrossRef]
  6. Wang, L.; Yu, Y.; Zhang, S.; Feng, X.; Song, L. Bionic design and performance test of maize grain cleaning screen through earthworm motion characteristics. Int. J. Agric. Biol. Eng. 2021, 14, 12–21. [Google Scholar] [CrossRef]
  7. Xu, L.; Li, Y.; Chai, X.; Wang, G.; Liang, Z.; Li, Y.; Li, B. Numerical simulation of gas–solid two–phase flow to predict the cleaning performance of rice combine harvesters. Biosyst. Eng. 2020, 190, 11–24. [Google Scholar] [CrossRef]
  8. Hu, Z.; Zeng, H.; Ge, Y.; Wang, W.; Wang, J. Simulation and experiment of gas–solid flow in a safflower sorting device based on the CFD–DEM coupling method. Processes 2021, 9, 1239. [Google Scholar] [CrossRef]
  9. Li, H.; Tang, Y.; Zhang, H.; Liu, Y.; Zhang, Y.; Niu, H. Technological parameter optimization for walnut shell–kernel winnowing device based on neural network. Front. Bioeng. Biotech. 2023, 11, 1107836. [Google Scholar] [CrossRef]
  10. Ren, D.; Yu, H.; Zhang, R.; Li, J.; Zhao, Y.; Liu, F.; Zhang, J.; Wang, W. Research and experiments of hazelnut harvesting machine based on CFD–DEM analysis. Agriculture 2022, 12, 2115. [Google Scholar] [CrossRef]
  11. Yuan, Z.X. Simulation Analysis and Experiment of Separation and Cleaning System of Flax Combine Harvester in Hilly Region. Master’s Thesis, Gansu Agricultural University, Lanzhou, China, 2022. [Google Scholar]
  12. Dai, F.; Guo, W.; Song, X.; Shi, R.; Qu, J.; Zhao, W. Measurement and simulation of the suspension velocity of flax threshing material using CFD–DEM. Int. J. Agric. Biol. Eng. 2021, 14, 230–237. [Google Scholar] [CrossRef]
  13. Li, X.; Zhao, G.; Wang, W.; Huang, Y.; Ji, J. Design and Experiment of Vibrating Screen Millet Cleaning Device with Double–fan. Appl. Eng. Agric. 2021, 37, 319–331. [Google Scholar] [CrossRef]
  14. Zhang, H.; Zhou, Z.; Qu, Z.; Li, Z.; Wang, W. Simulation and experiment of sieving process of sieving device for tiger nut harvester. Agriculture 2022, 12, 1680. [Google Scholar] [CrossRef]
  15. Song, H. Flax(til) sheller of 5TF-45 type design and research. Master’s Thesis, Shanxi Agricultural University, Taiyuan, China, 2017. [Google Scholar]
  16. Gao, Y.; Song, L.; Wang, L.; Wang, H.; Li, Y. Behavior of maize grains on the three–dimensional translational vibrating sieve. Powder. Technol. 2022, 412, 117999. [Google Scholar] [CrossRef]
  17. El–Emam, M.A.; Shi, W.; Zhou, L. CFD–DEM simulation and optimization of gas–cyclone performance with realistic macroscopic particulate matter. Adv. Powder. Technol. 2019, 30, 2686–2702. [Google Scholar] [CrossRef]
  18. Wang, L.; Chai, J.; Wang, H.; Wang, Y. Design and performance of a countersunk screen in a maize cleaning device. Biosyst. Eng. 2021, 209, 300–314. [Google Scholar] [CrossRef]
  19. Yuan, J.; Wu, C.; Li, H.; Qi, X.; Xiao, X.; Shi, X. Movement rules and screening characteristics of rice–threshed mixture separation through a cylinder sieve. Comput. Electron. Agric. 2018, 154, 320–329. [Google Scholar] [CrossRef]
  20. Dai, F.; Song, X.; Guo, W.; Zhao, W.; Zhang, F.; Zhang, S. Simulation and test on separating cleaning process of flax threshing material based on gas–solid coupling theory. Int. J. Agric. Biol. Eng. 2020, 13, 73–81. [Google Scholar] [CrossRef]
  21. Zhang, Z.; Shi, G.; Li, J.; Wang, X.; Ding, L.; Wang, L. Analysis of jujube movement characteristics under positive and negative pressure airflow based on CFD–DEM. Comput. Electron. Agric. 2023, 210, 107902. [Google Scholar] [CrossRef]
  22. Li, J.; He, J.; Xu, F.; Wang, Y. Process Simulation and Analysis of Flax Cleaning Device Based on EDEM-Fluent Coupling. Agric. Eng. 2021, 11, 76–81. [Google Scholar]
  23. Li, H.; Li, Y.; Gao, F.; Zhao, Z.; Xu, L. CFD–DEM simulation of material motion in air–and–screen cleaning device. Comput. Electron. Agric. 2012, 88, 111–119. [Google Scholar] [CrossRef]
  24. Chai, X.; Xu, L.; Sun, Y.; Liang, Z.; Lu, E.; Li, Y. Development of a cleaning fan for a rice combine harvester using computational fluid dynamics and response surface methodology to optimize outlet airflow distribution. Biosyst. Eng. 2020, 192, 232–244. [Google Scholar] [CrossRef]
  25. Li, Y.; Lu, C.; Li, H.; He, J.; Wang, Q.; Huang, S.; Gao, Z.; Yuan, P.; Wei, X.; Zhan, H. Design and experiment of spiral discharge anti–blocking and row–sorting device of wheat no–till planter. Agriculture 2022, 12, 468. [Google Scholar] [CrossRef]
  26. Zhang, J.; Gao, Z.; Cai, J.; Ye, E.; Rui, Z.; Wang, Y. Design and experiments of cotton stalk pulling machine with horizontal-counter rollers. Trans. Chin. Soc. Agric. Eng. 2021, 37, 43–52. [Google Scholar]
  27. Mańkowski, J.; Maksymiuk, W.; Spychalski, G.; Kołodziej, J.; Kubacki, A.; Kupka, D.; Pudełko, K. Research on new technology of fiber flax harvesting. J. Nat. Fibers. 2018, 15, 53–61. [Google Scholar] [CrossRef]
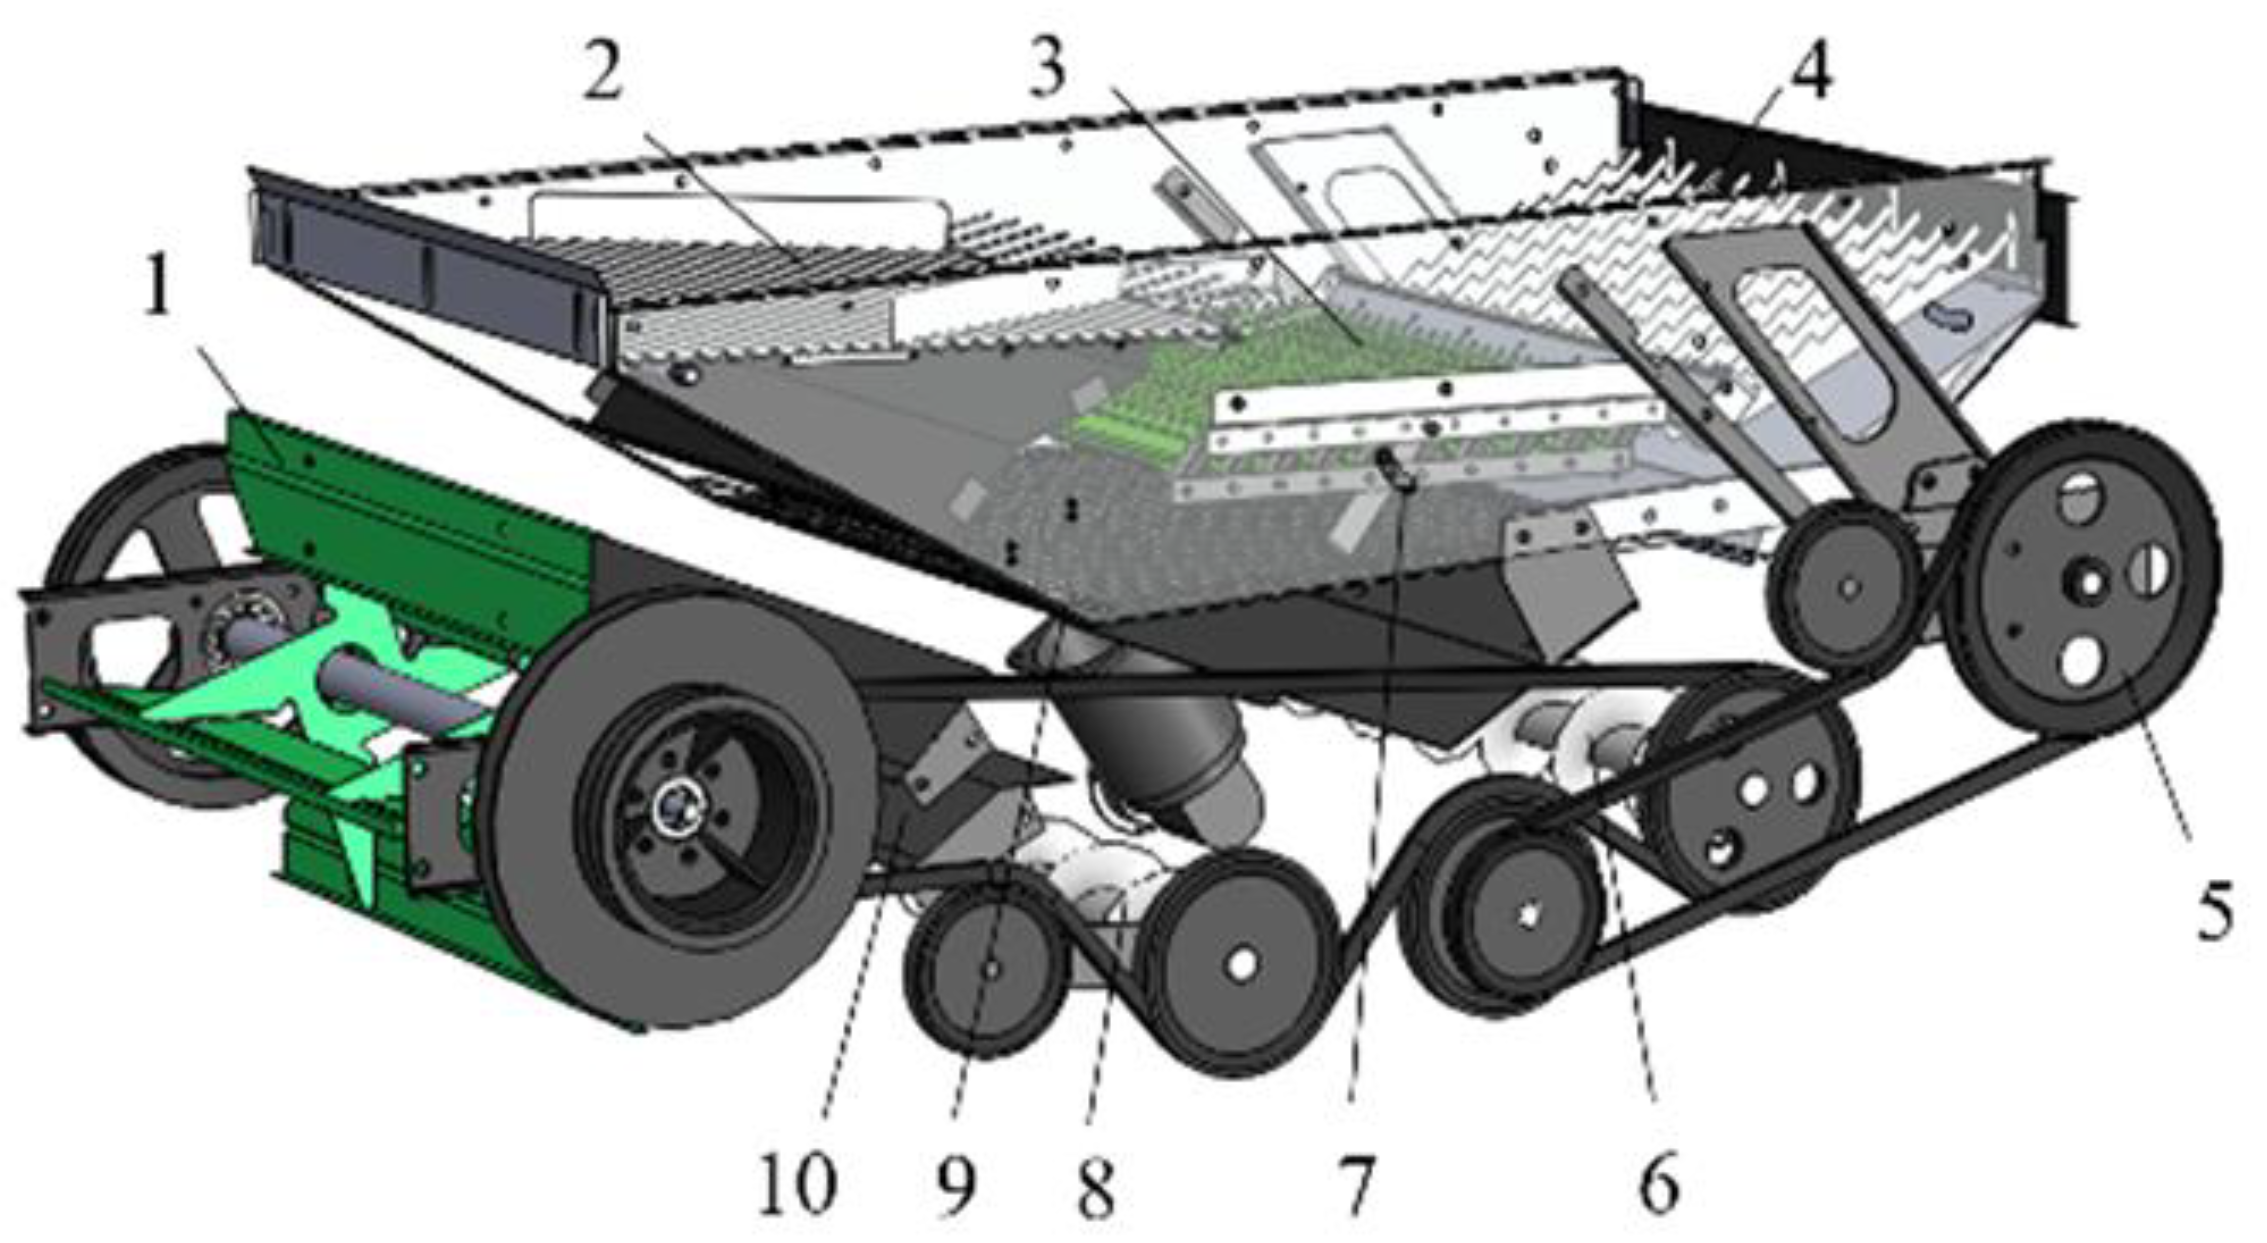
Figure 1. Structure of the cleaning device of the joint flax harvester: 1—blower; 2—vibration plate; 3—fish scale screen; 4—end screen; 5—eccentric wheel; 6—secondary dirt conveyor screw; 7—fish scale screen-opening–adjustment device; 8—primary seed-conveyor screw; 9—bottom screen; 10—wind-adjustment plate.
Agriculture 13 02123 g001
Figure 2. Force analysis of flaxseed grains on the screen surface.
Agriculture 13 02123 g002
Figure 3. Proportion of each component of flax threshing material.
Agriculture 13 02123 g003
Figure 4. Simplified model of the cleaning unit—1; cleaning chamber—2; inlet—3; fish scale sieve—4; exhaust port—5; woven sieve—6.
Agriculture 13 02123 g004
Figure 5. Grid division of the cleaning device.
Agriculture 13 02123 g005
Figure 6. Discrete elemental modeling of flax threshing materials and components. (a) Flax threshing material; (b) flaxseed; (c) capsule; (d) capsule shell; (e) flax short stem; (f) light impurities.
Agriculture 13 02123 g006
Figure 7. Effect of vibration frequency and vibration amplitude of vibrating screen on the impurity rate of seeds.
Agriculture 13 02123 g007
Figure 8. Effect of vibration amplitude of vibrating screen and wind speed of centrifugal fan on seed impurity rate.
Agriculture 13 02123 g008
Figure 9. Influence of vibrating screen vibration frequency and vibration amplitude on cleaning loss rate.
Agriculture 13 02123 g009
Figure 10. Effect of vibration frequency of vibrating screen and wind speed of centrifugal fan on cleaning loss rate.
Agriculture 13 02123 g010
Figure 11. T-sorting device in the optimal operating parameters of the object transport process.
Agriculture 13 02123 g011
Figure 12. Comparison of threshing material velocity clouds: (a) general working parameters; (b) optimum working parameters.
Agriculture 13 02123 g012
Figure 13. Field experiment: (a) accumulation of threshed material on the screen surface during operation; (b) discharge of debris during operation; (c) flaxseed kernels collected at grain outlets.
Agriculture 13 02123 g013
Table 1. Technical parameters of the cleaning device.
ParameterNumerical Value
Structure centrifugalfan + double-deck vibrating screen
Centrifugal fan outlet height/mm240
Fan impeller outer diameter/mm350
Number of fan blades4
Outlet wind speed/(m·s−1)12
Fan wind pressure full pressure/pa15.64
Fan speed/(r·min−1)940
Size of fish scale sieve plate/mm1200 × 650
Lower sieve hole size/mm10 × 10
Sieve surface angle/(°)4
Table 2. Mechanical properties of materials.
ItemParameterValue
Flax seedPoisson’s ratio0.25
Shear modulus/MPa750
Density/(kg·m−3)10
Flax short stemPoisson’s ratio0.25
Shear modulus/MPa100
Density/(kg·m−3)150
CapsulePoisson’s ratio0.20
Shear modulus/MPa15
Density/(kg·m−3)120
Capsule shellPoisson’s ratio0.25
Shear modulus/MPa12
Density/(kg·m−3)100
Light impuritiesPoisson’s ratio0.25
Shear modulus/MPa100
Density/(kg·m−3)50
Sieve surfacePoisson’s ratio0.30
Shear modulus/MPa700
Density/(kg·m−3)7800
Table 3. Experimental factor level coding table.
CodingVibration Frequency
X1/Hz
Vibration Amplitude
X2/mm
Fan Wind Speed
X3/(m·s−1)
−1253.5
06155.5
110257.5
Table 4. Response surface test results.
Test No.X1X2X3Y1/%Y2/%
10−113.263.46
20114.543.1
30003.202.17
401−14.813.51
50003.332.1
61−103.132.13
70003.022.23
80002.852.15
910−13.432.43
100002.792.19
11−1−105.083.78
121012.771.77
130−1−14.763.66
14−1104.343.75
15−10−14.634.13
16−1014.303.90
171104.481.68
Table 5. Analysis of variance.
Test IndicatorsSource of VariationSquare SumDegrees of FreedomMean SquareFp
Seed impurity rateModel10.4191.1617.790.0005 **
X12.5812.5839.610.0004 **
X20.4710.477.230.0311 *
X30.9510.9514.640.0065 **
X1X21.0911.0916.790.0046 **
X1X30.02710.0270.420.5383
X2X30.3810.385.810.0467 *
X120.4610.467.040.0328 *
X223.3313.3351.240.0002 **
X320.7210.7211.130.0125 *
Residual0.4670.065
Misfit0.2530.0821.580.3272
Error0.2140.052
Sum10.8716
Sorting loss rateModel11.4891.28431.27<0.0001 **
X17.1317.132408.94<0.0001 **
X20.1210.1241.420.0004 **
X30.2810.2895.09<0.0001 **
X1X20.04410.04414.910.0062 **
X1X30.04610.04615.630.0055 **
X2X30.01110.0113.730.0948
X120.09010.09030.340.0009 **
X221.1411.14386.40<0.0001 **
X322.3312.33786.90<0.0001 **
Residual0.02172.958 × 10−3
Misfit0.01133.808 × 10−31.640.3145
Error9.280 × 10−342.320 × 10⁻³
Sum11.5016
Note: ** indicates highly significant effect (p ≤ 0.01); * indicates significant effect (0.01 < p ≤ 0.05).
Table 6. Test results on operational performance of flax combine harvester cleaning device.
Test IndexImpurity RateLoss Rate
Standard value≤ 5%≤ 5%
Test results3.08%3.86%
Disclaimer/Publisher’s Note: The statements, opinions and data contained in all publications are solely those of the individual author(s) and contributor(s) and not of MDPI and/or the editor(s). MDPI and/or the editor(s) disclaim responsibility for any injury to people or property resulting from any ideas, methods, instructions or products referred to in the content.