Abstract
During the operation of the cooling system, a large array of temperature and humidity values was obtained inside and outside the cowshed. On the basis of the obtained data set, mathematical models of temperature, humidity and temperature–humidity indices were developed. The modelled values were relevant to the actual values. The mathematical models were built on the basis of regression analysis of the data set. The data set was obtained as a result of the observations of temperature and relative humidity on one of the farms in Lithuania in semi-insulated box-type cowshed for 244 places in the summer. It was established that the efficiency of the air-cooling system is higher at a higher temperature and lower relative humidity of the air entering the cowshed. Lower humidity values contribute to a more intense decrease in the temperature–humidity index during the operation of the cooling system. The presented mathematical models are useful tools for decision making regarding the choice of cooling system operation models, as they allow one to evaluate the cooling efficiency, taking into account the influence of external factors.
1. Introduction
A necessary condition for keeping cows is to ensure the necessary parameters of the microclimate in the cowshed [1] because increased temperature and humidity can contribute to heat stress in animals [2,3,4]. Heat stress has a negative effect on the physiological state of cows and their productivity [5], and the quality of the obtained milk may deteriorate [6,7]. It should be noted that the main parameter by which it is possible to determine whether the cows are in conditions of heat stress is the temperature–humidity index (THI). The THI is determined taking into account the values of both temperature and relative humidity of the air [1,3,8]. In particular, the study [9] established a direct relationship between the change in THI for the air outside the cowshed and the THI inside the cowshed; in the cowshed, the THI was significantly higher due to the significant release of heat and moisture from the animals. Scientific studies have also proven that increased temperature and humidity in cowsheds leads to an increase in greenhouse gas emissions from the animals’ activity [10,11].
The analysis of the conducted studies, in particular [12,13], indicates that in the summer, the air temperature, humidity and THI often exceed the comfortable values for animals kept in cowsheds with classical ventilation. Without the use of additional cooling systems in cowsheds, it is difficult to achieve comfortable conditions for keeping cows in hot weather. Therefore, there is a need to use cooling systems, which should effectively reduce the temperature in the cowshed with a minimum possible energy consumption [8]. This is the case with air-cooling systems based on spraying micro-droplets of water with a diameter of up to 60 nm via adiabatic humidification systems, or “artificial fog” systems [14,15]. For example, [14] proved that a system using water spraying cooled the cows by several degrees. However, the influence of microclimate parameters in the cowshed and the parameters of the cooling system on the level of cooling of the cows was not investigated. The work in [2] investigated the efficiency of the cooling system based on fans installed under the roof of the cowsheds, which were equipped with a water spray system (“artificial fog” system). The work confirmed the effectiveness of such a cooling system, but the interaction of temperature and humidity on the reduction in temperature and THI was not investigated. The study [16] proved that without the use of cooling systems at high air temperatures outside the cowshed (more than 30 °C), cows would always be in conditions of heat stress, but the dynamics of the mutual influence of temperature and humidity on the microclimate in the cowshed was not investigated. The analysis of the conducted studies allows us to state that there is difficulty taking into account the influence of a number of factors that affect the efficiency of the cooling system’s operation depending on the temperature and the relative humidity of the air entering the cowshed, in particular the influence of technological and technical parameters of the cowshed cooling system, the structural features of the cowshed itself, the influence of sudden changes in weather conditions, the influence of heat and moisture released from animals in the cowshed, and other factors. The influence of extraneous factors is a general characteristic of similar cooling systems. For example, in the review [17] of 28 studies on the operation of cooling systems, significant differences in temperature reduction under the same climatic conditions were recorded for different cooling systems. In [18], mathematical models of the efficiency of the cooling system were obtained that take into account the temperature and relative humidity, but theses models were obtained only for specific types of sprayers and for a specific layout of the cooling system. And in theoretical studies [19] of the air-cooling process due to moisture evaporation, it is claimed that such cooling is ineffective at a relative humidity above 45%.
The analysis of the studies conducted suggests that there have been many studies on the impact of cooling systems on the microclimate in cowsheds. However, there is virtually no research on the effect of temperature and relative humidity on temperature and THI changes with the development of adequate mathematical models. Also, it can be argued that there is virtually no research on the impact of external factors on the efficiency of cooling systems. In this study, we propose to design a mathematical model of the cooling system based on statistical studies and to compare the results obtained according to the model and the actual results. We believe that such a mathematical model will indirectly take into account the influence of external factors.
2. Materials and Methods
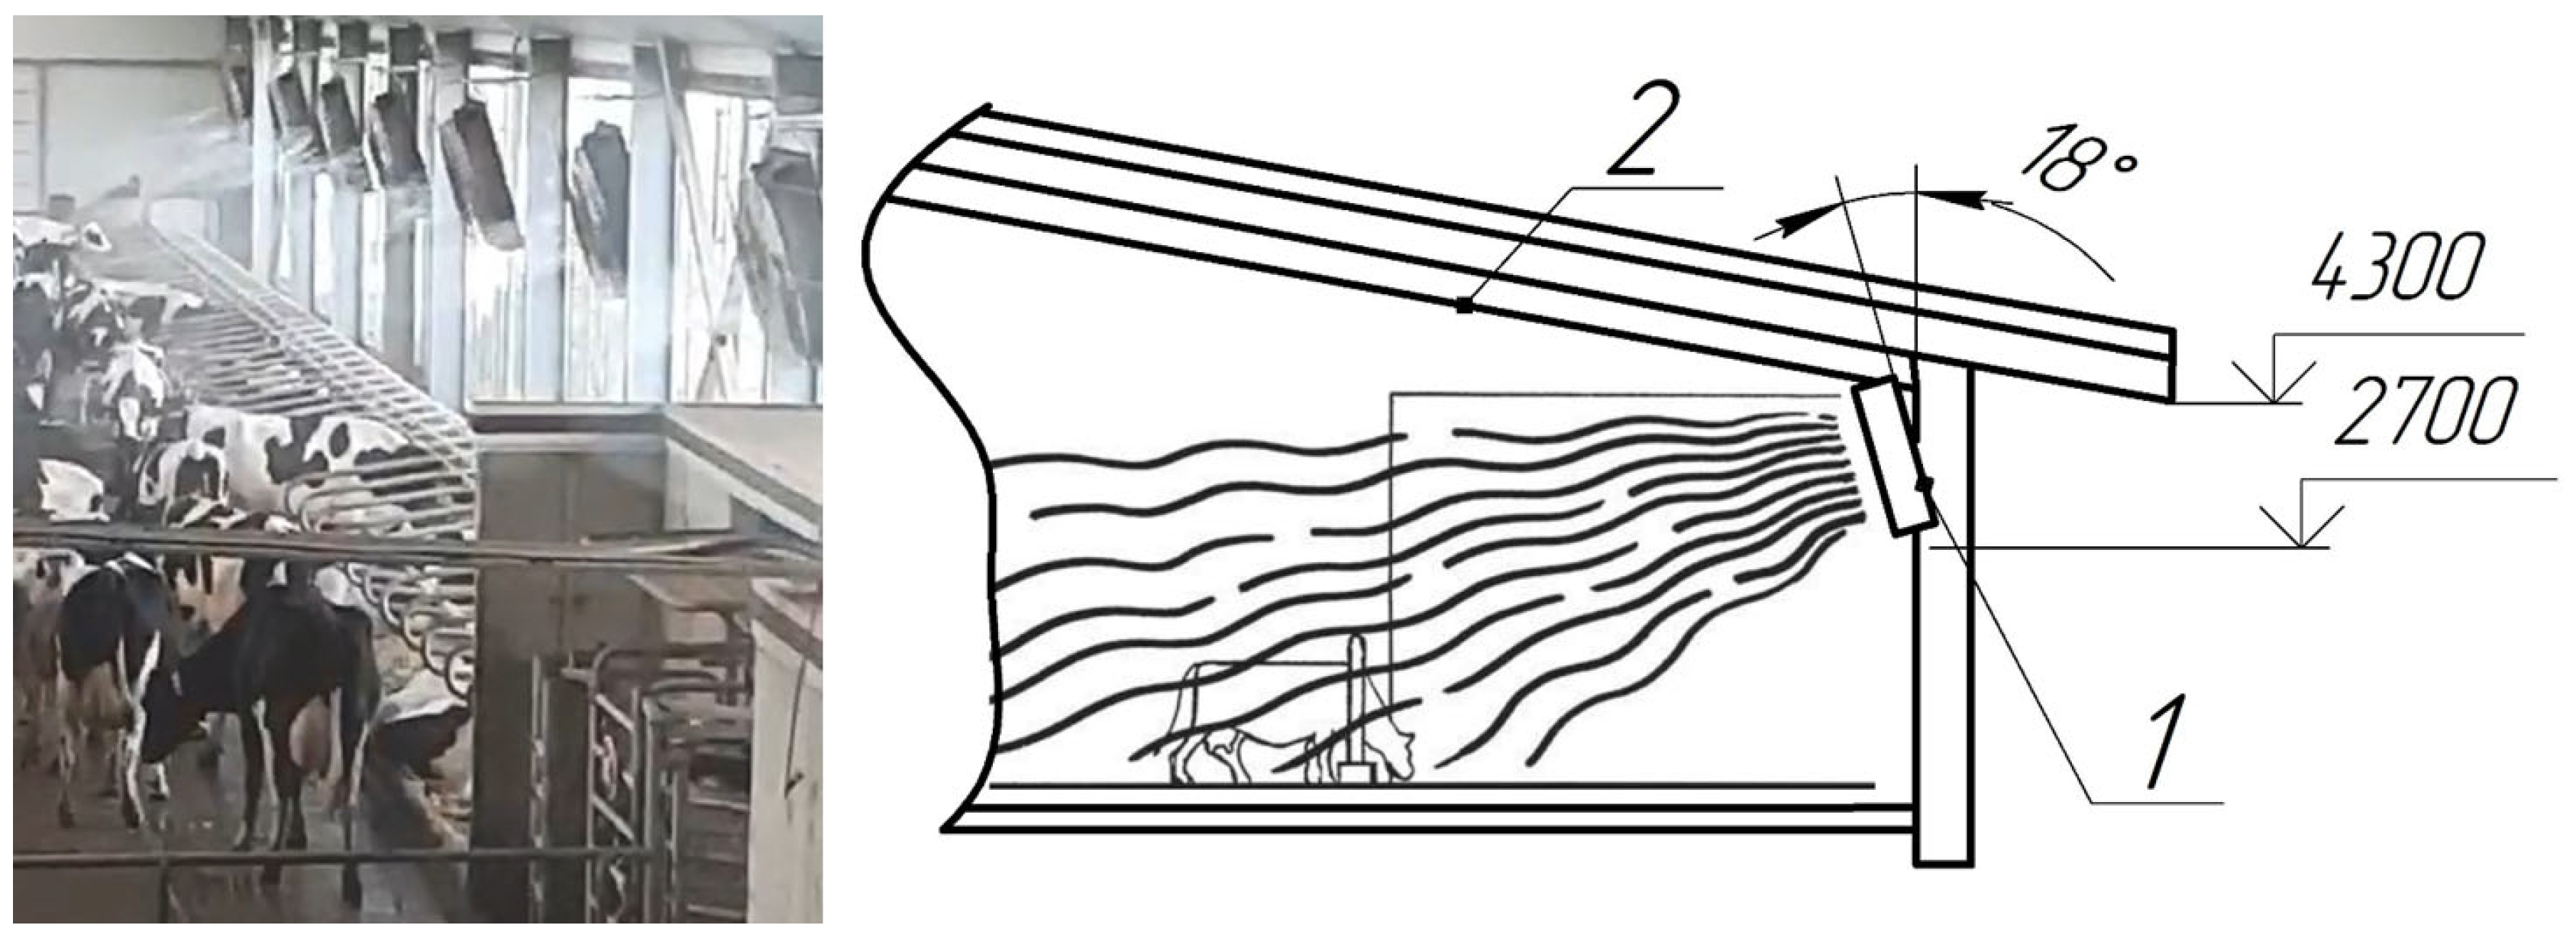
Research was conducted in semi-insulated box-type cowsheds in 244 places in the period from 18 June 2022 to 31 August 2022 in Lithuania. The cowshed is equipped with an Adiabatic Cooling System, which is based on the work of 16 Abbifan 140-XXP-21 fans (tested by Abbi-Aerotech, Hardinxveld-Giessendam, The Netherlands) [1,8]. Each fan is equipped with water nozzles that spray microdroplets (diameters up to 60 μm). The fans turn on automatically at a temperature of 16 °C. The nominal electrical power of each fan is 0.75 kW. Air injection performance with one fan is up to 49 m3/hour of air. The productivity of spraying water with the nozzles of one fan is up to 0.8 L/min. The fans are evenly placed on the side walls of the farm at a height of 2.7 m from the lower edge of the fan to the floor of the cowshed and are inclined at an angle of 18° (Figure 1 and Figure 2).
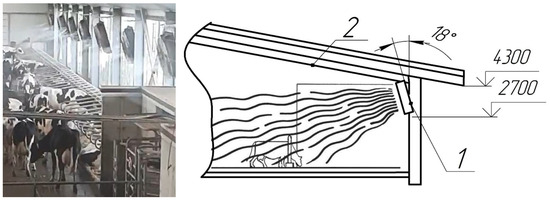
Figure 1.
Scheme of placement of the fan (1) on the wall of the cowshed (2).
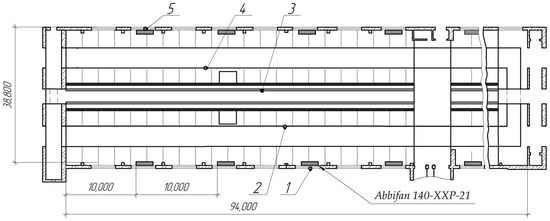
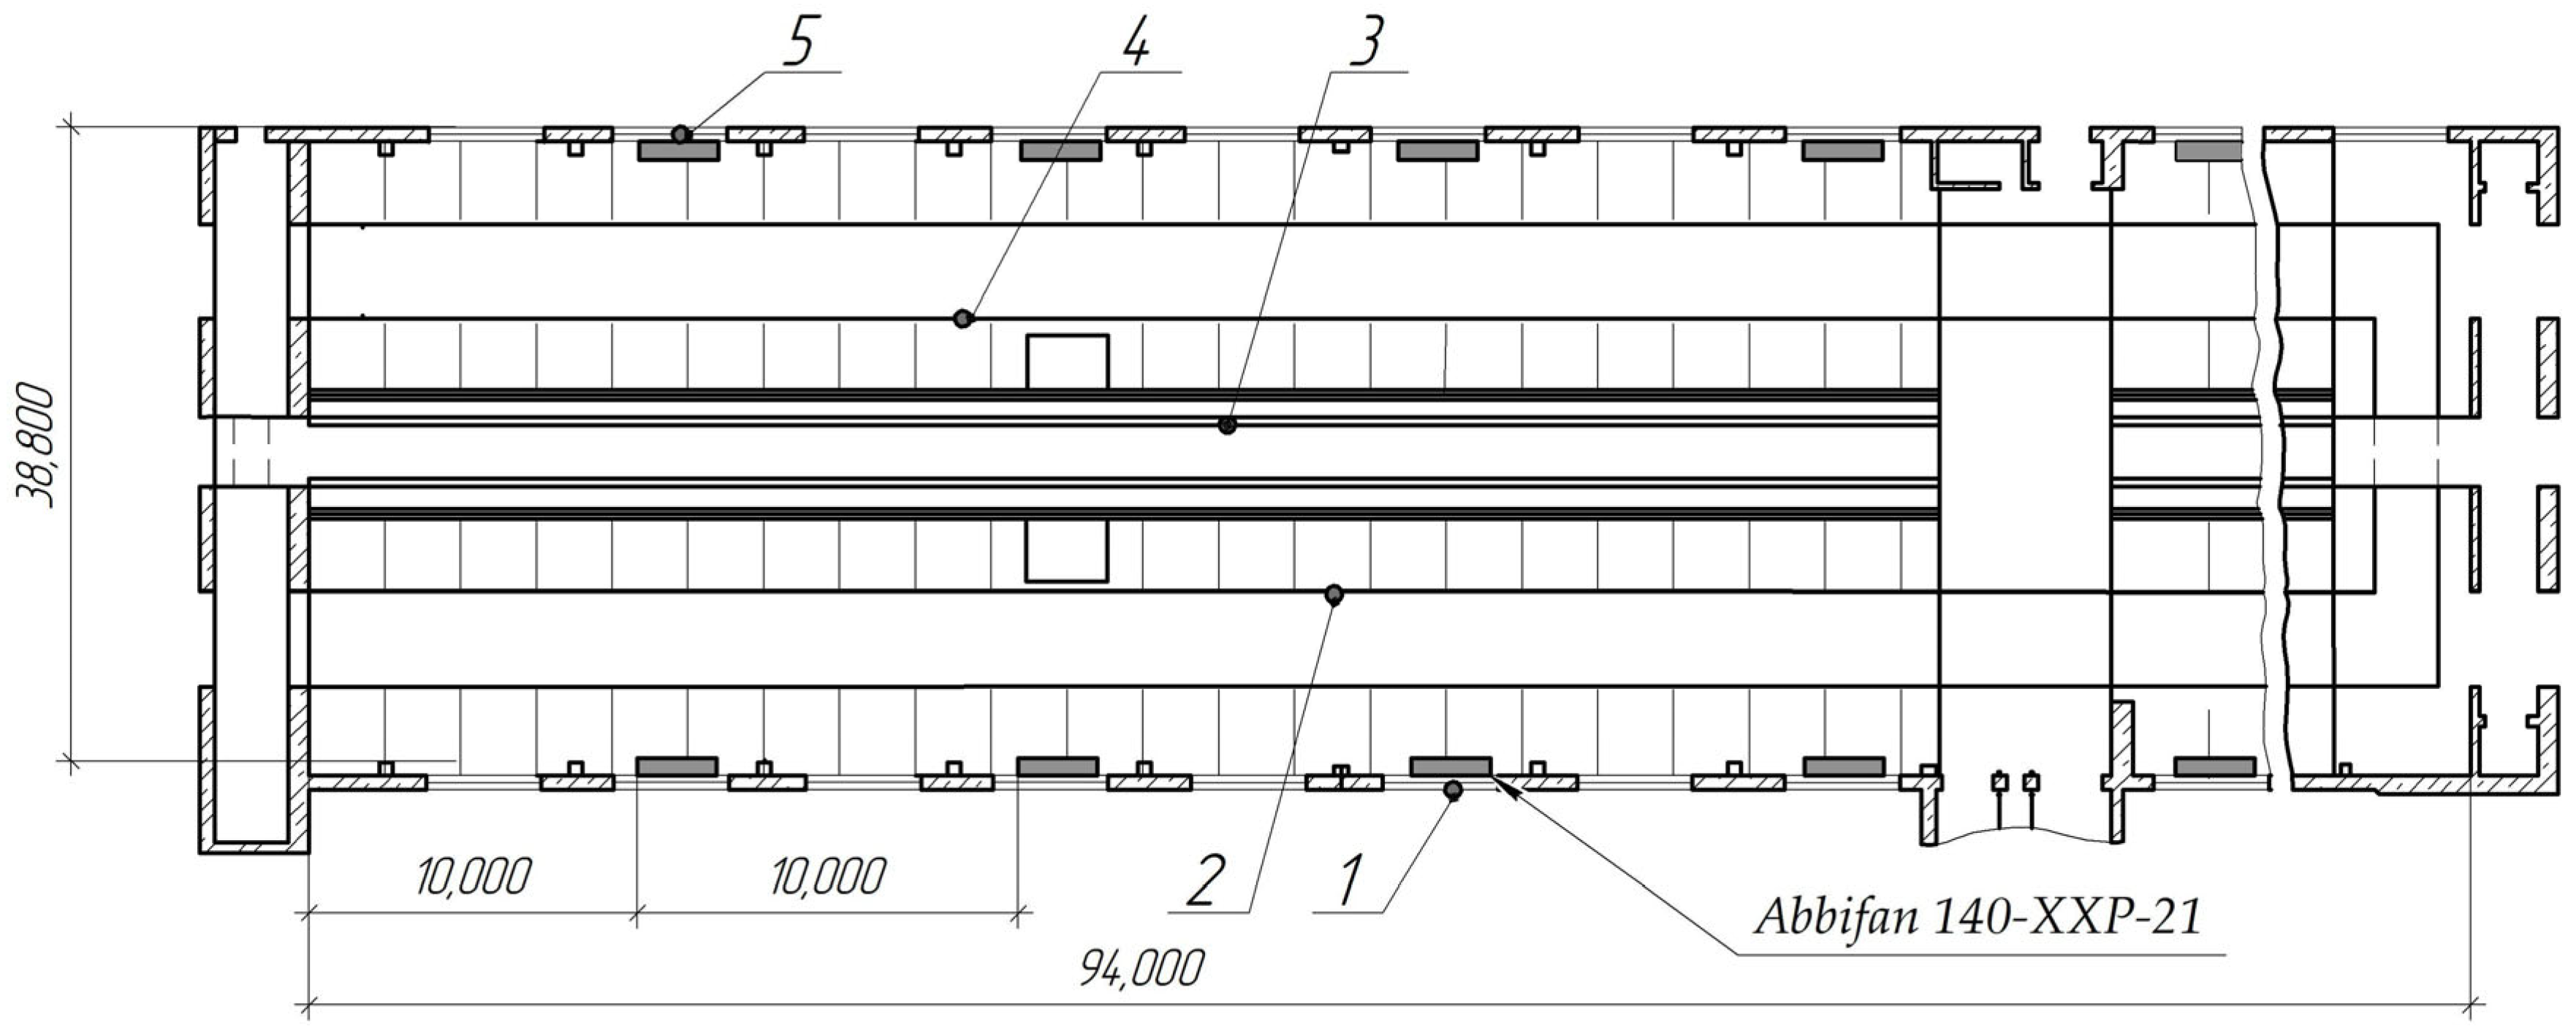
Figure 2.
Scheme of placement of fans and data loggers (1–5) on the cowshed plan (m).
In the course of the research, the temperature and relative humidity of the air entering the cowshed from the outside were measured once an hour using two sensors (positions 1, 5 in Figure 2). Temperature and relative air humidity were also measured inside the cowshed once an hour using three sensors (positions 2, 3, 4 in Figure 2).
The total number of measurements was 1800 for each sensor. PeakTech P5185 data loggers (manufactured by PeakTech, Ahrensburg, Germany) were used for measurements [1,8]. PeakTech P5185 data loggers provide temperature measurements in the range from −40 °C to 80 °C with an accuracy of 0.1 °C and relative humidity measurements in the range from 5% to 98% with an accuracy of 1%. In order to verify the obtained dependencies we used data (temperature and humidity) from a similar barn in the same region of the country.
To create a data array, the average values of temperature (T1) and relative humidity (H1) of the outside air, which were obtained from sensors 1 and 5, and the average values of temperature (T2) and relative humidity (H2) inside the cowshed, obtained from sensors 2, 3, and 4, were used. In addition, temperature–humidity index (THI) outside and inside the cowshed was calculated according to the following equation [1,2,8]:
where T1,2 is the average air temperature outside (1) and inside the cowshed (2), °C, H1,2 is the relative humidity of the air, respectively, outside (1) and inside the cowshed (2), %.
The data set also used the difference between the relevant parameter of the air outside and inside the cowshed, calculated for temperature, relative humidity and THI—dT, dH, and dTHI. To establish (find) the influence of temperature and humidity of the air entering the cowshed on dT, dH and dTHI, a regression analysis of the array of data, obtained as a result of observations, was carried out. A second-order regression equation was chosen to show the analytical connection [20]:
where dT(dH, dTHI) is the change in temperature (°C), relative humidity (%) and THI, respectively;
T1 is the temperature of the air entering the cowshed, °C;
H1 is relative humidity of the air entering the cowshed, %;
b1,2,3,4,5,6 are equation coefficients.
The method of least squares was used to determine the coefficients of the regression equation [21]. As a function of 2 non-linear coefficients, the function was reduced to a linear form using the method of recalculating of the independent coefficients. The adequacy (accuracy) of the level and coefficients of the equation was assessed using F-tests and t-tests. The method of comparing actual and table (theoretical) values of F-criteria (Fisher’s criterion) and t-criteria (Student’s criterion) was used.
If some coefficient was not statistically significant, then the corresponding component of the regression equation was removed, and the other coefficients were adjusted. In the process of finding the coefficients of the regression equations and their evaluation, the Data Analysis package (v.2016) [22], which is a part of Microsoft Excel (v.2016), was used. The data values presented in Table 1 and Table 2 were also calculated using Excel software, in particular using the Data Analysis (Descriptive Statistics) add-in.

Table 1.
Basic parameters of the general data array (1800 values).
Table 2.
The main parameters of the adjusted data array (1698 values).
Statistical processing of the obtained data allowed the main indicators for temperature, humidity and THI (Table 1) to be established for the air entering the cowshed (T1, H1, THI1), for the air inside the cowshed (T2, H2, THI2) and for the difference in the indicators (dT, dH, dTHI).
For the observation period, the highest outside air temperature was recorded at 31.8 °C, and the lowest one at 11.9 °C; the largest temperature decrease inside the cowshed was 2.4 °C as compared to the outside temperature (during operation of the cooling system). The highest relative humidity for the air outside was 95.6%, and the lowest was 32.5%. The average decrease in temperature was 0.1 °C, and the average increase in humidity was 2.3%. The value of THI increased by 0.3; that is, it actually did not change for the air in the cowshed compared to the air coming from outside. The maximum THI value was 81.3 for the air coming from outside and 79.9 for the air inside the cowshed.
THI values that could lead to severe heat stress in cows (>80, above the THImax in Figure 3) were observed for 10 h during the entire observation period, which was 0.6% of the entire observation time. The THI values that could cause moderate heat stress (between THImax and THImed lines) were observed during 505 h (28.1%). The THI values that could cause mild stress (between THImed and THImin lines) were observed during 410 h (22.8%) (Figure 3).
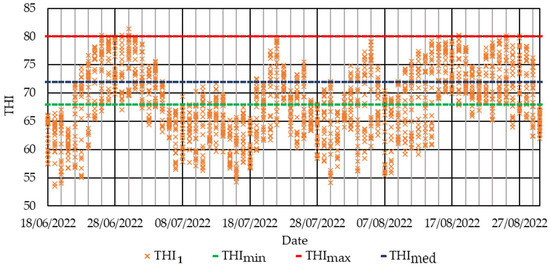
Figure 3.
Values of THI for the air entering the cowshed during the period from 18 June 2022 to 31 August 2022.
Considering the fact that the condition of the air entering the cowshed corresponded to the conditions of heat stress during 51.5% of the hours of the entire observation period, as well as taking into account the significant additional heat release from the animals in the cowshed, the use of a cooling system was appropriate.
For the following analyses, the values corresponding to air temperature of <16 °C, were extracted from the data set; that is, data were extracted for the period when the cooling system did not work. Thus, the adjusted data array of 1608 values was obtained for each parameter; the main parameters of the adjusted data array are given in Table 2.
According to the parameters in Table 2, it can be said that the average temperature change in the air entering the cowshed was 0.2 °C during the period of cooling system operation, and the largest temperature decrease was 2.6 °C. Thus, a maximum temperature increase of 1.3 °C was observed. In addition, there was a maximum decrease in THI by 2.3 and a maximum increase in THI by 2.1 units. In order to understand under which working conditions the maximum decreases in temperature and THI occur, respectively, and under which the maximum work efficiency is achieved, a regression analysis of the array of the observed data was caried out.
3. Results and Discussion
The regression analysis of the data, so as to determine the influence of the temperature and the relative humidity of the air entering the cowshed on the change in the temperature in the cowshed during the operation of the cooling system, made it possible to determine the significant coefficients of the corresponding level and calculate the p-values for them (Table 3).
Table 3.
Coefficients of the regression equation and p-values for indoor temperature change.
According to the coefficients given in Table 3, the regression equation looked like this:
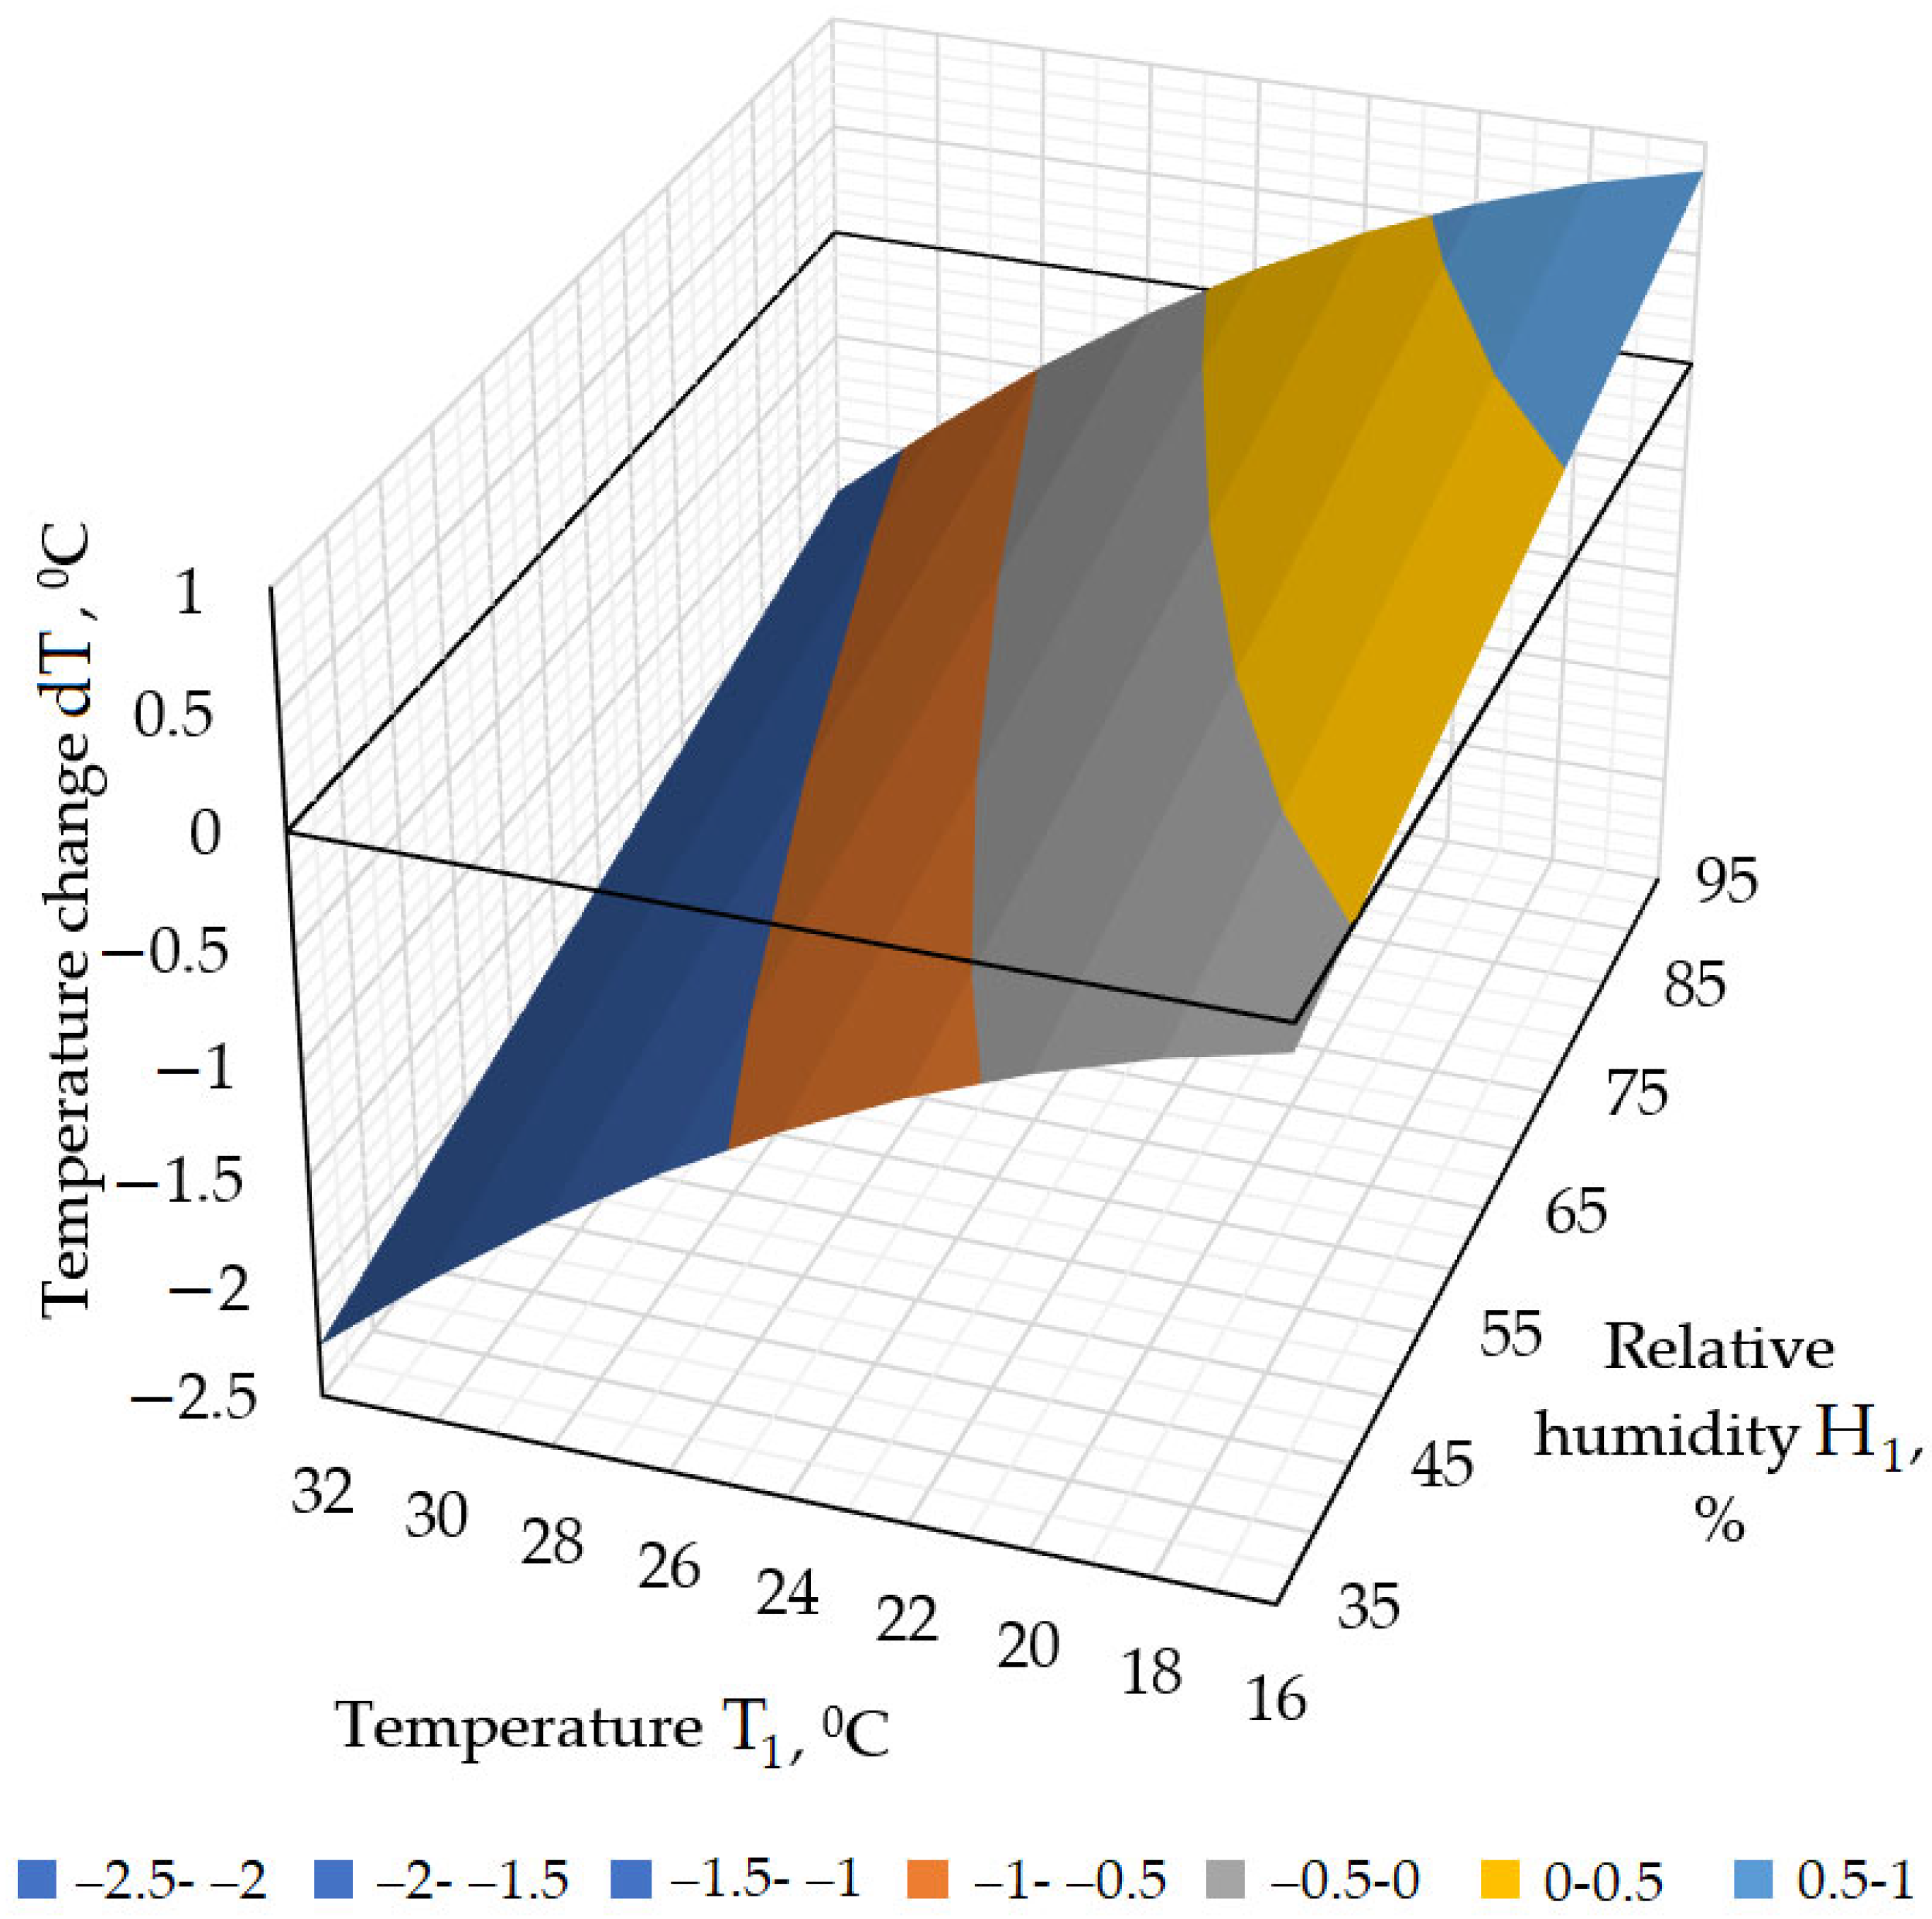
Based on the equation, a graph was constructed that visually displayed the change in temperature depending on temperature and relative humidity (Figure 4).
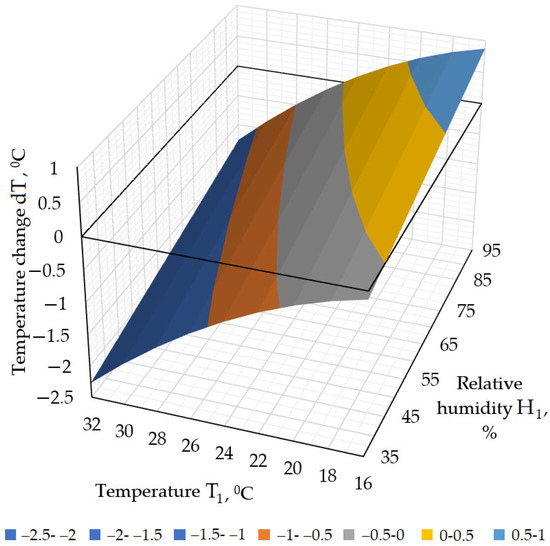
Figure 4.
Temperature change depending on temperature and relative humidity.
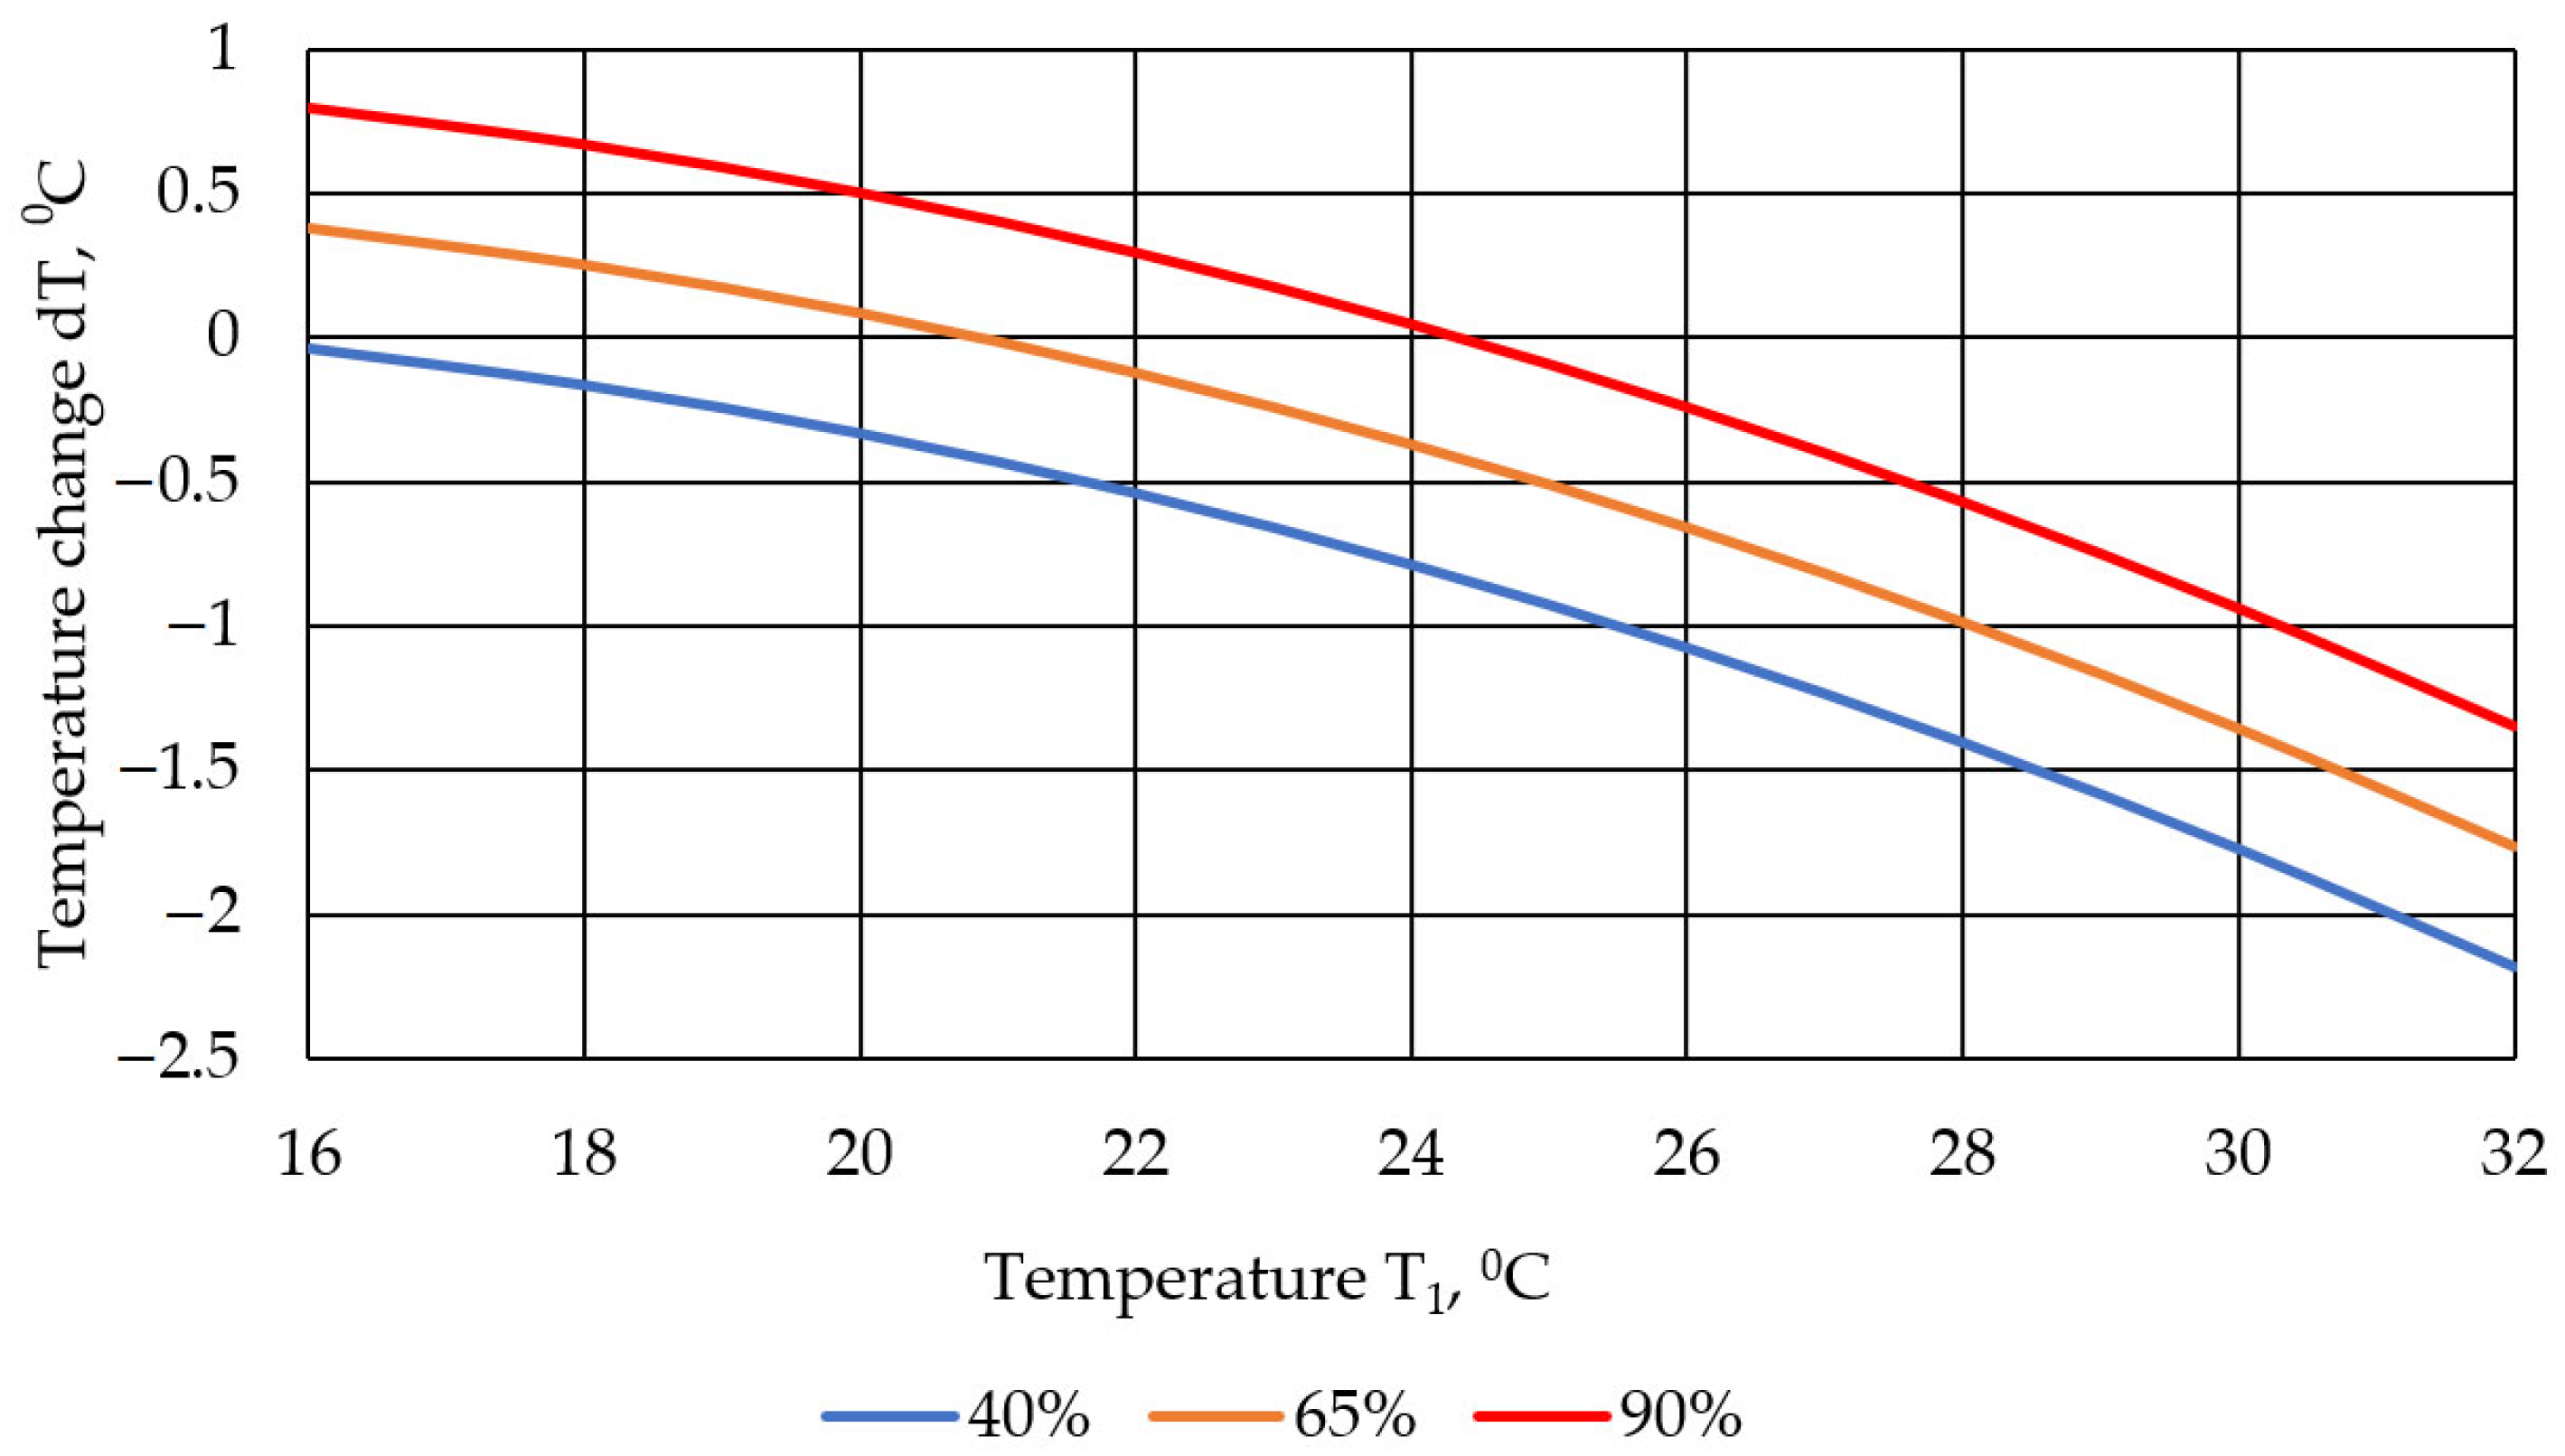
A detailed analysis of Equation (3) and the graph in Figure 4 made it possible to obtain the dependence of the temperature reduction on different values of humidity. In particular, three scenarios of temperature reduction (or cooling system efficiency) were considered depending on the air temperature for values of 40%, 65% and 90% relative humidity (Figure 5).
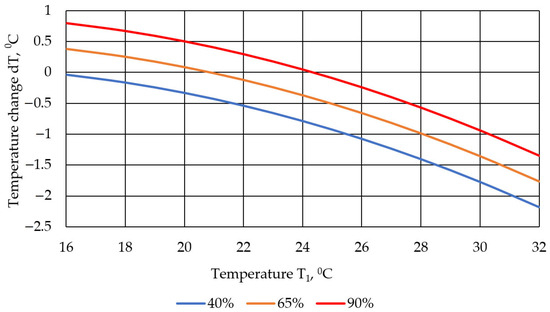
Figure 5.
Changes in temperature inside the cowshed depending on temperature outside (for values of relative humidity—40%, 65% and 90%).
The efficiency of the cooling system is higher (the decrease in air temperature in a cowshed reaches maximum levels) at a higher temperature and lower relative humidity of the air entering the cowshed. In particular, the operation of the cooling system at a temperature of 32 °C and a relative humidity of 40% allows for a decrease in air temperature in the cowshed by 2.2 °C. It should be noted that at a relative humidity of up to 40%, the decrease in temperature occurs in the entire temperature range (from 16 to 32 °C).
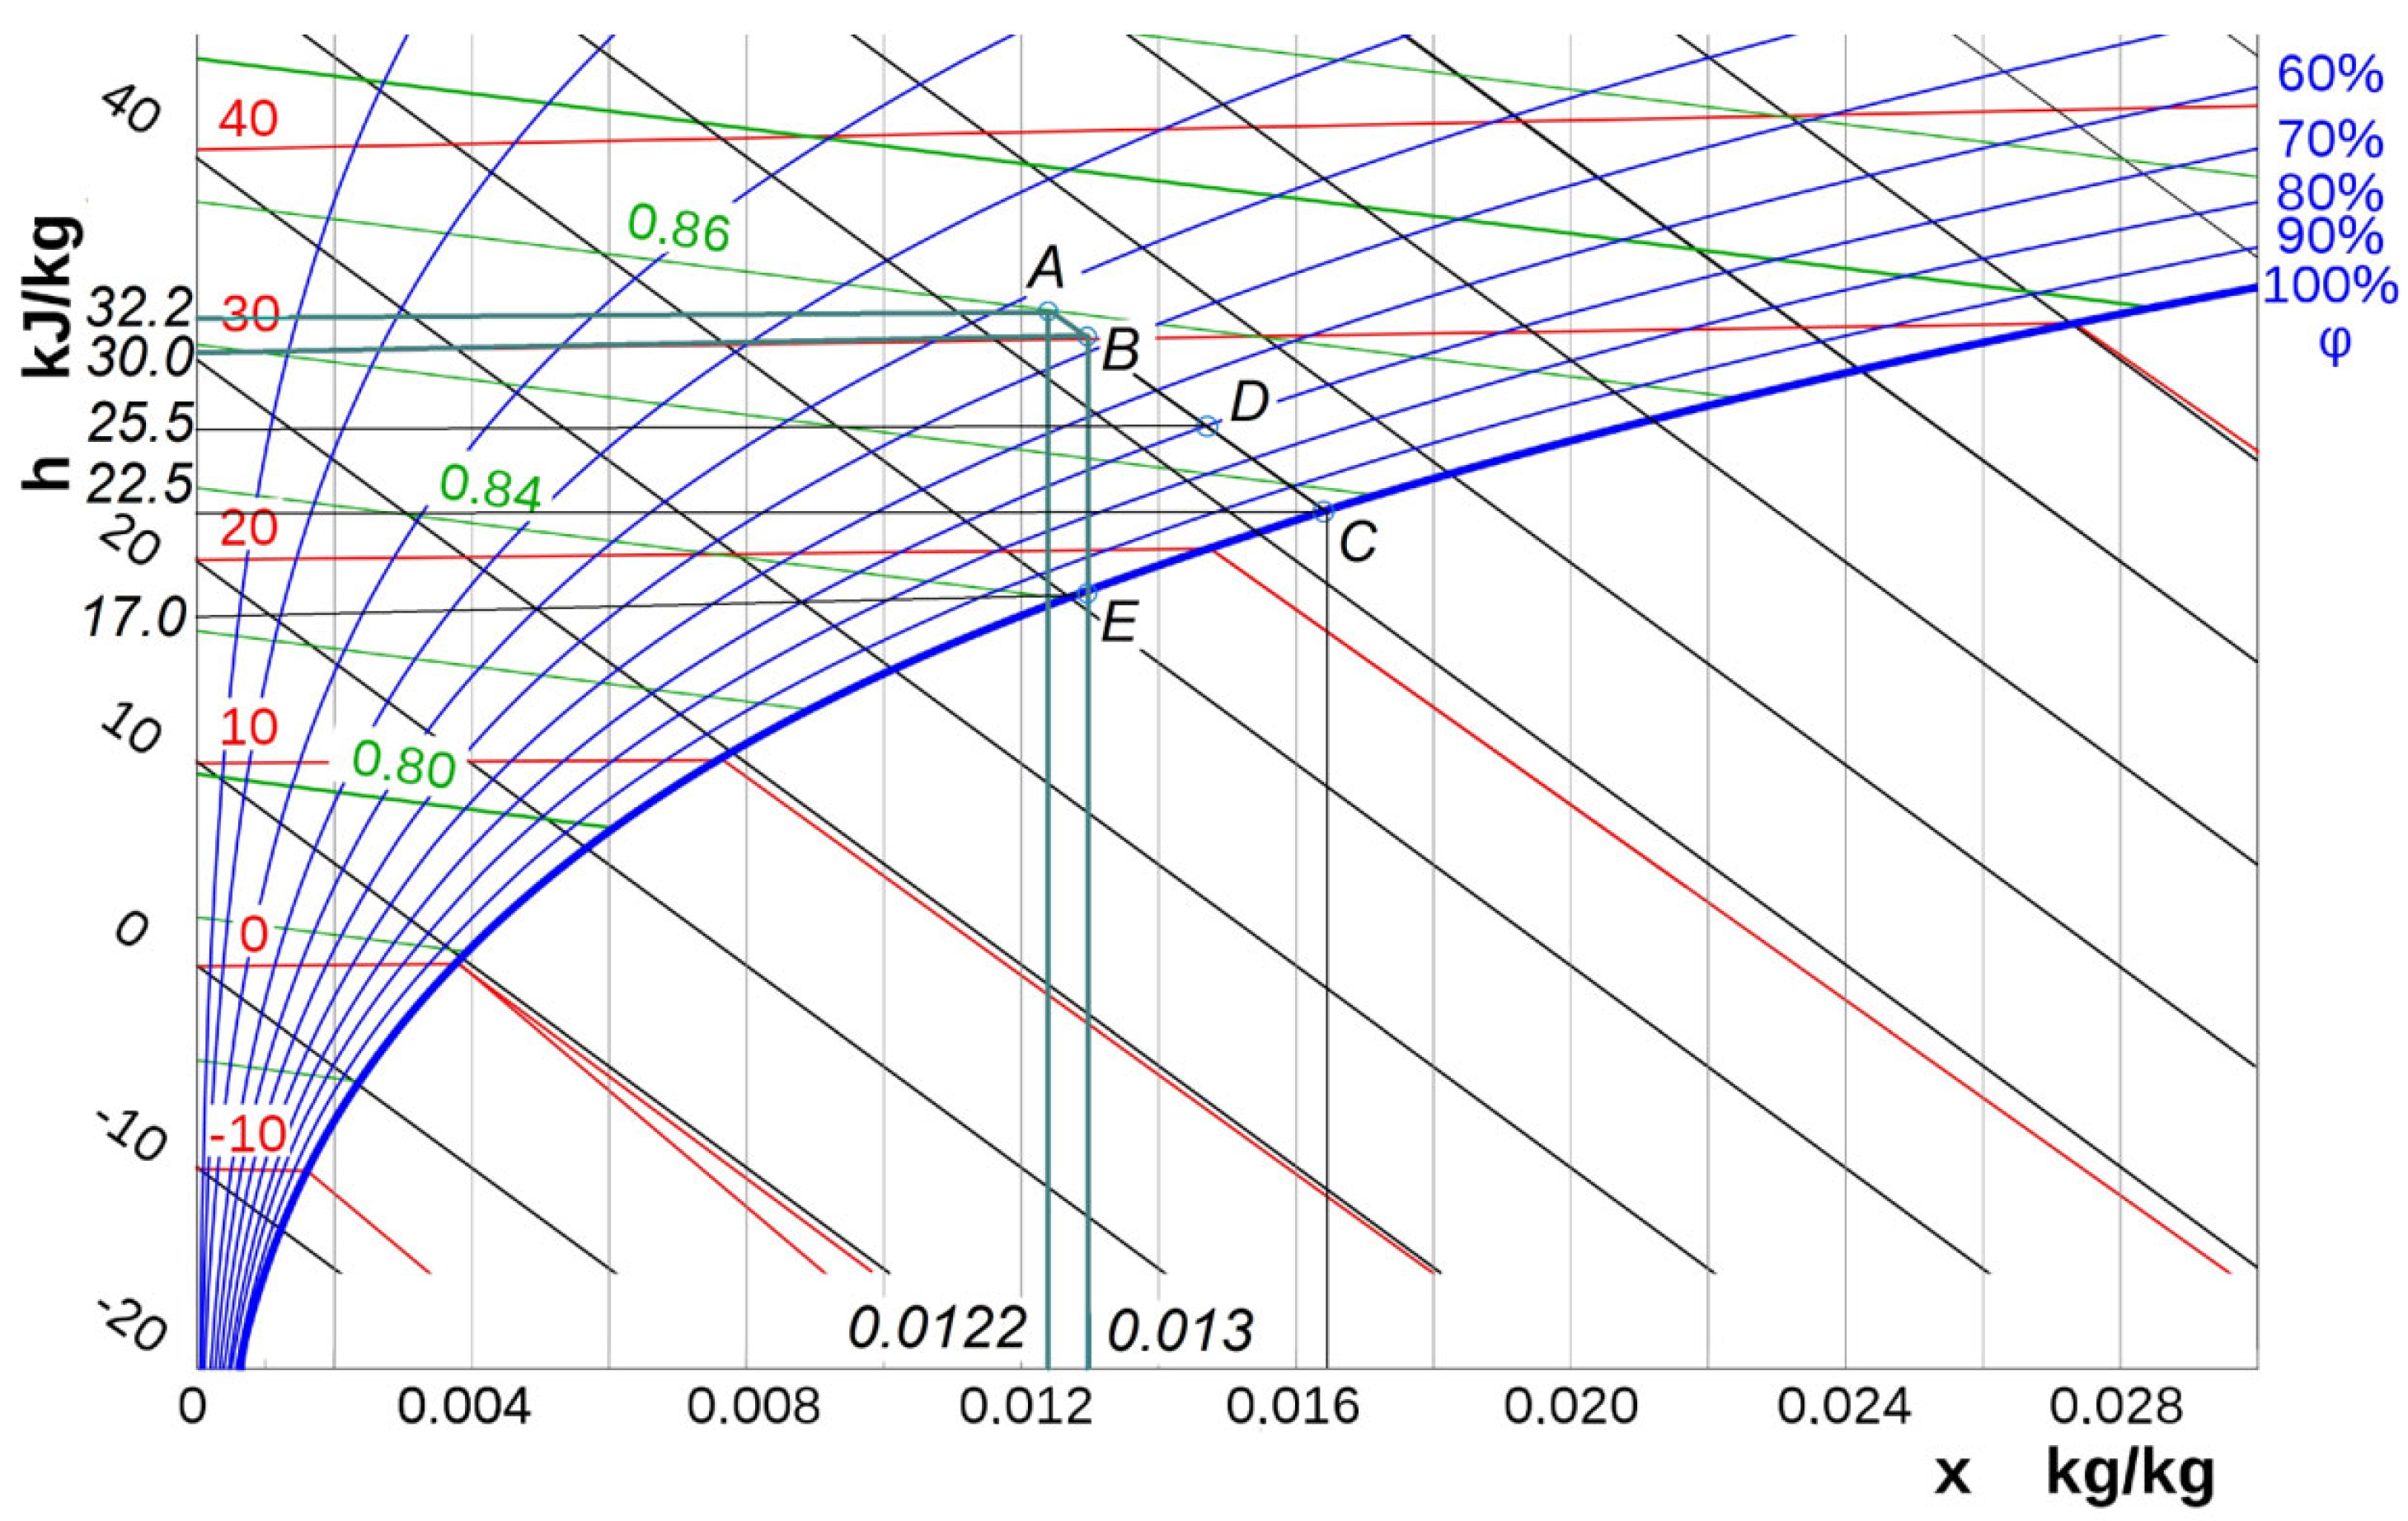
When the relative humidity increases, the effectiveness of the cooling system decreases. For example, at a relative humidity of 65% and an air temperature of 32 °C, the maximum temperature decreases by 1.8 °C; here, the temperature decrease begins at an air temperature of 20 °C. The analysis of Equation (3) made it possible to conclude that a decrease in temperature was observed for the air entering the cowshed starting from a temperature of 16 °C at a relative air humidity of up to 40% and starting from a temperature of 26 °C at a relative air humidity of up to 90%. This conclusion correlates with the study [8], where the authors analyzed the operation of the cooling system using a Mollier (h-x) diagram (Figure 6) for data obtained on 17 August 2022 at 6 p.m.
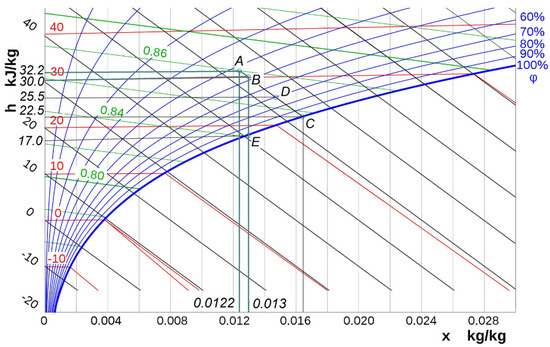
Figure 6.
Mollier (h-x) diagram (Figure 6) for the data obtained on 17 August 2022 at 6 p.m. [8]: A is the temperature point of the outside air, B is the temperature point in the cowshed reached due to the operation of the cooling system, C is the point of the theoretically achievable minimum temperature in the cowshed, D is the point of the technically achievable minimum temperature in the cowshed, E is the “dew point” temperature.
According to the obtained data, the air comes from outside with a temperature of 32.2 °C, with a relative humidity of 48.3% and a moisture content of 0.0122 kg/kg (point A). Due to the spraying of water, the relative humidity increases to 50.7%, the moisture content of the air in the cowshed increases to 0.0130 kg/kg and the temperature according to the Mollier diagram decreases to 30.0 °C (point B), i.e., dT = 2.2 °C. For comparison, the temperature in the cowshed according to the data array was 30.1 °C, and the dT value, calculated according to Equation (3), was 2.1 °C. A similar decrease in temperature was recorded in a scientific paper [15], in which a review of similar cooling systems was performed.
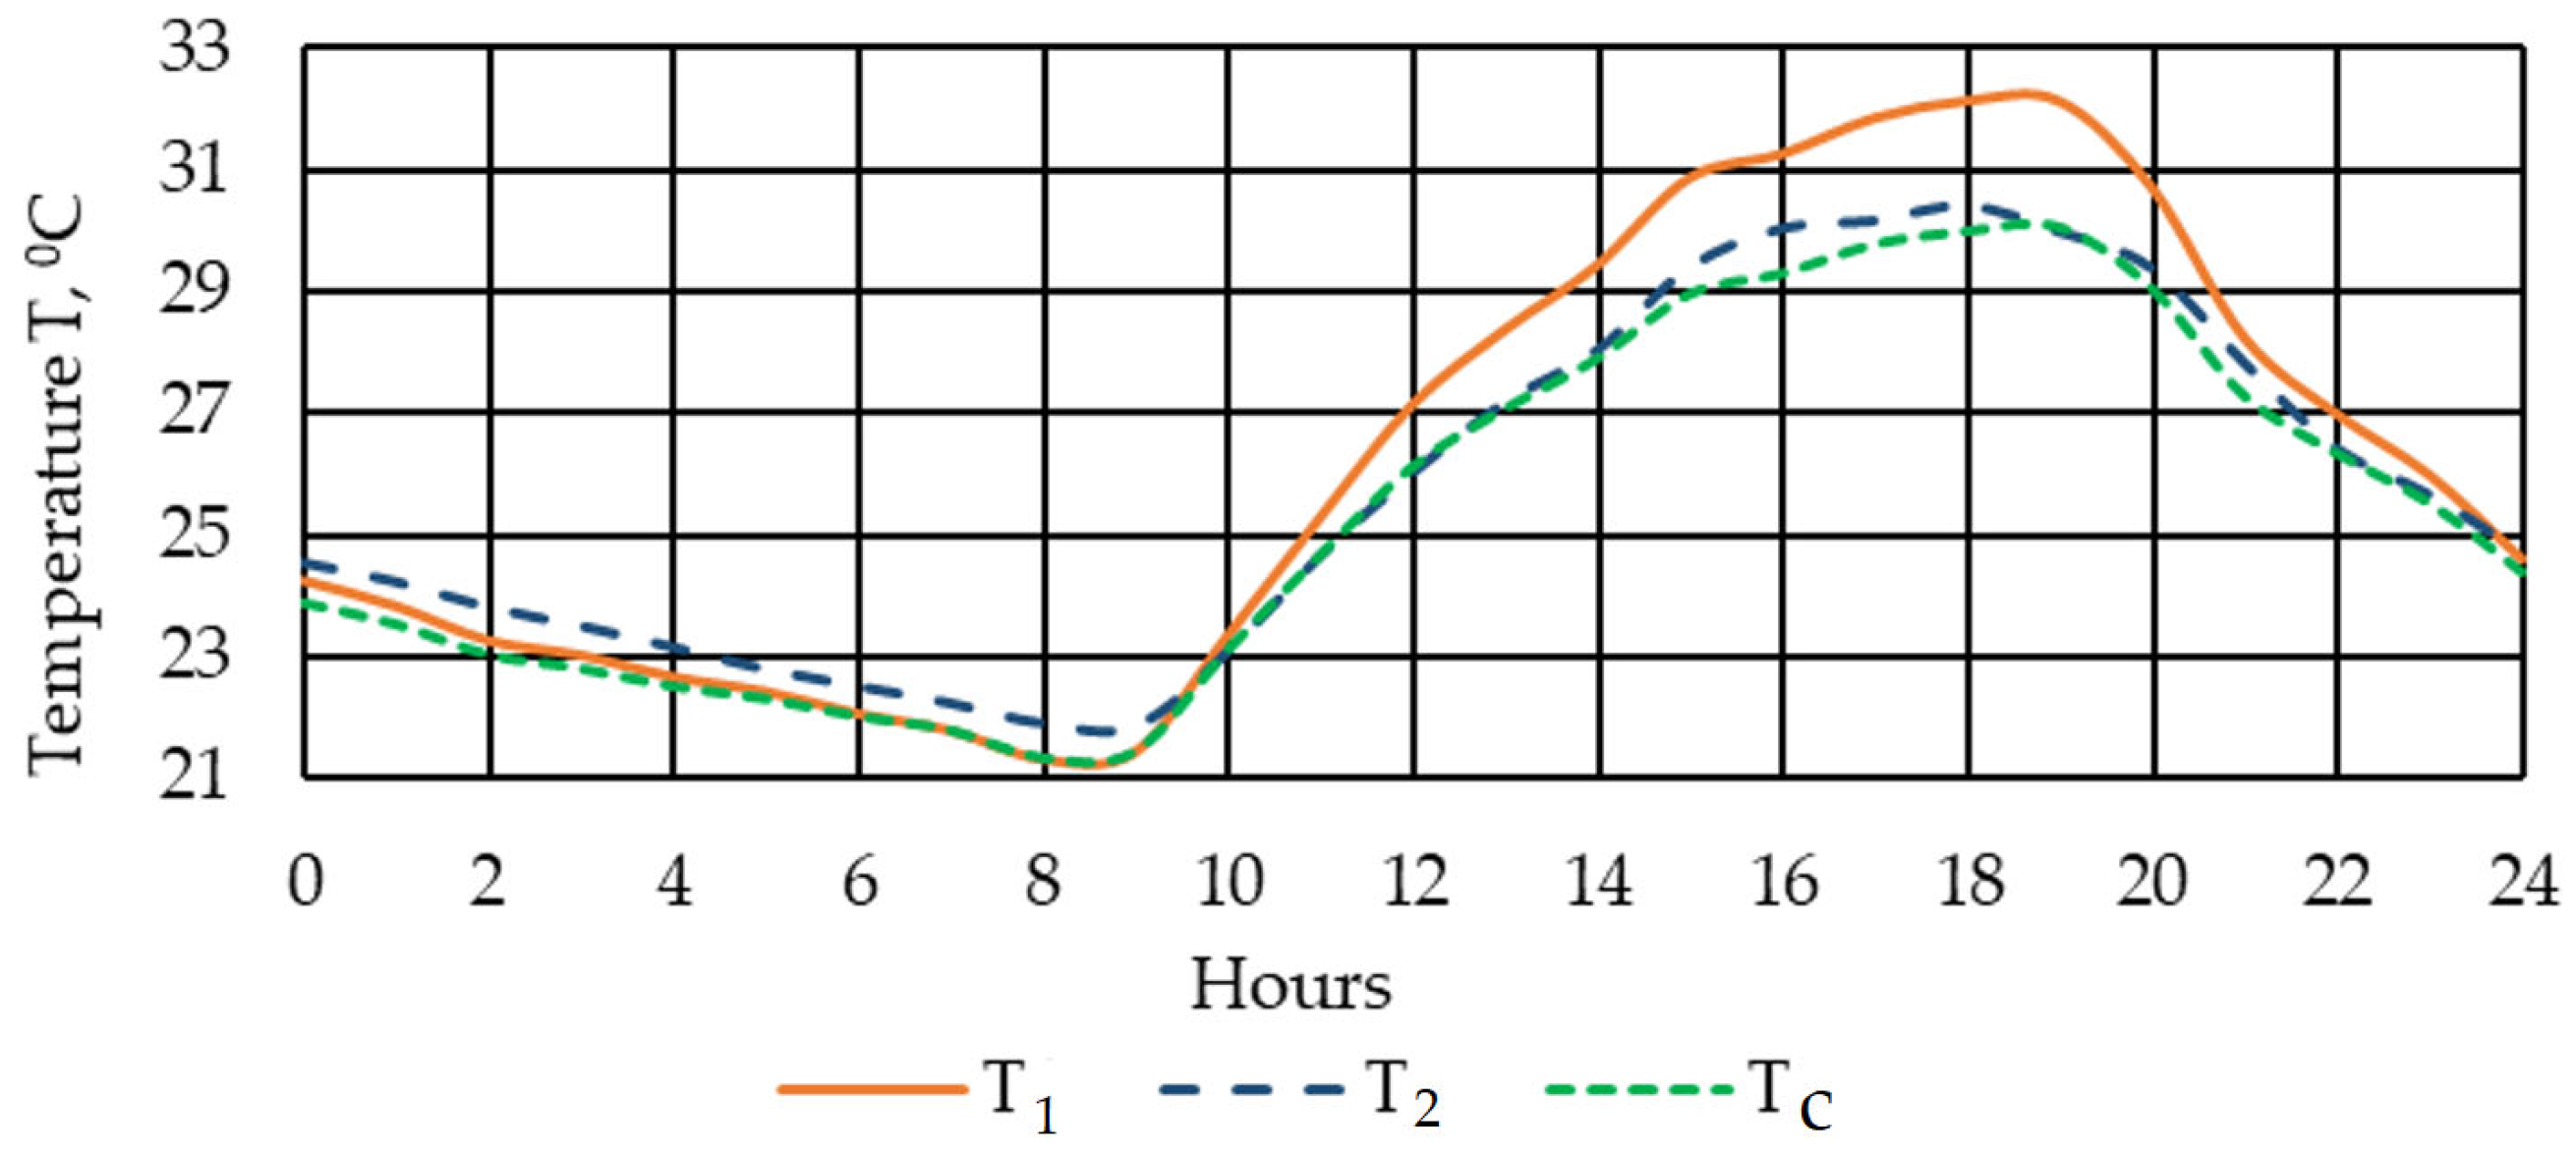
In particular, during the operation of the cooling systems, a temperature decrease of up to 2 °C was recorded, with ambient temperature values close to 30 °C. Also, for similar climatic conditions, a decrease in temperature by an average of 2 °C was recorded during the operation of a similar cooling system in a piggery [23]. The analysis of the obtained results also determined that air cooling is possible even at humidity values of 45%, in contrast to what is indicated in other studies [19]. To confirm the adequacy of the regression Equation (3), we analyzed the temperature change in the cowshed for the data obtained during the observation process and the data calculated according to Equation (3): Tc = T1 − dT (Figure 7).
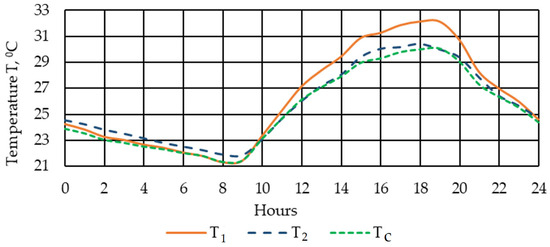
Figure 7.
Dynamics of temperature changes in one day (17 August 2022).
The average deviation of the calculated temperature T from the observed temperature T2 was 1.6%. It is also worth noting that up to the point with a temperature of 21.5 °C, the character of the Tc curve corresponds to the character of the T1, and for higher temperatures, it corresponds to the character of the T2 curve. It is obvious that the point with a temperature of 21.5 °C is the inflection point, when spraying water for the purpose of cooling the air becomes effective, that is, it leads to a decrease in the air temperature in the cowshed. It should be noted that our proposed statistical model for evaluating the efficiency of the cooling system based on temperature changes, unlike the theoretical evaluation using a Mollier (h-x) diagram, takes into account the influence of extraneous factors. With the help of only a theoretical assessment, it is quite difficult to take into account the influence of extraneous factors on the efficiency of the cooling system, such as the algorithm for turning on the fans and water spraying, the technological and technical parameters of the cowshed cooling system [1,8], the structural features of the cowshed itself, the influence of sudden changes in weather conditions, the influence of heat and moisture release from the animals in the cowshed, and others.
Our proposed model indirectly takes into account the influence of the above mentioned factors and others due to their display in the data array, which was obtained in the process of observation.
Regression analysis of the array data, regarding the influence of temperature and relative humidity in the cowshed during the operation of the cooling system made it possible to determine the significant coefficients of the corresponding equation and calculate the p-values for them (Table 4).
Table 4.
Coefficients of the regression equation and p-values for changes in humidity.
According to the coefficients given in Table 4, the regression equation looked like this:
Based on the equation, a graph was built that visually displays the change in relative humidity depending on the temperature and relative humidity (Figure 8).
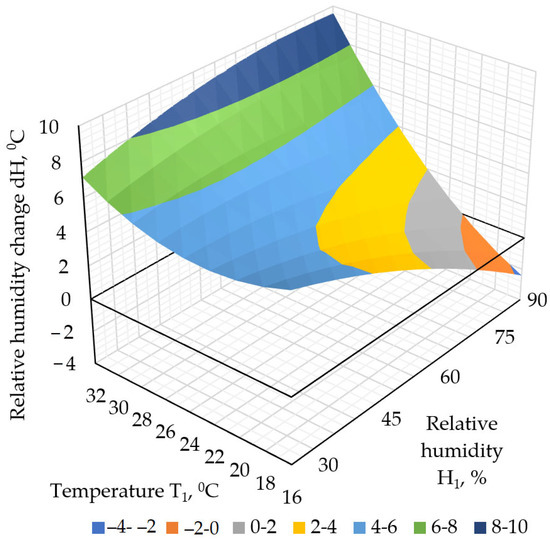
Figure 8.
Change in relative humidity depending on temperature and relative humidity.
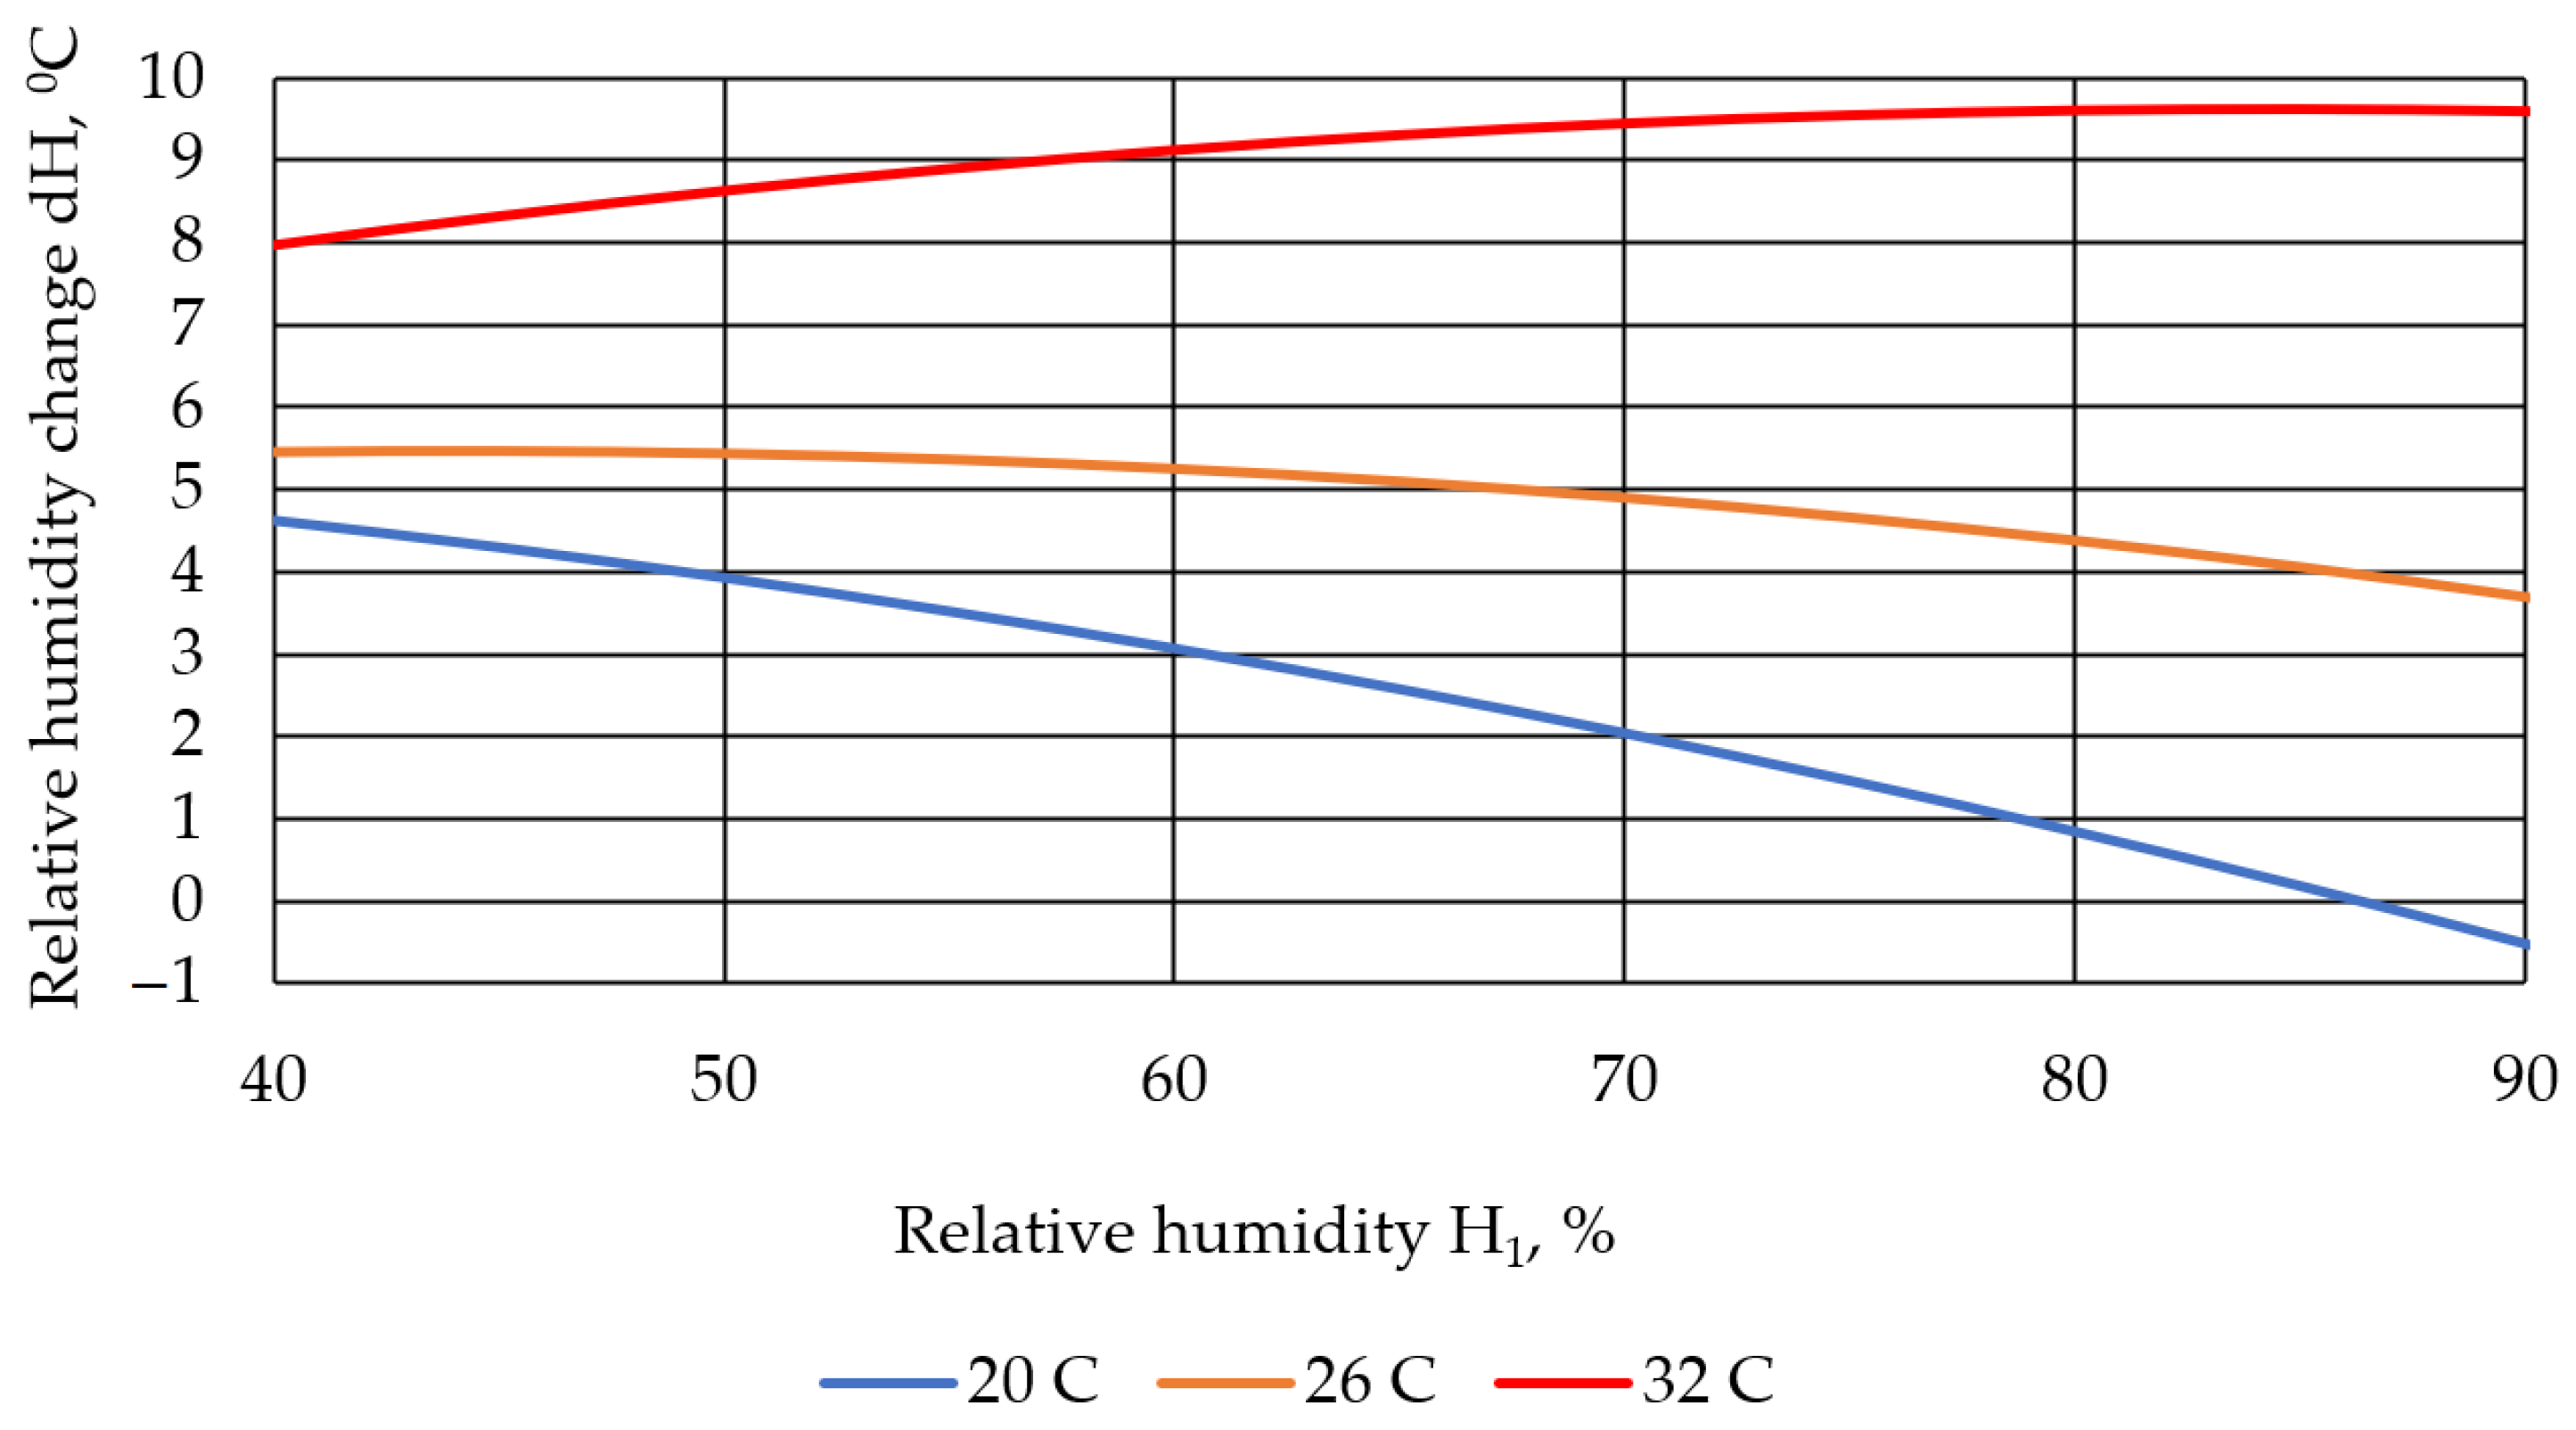
Detailed analysis of Equation (4) and the graph in Figure 8 made it possible to obtain the dependences of the change in relative humidity in a cowshed for different values of the air entering the cowshed from outside. In particular, three scenarios were considered for the values of the temperature of the air entering the cowshed—20 °C, 26 °C and 32 °C (Figure 9).
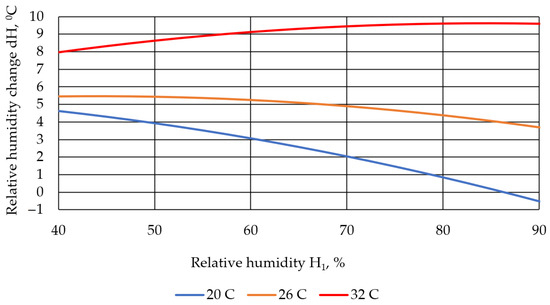
Figure 9.
Relative humidity changes in a cowshed depending on temperature (for the temperature values of 20 °C, 26 °C and 32 °C).
From the analysis of the graph, it was concluded that at high air temperatures, a greater increase in humidity was observed. For example, at a temperature of 32 °C, the increase in relative humidity was from 8.0 to 9.6%. A similar increase in relative humidity (from 8%) as a result of the operation of the cooling system was also described in [15]. At lower temperature values, the increase in humidity is smaller, which is explained by the physical features of the adiabatic process of air cooling [8,24].
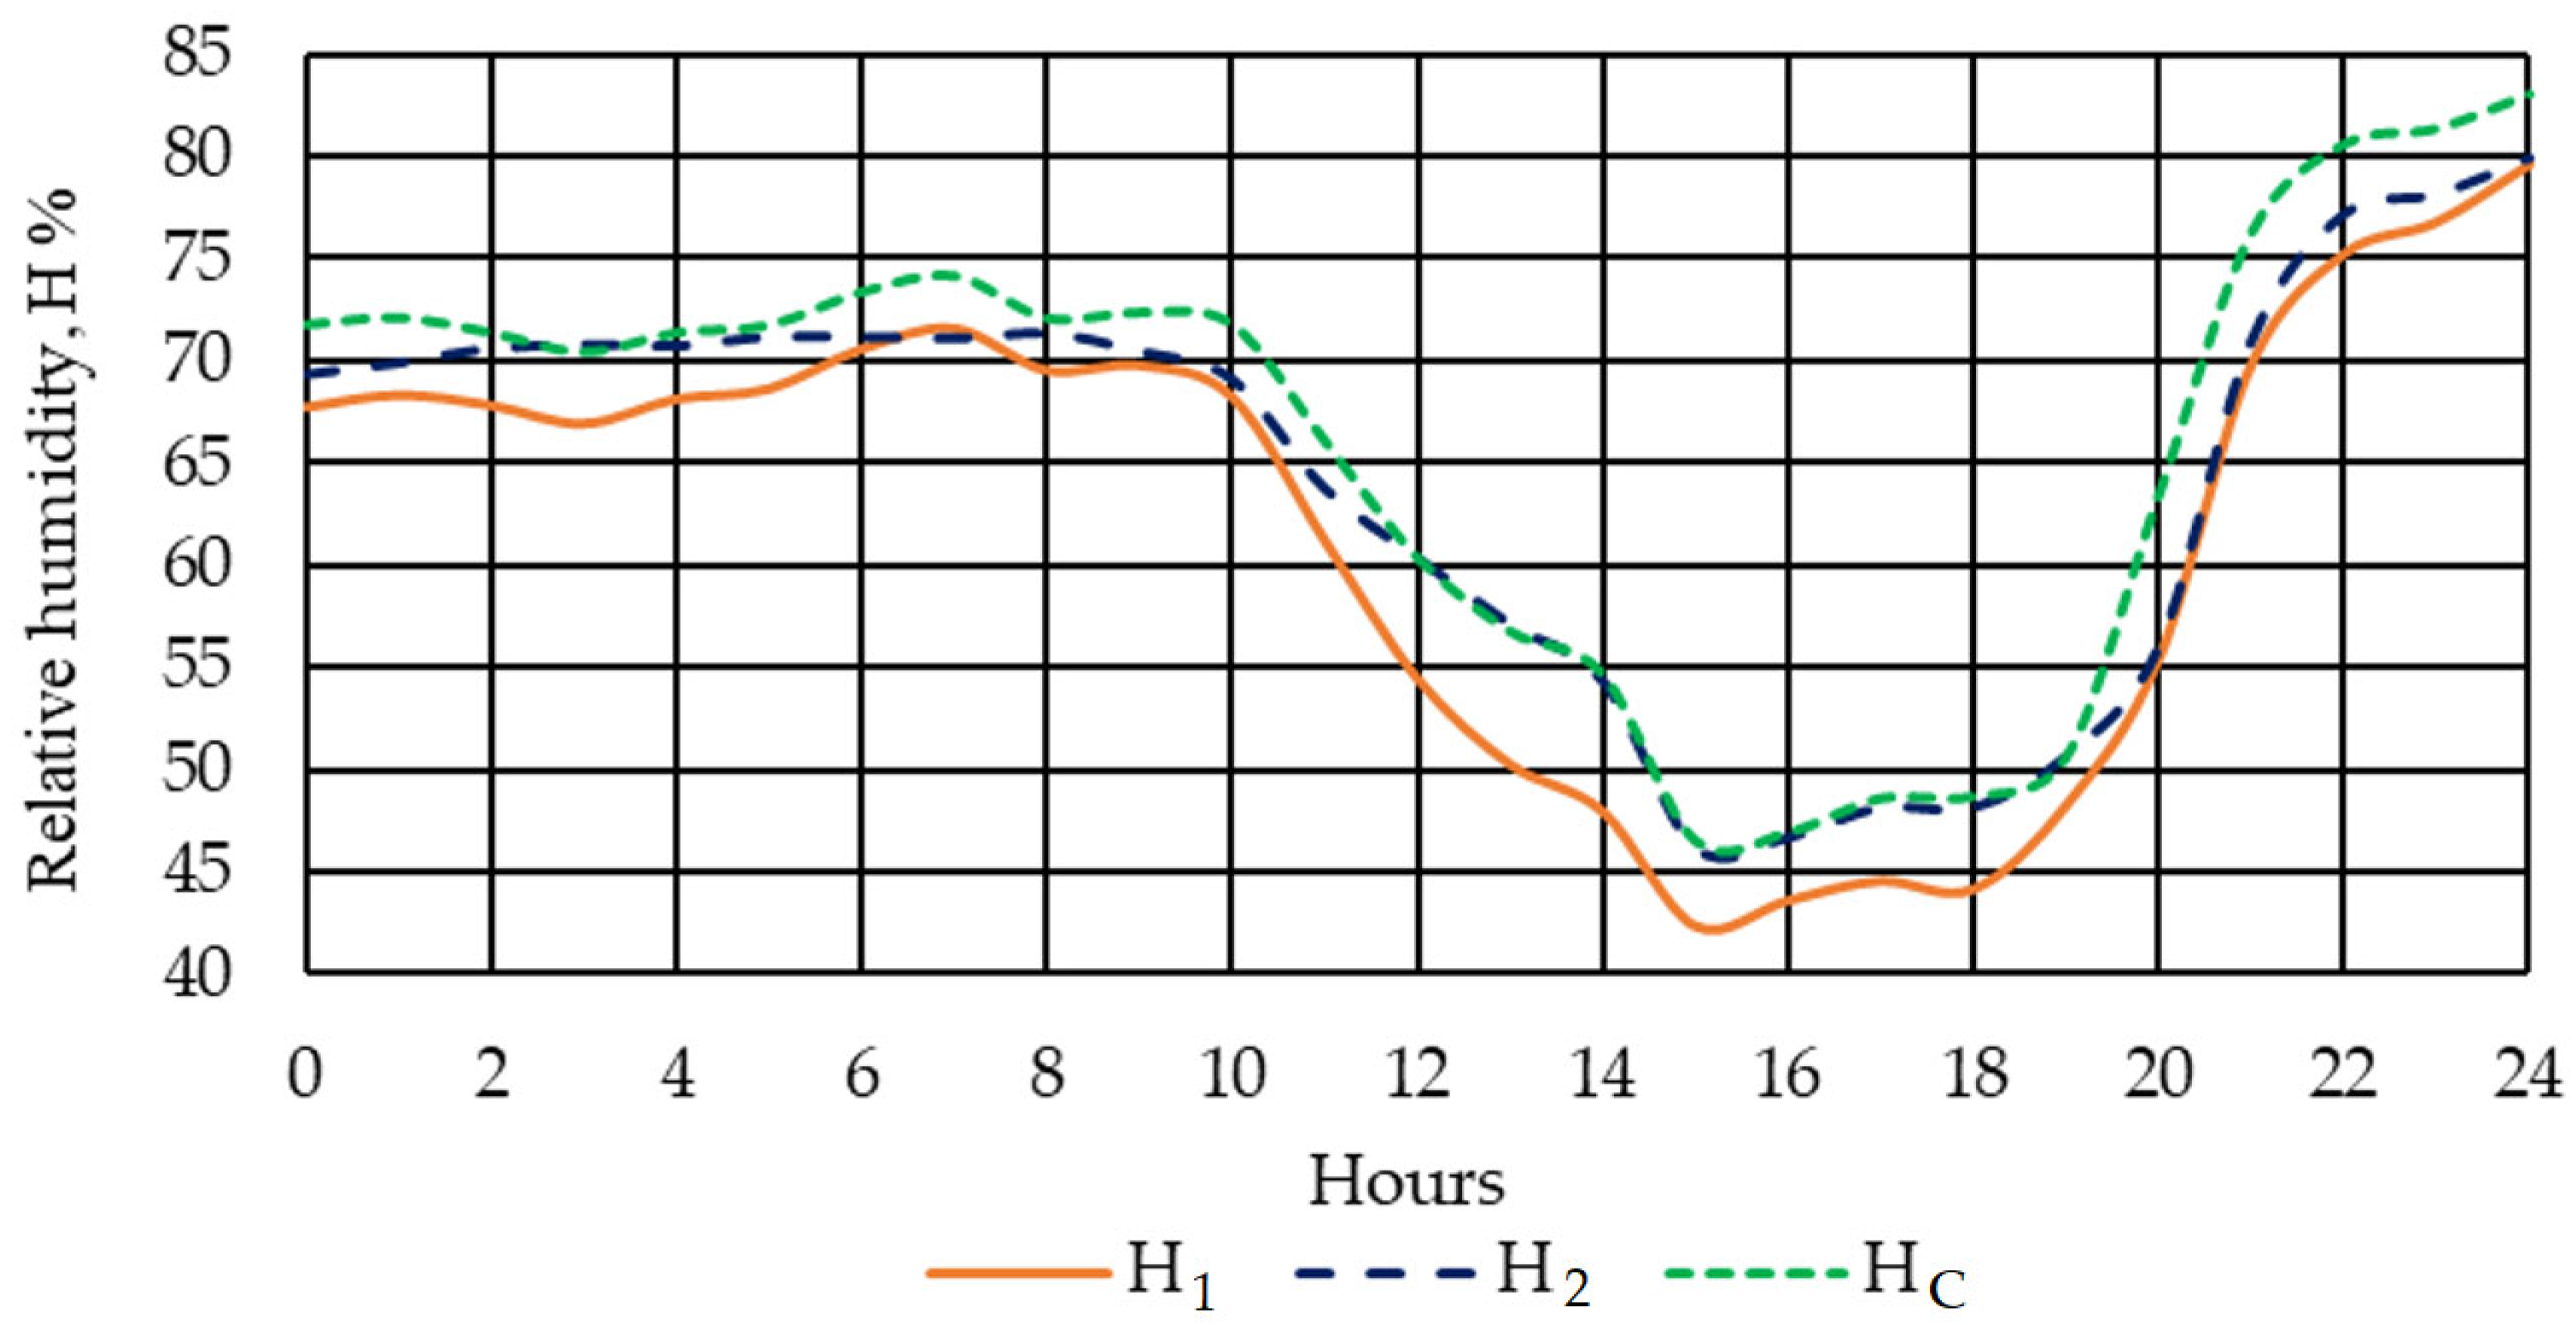
To confirm the adequacy of the regression Equation (4), the dynamics of changes in relative humidity in the cowshed were analyzed using the data obtained during the observation process and the data calculated using Equation (4): Hc = H1 – dH (Figure 10).
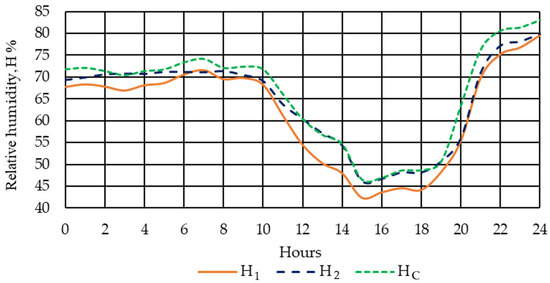
Figure 10.
Dynamics of changes relative humidity in one day (17 August 2022).
The average deviation of the calculated relative humidity Hc from the relative humidity H2, obtained in the results of the observations, was 2.7%.
Regression analysis of the array of data regarding the influence of temperature and relative humidity of the air coming from outside on the change in THI in the cowshed during the operation of the cooling system made it possible to determine the significant coefficients of the corresponding equation and calculate the p-values for them (Table 5).
Table 5.
Coefficients of regression equation and p-values for changes in THI.
According to the coefficients given in Table 5, the regression equation looked like this:
Based on the equation, a graph was drawn that visually displayed the change in THI depending on the temperature and relative humidity (Figure 11).
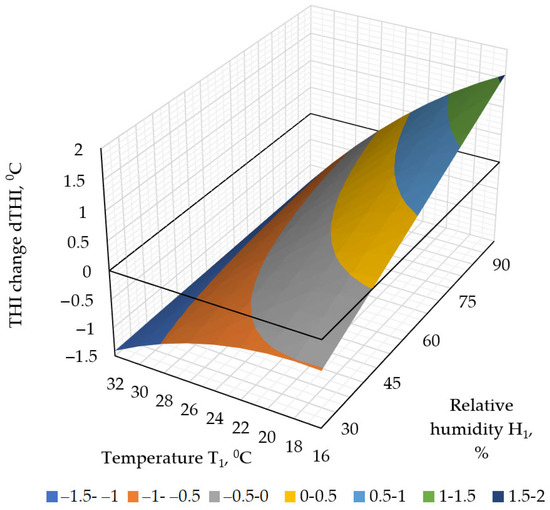
Figure 11.
Changes in THI depending on temperature and relative humidity.
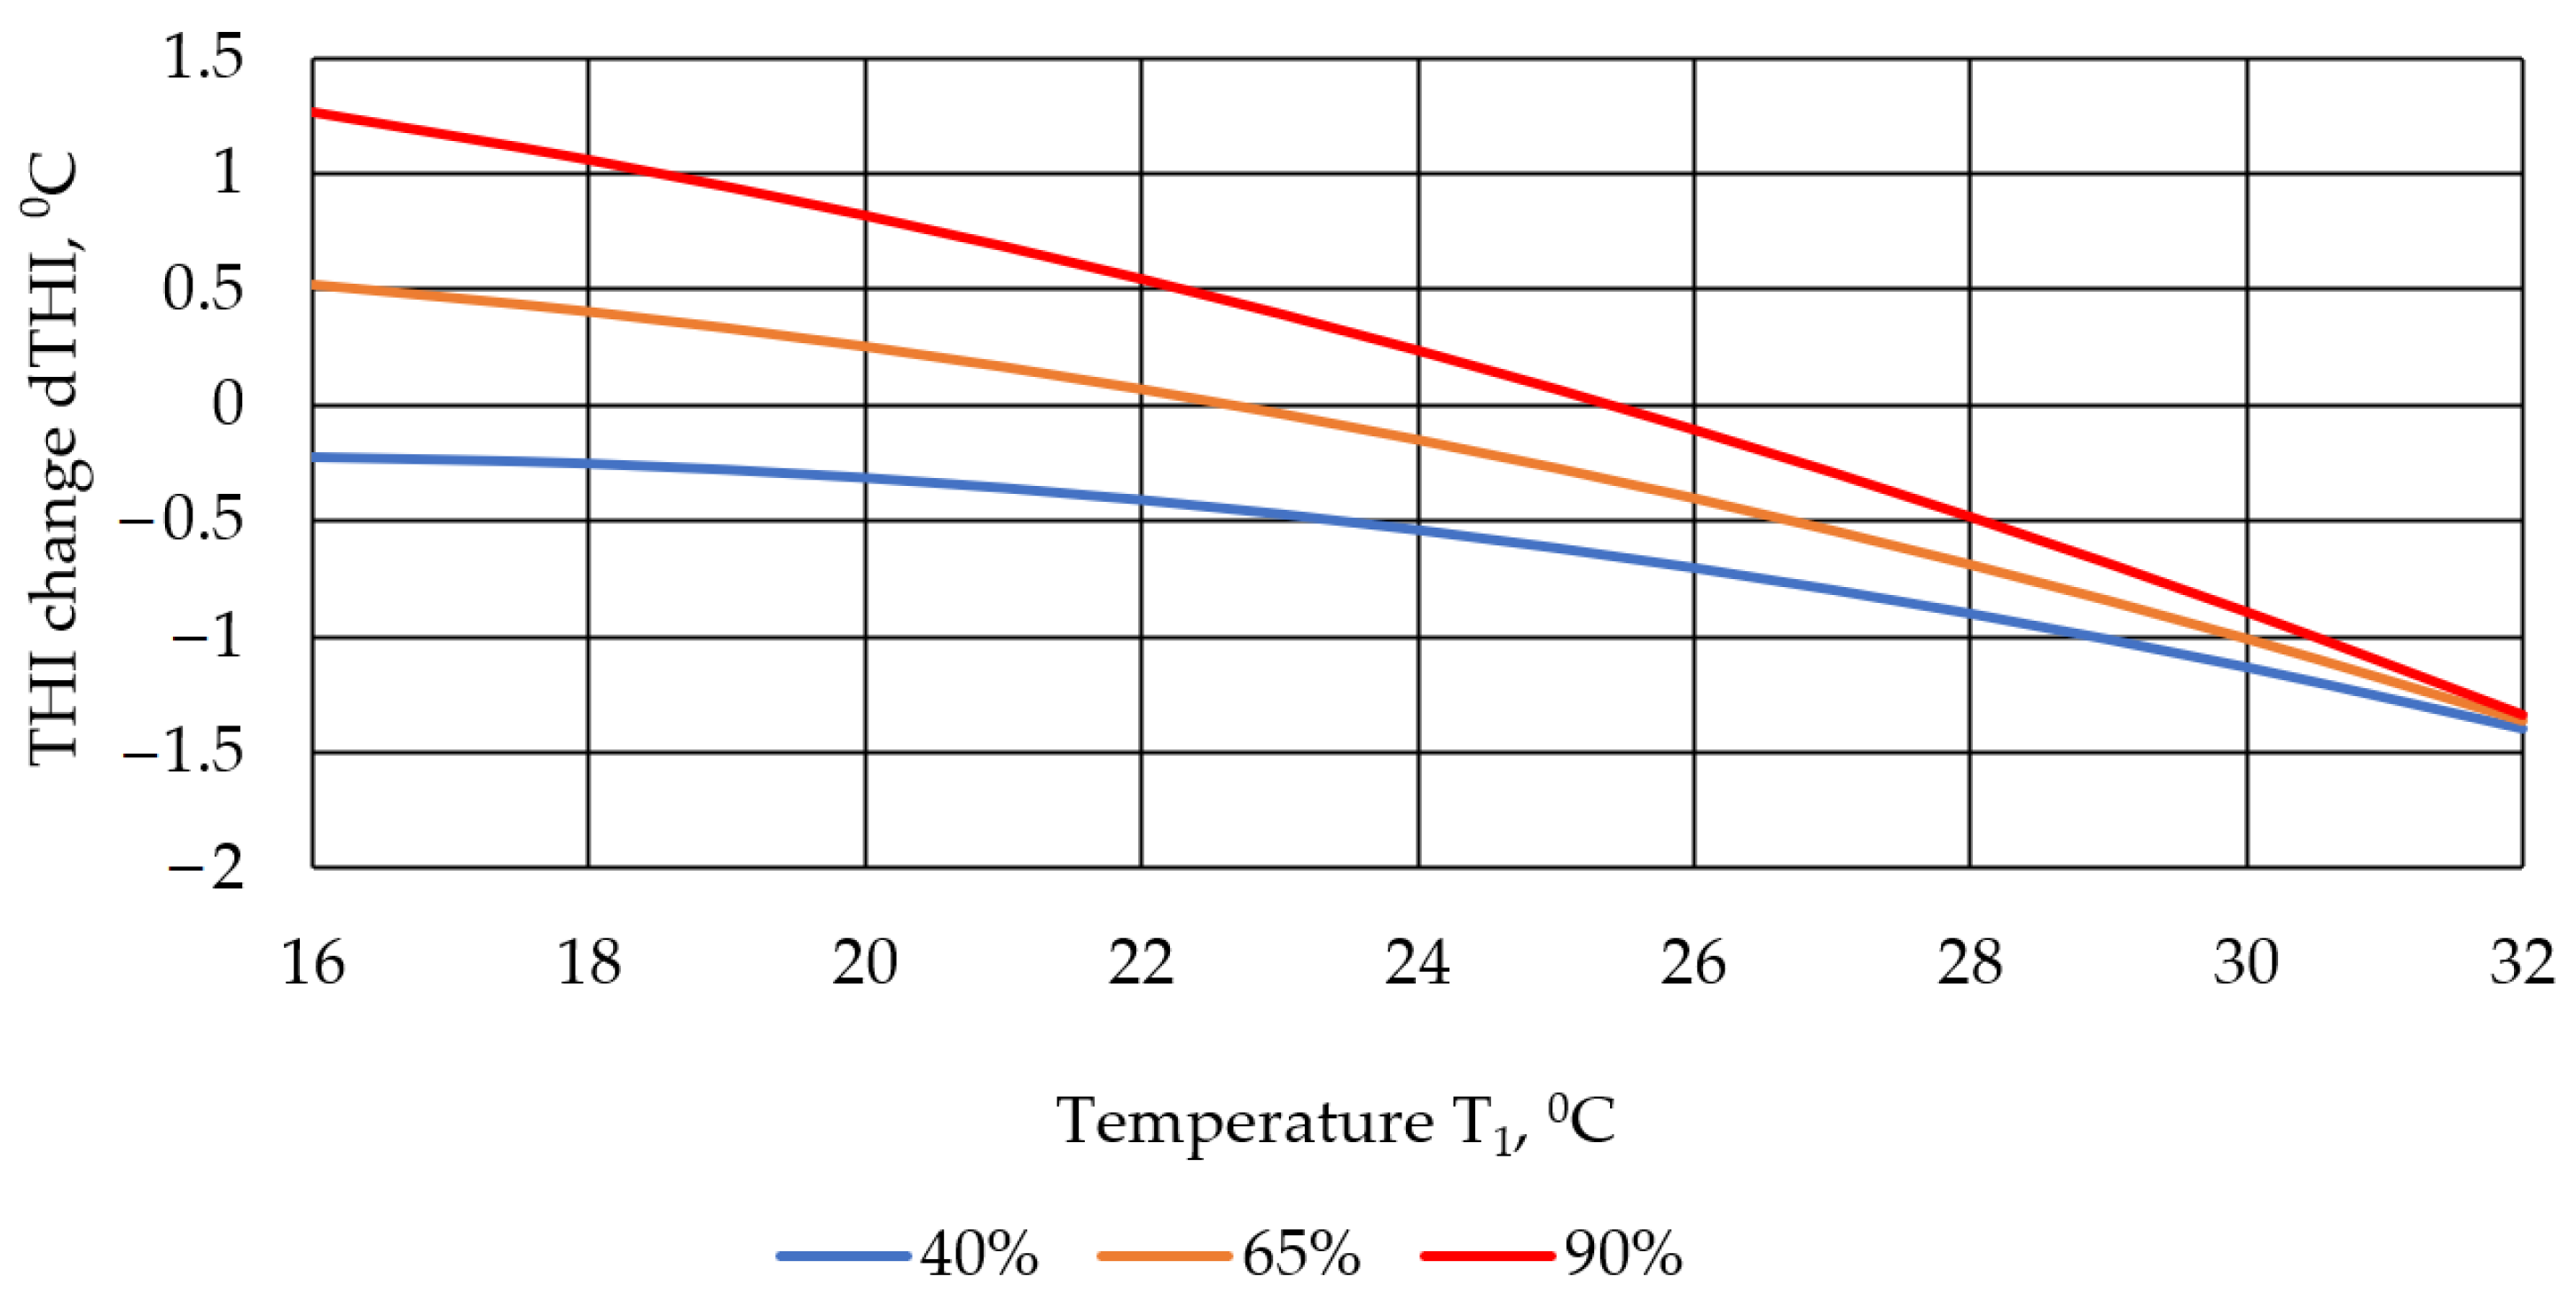
A detailed analysis of Equation (4) and the graph in Figure 11 made it possible to obtain the dependencies of the change in THI in the cowshed for different values of the relative humidity of the air coming from outside. In particular, three scenarios were considered for different values of relative humidity of the air coming from outside—40%, 65% and 90% (Figure 12).
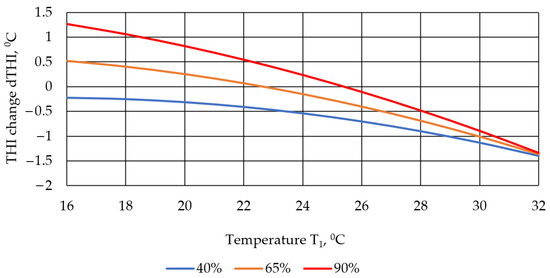
Figure 12.
Changes in THI in a cowshed depending on the temperature (for relative humidity values of 40%, 65% and 90%).
The dynamics of changes in THI (dTHI) in the cowshed, relative to the THI for the air coming from outside at different humidity values, were similar to the dynamics of changes in temperature (T). The lower the humidity, the more intensively the THI values decreased during the operation of the cooling system. A similar dynamic of THI reduction was also noted in [2]. A detailed analysis of Equation (4) and the graph in Figure 11 also allowed us to obtain the dependences of the dynamics of the THI changes in the cowshed for different temperature values of the air coming from outside. In particular, three scenarios were considered for the temperature values of the air coming from outside—20 °C, 26 °C and 32 °C (Figure 13).
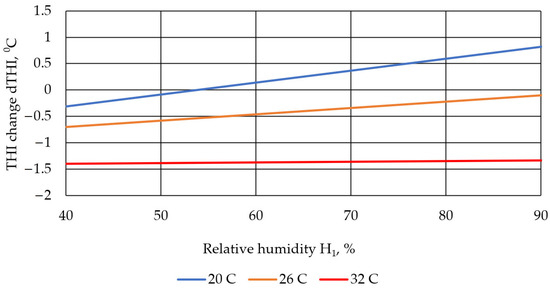
Figure 13.
Changes in THI in the cowshed depending on temperature (for temperature values of 20 °C, 26 °C and 32 °C).
According to the results of the analysis, it can be noted that at high temperatures of the air coming from outside (about 32 °C), the operation of the cooling system was effective, as it ensured a stable reduction in THI to 1.4 at all investigated values of relative humidity (from 30 to 95%). This conclusion correlates with the conclusion of [2], which states that the greatest reduction in THI due to the operation of the cooling system was observed at noon, when the intensity of solar radiation was high and the air temperature outside the cowshed was the highest. Also, in the study [15], it was said that under similar climatic conditions, the value of THI decreased by 1–2 units. It should be noted that the reduction in THI was observed for the entire range of the studied relative humidity values for the air temperature higher than 26 °C.
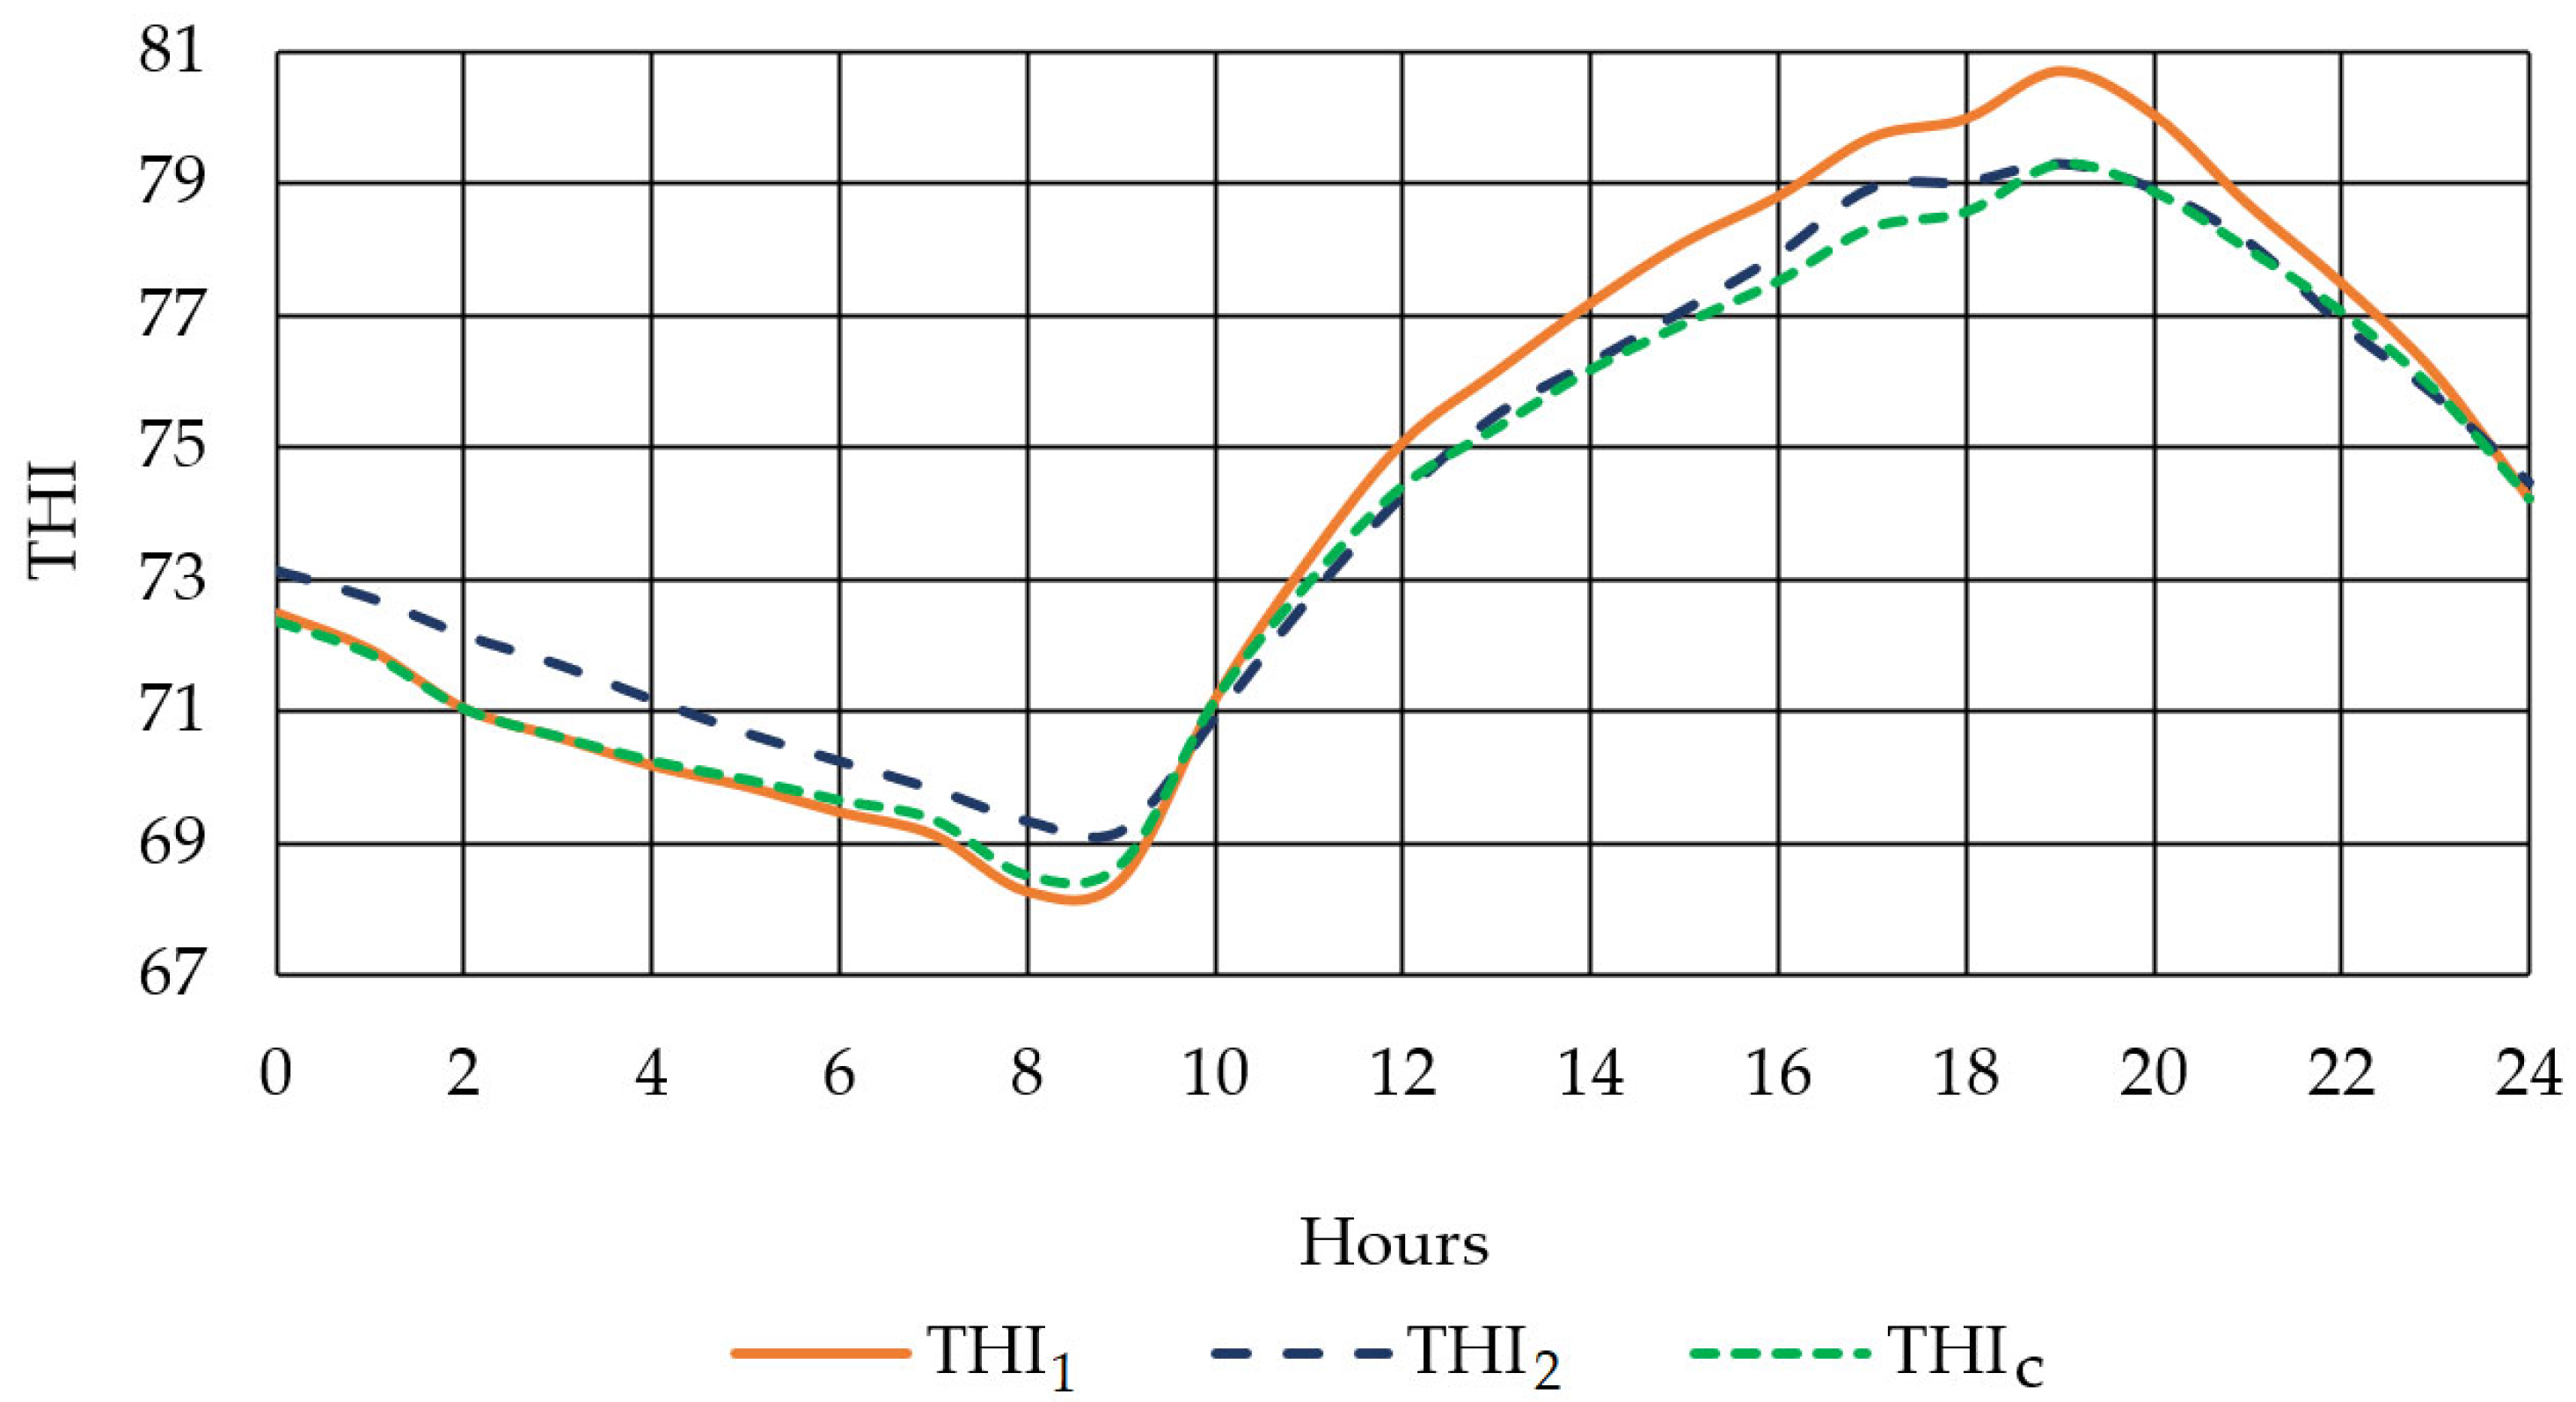
For the air temperatures lower than 21.5 °C, water spraying is not effective in reducing THI in the cowshed for the entire range of relative humidity values. To confirm the adequacy of the regression Equation (5), the dynamics of changes in relative humidity in the cowshed were analyzed based on the data obtained during the observation process and the data calculated using Equation (5): THIc = THI1 − dTHI (Figure 14).
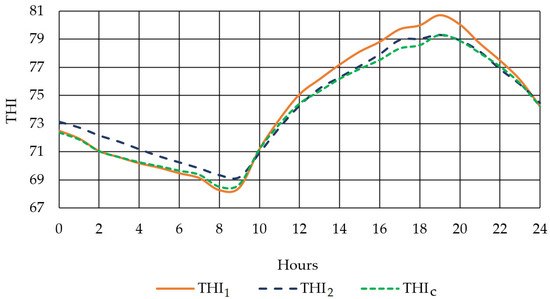
Figure 14.
Dynamics of changes THI in one day (17 August 2022).
The average deviation of the THIc value calculated by the model from the THI2 value calculated for the temperature T2 and relative humidity H2, obtained as a result of observation, was 0.6%.
4. Conclusions
The operation of the cooling system at an air temperature of 32 °C and a relative humidity of 40% allows the air temperature in the cowshed to be reduced by 2.2 °C. A decrease in temperature is observed for the air entering the cowshed starting from 16 °C at a relative humidity of less than 40% and starting from 26 °C at a relative humidity of up to 90%. When the air temperature is less than 21.5 °C, spraying water to cool the air is not rational, as it actually does not contribute to reducing the temperature in the cowshed. At high air temperatures, a greater increase in humidity is observed during the operation of the cooling system. For example, at a temperature of 32 °C the increase in relative humidity was from 8.0 to 9.6%. At lower temperature values, the growth of humidity was less. A significant increase in humidity at high temperatures during the operation of a cooling system is not critical. After all, usually for high air temperatures in the region where observations were made, lower values of relative humidity are characteristic. The change in the temperature–humidity index in the cowshed is similar to the change in temperature. Lower humidity values contribute to a more intense decrease in the temperature–humidity index during the operation of a cooling system. At a high temperature of the outside air (about 32 °C), the cooling system works more efficiently, as it provides a stable decrease in the temperature–humidity index to 1.4 units at all investigated values of relative humidity (from 30 to 95%). In general, a decrease in the temperature–humidity index is observed in the entire range of the studied relative humidity for air temperatures higher than 26 °C. For air temperatures lower than 21.5 °C, water spraying is not effective and does not cause a decrease in temperature humidity index in the cowshed. It should be noted that the results presented in this article are relevant under the conditions of this experiment.
The presented results prove that mathematical models based on statistical data are useful tools for decision making regarding the selection of cooling system operating models, as they allow simulating the cooling efficiency under the influence of many extraneous factors. However, further thorough research is needed to understand the processes, the formation and spraying of a jet of water, as well as subsequent evaporation of the drift of the formed micro-droplets of water. Such research will allow for accurate physical models that will be valuable to manufacturers, farmers and others who need water spray cooling systems. The methodology for obtaining accurate statistical and mathematical models from a large data set (applied in this article) can be used for a wide range of tasks, in particular when it is necessary to assess the efficiency of a technical system in a short time period.
Author Contributions
Conceptualization, R.B. and S.K.; methodology, J.Č.; validation, S.K., O.M. and R.B.; formal analysis, J.Č.; data curation, O.M. and S.K.; writing—original draft preparation, S.K.; writing—review and editing, R.B.; visualization, S.K.; supervision, J.Č.; project administration, R.B.; funding acquisition, R.B. All authors have read and agreed to the published version of the manuscript.
Funding
This research received no external funding.
Institutional Review Board Statement
Not applicable.
Data Availability Statement
Publicly available datasets were analyzed in this study. This data can be found here: https://docs.google.com/spreadsheets/d/1cJYXFr_jiaW-gKK7LgUjAHLXmCubmsiG/edit?usp=sharing&ouid=107865776624385304461&rtpof=true&sd=true (accessed on 5 November 2023).
Conflicts of Interest
The authors declare no conflict of interest.
References
- Bleizgys, R.; Naujokienė, V.; Čėsna, J. Humidification–Cooling System in Semi-Insulated Box-Type Cowsheds Prevent the Loss of Milk Productivity Due to Thermal Stress. Agronomy 2022, 12, 1131. [Google Scholar] [CrossRef]
- Almuhanna, E.A.; Gamea, G.R.; Osman, O.E.; Almahdi, F.M. Performance of roof-mounted misting fans to regulate heat stress in dairy cows. J. Therm. Biol. 2021, 99, 102984. [Google Scholar] [CrossRef] [PubMed]
- Bovo, M.; Agrusti, M.; Benni, S.; Torreggiani, D.; Tassinari, P. Random Forest Modelling of Milk Yield of Dairy Cows under Heat Stress Conditions. Animals 2021, 11, 1305. [Google Scholar] [CrossRef] [PubMed]
- Herbut, P.; Angrecka, S. Forecasting Heat Stress in Dairy Cattle in Selected Barn Zones with the Help of Thi and Thiadj Indexes. Ann. Anim. Sci. 2013, 13, 837–848. [Google Scholar] [CrossRef]
- Herbut, P.; Angrecka, S.; Godyń, D. Effect of the duration of high air temperature on cow’s milking performance in moderate climate conditions. Ann. Anim. Sci. 2018, 18, 195–207. [Google Scholar] [CrossRef]
- Lengi, A.J.; Stewart, J.W.; Makris, M.; Rhoads, M.L.; Corl, B.A. Heat Stress Increases Mammary Epithelial Cells and Reduces Viable Immune Cells in Milk of Dairy Cows. Animals 2022, 12, 2810. [Google Scholar] [CrossRef]
- Toghdory, A.; Ghoorchi, T.; Asadi, M.; Bokharaeian, M.; Najafi, M.; Ghassemi Nejad, J. Effects of Environmental Temperature and Humidity on Milk Composition, Microbial Load, and Somatic Cells in Milk of Holstein Dairy Cows in the Northeast Regions of Iran. Animals 2022, 12, 2484. [Google Scholar] [CrossRef] [PubMed]
- Bleizgys, R.; Čėsna, J.; Kukharets, S.; Medvedskyi, O.; Strelkauskaitė-Buivydienė, I.; Knoknerienė, I. Adiabatic Cooling System Working Process Investigation. Processes 2023, 11, 767. [Google Scholar] [CrossRef]
- Chamberlain, A.T.; Powell, C.D.; Arcier, E.; Aldenhoven, N. The relationship between on-farm environmental conditions inside and outside cow sheds during the summer in England: Can Temperature Humidity Index be predicted from outside conditions? Anim.-Open Space 2022, 1, 100019. [Google Scholar] [CrossRef]
- Antanaitis, R.; Anskienė, L.; Rapaliutė, E.; Bilskis, R.; Džermeikaitė, K.; Bačėninaitė, D.; Juškienė, V.; Juška, R.; Meškinytė, E. Relationship between Reticulorumen Parameters Measured in Real Time and Methane Emission and Heat Stress Risk in Dairy Cows. Animals 2022, 12, 3257. [Google Scholar] [CrossRef]
- Bagdonienė, I.; Bleizgys, R. Ammonia emissions from dairy cattle manure under variable ventilation rates. Ann. Anim. Sci. 2014, 14, 141–151. [Google Scholar] [CrossRef]
- Kic, P. Influence of External Thermal Conditions on Temperature–Humidity Parameters of Indoor Air in a Czech Dairy Farm during the Summer. Animals 2022, 12, 1895. [Google Scholar] [CrossRef]
- Mylostyvyi, R.; Chernenko, O. Correlations between Environmental Factors and Milk Production of Holstein Cows. Data 2019, 4, 103. [Google Scholar] [CrossRef]
- Bucklin, R.A.; Turner, L.W.; Beede, D.K.; Bray, D.R.; Hemken, R.W. Methods to Relieve Heat Stress for Dairy Cows in Hot, Humid Climates. Appl. Eng. Agric. 1991, 7, 241–247. [Google Scholar] [CrossRef]
- Fournel, S.; Ouellet, V.; Charbonneau, É. Practices for Alleviating Heat Stress of Dairy Cows in Humid Continental Climates: A Literature Review. Animals 2017, 7, 37. [Google Scholar] [CrossRef]
- Ortiz, X.A.; Smith, J.F.; Villar, F.; Hall, L.; Allen, J.; Oddy, A.; Al-Haddad, A.; Lyle, P.; Collier, R.J. A comparison of 2 evaporative cooling systems on a commercial dairy farm in Saudi Arabia. J. Dairy Sci. 2015, 98, 8710–8722. [Google Scholar] [CrossRef] [PubMed]
- Ulpiani, G. Water mist spray for outdoor cooling: A systematic review of technologies, methods and impacts. Appl. Energy 2019, 254, 113647. [Google Scholar] [CrossRef]
- Sanchez, I.; Faci, J.M.; Zapata, N. The effects of pressure, nozzle diameter and meteorological conditions on the performance of agricultural impact sprinklers. Agric. Water Manag. 2011, 102, 13–24. [Google Scholar] [CrossRef]
- Berman, A. Extending the Potential of Evaporative Cooling for Heat-Stress Relief. J. Dairy Sci. 2006, 89, 3817–3825. [Google Scholar] [CrossRef]
- Kissell, R.L. Chapter 8—Nonlinear Regression Models. In Algorithmic Trading Methods, 2nd ed.; Academic Press: Cambridge, MA, USA, 2021; pp. 197–219. [Google Scholar] [CrossRef]
- Kong, Q.; Siauw, T.; Bayen, A.M. Chapter 16—Least Squares Regression. In Python Programming and Numerical Methods; Academic Press: Cambridge, MA, USA, 2021; pp. 279–293. [Google Scholar] [CrossRef]
- Romeo, G. Chapter 13—Data Analysis for Business and Economics. In Elements of Numerical Mathematical Economics with Excel; Academic Press: Cambridge, MA, USA, 2020; pp. 695–761. [Google Scholar] [CrossRef]
- Haeussermann, A.; Hartung, E.; Jungbluth, T.; Vranken, E.; AertsBerckmans, J.-M.D. Cooling effects and evaporation characteristics of fogging systems in an experimental piggery. Biosyst. Eng. 2007, 97, 395–405. [Google Scholar] [CrossRef]
- Redelinghuys, L.G.; Tshamala, M.C.; Hans, T.M. Performance of an adiabatic pre-cooling system for concentrating solar power plants in arid areas. Appl. Therm. Eng. 2023, 231, 120819. [Google Scholar] [CrossRef]


Disclaimer/Publisher’s Note: The statements, opinions and data contained in all publications are solely those of the individual author(s) and contributor(s) and not of MDPI and/or the editor(s). MDPI and/or the editor(s) disclaim responsibility for any injury to people or property resulting from any ideas, methods, instructions or products referred to in the content. |
© 2023 by the authors. Licensee MDPI, Basel, Switzerland. This article is an open access article distributed under the terms and conditions of the Creative Commons Attribution (CC BY) license (https://creativecommons.org/licenses/by/4.0/).