Article

Can Modification of Sowing Date and Genotype Selection Reduce the Impact of Climate Change on Sunflower Seed Production?

1
Institute of Field and Vegetable Crops, National Institute of the Republic of Serbia, Maksima Gorkog 30, 21000 Novi Sad, Serbia
2
Faculty of Agriculture, University of Novi Sad, Trg Dositeja Obradovića 8, 21000 Novi Sad, Serbia
*
Author to whom correspondence should be addressed.
Agriculture 2023, 13(11), 2149; https://doi.org/10.3390/agriculture13112149
Submission received: 12 October 2023 / Revised: 4 November 2023 / Accepted: 10 November 2023 / Published: 15 November 2023
(This article belongs to the Section Seed Science and Technology)

Abstract

:
Climate change projections for the 21st century pose great threats to semi-arid regions, impacting seed production and the quality of sunflowers. Crop yields are negatively affected by climate variability, especially in the event of droughts during the crucial growth stages. Understanding the relationships between agrometeorological, genetic, and agronomic factors is crucial for maintaining crop sustainability. Optimal sowing dates are an essential condition for maximizing crop genetic potential, but challenges come from annual weather variations. This study analyzes how sunflower genotypes respond to different sowing dates under climate change and focuses on the conditions for obtaining maximum seed yields and favorable agronomic traits. From 2020 to 2022, the experiment featured six genotypes sown across four different dates at two-week intervals, simulating seed sunflower production. The results obtained by ANOVA indicated that the seed yield and oil yield were significantly affected by the sowing date, the genotype, and their interaction, with coefficients of variation ranging from 7.6% for oil yield to 41.1% for seed yield. Besides seed yield and oil yield, LDA biplot and Discriminant Functions confirmed that seed germination energy also played a significant role in separating genotypes into clusters. A Visual Mixed Model showed that shifting the optimal sowing date (mid-April) to early May allows a reduction in the number of days the plants spend in critical growth stages, thereby escaping stressful conditions during pollination and seed filling. The findings resulted, on average, in increased yields and improved seed quality, which are the primary goals of seed production, but not in increased 1000-seed weight. Notably, high temperatures during the critical sunflower growth stages negatively affected the measured parameters of seed production. The increased precipitation during seed filling boosted the 1000-seed mass and seed yield. Extended flowering reduced the growth rate and seed germination, but longer seed filling increased the 1000-seed mass and seed yield. Our future breeding goals will be to create genotypes with a shorter flowering period and an extended seed-filling period to better respond to climate change.

1. Introduction

More frequent occurrences of extremely dry periods lead to soil moisture deficits [1]. The Intergovernmental Panel on Climate Change (IPCC) reported an increase in droughts in agricultural areas of the Mediterranean and Western/Central Europe. Additionally, the predictions indicate that agricultural droughts will double with a temperature increase of 1.5 °C [2]. Forecasts suggest that, by the end of the 21st century, semi-arid regions will likely experience significant negative effects of climate change, which will impact seed production, the quality of produced seeds [3], and the entire economy [4].
The sunflower is an adaptable field crop. The prospects of sunflower cultivation in Europe are closely linked to its capability to adjust to climate change. Sunflower adaptability is ascribed to its well-developed root system that extends deeply into the soil, facilitating efficient water absorption [5,6,7]. Considering its adaptability to various climatic conditions, sunflower has been proposed as a global crop model for adaptation to different environments [8,9]. However, the increasing frequency of climate change, particularly droughts during critical phenophases, can lead to a significant reduction in sunflower yield stability [10,11]. As reported by Donatelli et al. [12], a decline in sunflower yields ranging from 10% to 30% is anticipated in Eastern Europe by the year 2030. Meanwhile, ref. [13] a reduction in yields of up to 30% in Southeastern Europe is expected to occur by 2025, due to an increase in temperature of up to 2 °C. The same authors state that, despite increased irrigation, sunflower yields are expected to decline by approximately 17% by 2050 compared to average yields from 2025. Sunflower hybrid seed production depends on parental lines, crop management, and environmental influences, especially precipitation and extreme temperatures during flowering, while the choice of sowing dates suitable for each geographical region would mitigate the negative effects of these variables [14]. To ensure the sustainability of sunflower production under altered climatic conditions, it is important to understand the complex interaction between agrometeorological conditions, genetic attributes, and agronomic factors which can mitigate the negative impact of climate change [15]. In an attempt to increase sunflower yields, many farmers have recently adjusted or even changed their agronomic practices, such as altering sowing dates [16]. Selecting the optimal sowing date for each genotype is a crucial decision in agricultural production, especially when aiming to maximize genetic potential [17]. However, considerable variations in weather conditions from year to year make it challenging to determine the optimal sowing date [18]. Early sowing can increase the risk of crop damage by frost, while delayed sowing can result in shortening certain vegetation phases, which can affect yield reduction [19]. In addition to sowing dates, genotypes play an important role in sunflower adaptation to environmental conditions and the achievement of stable yields [20,21]. Genotype adaptability and the response to various abiotic and biotic environmental factors are very important characteristics [22,23] and are among the most important objectives of sunflower breeding [24]. The development of genotypes characterized by a shorter vegetation period is therefore an approach to adapting sunflower production to warmer and drier summers [25,26,27]. Consequently, combining breeding (developing early or mid-early genotypes with stress tolerance) with strategic agronomic practices (optimal sowing dates) can enhance the climate change resilience of sunflower production.
The primary aim of the research was to determine the most favorable conditions for sunflower cultivation, namely optimal seed production and advantageous agronomic characteristics, by examining how various sowing dates affect the response of various genotypes of sunflowers to altered climatic conditions.

2. Materials and Methods

2.1. Experimental Design

The research was conducted at the experimental fields of the Institute of Field and Vegetable Crops of Novi Sad, National Institute of the Republic of Serbia (IFVCNS), located at Rimski šančevi (45°19′44.3″ N 19°49′40.7″ E), from 2020 to 2022. All genotypes were sown on four different sowing dates, with a two-week interval between sowings: 15 April (SD1), 1 May (SD2), 15 May (SD3), and 1 June (SD4) (Table 1). The experiment consisted of three sunflower isolations, which were the simulation of basic seed production (two isolations) and the production of the first-generation certified seed (one isolation).
The distance between the three isolations was 2 km, as prescribed by national regulations. The experiment was conducted using a split-plot design with four replications, where sowing dates served as the main plots within which different genotypes were sown. Sowing was conducted mechanically in all isolations, using a specialized seeder—the Wintersteiger Dynamic (4-row disc seeder)—with inter-row spacing of 70 cm and intra-row spacing of 11 cm. Thinning was performed at 22 cm during the stage of unfolding the first leaf pair. All atypical plants (outcross) were removed during the bud stage, while fertile plants were removed from the A-analog during the flowering stage. Sorghum was the preceding crop on the experimental plots. During autumn, before winter plowing, the main soil macronutrients in the form of NPK (15:15:15) were applied to the soil at a rate of 220 kg ha−1, while 200 kg ha−1 of urea (N 46%) was added at pre-sowing. The plots were treated with herbicides after sowing and before sunflower emergence. An herbicide against narrow-leaf weeds was applied post-emergence, while broad-leaf weeds were managed by manual removal and inter-row cultivation. The individual plot size was 11 × 4.9 m = 50.6 m2 in the experiment simulating basic seed production, and 11 × 6.3 m = 69.3 m2 in the experiment simulating the first-generation certified seed production. According to the FAO/WRB classification [28], the soil in the experimental plots is classified as slightly calcareous loamy chernozem—Calcic Gleyic Chernozem (CH-cc.gl-lo).

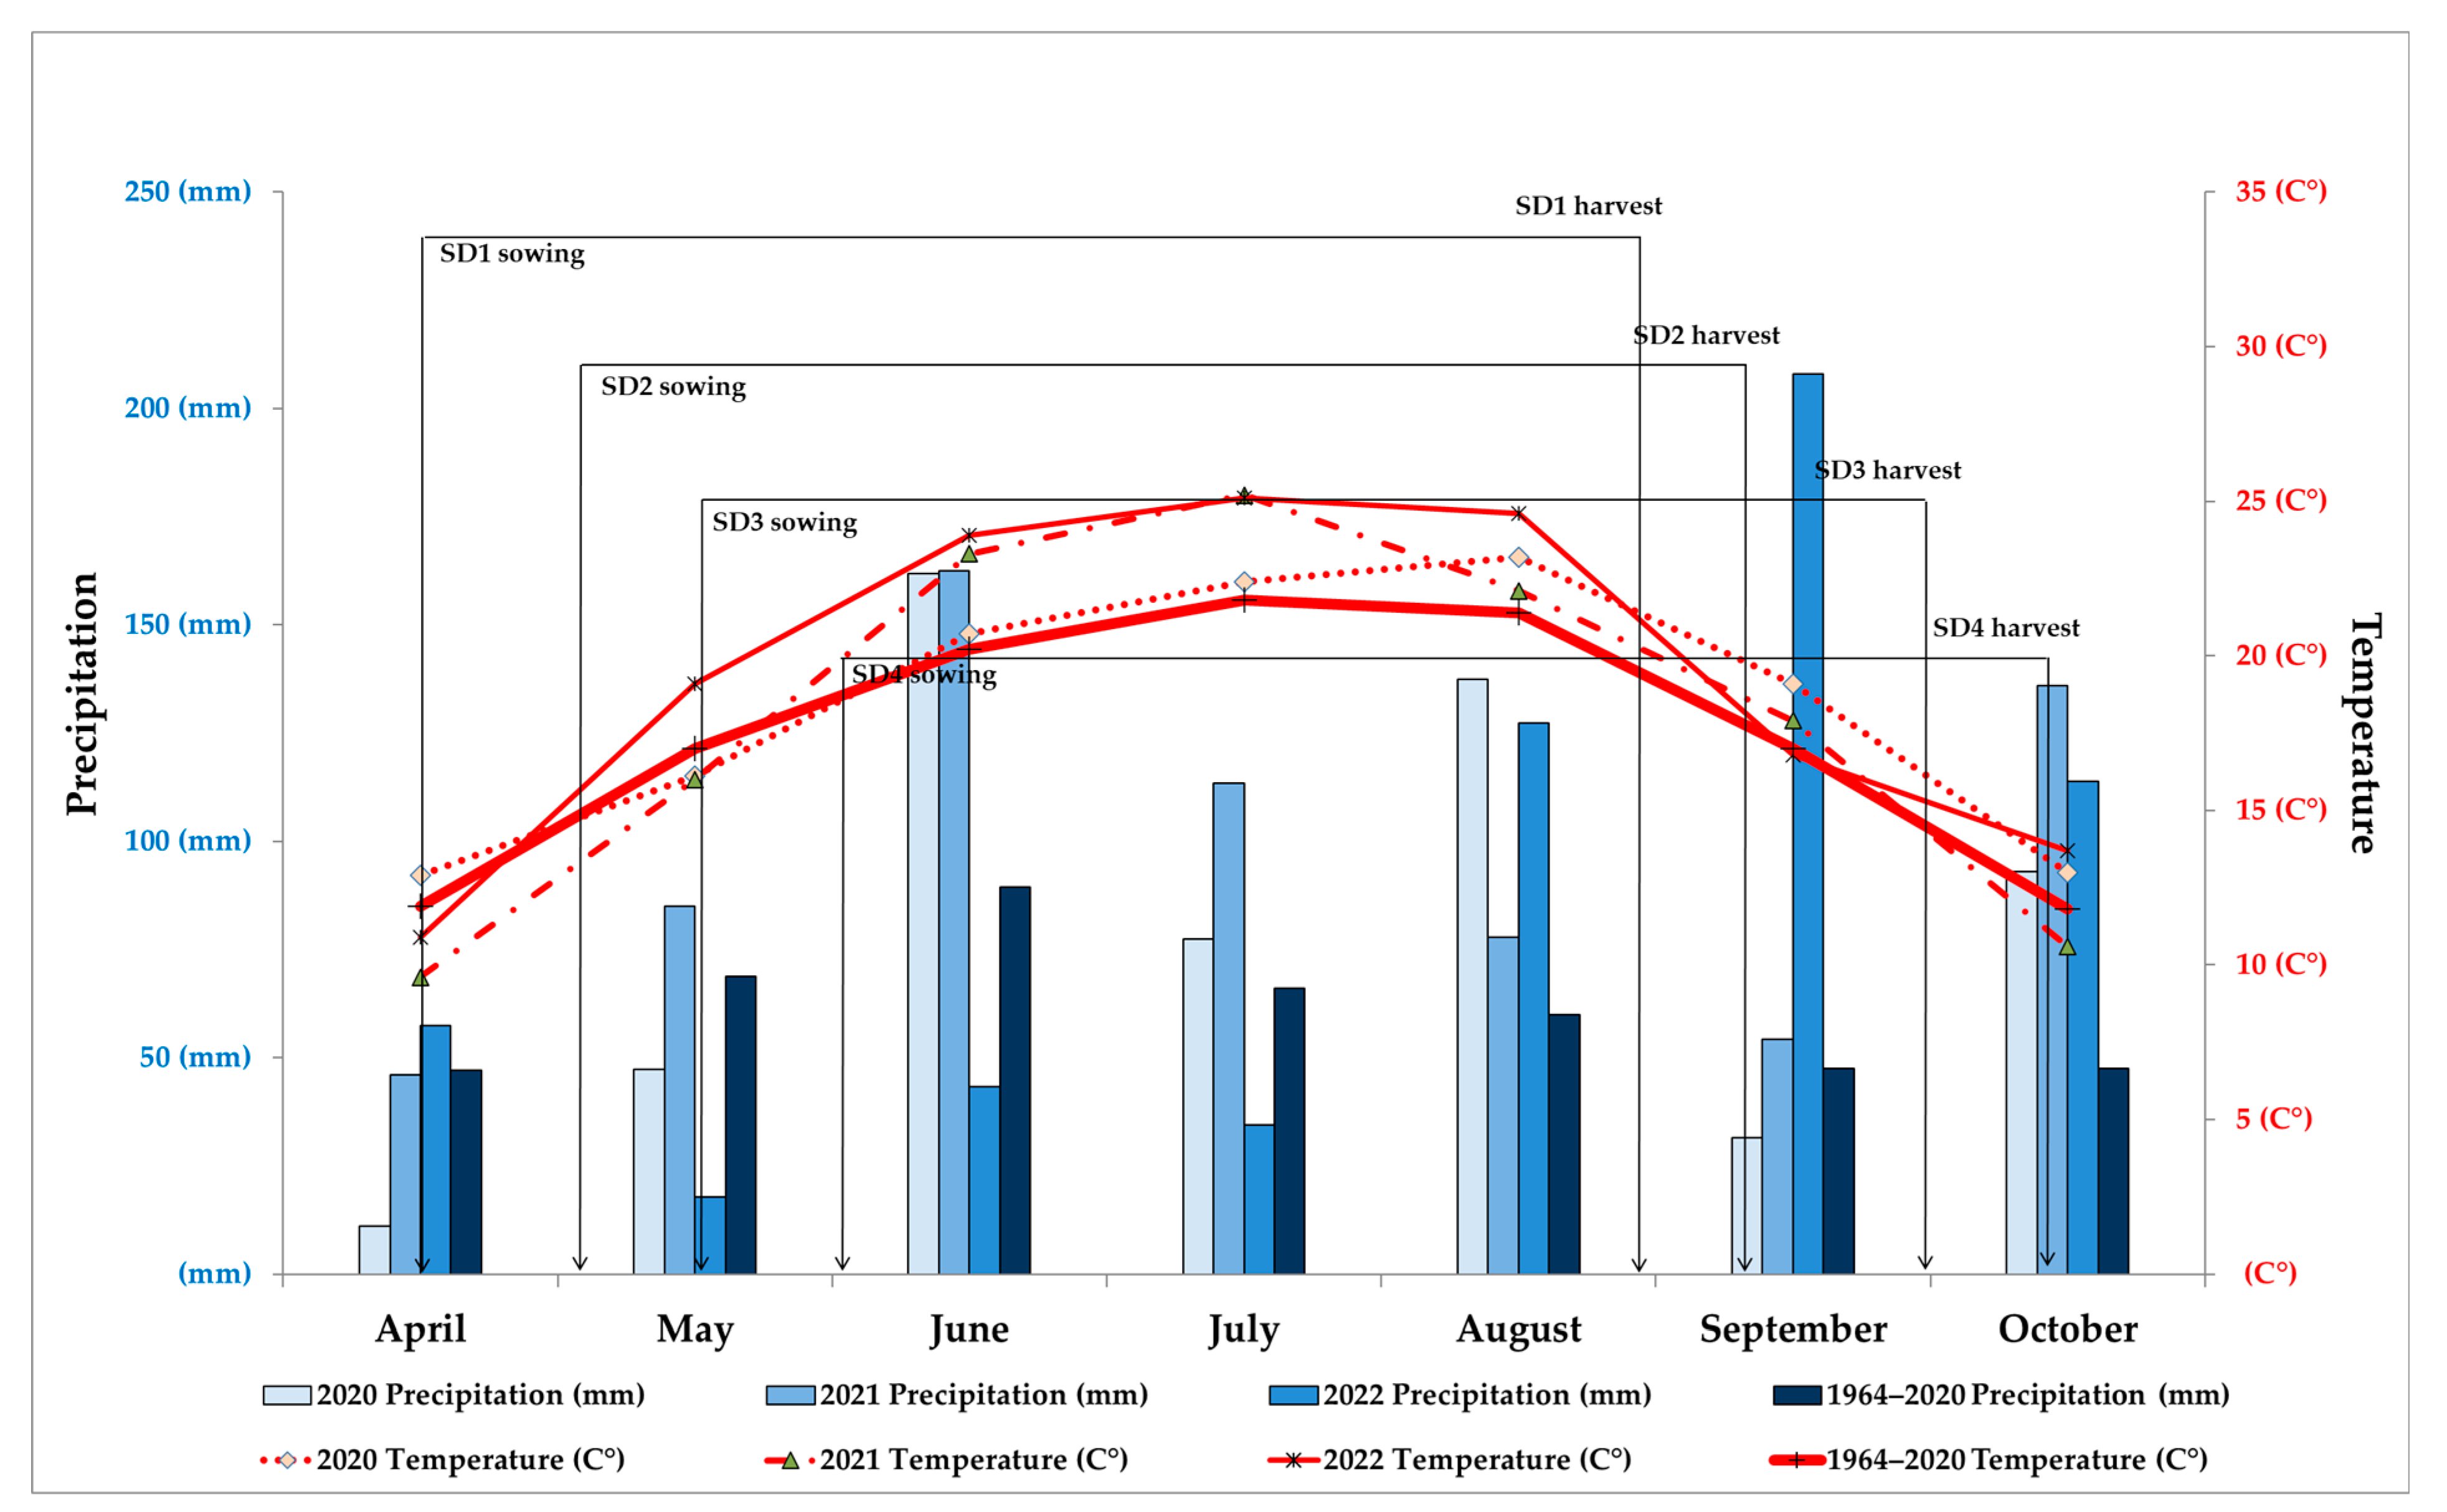
2.2. Growing Season Conditions

The climate in the experimental area is characterized as moderate continental, with seasonal variations in temperature and precipitation. Mean monthly temperatures and precipitation totals for the vegetation period were collected at the Rimski Šančevi Meteorological Station, operated by the Republic Hydrometeorological Service of Serbia (RHMZ) [29]. The obtained data are represented in a Walter climate diagram (Figure 1).
In 2020, the precipitation sum during the vegetation period (April to October) amounted to 559.5 mm, which was 133.2 mm higher than the 56-year average. Regarding temperatures from April to June, no significant deviations from the multi-year averages were observed, except that temperatures were slightly higher from July to October. The average temperature in 2021 was 17.8 °C during the vegetation period, but significantly higher temperatures than the multi-year average were recorded in June, July, and August 2021. Additionally, the highest precipitation in the entire experiment was recorded in 2021. In May 2022, dry weather predominated, with only 17.9 mm of precipitation, well below the multi-year average, while the temperature remained around 19 °C, approximately 2 °C above the multi-year average. The extreme drought recorded in 2022 was accompanied by high temperatures during June, July, and August. The average temperatures during the summer months of 2022 deviated by more than 3.5 °C from the multi-year average of about 21 °C.

2.3. Observed Parameters of Sunflower Plants

During the vegetation period, the duration of critical phenophases was monitored following the criteria outlined by Schneiter and Miller [30]. Additionally, average daily temperatures (AT) and sum precipitation (SP) were monitored during flowering (R4-6) and from the end of flowering to physiological maturity (R6-R9*). It is important to note that the authors did not provide an explanation for the stage of physiological maturity; therefore, in this study, it was denoted as R-9* (when the seed moisture content was below 14%). Under field conditions, sunflower head diameter (HD) and plant height (PH) were measured using a measuring tape on a sample of 30 plants per plot at the full flowering stage (R-5.8). Germination energy (GE) and seed germination (GR), as well as 1000-seed mass (TSM), were analyzed in the accredited Seed Testing Laboratory of IFVCNS. TSM was determined following the standard ISTA (International Seed Testing Association) method. Six months after harvest, the produced seeds underwent a standard laboratory germination test according to ISTA rules [31]. Seed yield (Y) was measured after manual harvesting, with 30 sunflower heads per plot (excluding the outer rows to eliminate edge effects). The obtained sunflower seed yield was recalculated to a 9% moisture content and a planting density of 55,000 plants per hectare. Oil content in pure seed without impurities (99% purity) was determined in the Laboratory for Chemical Analysis of the Sunflower Department at IFVCNS. The oil content in pure seed was determined in all the samples using the nuclear magnetic resonance (NMR) method according to Granlund and Zimmerman [32], while oil yield (OY) was obtained as a result of seed yield and oil content in pure seed.

2.4. Statistical Analysis

The data were analyzed using a two-way analysis of variance (ANOVA) followed by Duncan’s multiple range test. A Visual Mixed Model (VMM) was used to assess the effect of weather conditions during the critical growth phases and the duration of those phases on the examined seed production parameters at different sowing dates. Linear discriminant analysis (LDA) was employed to form linear combinations of independent variables for the purpose of discriminating between predefined groups while minimizing misclassification error [33,34]. LDA was also utilized to identify which dependent variables contributed to the classification [35]. Statistical analyses were performed using the statistical software SPSS 17 [36], JMP Pro 14.0 [37], and JASP 0.18.1.0 [38].

3. Results and Discussion

3.1. Factor Share in the Variation of All Examined Traits

Consistent variation in climatic conditions throughout the sunflower growing season has major consequences on seed yield and other crucial agronomic traits, directly impacting the genotype–environment interaction. To properly analyze the obtained results, it is important to consider the fact that different climatic conditions prevailed during the execution of the experiment. The results of ANOVA as well as factor analysis of variation of all examined parameters are presented in Table 2 as percentages of the sum of squares (SS%).
Statistically highly significant effects on the variation of all examined parameters were observed for all factors across all years of the study, as corroborated by the ANOVA results. The percentage of the sum of squares has indicated variation in the sunflower HD throughout the experiment. In 2020, the SD (42%) had the most substantial impact on sunflower HD, while the interaction between SD and genotype (G) (39%) also had a significant effect, which is in accordance with the findings of Faramarzi and Khorshidi [39]. In 2021, G became the dominant factor (41%), while the interaction between SD and G (32%) and SD itself (27%) also exerted significant, but comparatively lower effects. In 2022, the interaction between SD and G (50%) had the most substantial impact, with G (40%) and SD (10%) remaining significant factors, but with smaller contributions. Plant height is a genetically determined trait [9], but it is also influenced by growing conditions, as confirmed in the studies conducted by Partal [40] and Babec [41]. Factor analysis of the variation of PH, expressed as a percentage of the sum of squares, also revealed changes across the years of the study. In 2020, G (75%) had the most significant impact on PH, while the interaction between SD and G (18%) also had a significant but notably smaller effect. In 2021, G (43%) had the most substantial impact, SD (32%) closely followed G, and the interaction between them (25%) exhibited a small but meaningful effect. In 2022, a similar pattern emerged as compared to 2020. The factors influencing the variation in seed quality (GE and GR), expressed as a percentage of the sum of squares, indicate that G was the most influential factor during 2020 and 2021, while the interaction between SD and G had the greatest impact during 2022. The influence of SD remained consistently lower than other factors throughout the years of the study, but it remained statistically highly significant.
The variation in TSM was observed, while G played the most significant role in the variation of TSM in all years of the experiment. However, other factors (SD and the interaction between SD and G) also exhibited a statistically significant effect, as confirmed by Krstić et al. [42]. Environmental conditions, genotype, and applied agronomic practices have a substantial impact on seed and oil yield variation, as reported by Ion et al. [43], Kvashin et al. [44], and Radić et al. [45]. Furthermore, different factors exhibited varying effects on Y and OY during different years of the study. In 2020, the interaction between SD and G contributed the most to Y variation (53%) and OY variation (54%), whereas G had a greater contribution to variation in 2021 (74% for Y and 76% for OY) and in 2022 (75% for Y and 71% for OY). The impact of SD as a factor on Y and OY ranged from 3% to 8% depending on the year and was statistically significant, with the highest value observed in 2022 as the driest year. From 2017 to 2019, Crnobarac et al. [46] conducted an experiment on the same research location and confirmed that sowing date, genotype, and their interaction significantly influenced seed and oil yield, which aligns with the findings of other authors, such as Balalić et al. [17].

3.2. The Influence of the Sowing Date on the Observed Traits of Sunflower Plants through Different Growing Seasons

It is crucial to identify and use agronomic traits directly linked to seed yield for selection criteria [47]. Values of the analyzed traits presented in Table 3 show a significant variation across different SDs throughout all years of the research. Due to substantial variability in sunflower traits, the IFVCNS collection of inbred sunflower lines is a valuable source of breeding material for responding to climate change [48]. Sunflower seed yield, reliant on components like 1000-seed mass and oil content, directly affects the yield per unit area [49]. Sunflowers typically show stability and result in high yields under variable weather conditions, even in unfavorable seasons [50] such as the season of 2022.
The results obtained in 2020 confirm that delaying SD results in smaller HD. Furthermore, sowing delay leads to a reduction in TSM, Y, and OY, as corroborated by other authors, such as Oshundiya et al. [51]. Sowing date had a highly statistically significant impact on seed yield variation, as noted by Partal [40]. On average, the highest Y in his study was achieved with the earliest SD (early April at the Fundulea, Romania location). Ozturk et al. [52] emphasized that delaying sowing by 10 to 20 days leads to a decrease in yield and yield components. The same authors mentioned that sunflower genotypes with shorter vegetation periods achieved the highest yields and agronomic traits and are recommended for regions with short growing seasons and higher altitudes. This indicates that the optimal sowing time (SD1) was crucial for achieving higher Y and increased PH, which is in accordance with the findings of Balalić [53].
According to Abbas et al. [54], crop production is significantly affected by the duration of vegetation—a factor closely intertwined with environmental conditions, particularly temperature—and agronomic practices. Additionally, genotype selection and sowing time play pivotal roles in determining crop production outcomes, as highlighted in the research of these authors. The research confirms that dry periods in critical growth phases can be avoided by shortening the sunflower phenophase due to delayed sowing, which results in higher-quality seeds, as observed in 2021. In the same year, delay in sowing noticeably led to larger heads with increased PH and a higher Y and OY, simultaneously. This result indicates the adaptability of plants to weather conditions where plants are able to achieve higher yields and maintain their quality regardless of weather conditions, which is of great interest to seed companies. During 2022, sowing delay resulted in shorter PH, in line with Partal [40], but also lower seed vigor and GR, as confirmed by Rezadust et al. [55]. A smaller TSM and a larger HD suggest limited plant adaptation to dry conditions, while Škorić [56] suggested that increasing sunflower head diameter beyond optimal measures for a genotype can lead to a reduction in 1000-seed mass. Significantly higher Y and OY during SD2 and SD3 suggest that plants with a faster progression through phenophases better tolerate stressful conditions and adapt more quickly. The extremely dry conditions observed in July 2022 [57] confirm that sunflowers can, to some extent, tolerate this type of climate change, adapt, and achieve high yields but not necessarily high seed quality, as also confirmed by Alqudah et al. [58]. Research conducted by Soriano et al. [59] indicated that early sunflower sowing in the Mediterranean environments increased yields, while more recent studies carried out in the same region confirmed that moving the sowing date several weeks later is the most effective strategy in terms of seed production [18]. Changing the sowing date can thus be a sustainable production management strategy in different regions.

3.3. The Behavior and Influence of Different Genotypes of Sunflower on the Observed Traits during Different Vegetation Seasons

An important indicator of data dispersion is the coefficient of variation [60], which ranged from 7.6% for OY to 41.1% for Y in this study, which is largely significant variability between Gs. Genotype G1 exhibited the highest average HD (18.2 cm) during the year 2020, while G4 (16.5 cm) displayed the lowest value. However, in the following two years (2021 and 2022), G1 had the lowest average value among the studied years, with G5 achieving the highest values for the observed trait. Statistically highly significant differences in HD among different genotypes were confirmed by Duncan’s test (Table 3). Additionally, other researchers reported similar findings [61,62,63]. The latest genotype, G3, had the highest average PH value throughout all years of the study (163 cm, 122 cm, 123 cm, respectively), while G5 had the lowest value (116 cm, 93 cm, 93 cm, respectively). The results confirm that genotypes with longer vegetation periods tend to have a more robust habitus. The advantage of shorter genotypes lies in their higher resistance to lodging, particularly in regions frequented by strong winds. Additionally, cultivation is easier, and water requirements for seed production are lower in later phenophases, such as during harvesting [53]. Genotypes G4, G5, and G6 consistently achieved better results in terms of GE and GR compared to self-pollinating inbred lines. This can be attributed to their hybrid origin and heterosis effect. Genotype significantly influences seed quality variation, as reported by Mrđa et al. [64] and Krstić et al. [65]. Genotype G5 (91%) stood out and demonstrated the highest seed quality throughout all years of the study. Sunflower genotypes analysis showed that G1 consistently achieved the highest TSM, 67.9 g on average, while G2 had the lowest mean TSM (53.9 g) in all years of the study. The results indicate genetic variability among different sunflower genotypes in terms of the 1000-seed mass. Genotypes representing hybrid combinations, such as G4, generally achieved higher yield components compared to self-pollinating lines. Yield components, such as 1000-seed mass, play a crucial role in determining seed and oil yields [66]. During 2022, G4 achieved the highest average Y (3363 kg ha−1) and OY (1278 kg ha−1), while the self-pollinating inbred line G2 consistently had the lowest Y and OY throughout all years of the study. Genotype G1 (the earliest G) emerged as the most productive in terms of Y and OY among the self-pollinating inbred lines.

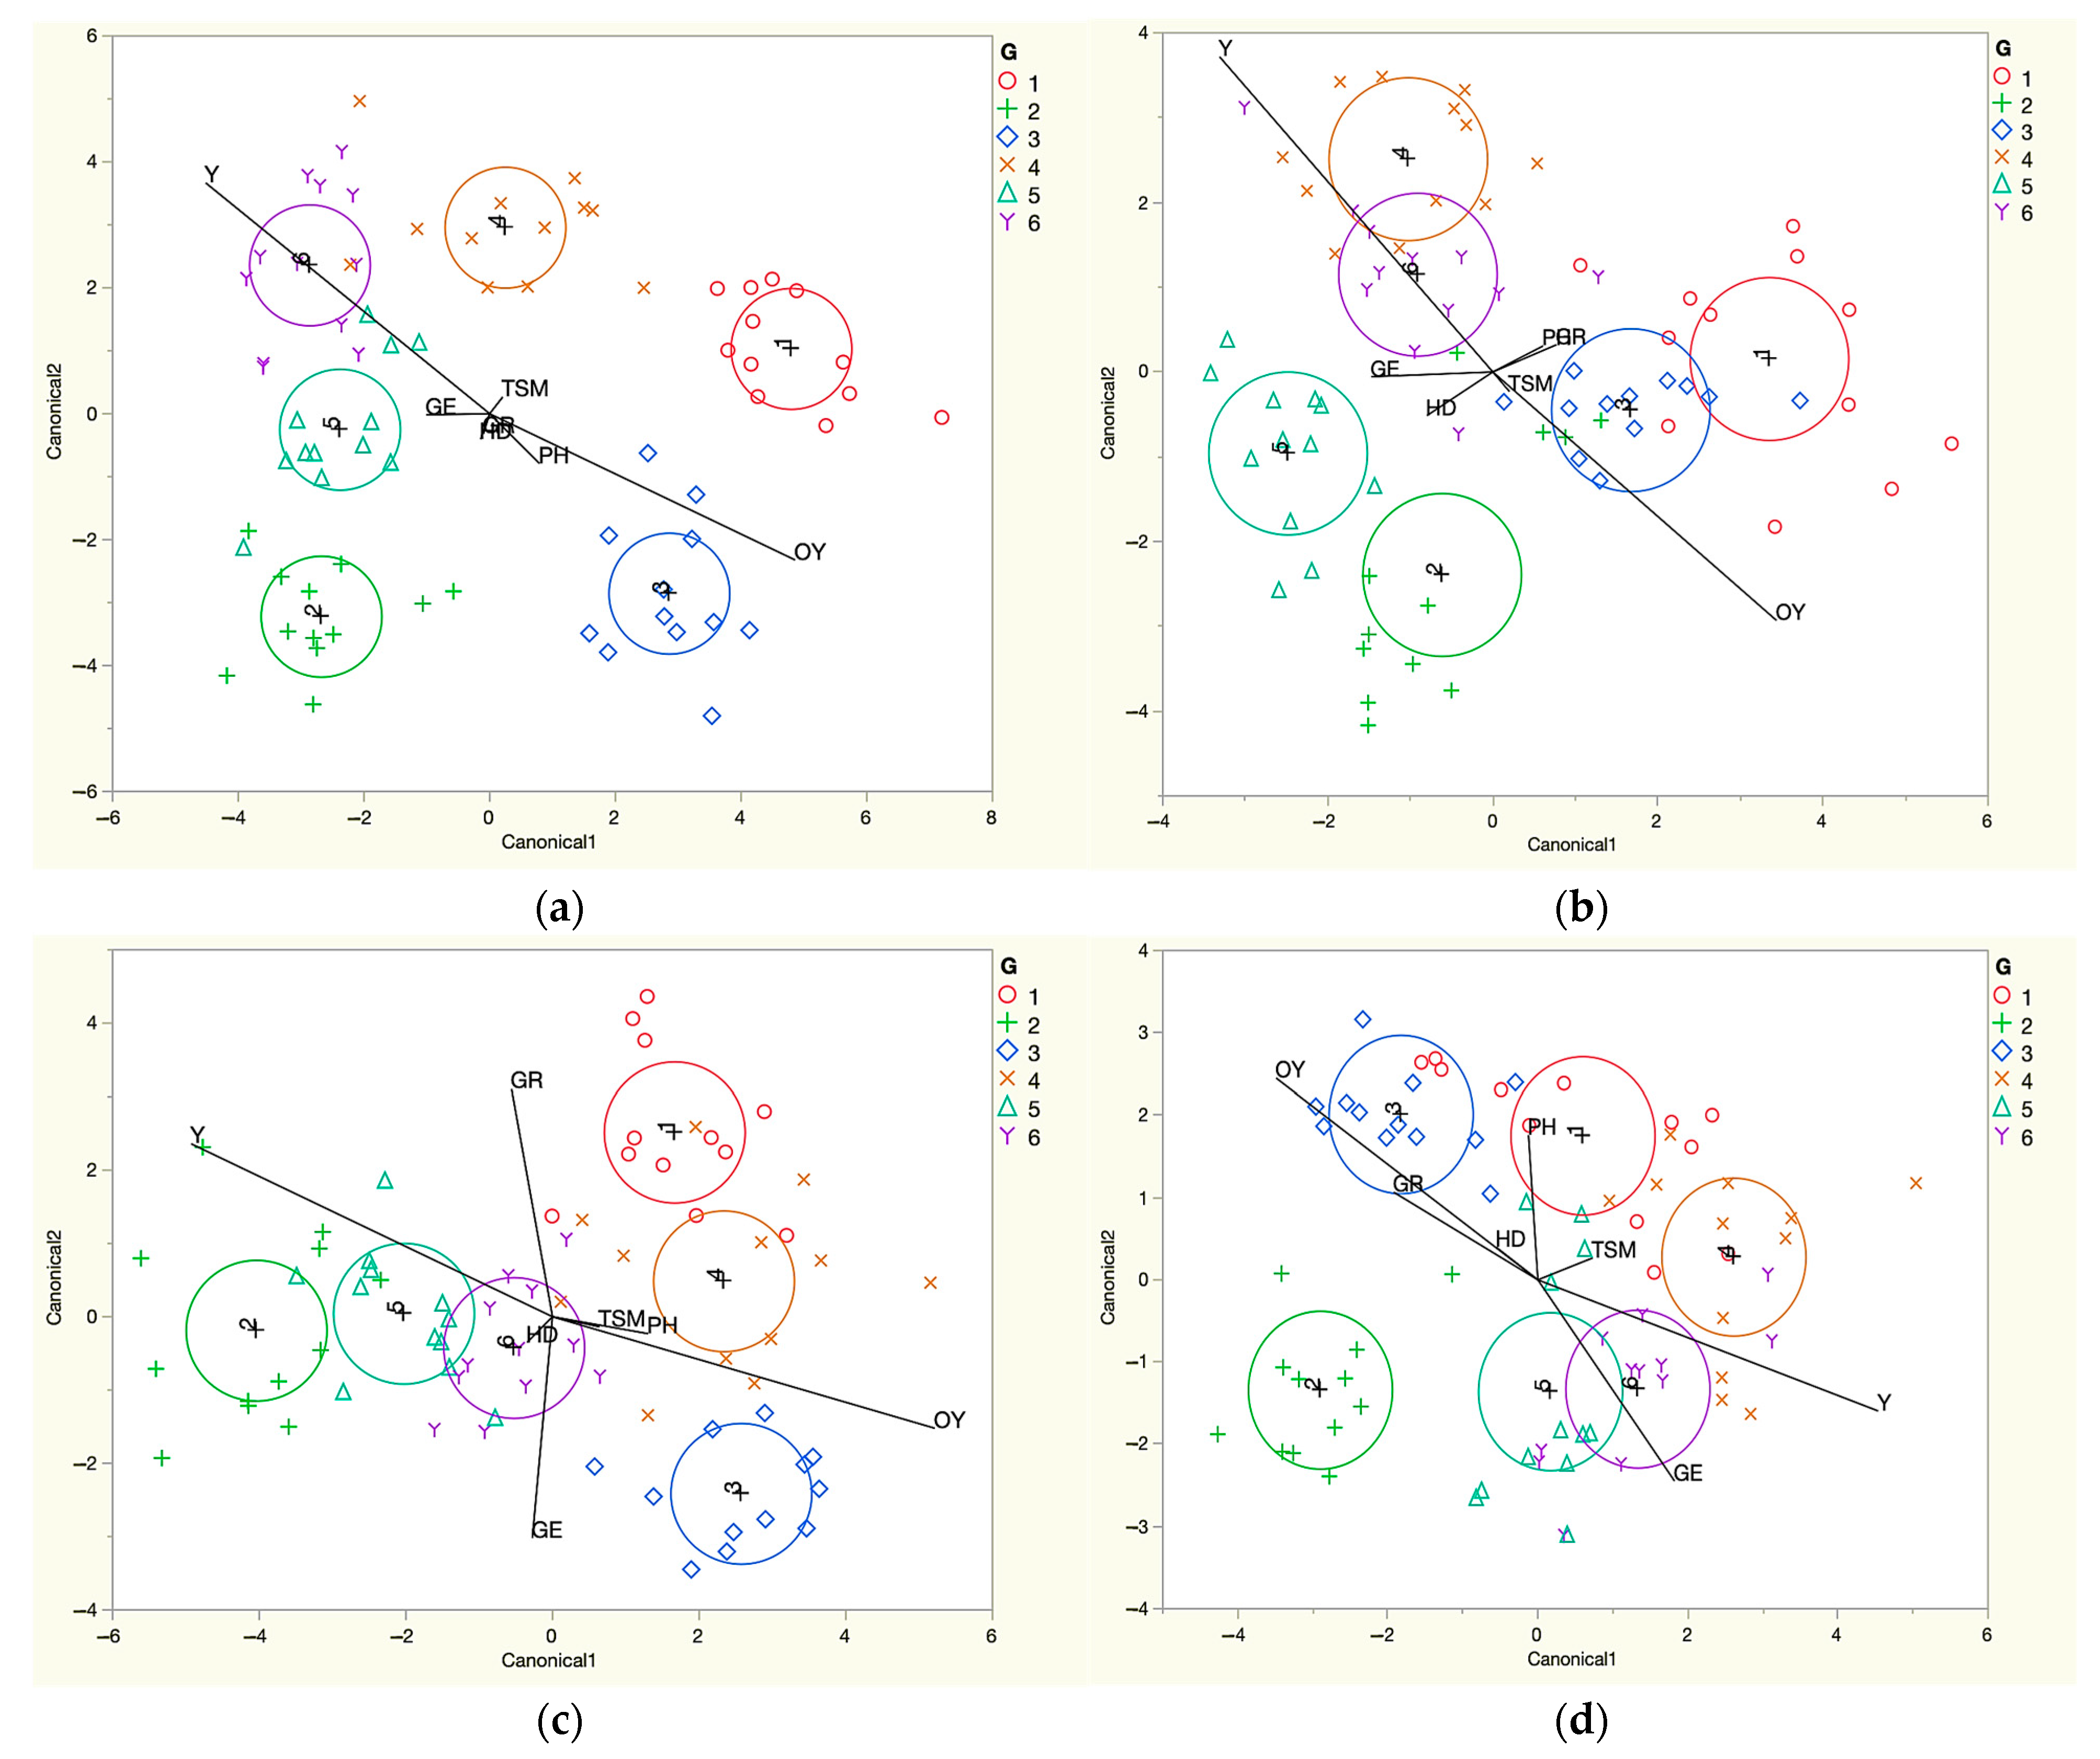
3.4. Interpretation of the Interaction between Genotype and Sowing Date through Linear Discriminant Analysis (LDA)

To identify genotypes ideal for production, researchers must evaluate a wide range of genotypes under varying environmental conditions over multiple years due to the differential responses of genotypes to environmental conditions and genotype–environment interactions [60]. Linear discriminant analysis allows for the construction of linear combinations of independent variables in such a way that the misclassification error is minimized, as outlined by Babić and Babić [67]. The authors note that the first three Discriminant Functions (DFs) collectively encompass 100% of the variance, indicating that the smallest misclassification error occurs when the dataset is divided into four groups. Table 4 illustrates that the overall variability among Gs at all SDs can be described using five DFs. Based on the F-test, it was determined that the variance (eigenvalue) is statistically significant for the first four DFs during the SD1. The first DF accounts for 51.02% of the variability, and with the addition of the other DFs, this value increases to 84.17%, 94.97%, and 99.85%. Similarly, for SD2, SD3, and SD4, four DFs also exhibit statistically significant influence, albeit with slightly different relationships among the DFs. Statistically significant values of Wilk’s lambda (WL), Pillai’s trace (PT), Hotelling–Lawley (HL), and Roy’s max root (RMR) indicate that G groups have significantly diverged in all four cases, meaning that the means of G groups significantly differed in all SDs. Statistically significant WL and PT values revealed differences in the physical attributes of sunflower genotypes, as noted by Çetin et al. [7]. The authors also emphasize that the effect size of the function depends on the square of the canonical correlation value.
Insight into Table 5 shows absolute values of standardized coefficients (AVSK), which indicate the influence of dependent variables on DFs. With the assistance of AVSK, we analyzed the dependent variables (examined traits) that had the greatest impact on the variability of sunflower Gs across different SDs (highlighted in green). It was noted that Y and OY were the most significant parameters affecting G variability. Additionally, GE and GR were important parameters in differentiating Gs, although not primarily in the first DF, across all SDs. In their research, Krstić et al. [68] also stated that seed yield was statistically the most significant parameter influencing genotype variability, with the linoleic-type inbred lines achieving a higher yield than the herbicide-tolerant inbred lines.
LDA can be visualized through a biplot graph representing dimensions that maximize the separation among genotypes, as emphasized by Farcuh et al. [35]. In Figure 2, based on the length of vectors (dependent variables) in the biplots for the four SDs, it can be seen that the most substantial influence on the first and second DFs aligns with the AVSK values from Table 5. Notably, G4, G5, and G6 formed clusters closest to Y for the first, second, and fourth SDs (Figure 2a,b,d). In the SD2, G4 and G6 formed one cluster, while G3 and G1 constituted another cluster (Figure 2b). Genotypic cluster G4 was closer to Y in the third sowing date (Figure 2c). G5 and G6 grouped together in the third and last sowing dates. Genotypes G1 and G3 were consistently closest to Y across all SDs. In addition to Y and OY, GE and GR significantly influenced G separation into groups in the third sowing date (Figure 2c). Besides Y and OY, GE also played a significant role in separating G into groups in the last sowing date (Figure 2d), thereby confirming the AVSK values. Based on the angles formed by the vectors in the LDA biplots relative to each other, it is evident that Y and OY were negatively correlated in all four SDs, contrary to the findings of Markulj-Kulundžić et al. [21], who reported a positive correlation between these two parameters. In the first, second, and fourth SDs (Figure 2a,b,d), Y was positively correlated with GE, while a positive correlation was found between Y and GR in SD3 (Figure 2c). Oil yield was positively correlated with PH in the first, third, and fourth SDs (Figure 2a,c,d), except for SD2, where a positive correlation was detected between OY and TSM (Figure 2b). By examining the angles formed by the LDA biplot vectors, we also confirmed that a negative correlation existed between HD and TSM in SD1, which aligns with the findings of Škorić [56].
Considering the positions of the genotypes in the LDA biplot in terms of seed production parameters (GR, TSM, Y), the most optimal conditions for attaining the maximum TSM values were observed during SD1, with the exception of G4, which achieved the maximum TSM values during SD3. Seed yield, as a multifaceted parameter, demonstrated the most favorable conditions for achieving maximum values among G1, G2, and G5 during SD3, whereas the maximum TSM values of G3, G4, and G6 were observed during both SD2 and SD1. The most conducive conditions for maximum seed quality of G3, G4, G5, and G6 were evident during SD2, while they were evident slightly later (SD3) for the earliest genotype G1, and during the earliest sowing date (SD1) for G2. Increasing the adaptability of plant species through breeding (new genotypes, wild relatives), agronomic practices (sowing time, planting density), and shifting towards cultivation in different regions can partially mitigate the negative impact of climate change [69,70,71,72]. The results emphasize the importance of sunflower adaptability through variations in sowing dates, i.e., changing production conditions, and highlight the need for a careful approach in choosing the sowing time suitable for a specific genotype, in accordance with specific weather conditions and sustainable production goals. According to Riveira et al. [73], descriptive multivariate analyses showed that a later sowing date resulted in increased seed germination and faster seed dormancy release during storage in all genotypes. The results of the previous authors suggest that the sowing date can be managed to obtain higher seed germination and faster seed dormancy release in sunflower production. Crnobarac et al. [46] also reported that, on average, the highest seed yield was obtained when sowing was carried out at the end of April and the beginning of May. The same author states that short-vegetation hybrids, on average, achieved the highest seed yield during sowing in mid-May, which is consistent with this study, where G1 achieved the best Y by sowing in the same period.

3.5. The Influence of Weather Conditions during Critical Growth Phases of Sunflowers on Measured Parameters of Seed Production Depending on Sowing Dates

Understanding sunflowers’ response to extreme climatic conditions is one of the key objectives in the breeding and development of more adaptable sunflower genotypes, as well as the implementation of environmental adaptation measures [74]. Genotype adaptability to sowing dates may vary depending on the annual conditions, with different effects on the examined parameters. Determining the critical periods is of high importance for production planning and modeling sunflower yields to optimize crop utilization by utilizing favorable climatic conditions during the growing season [75]. A Visual Mixed Model (VMM) was employed so as to ensure the impact of climate conditions during the critical sunflower phenophases and to gain a more precise understanding of genotype–sowing date interactions. Also, we conducted a one-factor ANOVA to examine the impact of GS on the parameters of seed production. ANOVA results confirmed the influence of GS on the parameters of seed production (F = 18.005, p < 0.01 for GR; F = 4.505, p < 0.05 for TSM; F = 3.190, p < 0.05 for Y). The average values of the measured parameters are represented by the black bold line on average for all growing seasons, depending on the sowing date, weather conditions during the critical phenophases, and their duration.

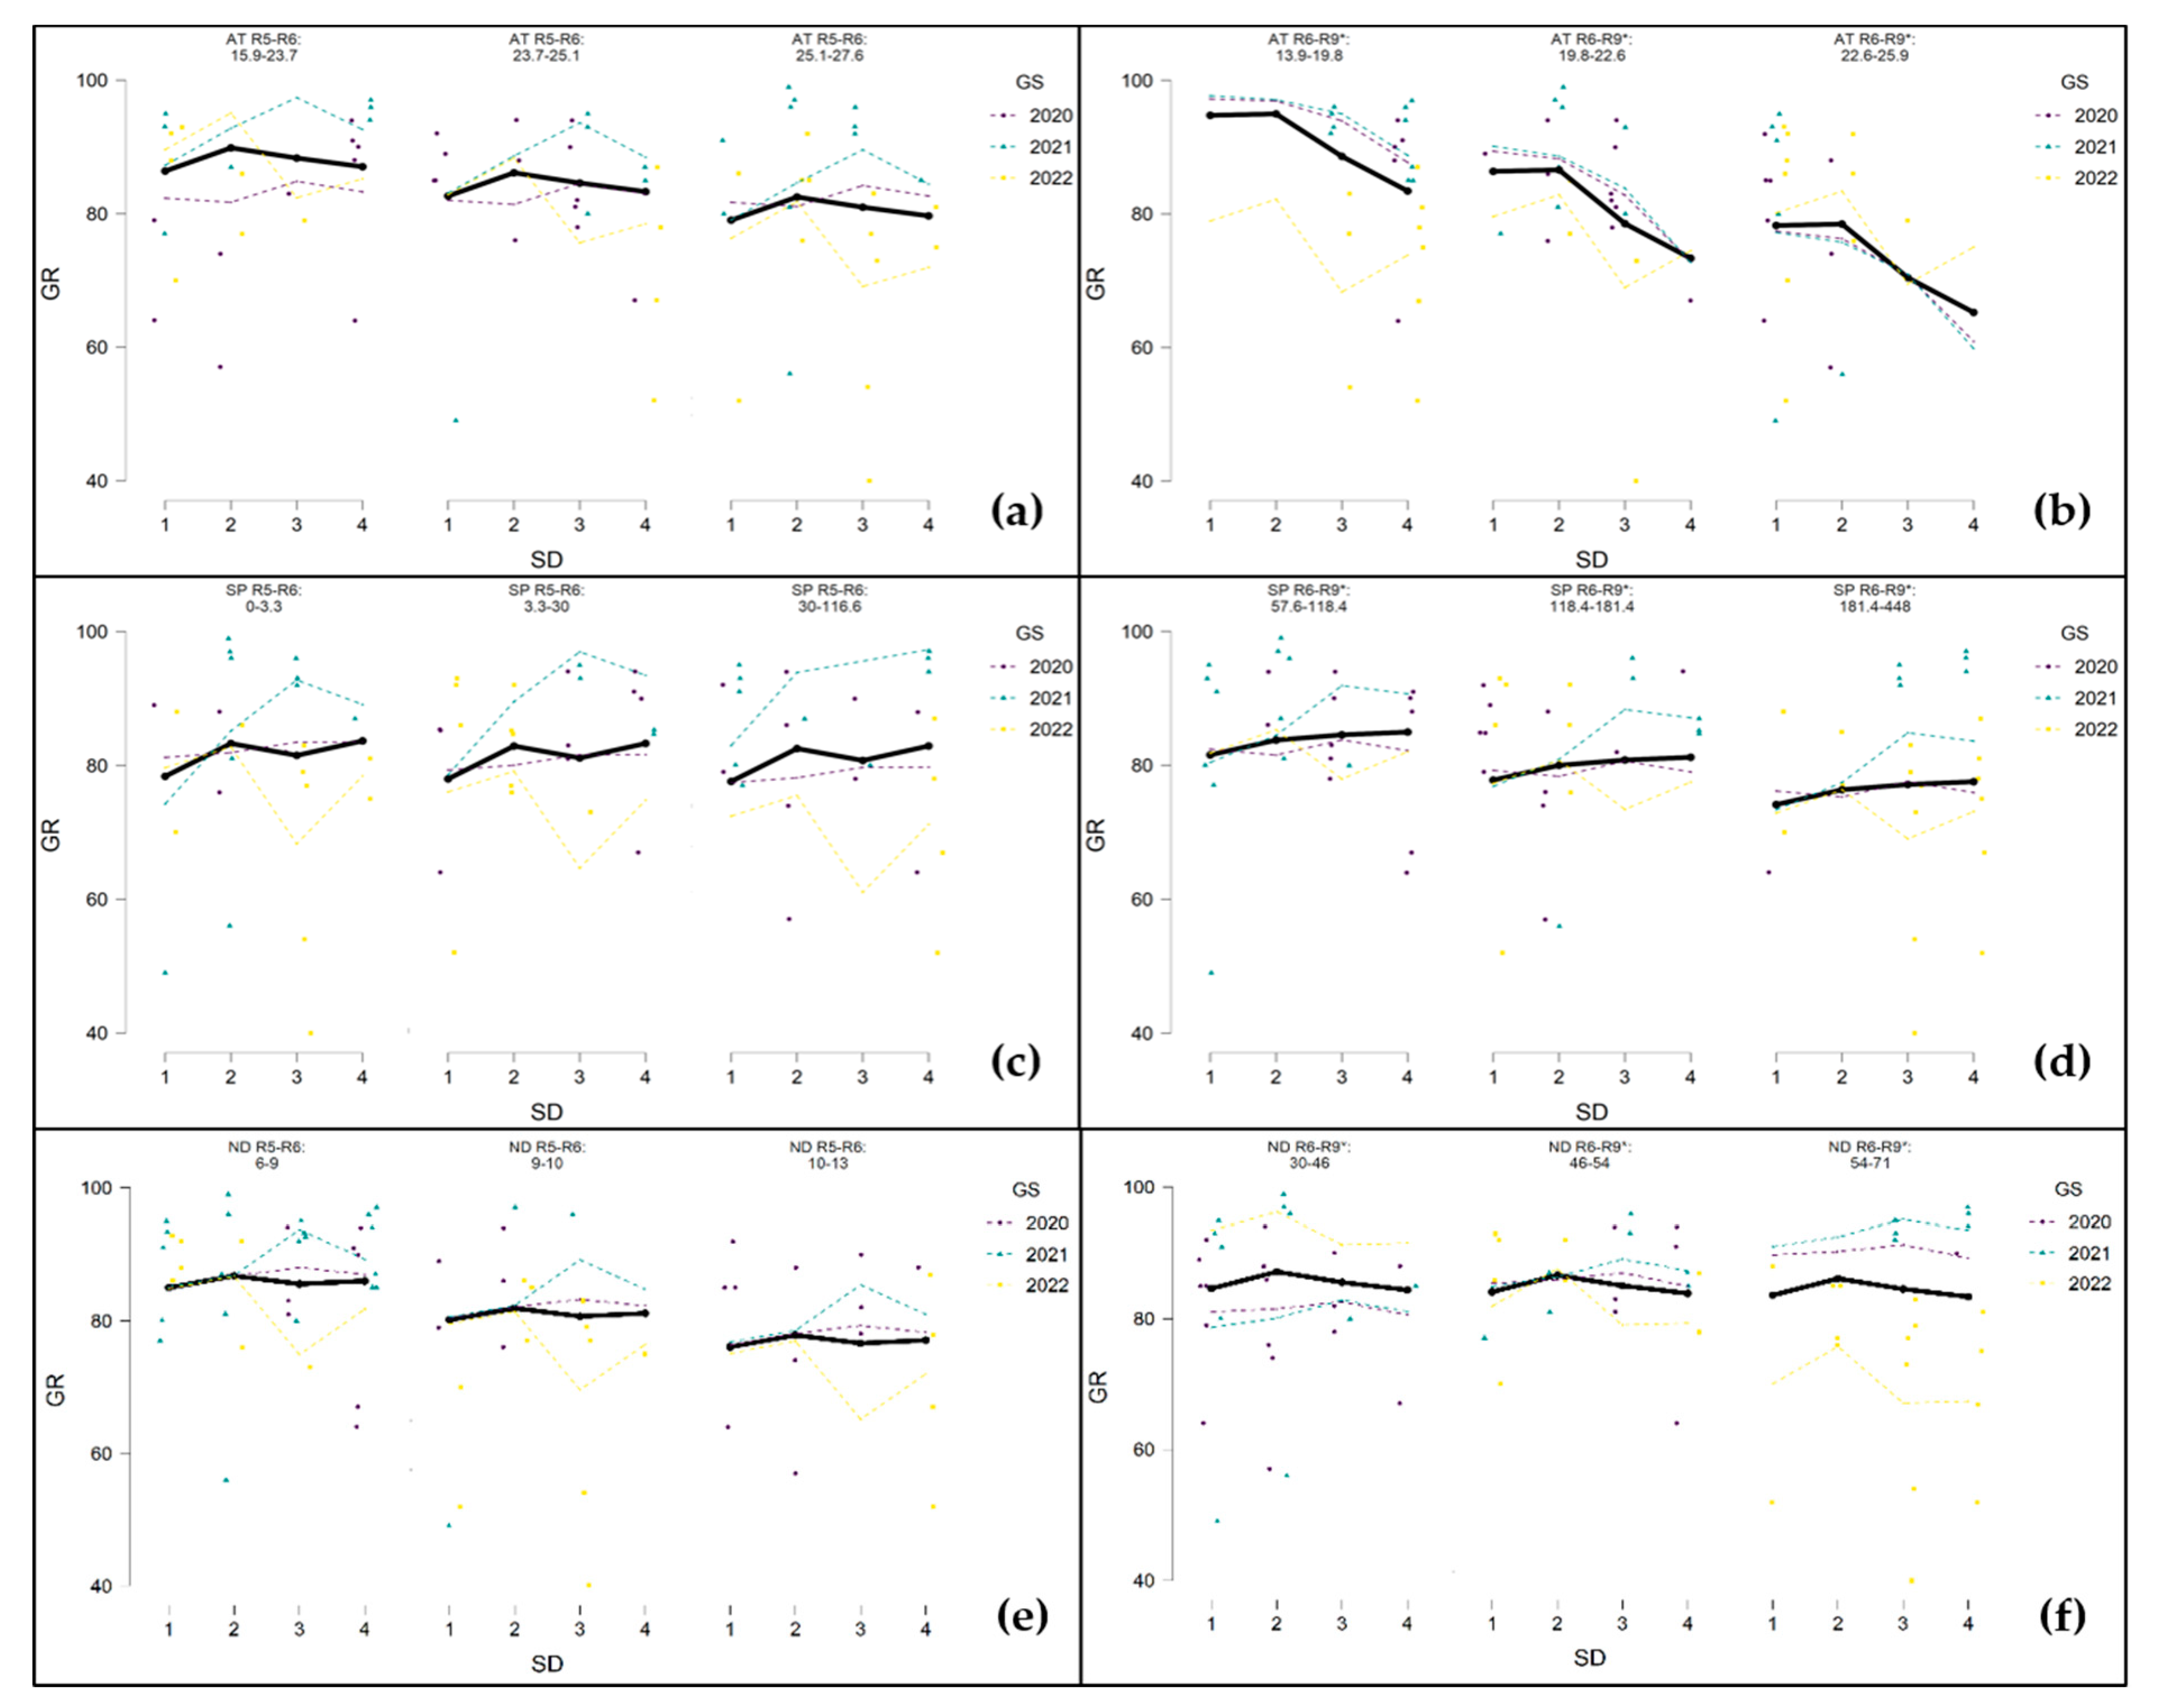
3.5.1. Germination (GR)

Climate change affects plant production, thereby impacting the vitality (germination) of produced seeds [65,76]. Increased average daily temperatures during flowering (over 23.7 °C) and seed filling (over 19.8 °C) negatively affected germination (Figure 3). Precipitation did not have an impact during the critical sunflower phases. Furthermore, a longer flowering period (flowering period over 10 days) was associated with lower germination, suggesting that prolonged exposure to stress during the flowering phase results in reduced germination of produced seeds. However, this phenomenon was not confirmed during seed filling. Similar results to the LDA biplot were analyzed by VMM, confirming that the optimal conditions for achieving maximum germination rates were attained during the second sowing date.

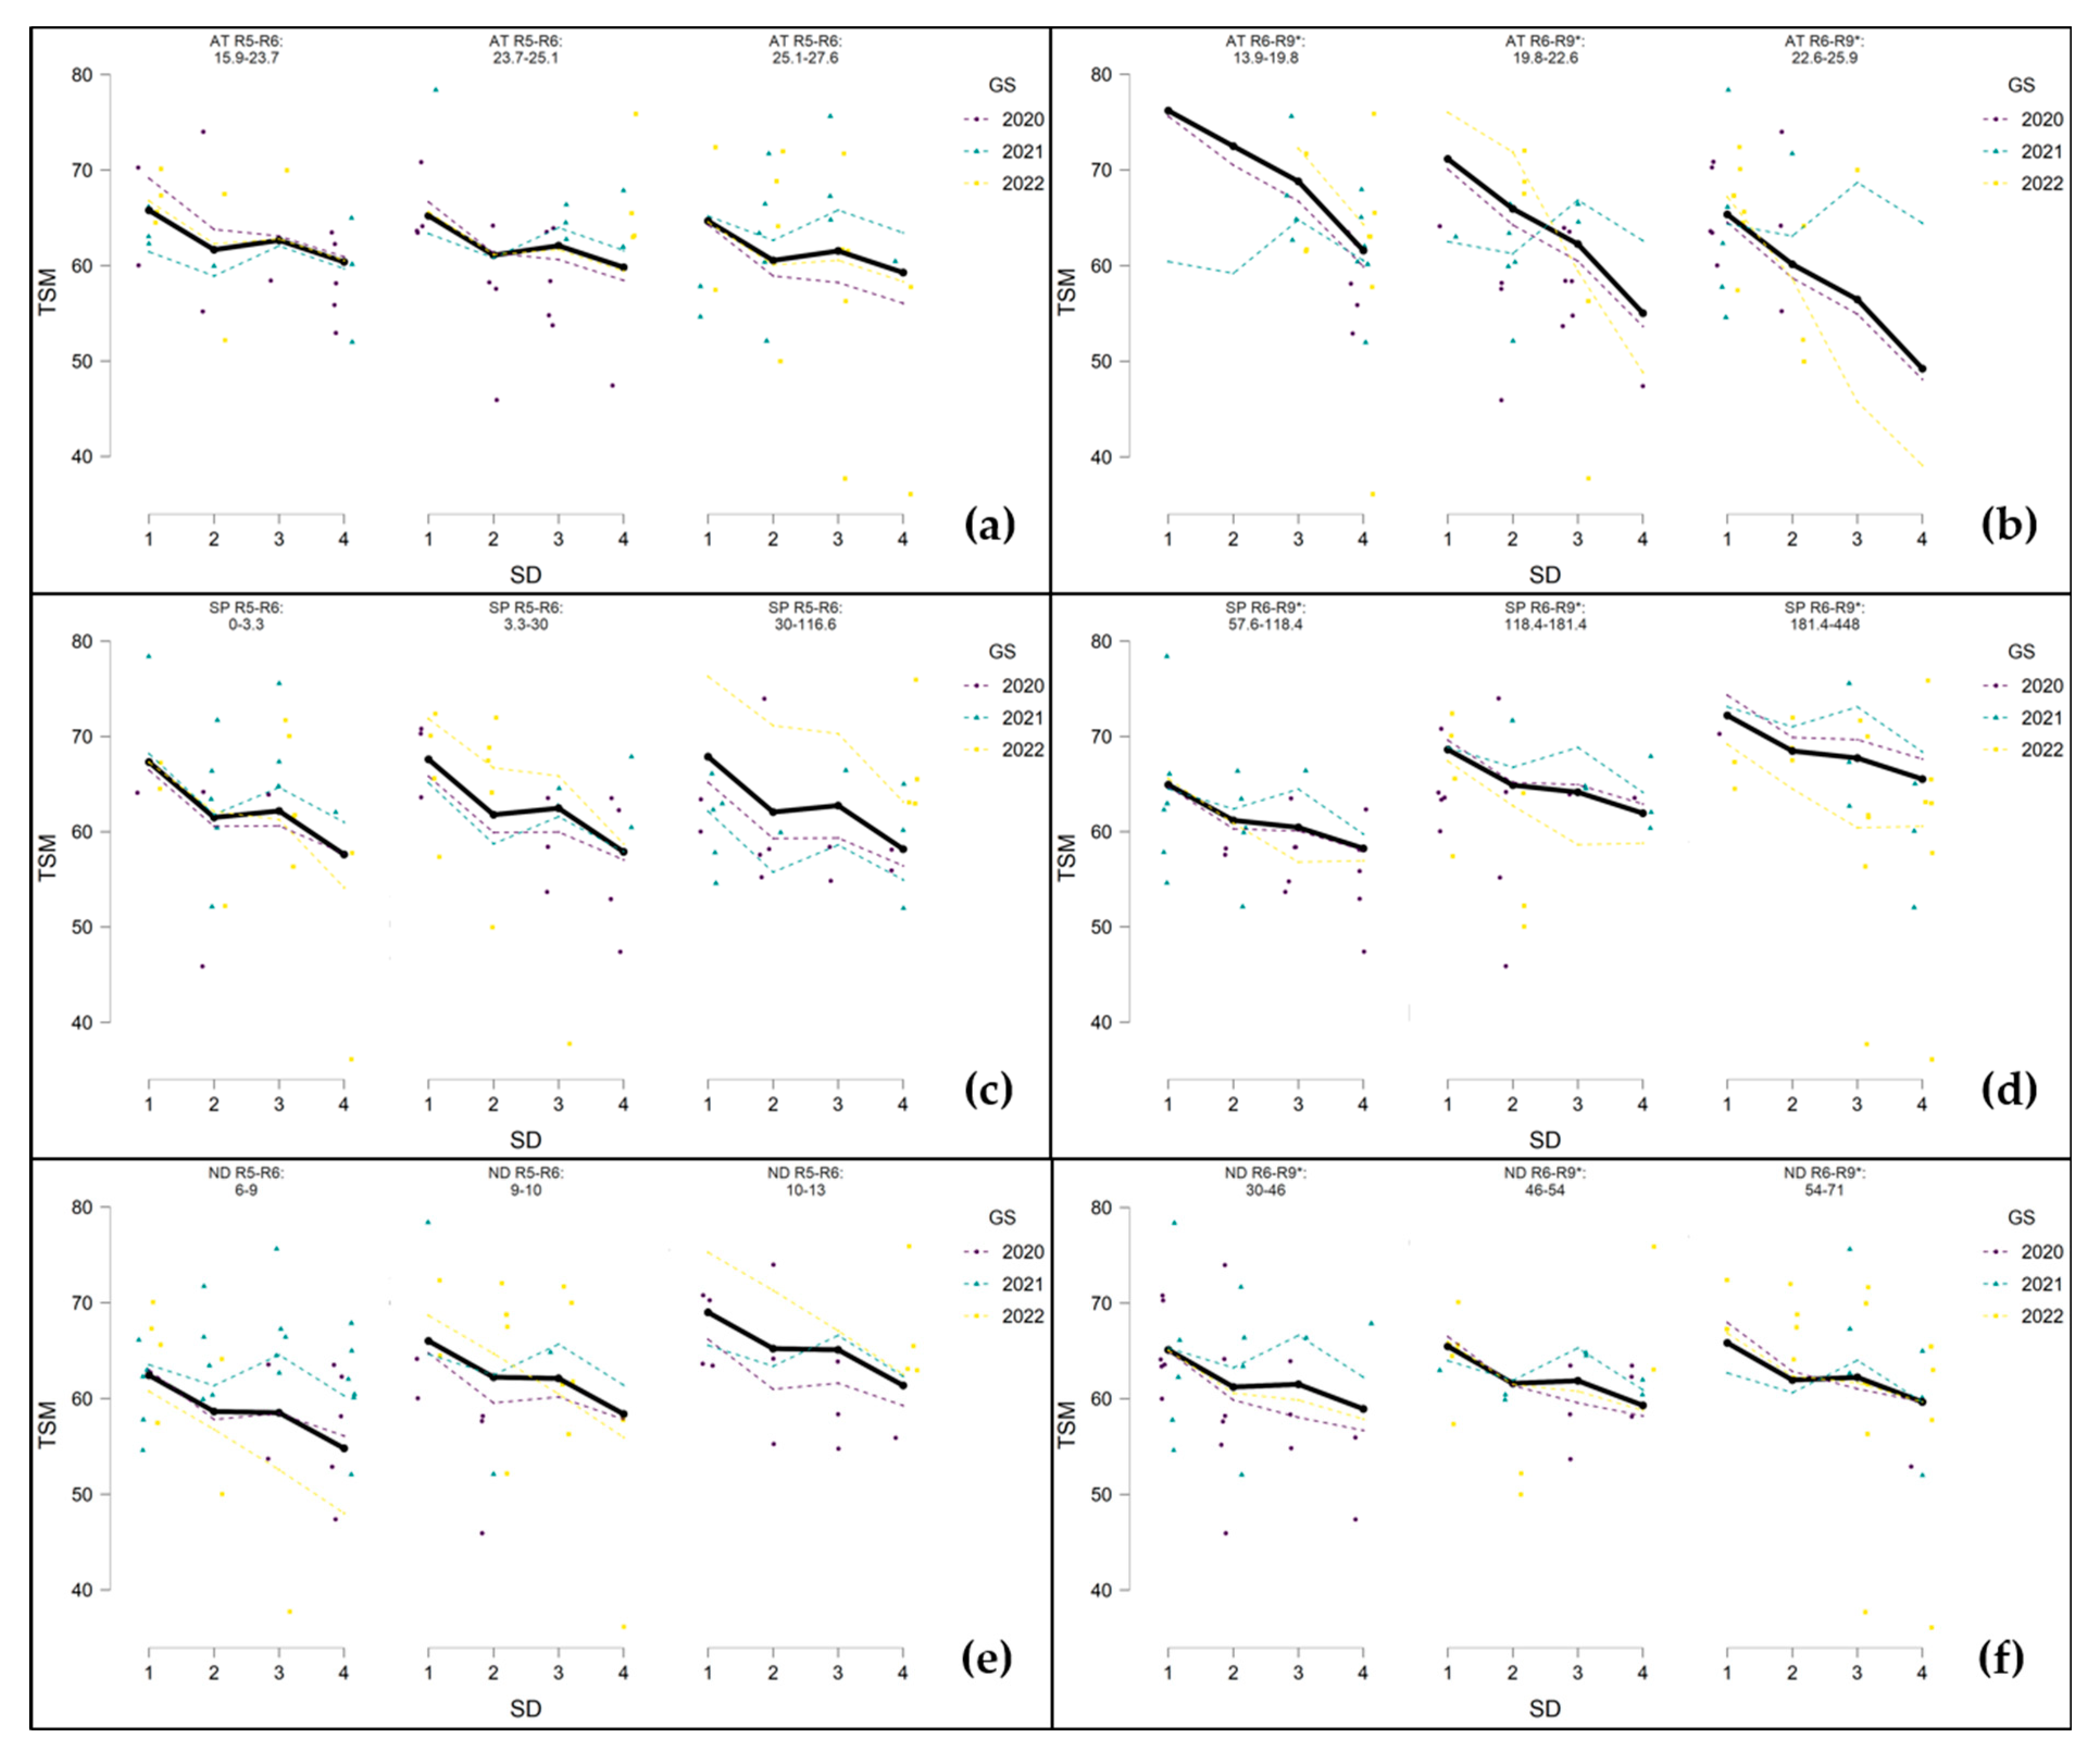
3.5.2. 1000-Seed Mass (TSM)

1000-seed mass is of great importance for sunflower germination [17]. Unfavorable weather conditions during seed filling can lead to differences in seed size and consequently, 1000-seed mass [77,78]. However, Krstić et al. [42] emphasized that the genotype significantly influences the variation in 1000-seed mass. Average daily temperatures and precipitation during flowering did not affect TSM. Notably, an increase in average daily temperatures during seed filling led to a decrease in TSM (19.8 °C), whereas increased precipitation during this critical phase resulted in an increase in the measured parameter (181 mm). The duration of the flowering period had an impact on the variability of TSM during flowering, but not during seed filling. A longer flowering period (over 10 days) was associated with a higher TSM. On average, optimal conditions for achieving maximum TSM values were attained during the first sowing date, with a decrease observed in later sowings (Figure 4).

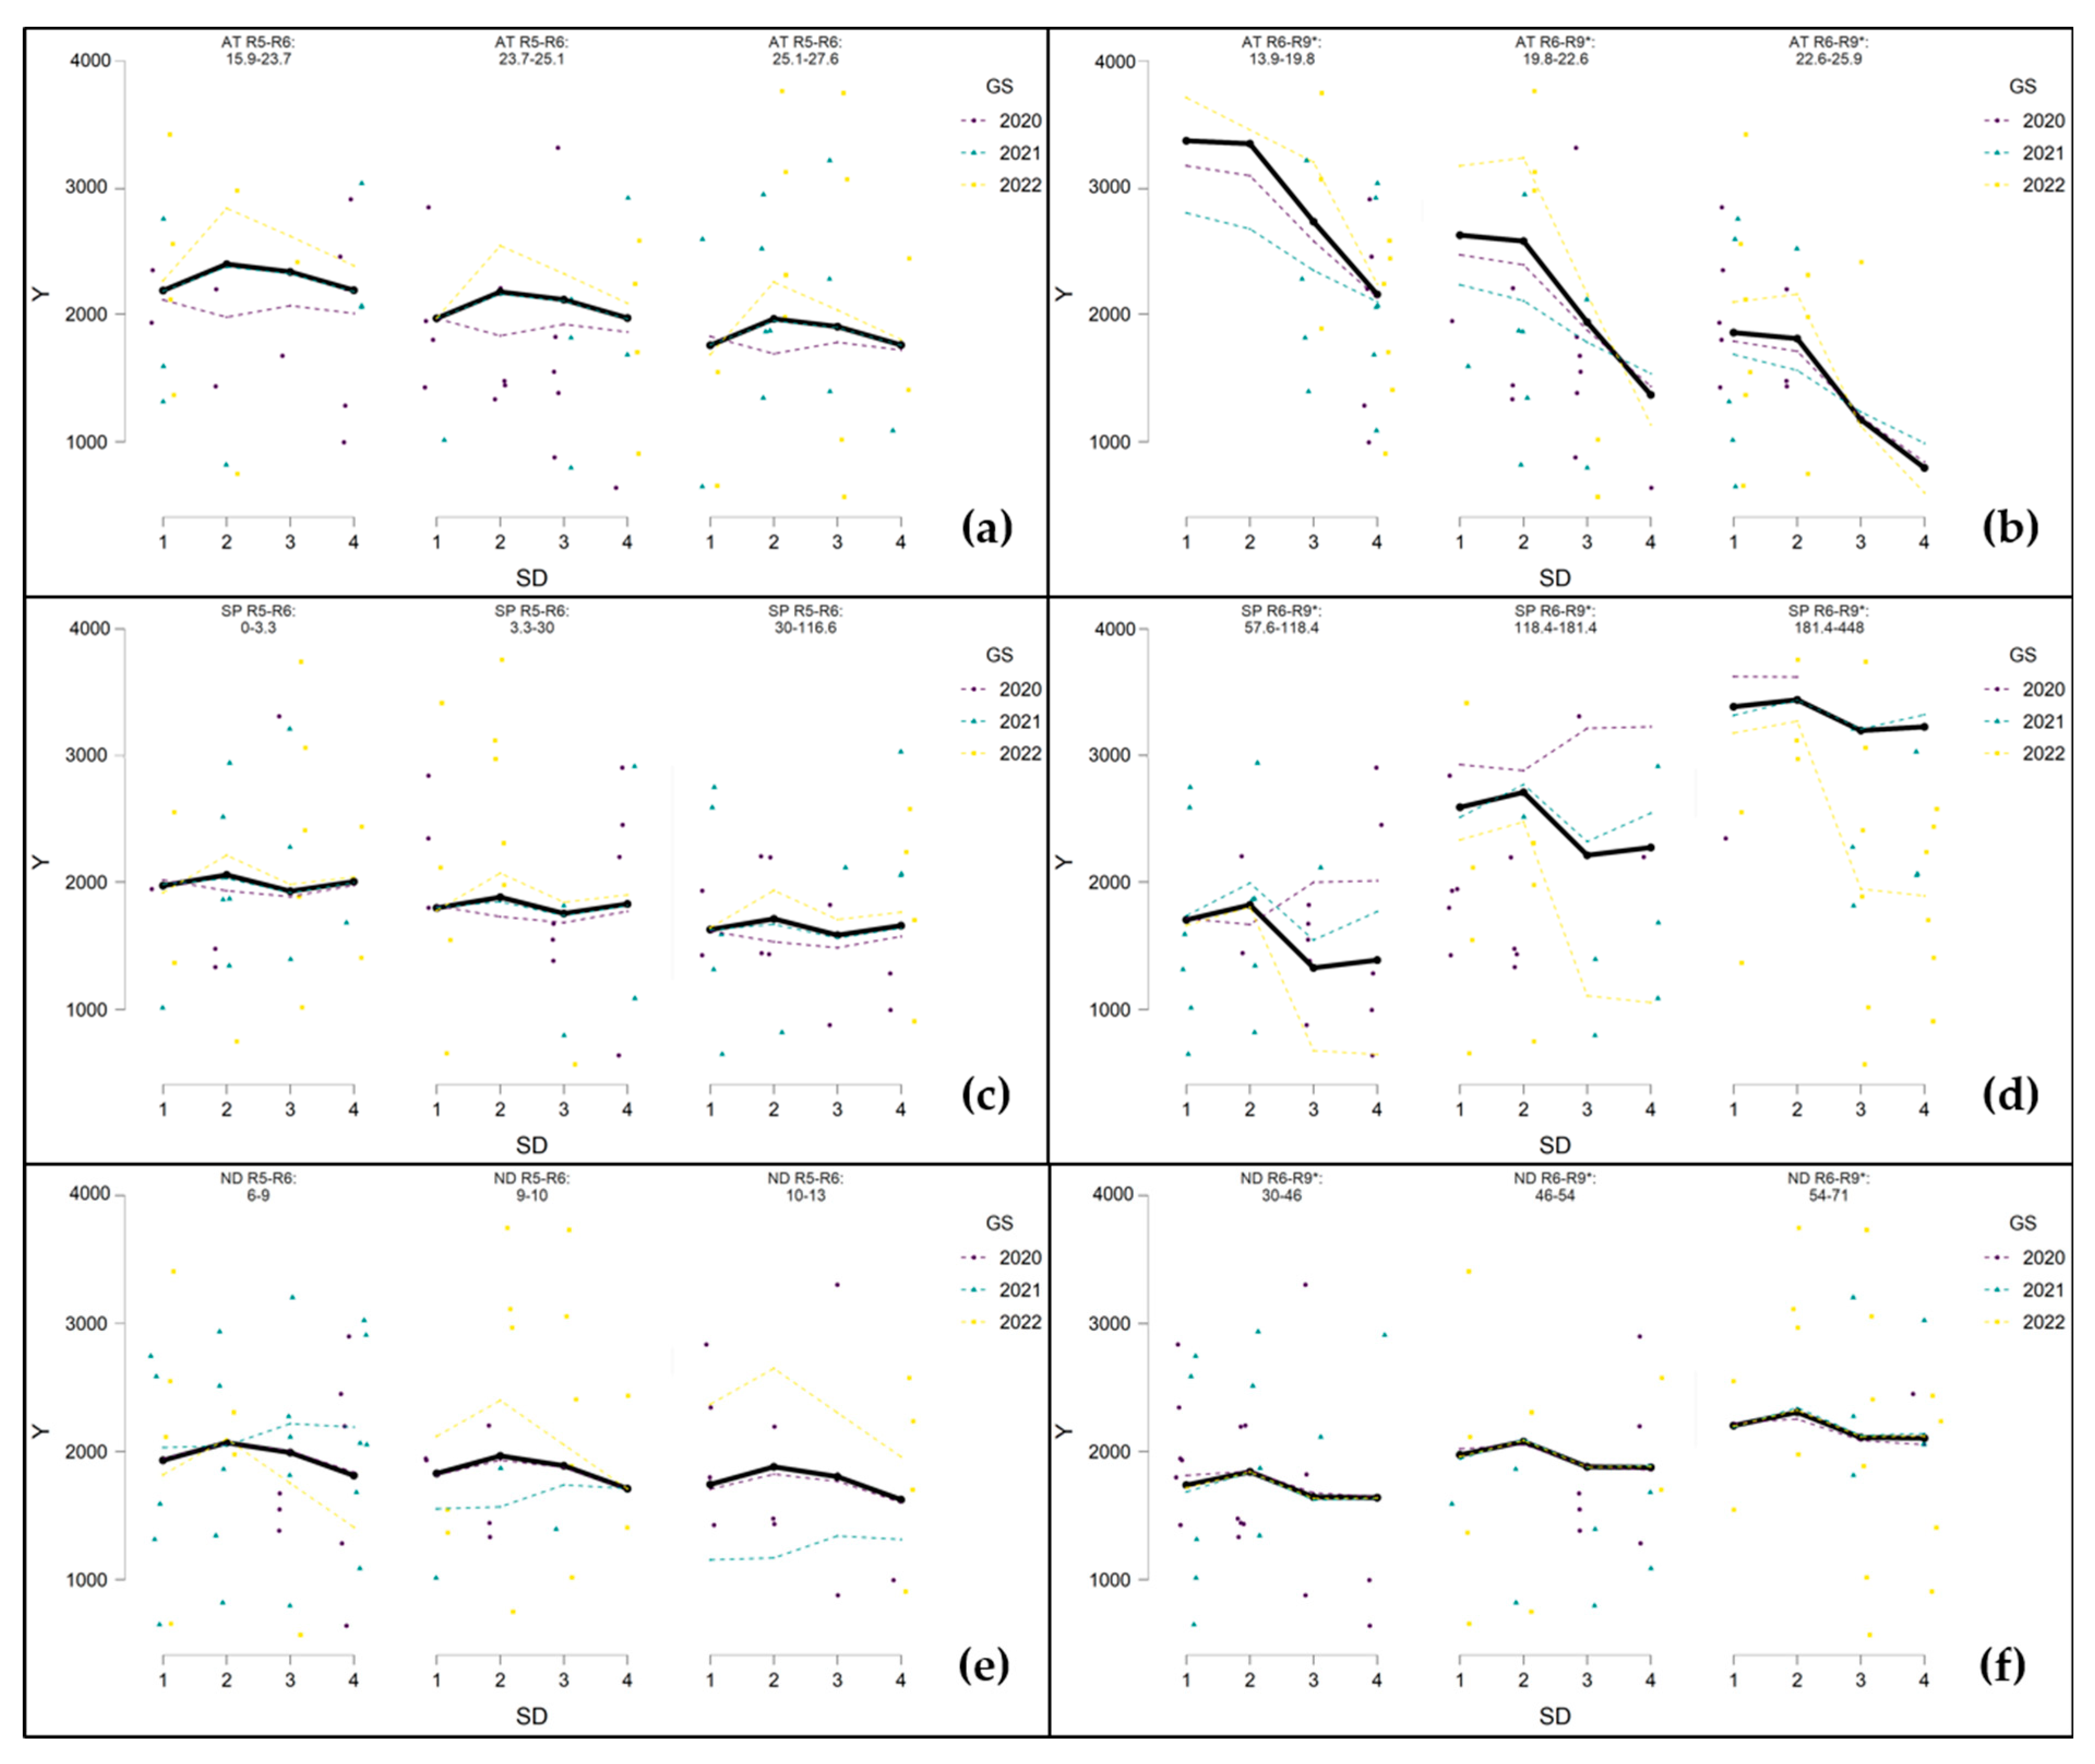
3.5.3. Seed Yield (Y)

The effects of drought stress on sunflower productivity [15] were not uniform across all growth phases. The timing of flowering and seed filling in sunflower production is critical for the development of strategies for successful crop adaptation to climate change [50,79,80], and the number of days in the growing season [81]. Increased average daily temperatures during flowering (over 23.7 °C) and seed filling (over 19.8 °C) led to a reduction in seed yields across all sowing dates (Figure 5). Conversely, increased precipitation during flowering (over 30 mm) had a negative impact on seed yield, possibly affecting bee activity and, consequently, the success of pollination [14]. However, seed yield also increased with increased precipitation during seed filling (over 181 mm). The duration of the flowering period did not influence the seed yield, but the length of seed filling did, with a positive effect of increased seed filling duration (over 46 days) on seed yield. Average daily temperatures and soil moisture levels during seed filling are crucial in seed yield formation [81,82]. Increased precipitation during the seed-filling phase leads to higher seed yields [77]. Exposure to a deficit of precipitation during flowering (leading to pollen vitality loss) and seed filling, the most critical phases, results in reduced sunflower yield by up to 50%, as well as decreasing seed quality [58,83,84,85], as confirmed by the findings of this study. On average, the optimal conditions for achieving maximum seed yields were attained when sowing was conducted on the second sowing date.
One of the most critical factors for sunflower yield stability is sufficient precipitation during the critical period of seed filling [86]. Under the assumption that extreme droughts will become more frequent, it is expected that the number of days from sowing to flowering and from sowing to maturity will significantly decrease in the future, due to the anticipated higher air temperatures and the cumulative effect of temperatures in years such as 2022. Understanding these relationships can assist agricultural producers and seed producers in optimizing the production process, achieving high yields, and obtaining high-quality seeds, which is the goal of every seed production.

4. Conclusions

Climate change significantly impacts cultivated crops, disrupting yield stability and the quality of produced seeds. Adapting sunflower cultivation to climate variations is crucial for successful sunflower growth in Europe. Our findings demonstrate that both the sowing time and genotype significantly affected the measured parameters across all years of the study, as confirmed by ANOVA results. Morphological traits (HD and PH) partially increased with the postponement of the sowing date. VMM showed that shifting the optimal sowing date (mid-April) to early May allows for a reduced number of days plants spend in critical phases. Plants are thereby enabled to avoid stressful conditions during pollination and seed filling. The findings resulted, on average, in increased Y, OY, and improved seed quality (GE and GR), which is the main goal of seed production. On the other hand, increased 1000-seed weight was not observed. High temperatures during the critical sunflower growth stages negatively affected the examined parameters of seed production (GR, TSM, and Y). Conversely, increased precipitation during seed filling led to increased TSM and Y. A longer flowering period led to decreased GR, suggesting that prolonged stress during this period may negatively impact GR, while a longer seed-filling period led to increased TSM and Y. The obtained results of the research open the possibility of further research and the development of stress-resistant sunflower genotypes. The main future breeding goal will be to create genotypes with a shorter flowering period, and an extended seed-filling period, which respond to climate change better.

Author Contributions

Conceptualization, M.K. and V.M. (Velimir Mladenov); methodology, V.M. (Velimir Mladenov), S.J., V.M. (Vladimir Miklič) and J.O.; software, M.K., D.D. and N.Ć.; validation, M.K., V.M. (Velimir Mladenov), B.B. (Borislav Banjac) and J.O.; formal analysis, M.K., B.B. (Brankica Babec), D.D., N.Ć. and S.G.; investigation, M.K.; resources, S.C., S.J., V.M. (Vladimir Miklič) and J.O.; data curation, M.K. and D.D.; writing—original draft preparation, M.K.; writing—review and editing, V.M. (Velimir Mladenov), B.B. (Borislav Banjac), B.B. (Brankica Babec), S.G. and J.O.; visualization, M.K., B.B. (Brankica Babec), D.D. and S.G.; supervision, V.M. (Velimir Mladenov) and J.O.; project administration, V.M. (Vladimir Miklič) and J.O.; funding acquisition, V.M. (Velimir Mladenov) and S.C. All authors have read and agreed to the published version of the manuscript.

Funding

This research was supported by the Ministry of Science, Technological Development and Innovation of the Republic of Serbia (grants no. 451-03-68/2020-14/200032, 451-03-9/2021-14/200032, 451-03-68/2022-14/200032 and 451-03-47/2023-01/200032), the Science Fund of the Republic of Serbia (SmartSun project, IDEJE, no. 7732457), and the European Commission (Twinning Western Balkans project CROPINNO, grant no. 101059784).

Data Availability Statement

Data are contained within the article.

Acknowledgments

The work was carried out within the Center of Excellence for Innovations in Breeding of Cli-mate-Resilient Crops—ClimateCrops, at the Institute of Field and Vegetable Crops, National Institute of the Republic of Serbia. The authors would like to thank Sonja Đukić for the help with correction of English grammar and language of the manuscript.

Conflicts of Interest

The authors declare no conflict of interest.

References

  1. Mimić, G.; Živaljević, B.; Blagojević, D.; Pejak, B.; Brdar, S. Quantifying the effects of drought using the crop moisture stress as an indicator of maize and sunflower yield reduction in Serbia. Atmosphere 2022, 13, 1880. [Google Scholar] [CrossRef]
  2. IPCC. Summary for policymakers. In Climate Change 2021: The Physical Science Basis; Contribution of Working Group I to the Sixth Assessment Report of the Intergovernmental Panel on Climate Change; Masson-Delmotte, V., Zhai, P., Pirani, A., Connors, S.L., Péan, C., Berger, S., Caud, N., Chen, Y., Goldfarb, L., Gomis, M.I., et al., Eds.; Cambridge University Press: Cambridge, UK; New York, NY, USA, 2021; pp. 3–32. [Google Scholar] [CrossRef]
  3. Gomes, S.E.V.; Gomes, R.A.; Dantas, B.F. Climate and seed size of a dry forest species: Influence on seed production, physiological quality, and tolerance to abiotic stresses. J. Seed Sci. 2023, 45, e202345013. [Google Scholar] [CrossRef]
  4. Noroozi, N.; Mohammadi, G.; Ghobadi, M. Some physio-biochemical traits of sunflower (Helianthus annuus L.) as affected by arbuscular mycorrhizal fungi inoculation under different irrigation treatments. Ital. J. Agron. 2023, 18, 2033. [Google Scholar] [CrossRef]
  5. Tariq, M.; Ahmad, S.; Fahad, S.; Abbas, G.; Hussain, S.; Fatima, Z.; Nasim, W.; Mubeen, M.; Habib ur Rehman, M.; Khan, M.A.; et al. The impact of climate warming and crop management on phenology of sunflower-based cropping systems in Punjab, Pakistan. Agric. For. Meteorol. 2018, 256–257, 270–282. [Google Scholar] [CrossRef]
  6. Miladinović, D.; Hladni, N.; Radanović, A.; Jocić, S.; Cvejić, S. Sunflower and climate change: Possibilities of adaptation through breeding and genomic selection. In Genomic Designing of Climate-Smart Oilseed Crops; Kole, C., Ed.; Springer International Publishing: Cham, Switzerland, 2019; pp. 173–238. [Google Scholar]
  7. Çetin, N.; Karaman, K.; Beyzi, E.; Sağlam, C.; Demirel, B. Comparative evaluation of some quality characteristics of sunflower oilseeds (Helianthus annuus L.) through machine learning classifiers. Food Anal. Methods 2021, 14, 1666–1681. [Google Scholar] [CrossRef]
  8. Badouin, H.; Gouzy, J.; Grassa, C.J.; Murat, F.; Staton, S.E.; Cottret, L.; Lelandais-Brière, C.; Owens, G.L.; Carrère, S.; Mayjonade, B.; et al. The sunflower genome provides insights into oil metabolism, flowering and asterid evolution. Nature 2017, 546, 148–152. [Google Scholar] [CrossRef] [PubMed]
  9. Radanović, A.; Miladinović, D.; Cvejić, S.; Jocković, M.; Jocić, S. Sunflower genetics from ancestors to modern hybrids—A review. Genes 2018, 9, 528. [Google Scholar] [CrossRef]
  10. Debaeke, P.; Casadebaig, P.; Langlade, N. New challenges for sunflower ideotyping in changing environments and more ecological cropping systems. OCL 2021, 28, 29. [Google Scholar] [CrossRef]
  11. Babec, B.; Šeremešić, S.; Hladni, N.; Ćuk, N.; Stanisavljević, D.; Rajković, M. Potential of sunflower—Legume intercropping: A way forward in sustainable production of sunflower in temperate climatic conditions. Agronomy 2021, 11, 2381. [Google Scholar] [CrossRef]
  12. Donatelli, M.; Srivastava, A.K.; Duveiller, G.; Niemeyer, S.; Fumagalli, D. Climate change impact and potential adaptation strategies under alternate realizations of climate scenarios for three major crops in Europe. Environ. Res. Lett. 2015, 10, 075005. [Google Scholar] [CrossRef]
  13. Dimov, Z.; Cukaliev, O.; Mukaetov, D.; Tanaskovic, V. Sunflower and climate changes: Adaptation and mitigation potential from case study in RN Macedonia. In Proceedings of the 20th International Sunflower Conference, Novi Sad, Serbia, 20–23 June 2022. [Google Scholar]
  14. De Estrada, E.; Vázquez, M.; Moreno, D.; Bravo, S.; Amores, J.; San Román, G.; Dodds, J.; Bertero de Romano, A.; Bergada, P.; Sala, C. Sunflower seed production: Past, present, and perspectives. In Proceedings of the 18th International Sunflower Conference, Mar del Plata, Argentina, 27 February–1 March 2012. [Google Scholar]
  15. Hussain, M.; Farooq, S.; Hasan, W.; Ul-Allah, S.; Tanveer, M.; Farooq, M.; Nawaz, A. Drought stress in sunflower: Physiological effects and its management through breeding and agronomic alternatives. Agric. Water Manag. 2018, 201, 152–166. [Google Scholar] [CrossRef]
  16. El-Bially, M.E.; Saudy, H.S.; El-Metwally, I.M.; Shahin, M.G. Sunflower response to application of L-ascorbate under thermal stress associated with different sowing dates. Gesunde Pflanz. 2022, 74, 87–96. [Google Scholar] [CrossRef]
  17. Balalić, I.; Zorić, M.; Branković, G.; Terzić, S.; Crnobarac, J. Interpretation of hybrid× sowing date interaction for oil content and oil yield in sunflower. Field Crops Res. 2012, 137, 70–77. [Google Scholar] [CrossRef]
  18. Giannini, V.; Mula, L.; Carta, M.; Patteri, G.; Roggero, P.P. Interplay of irrigation strategies and sowing dates on sunflower yield in semi-arid Mediterranean areas. Agric. Water Manag. 2022, 260, 107287. [Google Scholar] [CrossRef]
  19. Paul, P.L.C.; Bell, R.W.; Barrett-Lennard, E.G.; Kabir, E.; Gaydon, D.S. Opportunities and risks with early sowing of sunflower in a salt-affected coastal region of the Ganges Delta. Agron. Sustain. Dev. 2021, 41, 39. [Google Scholar] [CrossRef]
  20. Hussain, F.; Rafiq, M.; Ghias, M.; Qamar, R.; Razzaq, M.K.; Hameed, A.; Habib, S.; Mustafa, H.S. Genetic diversity for seed yield and its components using principal component and cluster analysis in sunflower r (Helianthus annuus L.). Life Sci. J. 2017, 14, 71–78. [Google Scholar] [CrossRef]
  21. Markulj-Kulundžić, A.; Sudarić, A.; Matoša-Kočar, M.; Mijić, A.; Liović, I.; Viljevac-Vuletić, M.; Varga, I.; Cesar, V.; Lepeduš, H. Sunflower agronomic traits in field irrigation conditions. Genetika 2022, 54, 473–489. [Google Scholar] [CrossRef]
  22. Mrđa, J.; Crnobarac, J.; Radić, V.; Miklič, V. Sunflower seed quality and yield in relation to environmental conditions of production region. Helia 2012, 35, 123–134. [Google Scholar] [CrossRef]
  23. Kalenska, S.; Ryzhenko, A.; Novytska, N.; Garbar, L.; Stolyarchuk, T.; Kalenskyi, V.; Shytiy, O. Morphological features of plants and yield of sunflower hybrids cultivated in the northern part of the forest-steppe of Ukraine. Am. J. Plant Sci. 2020, 11, 1331–1344. [Google Scholar] [CrossRef]
  24. Duca, M.; Port, A.; Burcovschi, I.; Joiţa-Păcureanu, M.; Dan, M. Environmental response in sunflower hybrids: A multivariate approach. Rom. Agric. Res. 2022, 39, 1–14. [Google Scholar] [CrossRef]
  25. Ahmed, B.; Sultana, M.; Zaman, J.; Paul, S.K.; Rahman, M.M.; Islam, M.; Majumdar, F. Effect of sowing dates on the yield of sunflower. Bangladesh Agron. J. 2015, 18, 1–5. [Google Scholar] [CrossRef]
  26. Debaeke, P.; Casadebaig, P.; Flenet, F.; Langlade, N. Sunflower crop and climate change: Vulnerability, adaptation, and mitigation potential from case-studies in Europe. OCL 2017, 24, D102. [Google Scholar] [CrossRef]
  27. Ćuk, N.; Cvejić, S.; Mladenov, V.; Jocković, M.; Babec, B.; Miklič, V.; Jocić, S. Variability of agronomic traits in sunflower inbred lines. Sel. I Semen. 2020, 26, 29–37. [Google Scholar] [CrossRef]
  28. IUSS Working Group WRB. World Reference Base for Soil Resources 2014, update 2015 International soil classification system for naming soils and creating legends for soil maps. In World Soil Resources Reports; FAO: Rome, Italy, 2015; Volume 106, pp. 1–203. [Google Scholar]
  29. Republic Hydrometeorological Service of Serbia. Available online: https://www.hidmet.gov.rs/ciril/meteorologija/agro.php (accessed on 10 May 2023).
  30. Schneiter, A.A.; Miller, J.F. Description of sunflower growth stages. Crop Sci. 1981, 21, 901–903. [Google Scholar] [CrossRef]
  31. ISTA Rules; International Seed Testing Association: Zurich, Switzerland, 2018.
  32. Granlund, M.; Zimmerman, D.C. Effect of drying conditions on oil contents of sunflower (Helianthus annuus L.) seed determined by wide-line Nuclear Magnetic Resonance (NMR). Proc. N. Dak. Acad. Sci. 1975, 27, 128–132. [Google Scholar]
  33. Milligan, G.W.; Cooper, M.C. An examination of procedures for determining the number of clusters in a data set. Psychometrika 1985, 50, 159–179. [Google Scholar] [CrossRef]
  34. Tharwat, A.; Gaber, T.; Ibrahim, A.; Hassanien, A.E. Linear discriminant analysis: A detailed tutorial. AI Commun. 2017, 30, 169–190. [Google Scholar] [CrossRef]
  35. Farcuh, M.; Copes, B.; Le-Navenec, G.; Marroquin, J.; Jaunet, T.; Chi-Ham, C.; Cantu, D.; Bradford, K.J.; Van Deynze, A. Texture diversity in melon (Cucumis melo L.): Sensory and physical assessments. Postharvest Biol. Technol. 2020, 159, 111024. [Google Scholar] [CrossRef]
  36. IBM Corp. Released. IBM SPSS Statistics for Windows; Version 25.0; IBM Corp: Armonk, NY, USA, 2017. [Google Scholar]
  37. SAS Institute Inc. JMP® 13 Predictive and Specialized Modeling, 2nd ed.; SAS Institute Inc.: Cary, NC, USA, 2017. [Google Scholar]
  38. Love, J.; Selker, R.; Marsman, M.; Jamil, T.; Dropmann, D.; Verhagen, J.; Ly, A.; Gronau, Q.F.; Šmíra, M.; Epskamp, S.; et al. JASP: Graphical statistical software for common statistical designs. J. Stat. Softw. 2019, 88, 1–17. [Google Scholar] [CrossRef]
  39. Faramarzi, A.; Khorshidi, M.B. Planting date effect on yield and yield components of sunflower in Mizaneh region. In Proceedings of the 17th International Sunflower Conference, Cordoba, Spain, 8–12 June 2008. [Google Scholar]
  40. Partal, E. Sunflower yield and quality under the influence of sowing date, plant population and the hybrid. Rom. Agric. Res. 2022, 39, 463–470. [Google Scholar] [CrossRef]
  41. Babec, B. Intercropping In the Service of Improving Soil Quality and Biological and Production Characteristics of Sunflower. Ph.D. Thesis, Faculty of Agriculture, University of Novi Sad, Novi Sad, Serbia, 2023. Available online: https://fiver.ifvcns.rs/handle/123456789/3454 (accessed on 11 September 2023).
  42. Krstić, M.; Ovuka, J.; Mladenov, V.; Radić, V.; Krstić, J.; Ćuk, N.; Miklič, V. Interdependence of the oil content in pure seed and other tested traits of inbred sunflower lines. Uljarstvo 2021, 52, 5–12. [Google Scholar]
  43. Ion, V.; Dicu, G.; Basa, A.G.; Dumbrava, M.; Temocico, G.; Epure, L.I.; State, D. Sunflower yield and yield components under different sowing conditions. Agric. Agric. Sci. Procedia 2015, 6, 44–51. [Google Scholar] [CrossRef]
  44. Kvashin, A.A.; Neshchadim, N.N.; Yablonskay, E.K.; Gorpinchenko, K.N. Crop yield and the quality of sunflower seeds in the use of fertilizers and growth regulation substances. Helia 2018, 41, 227–239. [Google Scholar] [CrossRef]
  45. Radić, V.; Balalić, I.; Miladinov, Z.; Ćirić, M.; Vasiljević, M.; Jocić, S.; Marjanović-Jeromela, A. Genotype x environment interaction of some traits in sunflower (Helianthus annuus L.) lines. Appl. Ecol. Environ. Res. 2020, 18, 1707–1719. [Google Scholar] [CrossRef]
  46. Crnobarac, J.; Balalić, I.; Latković, D.; Jaćimović, G. The influence of sowing date on yield and quality of NS sunflower hybrids. In Proceedings of the 20th International Sunflower Conference, Novi Sad, Serbia, 20–23 June 2022. [Google Scholar]
  47. Chambo, E.D.; Escocard de Oliveira, N.T.; Garcia, R.C.; RuvoloTakasusuki, M.C.C.; Arnaut de Toledo, V.A. Phenotypic correlation and path analysis in sunflower genotypes and pollination influence on estimates. Open Biol. Sci. J. 2017, 3, 9–15. [Google Scholar] [CrossRef]
  48. Ćuk, N.; Cvejić, S.; Mladenov, V.; Babec, B.; Miklič, V.; Miladinović, D.; Jocić, S. Variability of morphological traits in sunflower inbred lines. Genetika 2020, 52, 911–923. [Google Scholar] [CrossRef]
  49. Radić, V.; Balalić, I.; Jaćimović, G.; Krstić, M.; Jocković, M.; Jocić, S. A study of correlations and path analyses of some parameters in sunflower parental lines. Ratar. I Povrt. 2021, 58, 7–13. [Google Scholar] [CrossRef]
  50. Creux, N.; Marshall, C.; Memela, U.; Mapfumo, P.; Harmer, S. The delicate balancing act of climate control during flowering, pollination and seed development in sunflower. In Proceedings of the 20th International Sunflower Conference, Novi Sad, Serbia, 20–23 June 2022. [Google Scholar]
  51. Oshundiya, F.; Olowe, V.I.; Sowemimo, F.; Odedina, J.N. Seed yield and quality of sunflower (Helianthus annuus L.) as influenced by staggered sowing and organic fertilizer application in the humid tropics. Helia 2014, 37, 237–255. [Google Scholar] [CrossRef]
  52. Ozturk, E.; Polat, T.; Sezek, M. The effect of sowing date and nitrogen fertilizer form on growth, yield and yield components in sunflower. Turk. J. Field Crops 2017, 22, 143–151. [Google Scholar] [CrossRef]
  53. Balalić, I. Multivariate Analysis of Interaction between Hybrids and Planting Dates for Oil Content, Yield and Yield Components in Sunflower. Ph.D. Thesis, Faculty of Agriculture, University of Novi Sad, Novi Sad, Serbia, 2010. [Google Scholar]
  54. Abbas, G.; Ahmad, S.; Ahmad, A.; Nasim, W.; Fatima, Z.; Hussain, S.; Habib ur Rehman, M.; Khan, M.A.; Hasanuzzaman, M.; Fahad, S.; et al. Quantification the impacts of climate change and crop management on phenology of maize-based cropping system in Punjab, Pakistan. Agric. For. Meteorol. 2017, 247, 42–55. [Google Scholar] [CrossRef]
  55. Rezadust, S.; Mokhtarzadeh, S. Effect of planting date on germination indices of Erflor cultivar of sunflower seeds. Turk. J. Agric. Nat. Sci. 2019, 6, 792–797. [Google Scholar] [CrossRef]
  56. Škorić, D. Sunflower breeding for resistance to abiotic and biotic stresses. In Abiotic and Biotic Stress in Plants—Recent Advances and Future Perspectives; Shanker, A., Shanker, C., Eds.; InTech: Rijeka, Croatia, 2016; Volume 25. [Google Scholar]
  57. Krstić, M.; Babec, B.; Hladni, N.; Klisurić, N.; Radeka, I.; Ostojić, B.; Butaš, D.; Jokić, G.; Ovuka, J.; Miklič, V.; et al. Potencijal NS hibrida suncokreta u uslovima promenjene klime. In Proceedings of the 57. Savetovanje Agronoma i Poljoprivrednika Srbije (SAPS) i 3. Savetovanje Agronoma Republike Srbije i Republike Srpske, Zlatibor, Serbia, 30 January–3 February 2023. [Google Scholar]
  58. Alqudah, A.M.; Samarah, N.H.; Mullen, R.E. Drought stress effect on crop pollination, seed set, yield and quality. In Alternative Farming Systems, Biotechnology, Drought Stress and Ecological Fertilisation. Sustainable Agriculture Reviews; Lichtfouse, E., Ed.; Springer: Dordrecht, The Netherlands, 2011; Volume 6, pp. 193–213. [Google Scholar] [CrossRef]
  59. Soriano, M.A.; Orgaz, F.; Villalobos, F.J.; Fereres, E. Efficiency of water use of early plantings in sunflower. Eur. J. Agron. 2004, 21, 465–476. [Google Scholar] [CrossRef]
  60. Šućur, R.; Mladenov, V.; Banjac, B.; Trkulja, D.; Mikić, S.; Šumaruna, M.; Börner, A. Phenotypic marker study of worldwide wheat germplasm. Ital. J. Agron. 2023; early access. [Google Scholar] [CrossRef]
  61. Ćirić, M.; Jocić, S.; Cvejić, S.; Čanak, P.; Jocković, M.; Marinković, R.; Mirosavljević, M. Evaluation of combining abilities of new sunflower inbred lines. Ratar. I Povrt. 2013, 50, 8–15. [Google Scholar] [CrossRef]
  62. Babec, B.; Šeremešić, S.; Hladni, N.; Terzić, S.; Vojnov, B.; Ćuk, N.; Gvozdenac, S. Effect of intercropping sunflower with legumes on some sunflower morphological traits. Ratar. I Povrt. 2020, 57, 61–67. [Google Scholar] [CrossRef]
  63. Dar, J.S.; Cheema, M.A.; Rehmani, M.I.A.; Khuhro, S.; Rajput, S.; Virk, A.L.; Hussain, S.; Bashir, M.A.; Alghanem, S.M.; Al-Zuaibr, F.M.; et al. Potassium fertilization improves growth, yield and seed quality of sunflower (Helianthus annuus L.) under drought stress at different growth stages. PLoS ONE 2021, 16, e0256075. [Google Scholar] [CrossRef] [PubMed]
  64. Mrđa, J.; Crnobarac, J.; Dušanić, N.; Jocić, S.; Miklič, V. Germination energy as a parameter of seed quality in different sunflower genotypes. Genetika 2011, 43, 427–436. [Google Scholar] [CrossRef]
  65. Krstić, M.; Ovuka, J.; Gvozdenac, S.; Butaš, D.; Ćuk, N.; Babec, B.; Cvejić, S. Seed vitality of sunflower inbred lines as influenced by climatic factors and seed size. J. Process. Energy Agric. 2022, 26, 106–110. [Google Scholar] [CrossRef]
  66. Baraiya, V.K.; Jagtap, P.K.; Sangani, J.L.; Malviya, A.V. Correlation and path analysis in sunflower (Helianthus annus L.). J. Pharmacogn. Phytochem. 2018, 7, 2730–2732. [Google Scholar]
  67. Babić, V.; Babić, M. Phenotypic characterization and multivariate analyses. Proc. XXII Conf. Agron. Vet. Technol. 2008, 14, 71–79. [Google Scholar]
  68. Krstić, M.; Mladenov, V.; Ćuk, N.; Ovuka, J.; Gvozdenac, S.; Krstić, J.; Miklič, V. Agro-morphological traits of inbred sunflower lines and their genetic assessment. Contemp. Agric. 2022, 71, 87–95. [Google Scholar] [CrossRef]
  69. Bushnev, A.S.; Demurin, Y.N.; Orekhov, G.I. Productivity of sunflower hybrids with erectoid leaves at various plant densities. OCL 2021, 28, 39. [Google Scholar] [CrossRef]
  70. Gul, R.M.S.; Sajid, M.; Rauf, S.; Munir, H.; Shehzad, M.; Haider, W. Evaluation of drought-tolerant sunflower (Helianthus annuus L.) hybrids in autumn and spring planting under semi-arid rainfed conditions. OCL 2021, 28, 24. [Google Scholar] [CrossRef]
  71. Rezaie, B.; Hosseinpanahi, F.; Siosemardeh, A.; Darand, M.; Bannayan, M. Shifting the sowing date of winter wheat as a strategy for adaptation to climate change in a Mediterranean-type environment. Int. J. Plant Prod. 2022, 16, 595–610. [Google Scholar] [CrossRef]
  72. Hussain, M.M.; Rauf, S.; Noor, M.; Bibi, A.; Ortiz, R.; Dahlberg, J. Evaluation of introgressed lines of sunflower (Helianthus annuus L.) under contrasting water treatments. Agriculture 2023, 13, 1250. [Google Scholar] [CrossRef]
  73. Riveira Rubin, M.; Arata, G.J.; López, E.D.; Rodriguez, M.V.; Batlla, D. Dormancy attributes in sunflower achenes (Helianthus annuus L.): II. Sowing date effects. Crop Sci. 2021, 61, 4309–4324. [Google Scholar] [CrossRef]
  74. Berton, T.; Bernillon, S.; Fernandez, O. Leaf metabolomic data of eight sunflower lines and their sixteen hybrids under water deficit. OCL 2021, 28, 42. [Google Scholar] [CrossRef]
  75. Aguirrezábal, L.A.N.; Lavaud, Y.; Dossio, G.A.A.; Izquierdo, N.G.; Andrade, F.H.; Gonzales, L.M. Intercepted solar radiation during seed filling determines sunflower weight per seed and oil concentration. Crop Sci. 2003, 43, 152–161. [Google Scholar] [CrossRef]
  76. Nazarli, H.; Zardashti, M.R.; Darvishzadeh, R.; Najafi, S. The effect of water stress and polymer on water use efficiency, yield and several morphological traits of sunflower under greenhouse condition. Not. Sci. Biol. 2010, 2, 53–58. [Google Scholar] [CrossRef]
  77. Farzad, B.A.; Mahmoud, T.; Majid, N.; Mohamad-Reza, S. Effect of drought stress on yield and yield components of some sunflower recombinant inbred lines. Int. J. Biosci. 2013, 3, 50–56. [Google Scholar] [CrossRef]
  78. Angeloni, P.; Aguirrezábal, L.; Echarte, M.M. Assessing the mechanisms underlying sunflower grain weight and oil content responses to temperature during grain filling. Field Crops Res. 2021, 262, 108040. [Google Scholar] [CrossRef]
  79. Forrest, J.; Miller-Rushing, A.J. Toward a synthetic understanding of the role of phenology in ecology and evolution. Philos. Trans. R. Soc. B 2010, 365, 3101–3112. [Google Scholar] [CrossRef] [PubMed]
  80. Nasim, W.; Ahmad, A.; Wajid, A.; Akhtar, J.; Muhammad, D. Nitrogen effects on growth and development of sunflower hybrids under agro-climatic conditions of Multan. Pak. J. Bot. 2011, 43, 2083–2092. [Google Scholar]
  81. Kaya, Y. Sunflower. In Breeding Oil Seed Crops for Sustainable Production. Opportunities and Constraints; Gupta, S.K., Ed.; Academic Press: Cambridge, MA, USA; Elsevier Inc.: Amsterdam, The Netherlands, 2016; Volume 4, pp. 55–88. [Google Scholar]
  82. Miklič, V.; Balalić, I.; Jocić, S.; Cvejić, S.; Jocković, M.; Miladinović, D.; Terzić, S. NS hibridi suncokreta u ogledima u Bačkoj i Banatu 2019. godine. In Proceedings of the 61. Savetovanje industrije ulja, Herceg Novi, Montenegro, 28 June–3 July 2020. [Google Scholar]
  83. Kalarani, M.K.; Senthil, A.; Thangaraj, M. Effect of water stress on morpho-physiological traits of sunflower (Helianthus annuus L.) genotypes. Madras Agric. J. 2004, 91, 239–248. [Google Scholar]
  84. Hussain, M.; Malik, M.A.; Farooq, M.; Ashraf, M.Y.; Cheema, M.A. Improving drought tolerance by exogenous application of glycinebetaine and salicylic acid in sunflower. J. Agron. Crop Sci. 2008, 194, 193–199. [Google Scholar] [CrossRef]
  85. Totsky, I.V.; Lyakh, V.A. Pollen selection for drought tolerance in sunflower. Helia 2015, 38, 211–220. [Google Scholar] [CrossRef]
  86. Škorić, D. Sunflower breeding. In Sunflower Genetics and Breeding; Škorić, D., Seiler, G., Zhao, L., Jan, C.C., Miller, J.F., Charlet, L., Eds.; SASA-Branch: Novi Sad, Serbia, 2012; pp. 165–354. [Google Scholar]
Figure 1. Sum of precipitation and average temperatures for the multi-year average and three years of the experiment at the location of Rimski šančevi, Serbia.
Agriculture 13 02149 g001
Figure 2. Linear discriminant analysis (LDA). (a) Interaction of genotype and first sowing date; (b) interaction of genotype and second sowing date; (c) interaction of genotype and third sowing date; (d) interaction of genotype and fourth sowing date. Biplot graphs where two dimensions (Canonical1, i.e., DF1, and Canonical2, i.e., DF2) provide maximum separation of genotypes into groups based on dependent variables in the experiment. Around the center of each group (+sign), there is a circle representing the 95% confidence interval. These circles do not overlap when groups differ significantly from each other statistically. If the circles overlap, it indicates that those genotypes form one cluster. Genotype G1 is marked with red circles; genotype G2 is marked with green crosses; genotype G3 is marked with blue diamonds; genotype G4 is marked with orange letter X; genotype G5 is marked with green triangles; genotype G6 is marked with purple letter Y.
Agriculture 13 02149 g002
Figure 3. Visual Mixed Model (VMM). (a) The influence of average daily temperature during flowering on GR depending on sowing dates; (b) the influence of average daily temperature during seed filling on GR depending on sowing dates; (c) the influence of sum of precipitation during flowering on GR depending on sowing dates; (d) the influence of sum of precipitation during seed filling on GR depending on sowing dates; (e) the influence of number of flowering days on GR depending on sowing dates; (f) the influence of number days of seed filling on GR depending on sowing dates. AT R5-R6—average daily temperature during flowering; AT R6-R9*—average daily temperature during seed filling; SP R5-R6—sum of precipitation during flowering; SP R6-R9*—sum of precipitation during seed filling; ND R5-R6—number of flowering days; ND R6-R9*—number of days of seed filling; GS—growing season; GR—seed germination.
Agriculture 13 02149 g003
Figure 4. Visual Mixed Model (VMM). (a) The influence of average daily temperature during flowering on TSM depending on sowing dates; (b) the influence of average daily temperature during seed filling on TSM depending on sowing dates; (c) the influence of sum of precipitation during flowering on TSM depending on sowing dates; (d) the influence of sum of precipitation during seed filling on TSM depending on sowing dates; (e) the influence of number of flowering days on TSM depending on sowing dates; (f) the influence of number days of seed filling on TSM depending on sowing dates. AT R5-R6—average daily temperature during flowering; AT R6-R9*—average daily temperature during seed filling; SP R5-R6—sum of precipitation during flowering; SP R6-R9*—sum of precipitation during seed filling; ND R5-R6—number of flowering days; ND R6-R9*—number of days of seed filling; GS—growing season; GR—seed germination.
Agriculture 13 02149 g004
Figure 5. Visual Mixed Model (VMM). (a) The influence of average daily temperature during flowering on Y depending on sowing dates; (b) the influence of average daily temperature during seed filling on Y depending on sowing dates; (c) the influence of sum of precipitation during flowering on Y depending on sowing dates; (d) the influence of sum of precipitation during seed filling on Y depending on sowing dates; (e) the influence of number of flowering days on Y depending on sowing dates; (f) the influence of number days of seed filling on Y depending on sowing dates. AT R5-R6—average daily temperature during flowering; AT R6-R9*—average daily temperature during seed filling; SP R5-R6—sum of precipitation during flowering; SP R6-R9*—sum of precipitation during seed filling; ND R5-R6—number of flowering days; ND R6-R9*—number of days of seed filling; GS—growing season; GR—seed germination.
Agriculture 13 02149 g005
Table 1. Plant material utilized in the experiment.
NoGenotypeVegetation
Duration
Experimental Description
G1HA-267
(A × B)
EarlyProduction of Basic Seed Category
The experiment consisted of two isolations to prevent the overlap of flowering between different B-analogs on earlier and later dates. In one isolation, SD1 and SD3 were sown, while in the other isolation, SD2 and SD4 were sown. All inbred lines had varying vegetation durations to avoid overlapping pollination of different B-analogous groups on the same SD. Across all SDs, the row ratio was 6:2 (A:B).
G2BG N 2 (PR)
(A × B)
Medium-early
G3IMI-AB-12 (PR)
(A × B)
Late
G4BG N 1 × SU RF 49
(A × Rf)
Medium-earlyProduction of First-Generation Certified Seed Category
The experiment consisted of a single isolation encompassing all SDs. The male component (Rf) was the same across all three hybrid combinations. Across all SDs, the row ratio was 8:2 (A:Rf).
G5BG N 2 (PR) × SU RF 49
(A × Rf)
Medium-early
G6BG N 4 × SU RF 49
(A × Rf)
Medium-early
A—sterile analog (cms inbred line); B—fertile analog (inbred line); Rf—inbred line fertility restorer (male component of hybrid); SD—sowing date.
Table 2. Two-way ANOVA for head diameter, plant height, germination energy, seed germination, 1000-seed mass, seed yield, and oil yield in sunflower genotypes, planted on four sowing dates over three years.
Source of VariationTraits202020212022
dfFSS%dfFSS%dfFSS%
Sowing date (SD)
Genotype (G)
SD × G
HD349.32 **42345.25 **27310.60 **10
512.66 **19541.26 **41527.13 **40
159.23 **391510.65 **321511.33 **50
Sowing date (SD)
Genotype (G)
SD × G
PH329.61 **73110.48 **32329.33 **12
5204.52 **75589.26 **435110.20 **74
1516.44 **181517.361 **25156.89 **14
Sowing date (SD)
Genotype (G)
SD × G
GE35.61 **6324.71 **73116.94 **17
542.34 **675155.05 **765172.45 **42
155.71 **271511.59 **171555.10 **41
Sowing date (SD)
Genotype (G)
SD × G
GR33.22 *5350.73 **133151.44 **19
531.88 **655158.53 **645169.28 **36
154.97 **311519.2 **231570.59 **45
Sowing date (SD)
Genotype (G)
SD × G
TSM322.14 **24320.17 **11338.02 **7
525.96 **47564.71 **635228.61 **66
155.35 **29158.83 **261531.12 **27
Sowing date (SD)
Genotype (G)
SD × G
Y310.04 **5311.62 **6336.24 **6
553.13 **42595.89 **745261.40 **75
1522.05 **53158.72 **201521.55 **19
Sowing date (SD)
Genotype (G)
SD × G
OY313.66 **735.44 **3352.92 **8
545.18 **39586.83 **765269.29 **71
1520.73 **54157.96 **211527.08 **21
HD—head diameter, PH—plant height, GE—germination energy, GR—germination, TSM—1000-seed mass, Y—seed yield, OY—oil yield; Significance of the difference tested at a significance level of p < 0.05 *: statistically significant difference; p < 0.01 **: statistically highly significant difference.
Table 3. Duncan’s Post Hoc test for genotype comparisons across different sowing dates for head diameter, plant height, germination energy, seed germination, 1000-seed mass, seed yield, and oil yield during three years of research located at Rimski šančevi, Serbia.
FactorHD
(cm)
PH
(cm)
GE
(%)
GR
(%)
TSM
(g)
Y
(kg ha−1)
OY
(kg ha−1)
2020
Sowing date
(SD)
SD118.4 a128 b78 a82 ab65.4 a2045 a734 a
SD217.8 b128 b74 b79 b59.2 b1679 b565 b
SD316.9 c129 b80 a85 a58.8 bc1766 b606 b
SD416.0 d139 a79 a82 ab56.7 c1743 b605 b
Genotype
(G)
G118.2 a134 b60 e66 d66.5 a2279 a810 a
G217.5 bc118 cd73 d78 c55.2 c1329 c424 d
G317.6 b163 a84 b89 ab60.6 b1323 c500 c
G416.5 d136 b83 b86 b62.4 b2401 a827 a
G516.8 d116 d89 a92 a62.0 b1745 b636 b
G617.0 cd120 c78 c81 c53.1 c1773 b568 bc
2021
Sowing date
(SD)
SD115.7 c92 d77 c81 c63.7 b1648 c637 b
SD215.4 c103 c82 b86 b62.3 bc1890 b705 a
SD317.2 b110 b86 a91 a66.9 a1931 b710 a
SD417.8 a116 a87 a91 a61.2 c2135 a767 a
Genotype
(G)
G114.6 d109 b58 c67 c71.1 a2136 b808 b
G217.9 a93 c81 b86 b60.6 d837 d302 e
G315.7 c122 a82 b85 b62.5 c1631 c654 cd
G416.7 b107 b93 a96 a65.4 b2976 a1106 a
G518.1 a93 c91 a94 a66.2 b1745 c632 d
G616.3 b109 b93 a95 a55.4 e2083 b725 c
2022
Sowing date
(SD)
SD117.4 c115 a75 b83 b66.2 a1938 c713 c
SD218.4 ab114 a77 a80 a62.4 b2475 a930 a
SD318.1 b108 b62 c68 d59.8 c2110 b783 b
SD418.8 a103 c69 c73 c60.2 c1876 c653 d
Genotype
(G)
G116.2 d117 b60 e70 c66.0 bc2090 c744 d
G218.1 c94 d75 c81 b45.8 e844 e302 f
G319.0 ab123 a60 e63 d59.1 d1398 d568 e
G417.8 c123 a80 b83 b70.5 a3363 a1278 a
G519.6 a93 d84 a87 a66.7 b2494 b916 b
G618.4 bc111 c65 d71 c64.9 c2409 b810 c
Average
(GS)
202017.3131788260.01808628
202116.5105838763.51901705
202218.2110717662.22100770
CV%10.417.318.716.112.841.17.6
Standard deviation1.8019.9814.4313.117.93796.702.74
GS—growing season; different letters denote values that distinguish statistically significantly among the four sowing dates and among the six genotypes, while the same letters indicate values between which there are no statistically significant differences between sowing dates and genotypes; CV—coefficient of variation.
Table 4. Significance and percentage share of each Discriminant Function describing the variability of sunflower genotypes in four sowing dates.
SD1 SD2 SD3 SD4
DFEigenvalueCum
Percent
Prob > FEigenvalueCum
Percent
Prob > FEigenvalueCum
Percent
Prob > FEigenvalueCum
Percent
Prob > F
DF19.5151.02<0.0001 *4.0843.33<0.0001 *6.4664.85<0.0001 *3.7751.95<0.0001 *
DF26.1884.17<0.0001 *2.6471.33<0.0001 *2.2987.84<0.0001 *2.2983.52<0.0001 *
DF32.0194.97<0.0001 *2.0192.68<0.0001 *0.8896.63<0.0001 *0.8094.60<0.0001 *
DF40.9199.85<0.0001 *0.6899.93<0.0001 *0.3299.880.0155 *0.3599.460.005 *
DF50.03100.000.630.01100.000.940.01100.000.85630.04100.000.4829
Test <0.0001 * <0.0001 * <0.0001 * <0.0001 *
WL <0.0001 * <0.0001 * <0.0001 * <0.0001 *
PT <0.0001 * <0.0001 * <0.0001 * <0.0001 *
HL <0.0001 * <0.0001 * <0.0001 * <0.0001 *
RMR <0.0001 * <0.0001 * <0.0001 * <0.0001 *
DF—Discriminant Function; * indicates significant differences were found at p = 0.05.
Table 5. Absolute values of the standardized coefficients that the dependent variables have in the Discri-minant Functions by sowing dates. In each DF, the dependent variables that have the greatest in-fluence on the variability of genotypes in that DF are marked in dark green. Variables marked in light green have high influence, variables marked in yellow have moderate influence, variables marked in orange have low influence, and variables marked in red have lowest influence on the variability of genotypes.
SD1HDPHGEGRTSMYOY
DF10.140.791.010.100.214.524.86
DF20.410.790.020.320.273.672.32
DF30.170.500.280.110.173.193.44
DF40.630.800.480.160.870.860.71
DF50.460.321.891.910.111.061.09
SD2HDPHGEGRTSMYOY
DF11.000.761.840.970.254.144.30
DF20.640.380.070.400.294.653.66
DF30.030.820.410.050.094.895.13
DF40.050.141.030.891.041.010.91
DF50.290.012.152.330.040.610.93
SD3HDPHGEGRTSMYOY
DF10.351.300.270.560.644.935.21
DF20.350.233.023.100.142.361.52
DF30.230.042.341.990.242.462.08
DF40.440.220.430.860.094.314.43
DF50.240.180.410.000.940.741.30
SD4HDPHGEGRTSMYOY
DF10.370.081.211.280.493.032.33
DF20.261.171.630.710.181.061.63
DF30.160.261.660.960.772.311.94
DF40.530.622.852.430.222.012.50
DF50.240.072.843.040.472.162.71
DF—Discriminant Function, SD—sowing date, HD—head diameter, PH—plant height, GE—germination energy, GR—germination, TSM—1000-seed mass, Y—seed yield, OY—oil yield.
Disclaimer/Publisher’s Note: The statements, opinions and data contained in all publications are solely those of the individual author(s) and contributor(s) and not of MDPI and/or the editor(s). MDPI and/or the editor(s) disclaim responsibility for any injury to people or property resulting from any ideas, methods, instructions or products referred to in the content.

