

Design and Experiment of Uniform Seed Device for Wide-Width Seeder of Wheat after Rice Stubble


Abstract
:1. Introduction
2. Material and Methods
2.1. WRS Agronomic Model with Wide Width
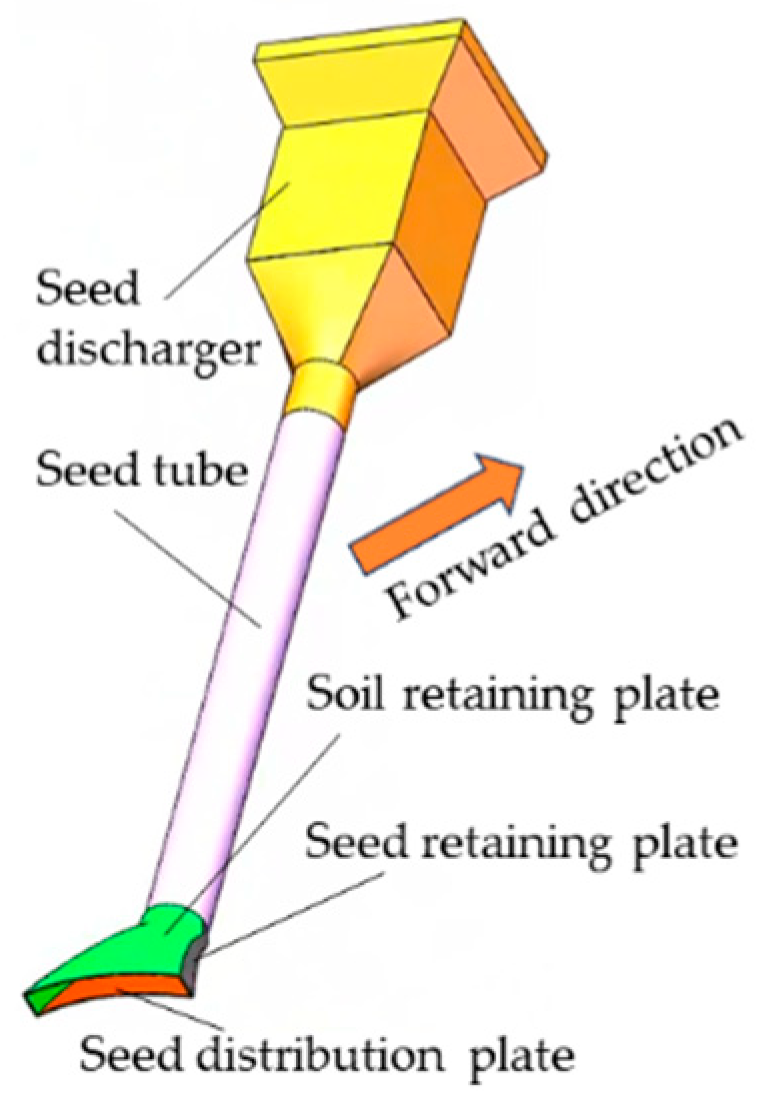
2.2. Structure and Principle
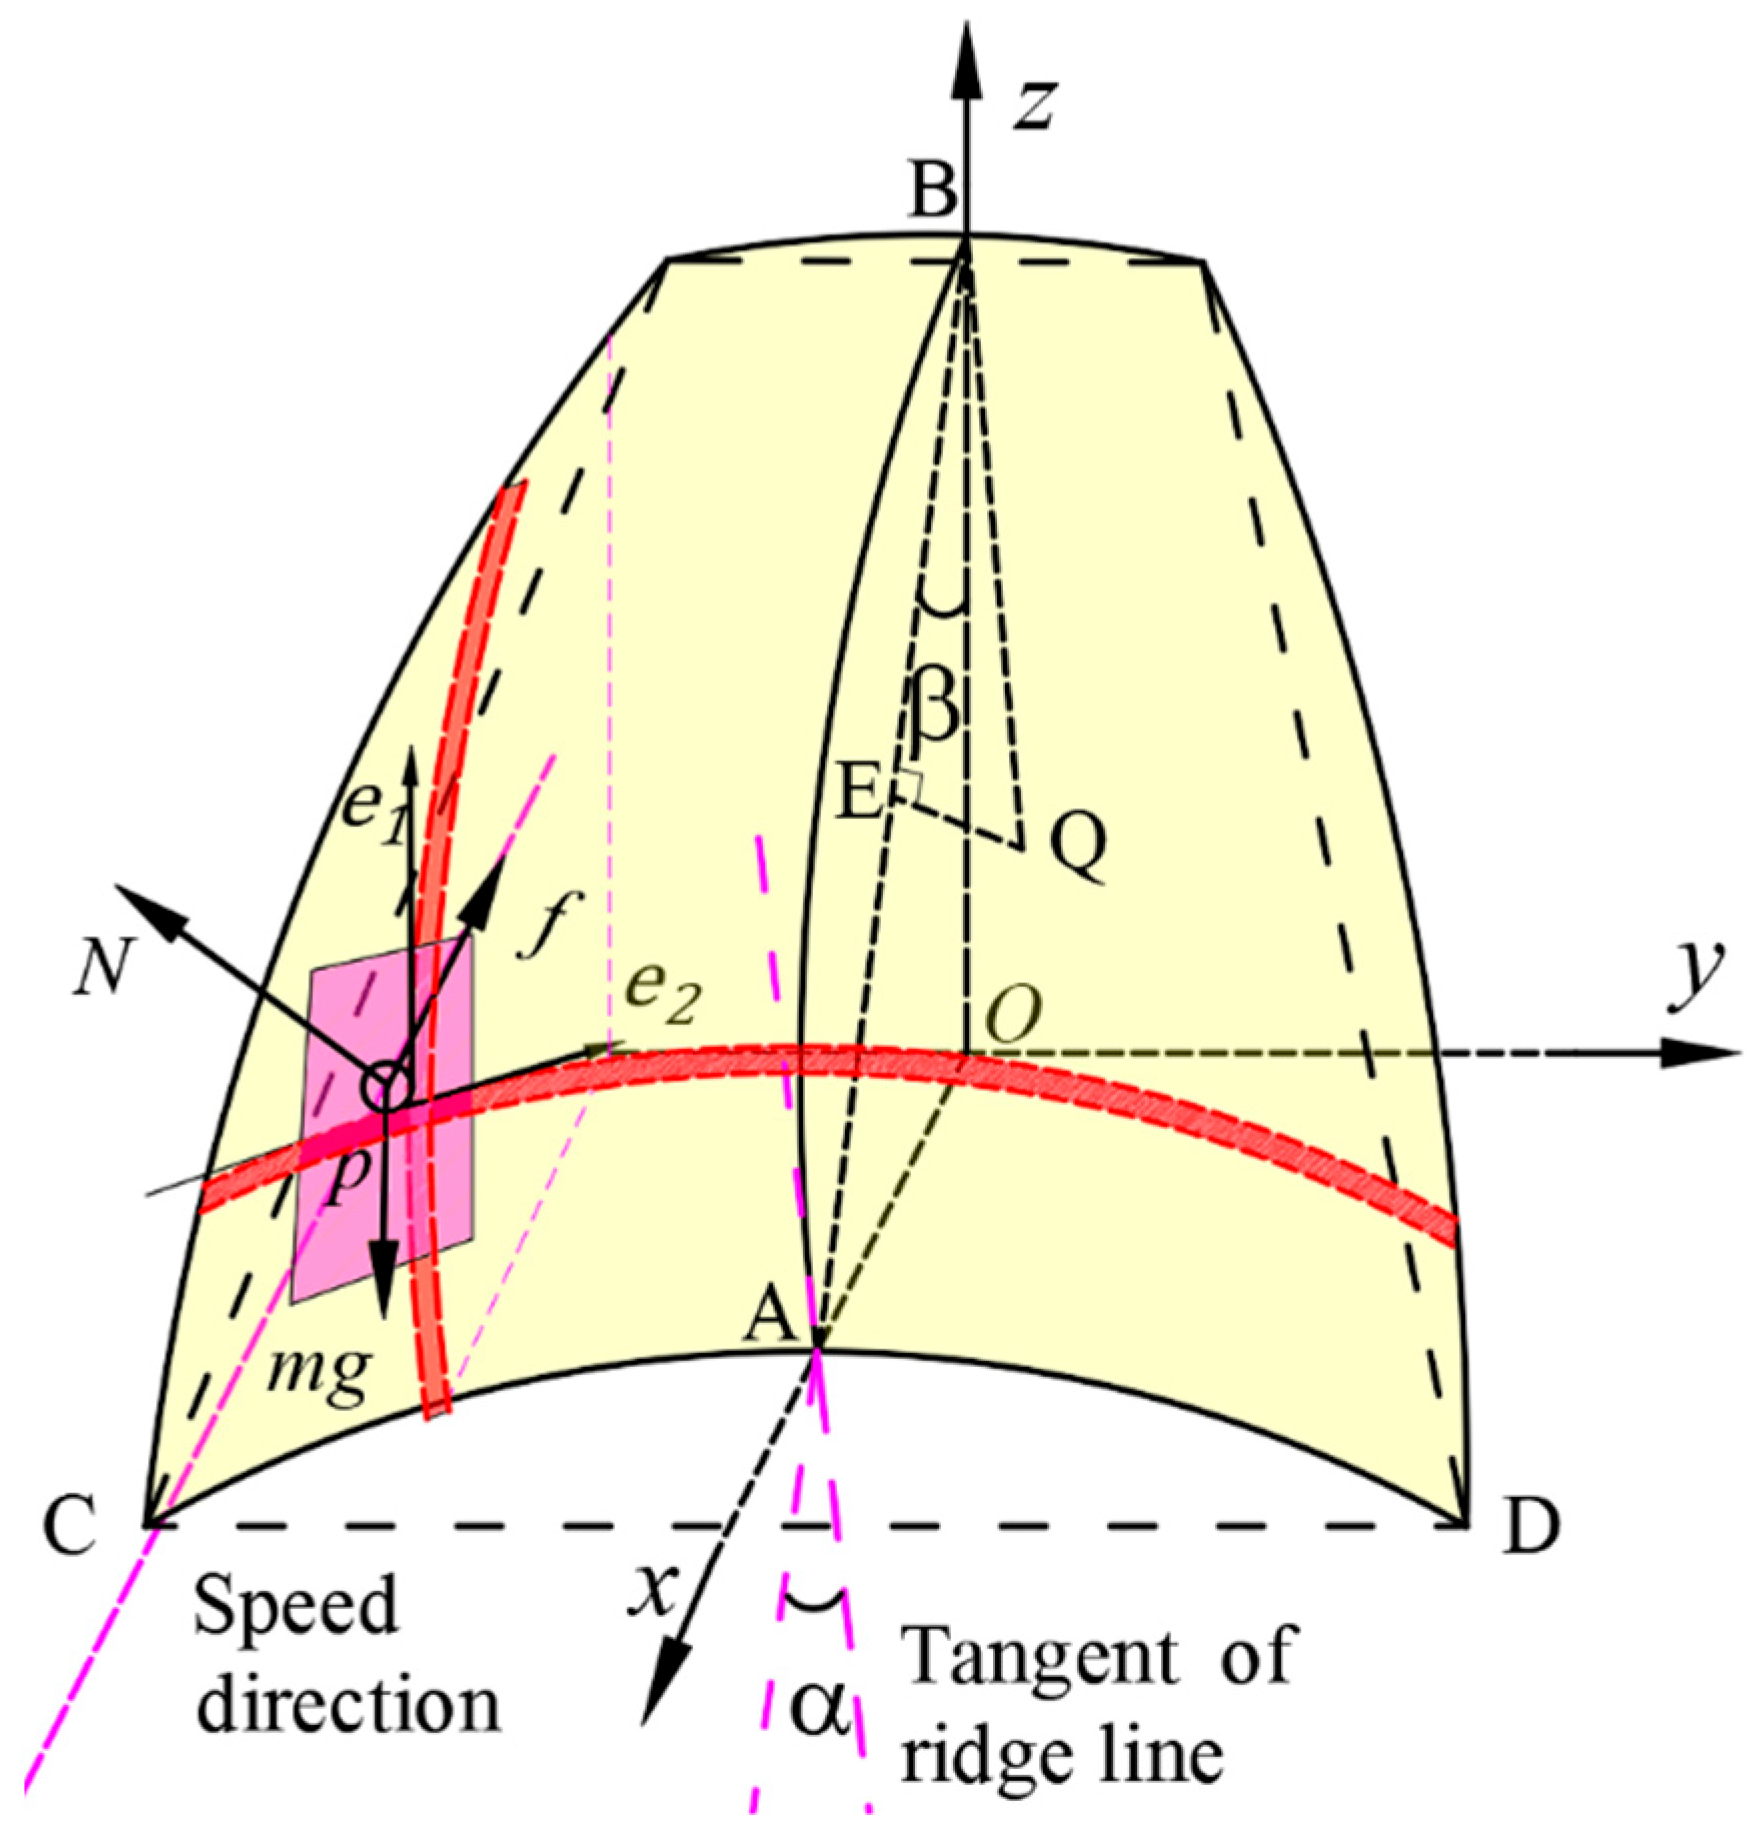
2.3. Analysis of the Relationship between Seed Distribution Plate Structure and Particle Motion
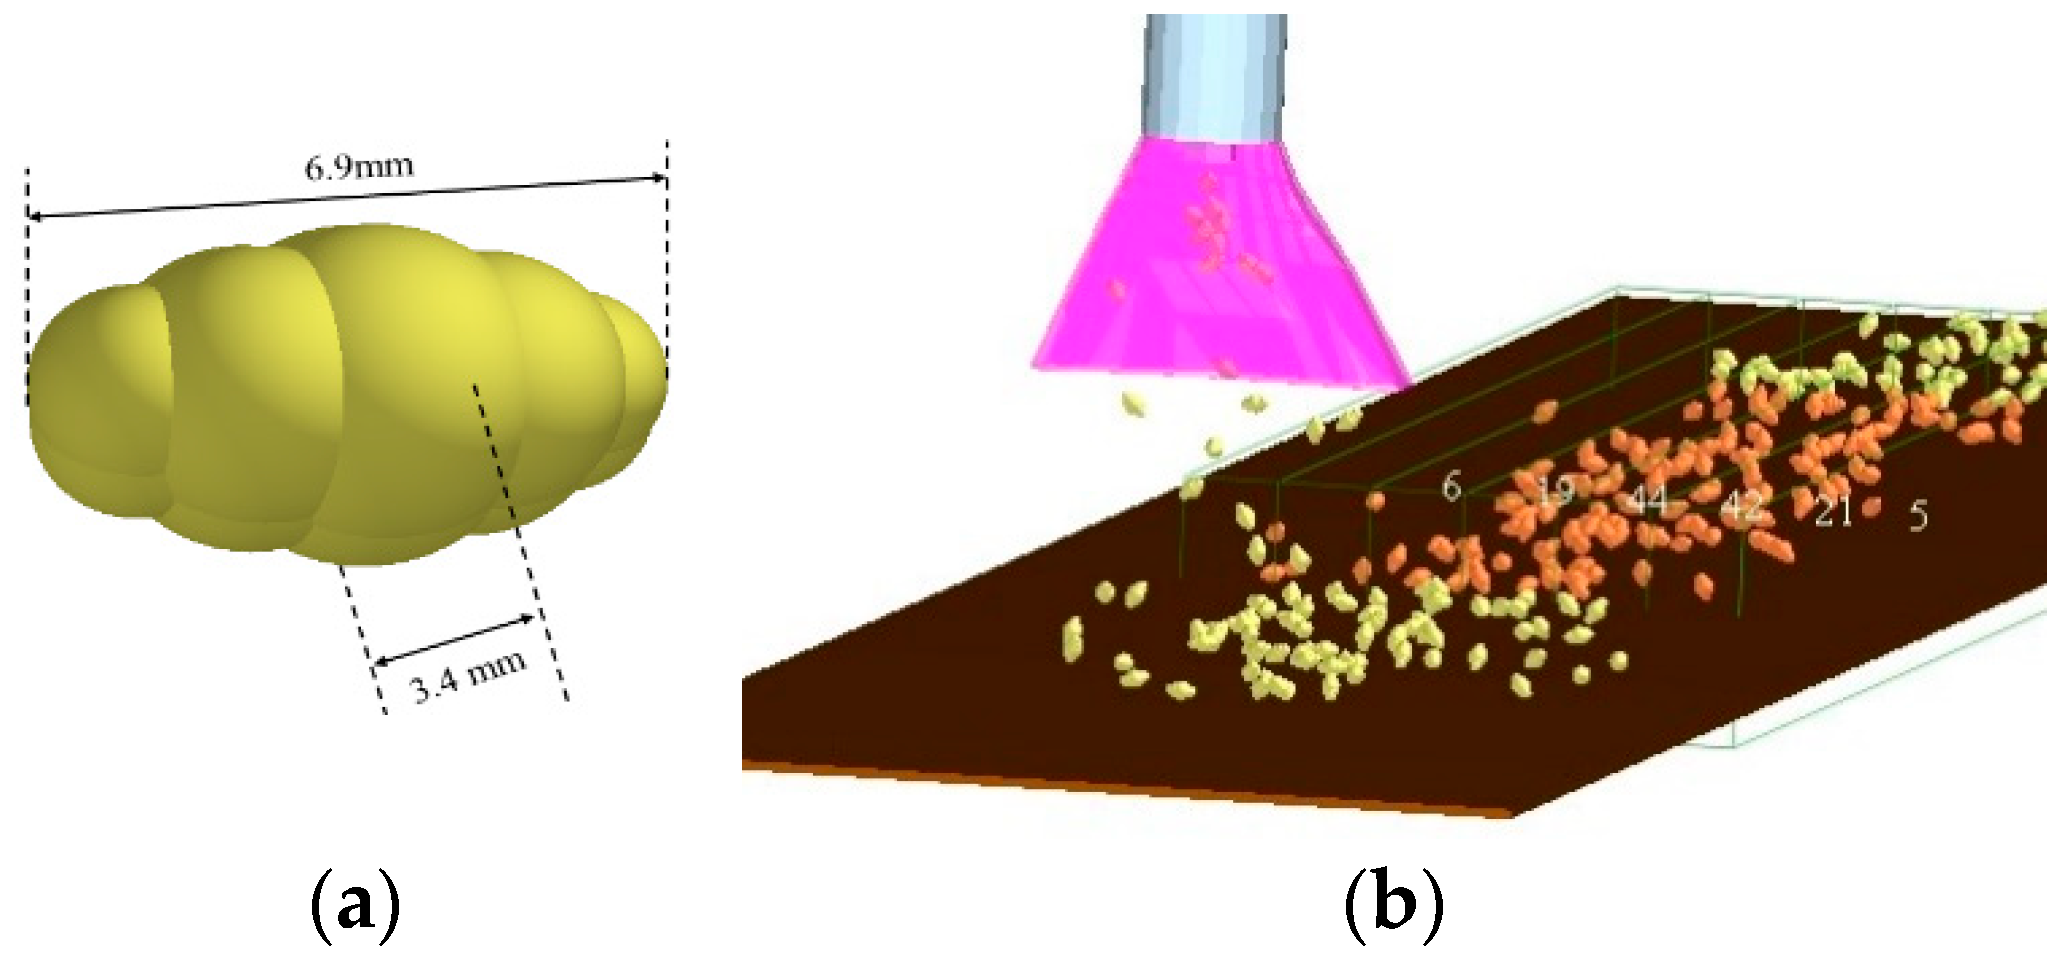
2.4. Simulation System Settings
2.5. Evaluation Index Calculation Method
2.6. The Effect of SDP Structure on the Seed Uniform Distribution Performance
2.7. Comprehensive Optimization of Crucial Structural Parameters of SDP
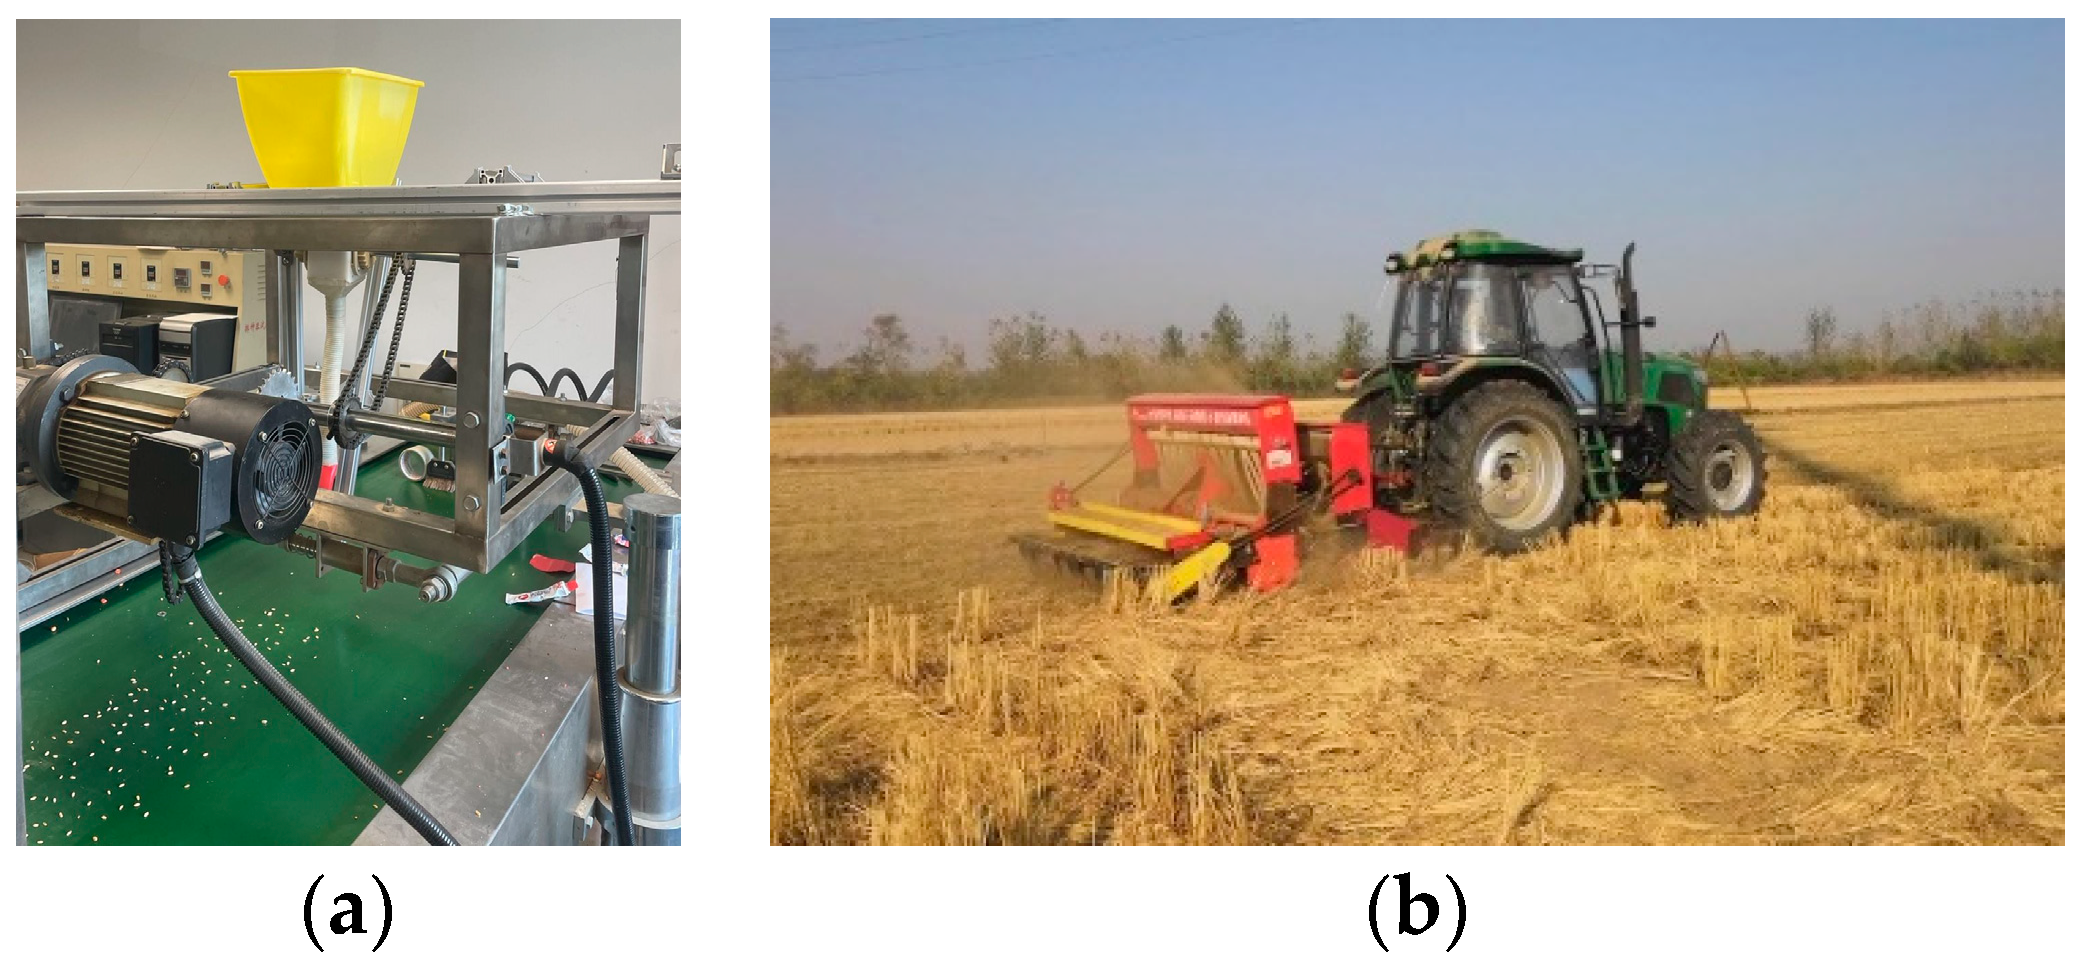
2.8. Verification Test
3. Results and Discussion
3.1. The Effect Law of the SDP Structure Parameter on the CVLU
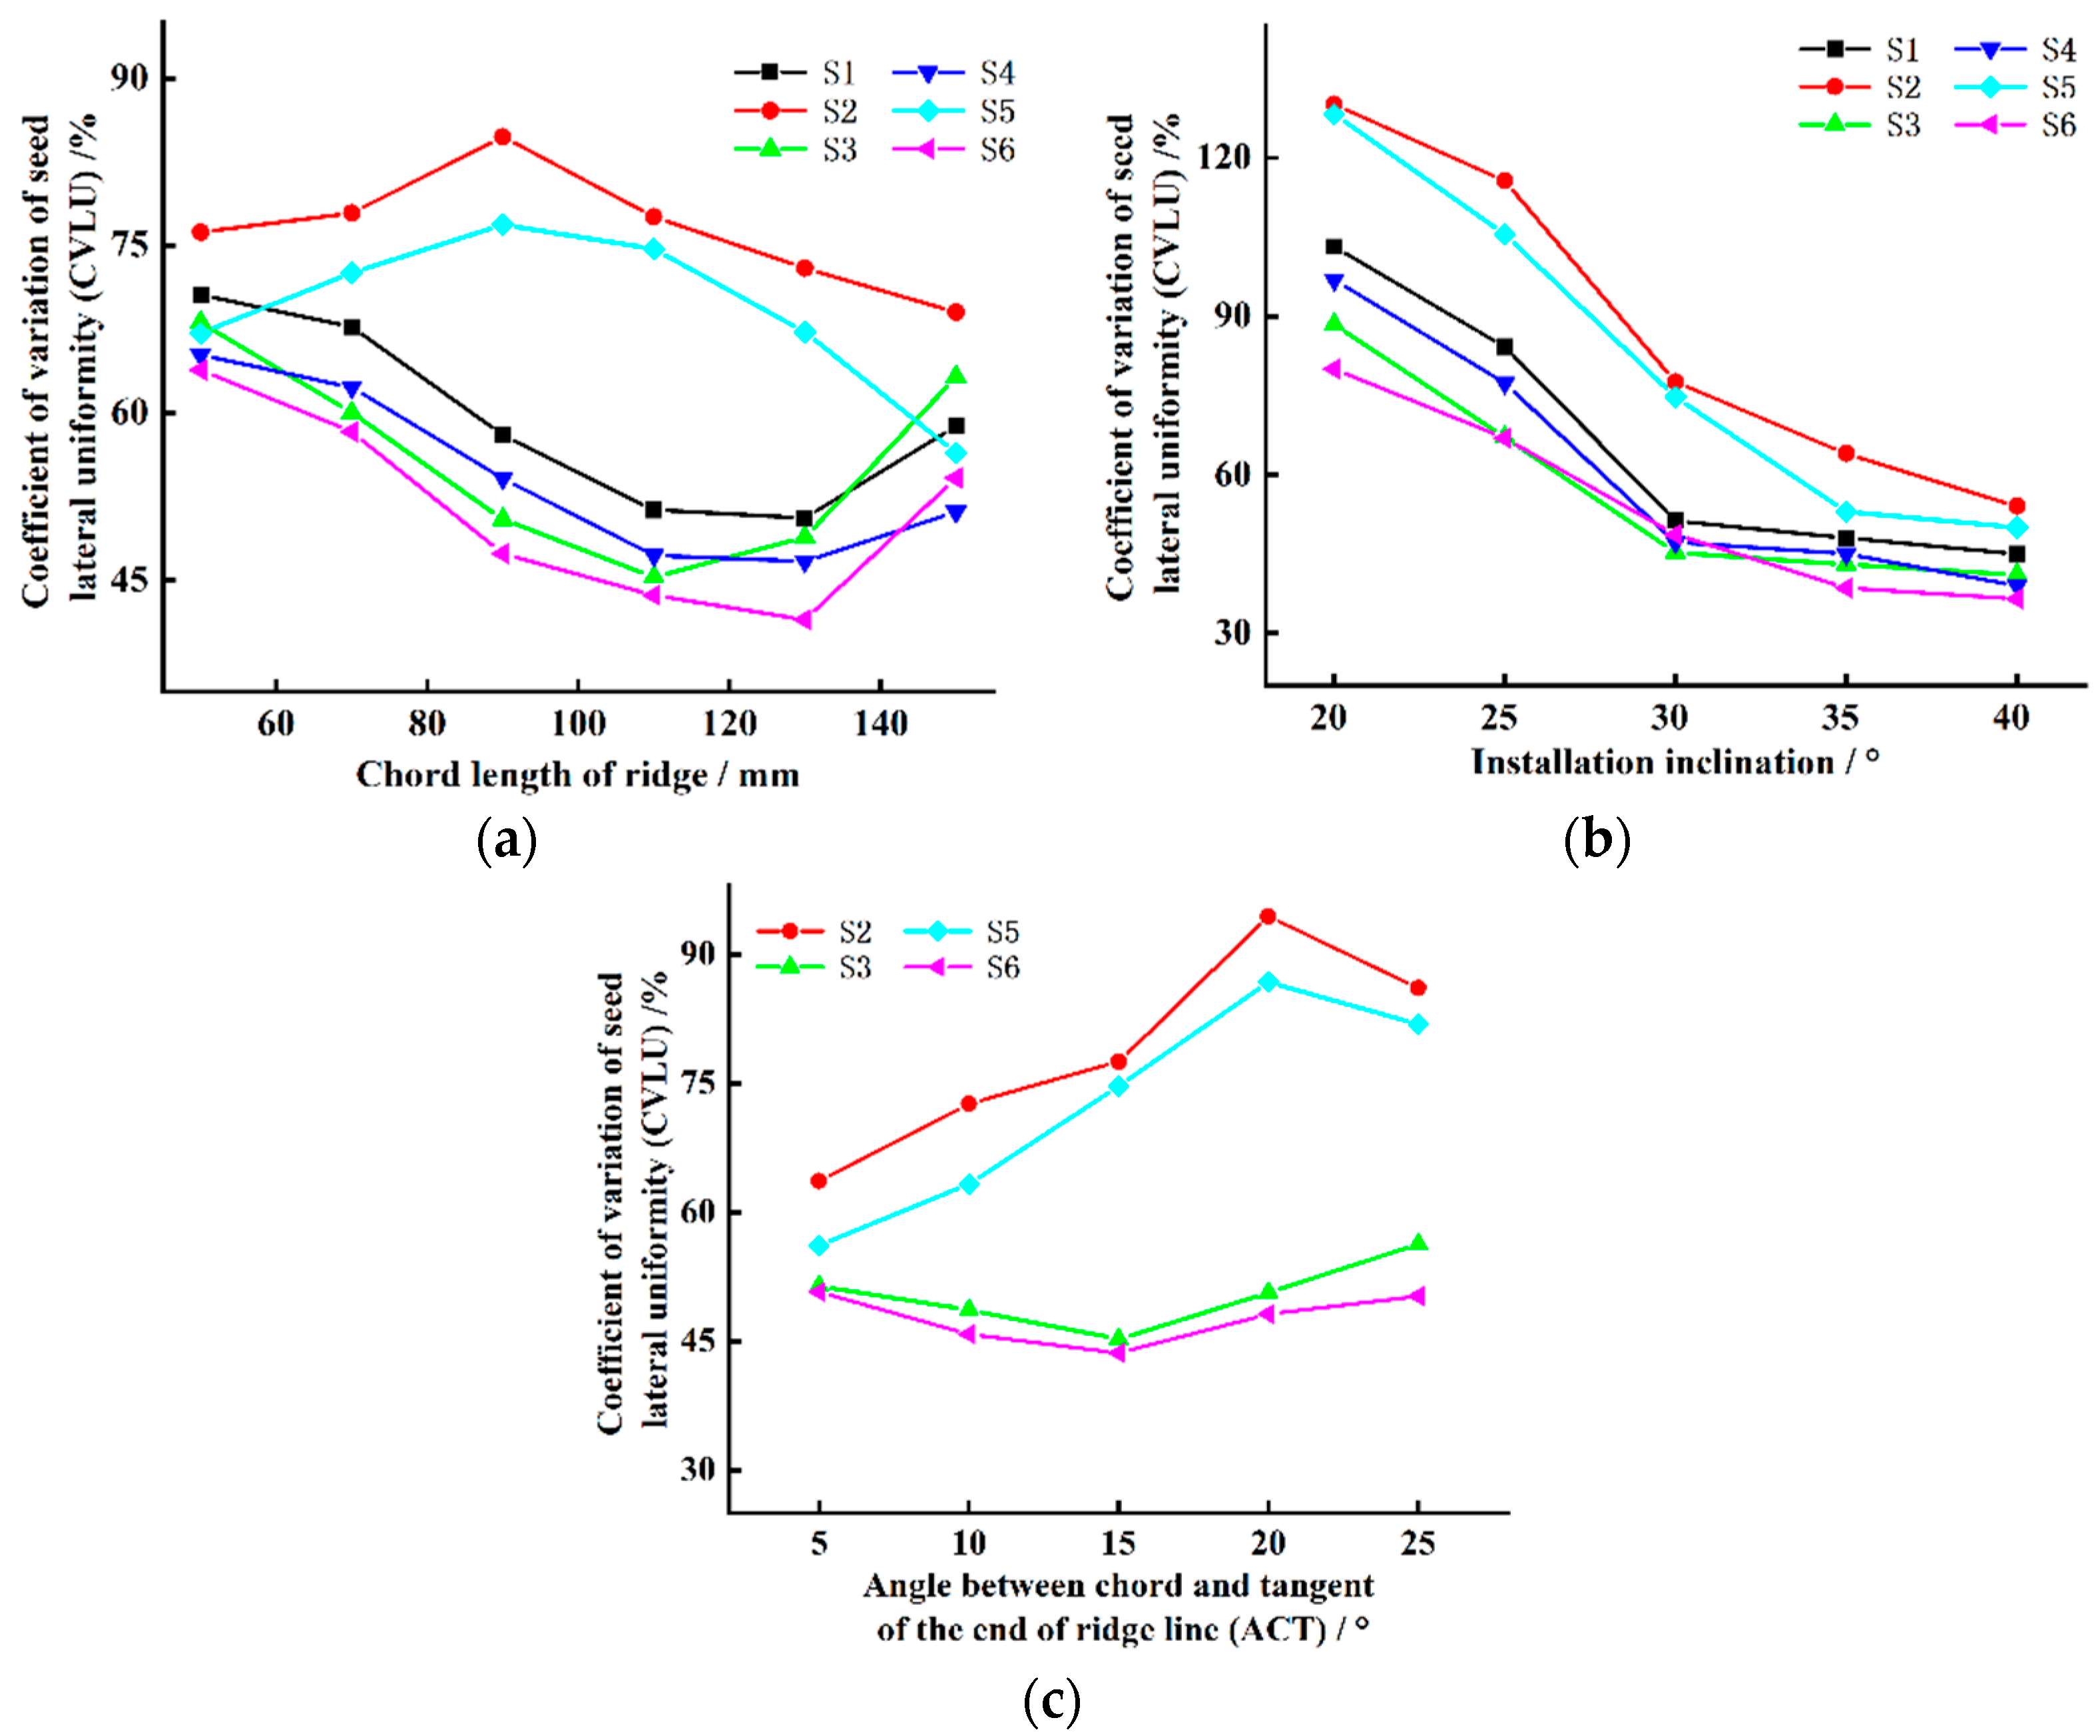
3.1.1. The Effect of Ridge Parameters on the CVLU
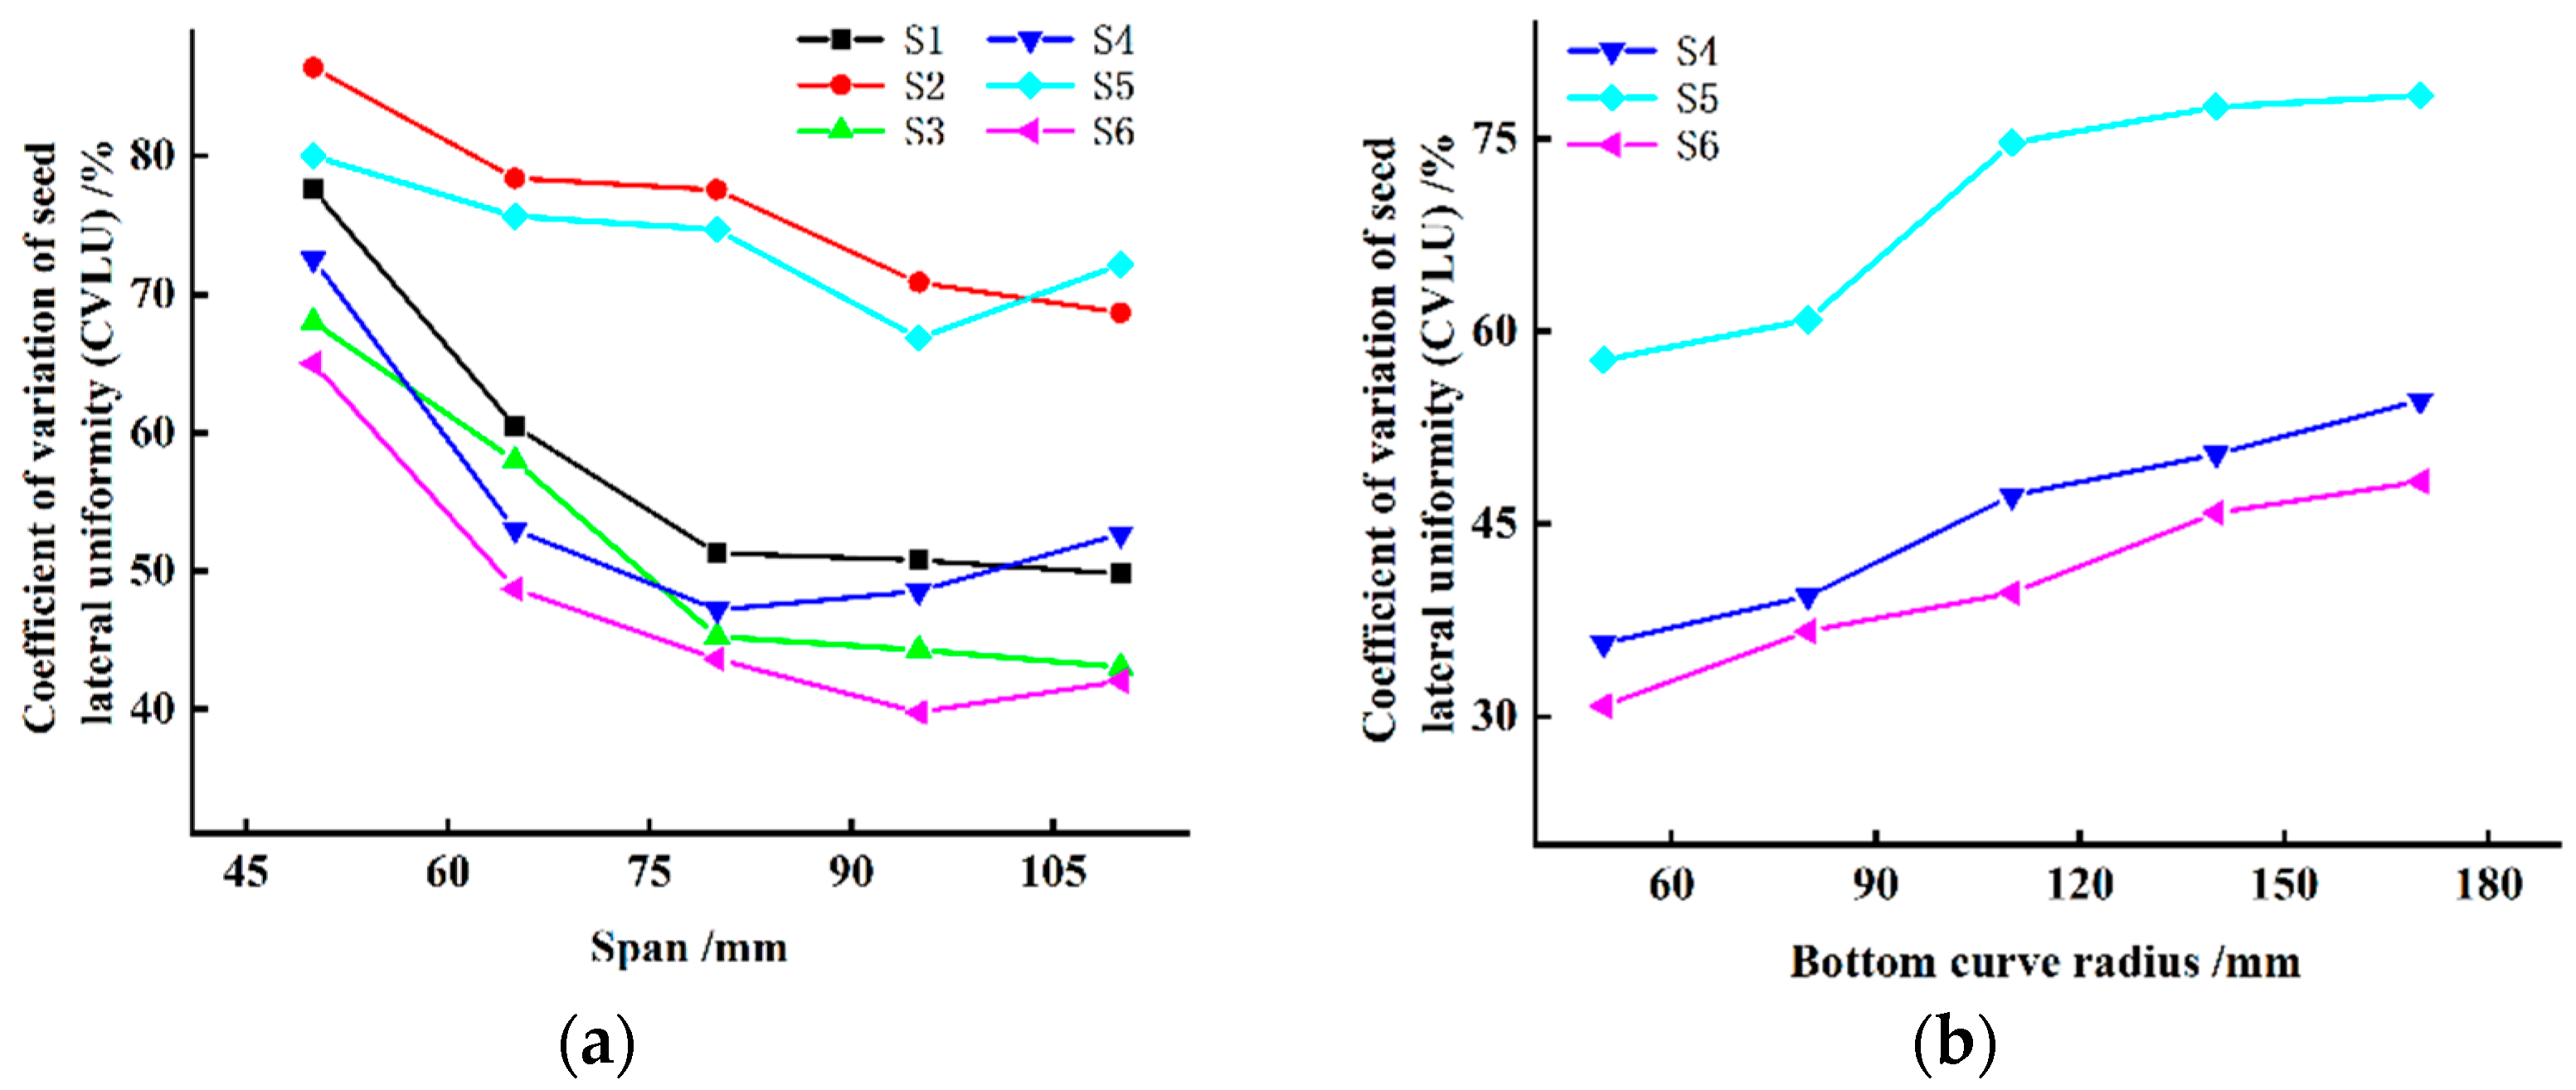
3.1.2. The Effect of Bottom Parameters on the CVLU
3.2. Results Analysis of Response Surface Test
3.2.1. Results of Variance Analysis
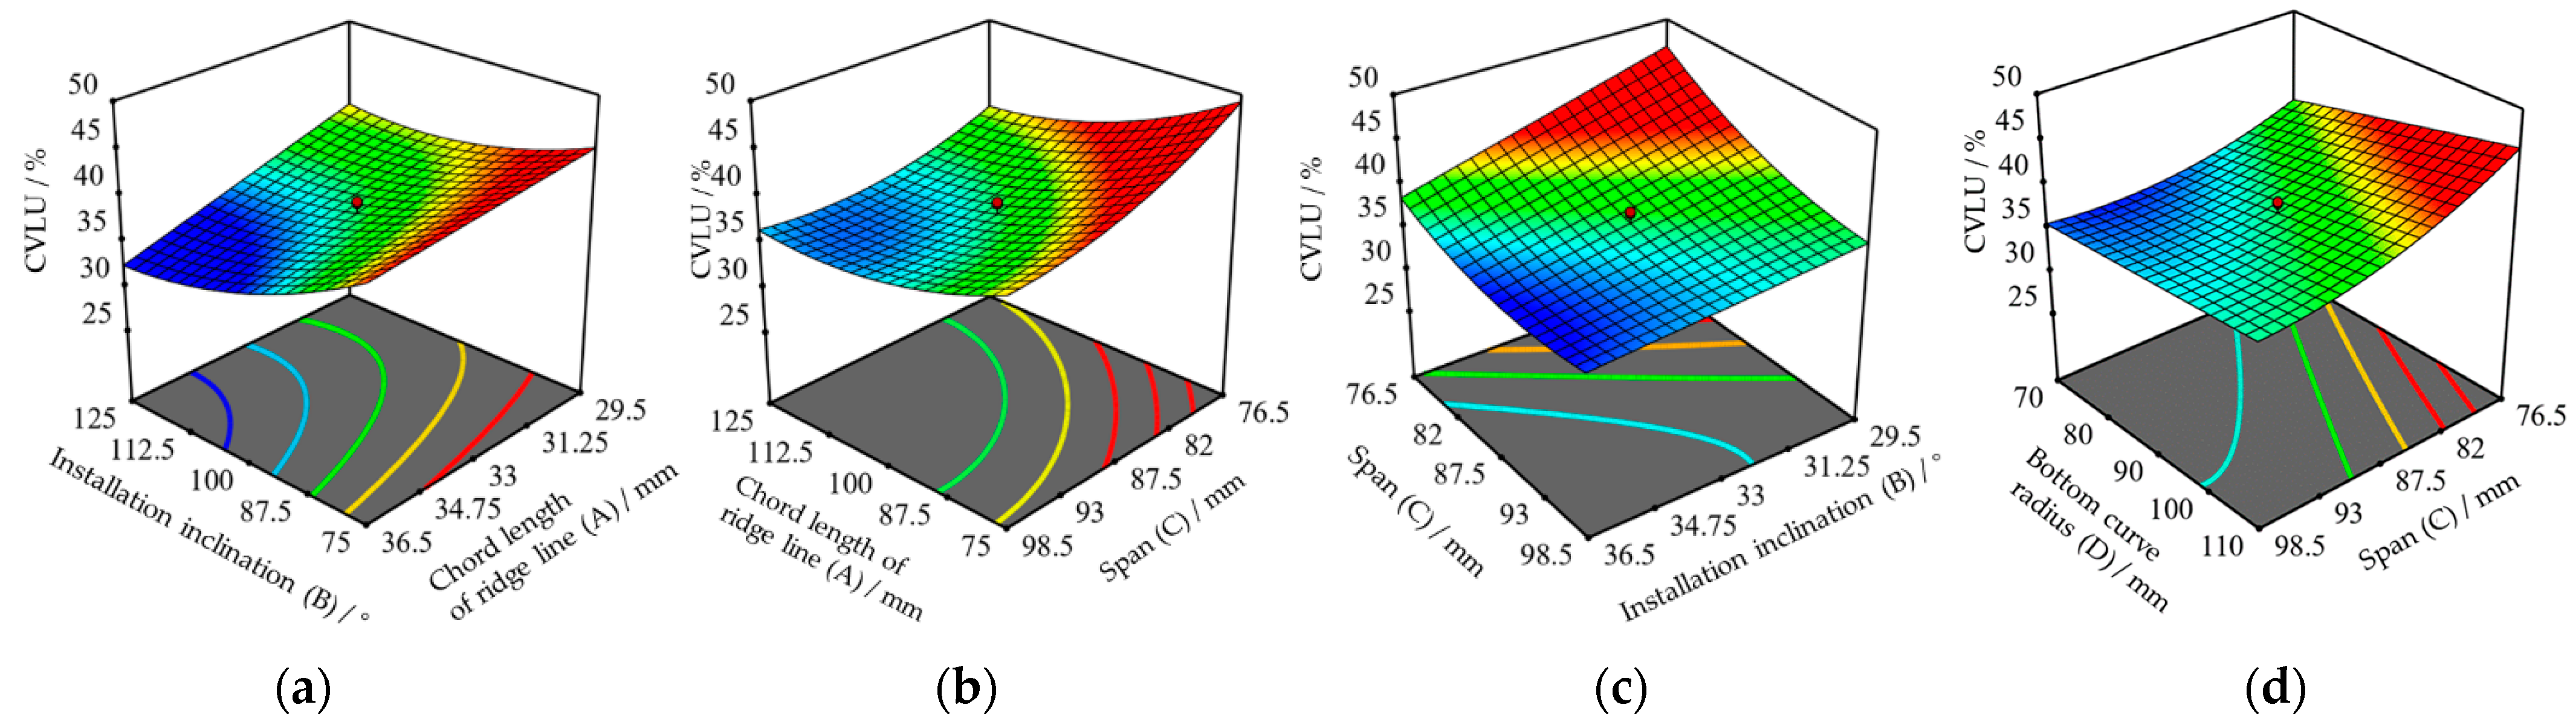
3.2.2. Analysis of Interaction Effects of Factors
3.2.3. Acquisition and Verification of Optimal Parameter Combination
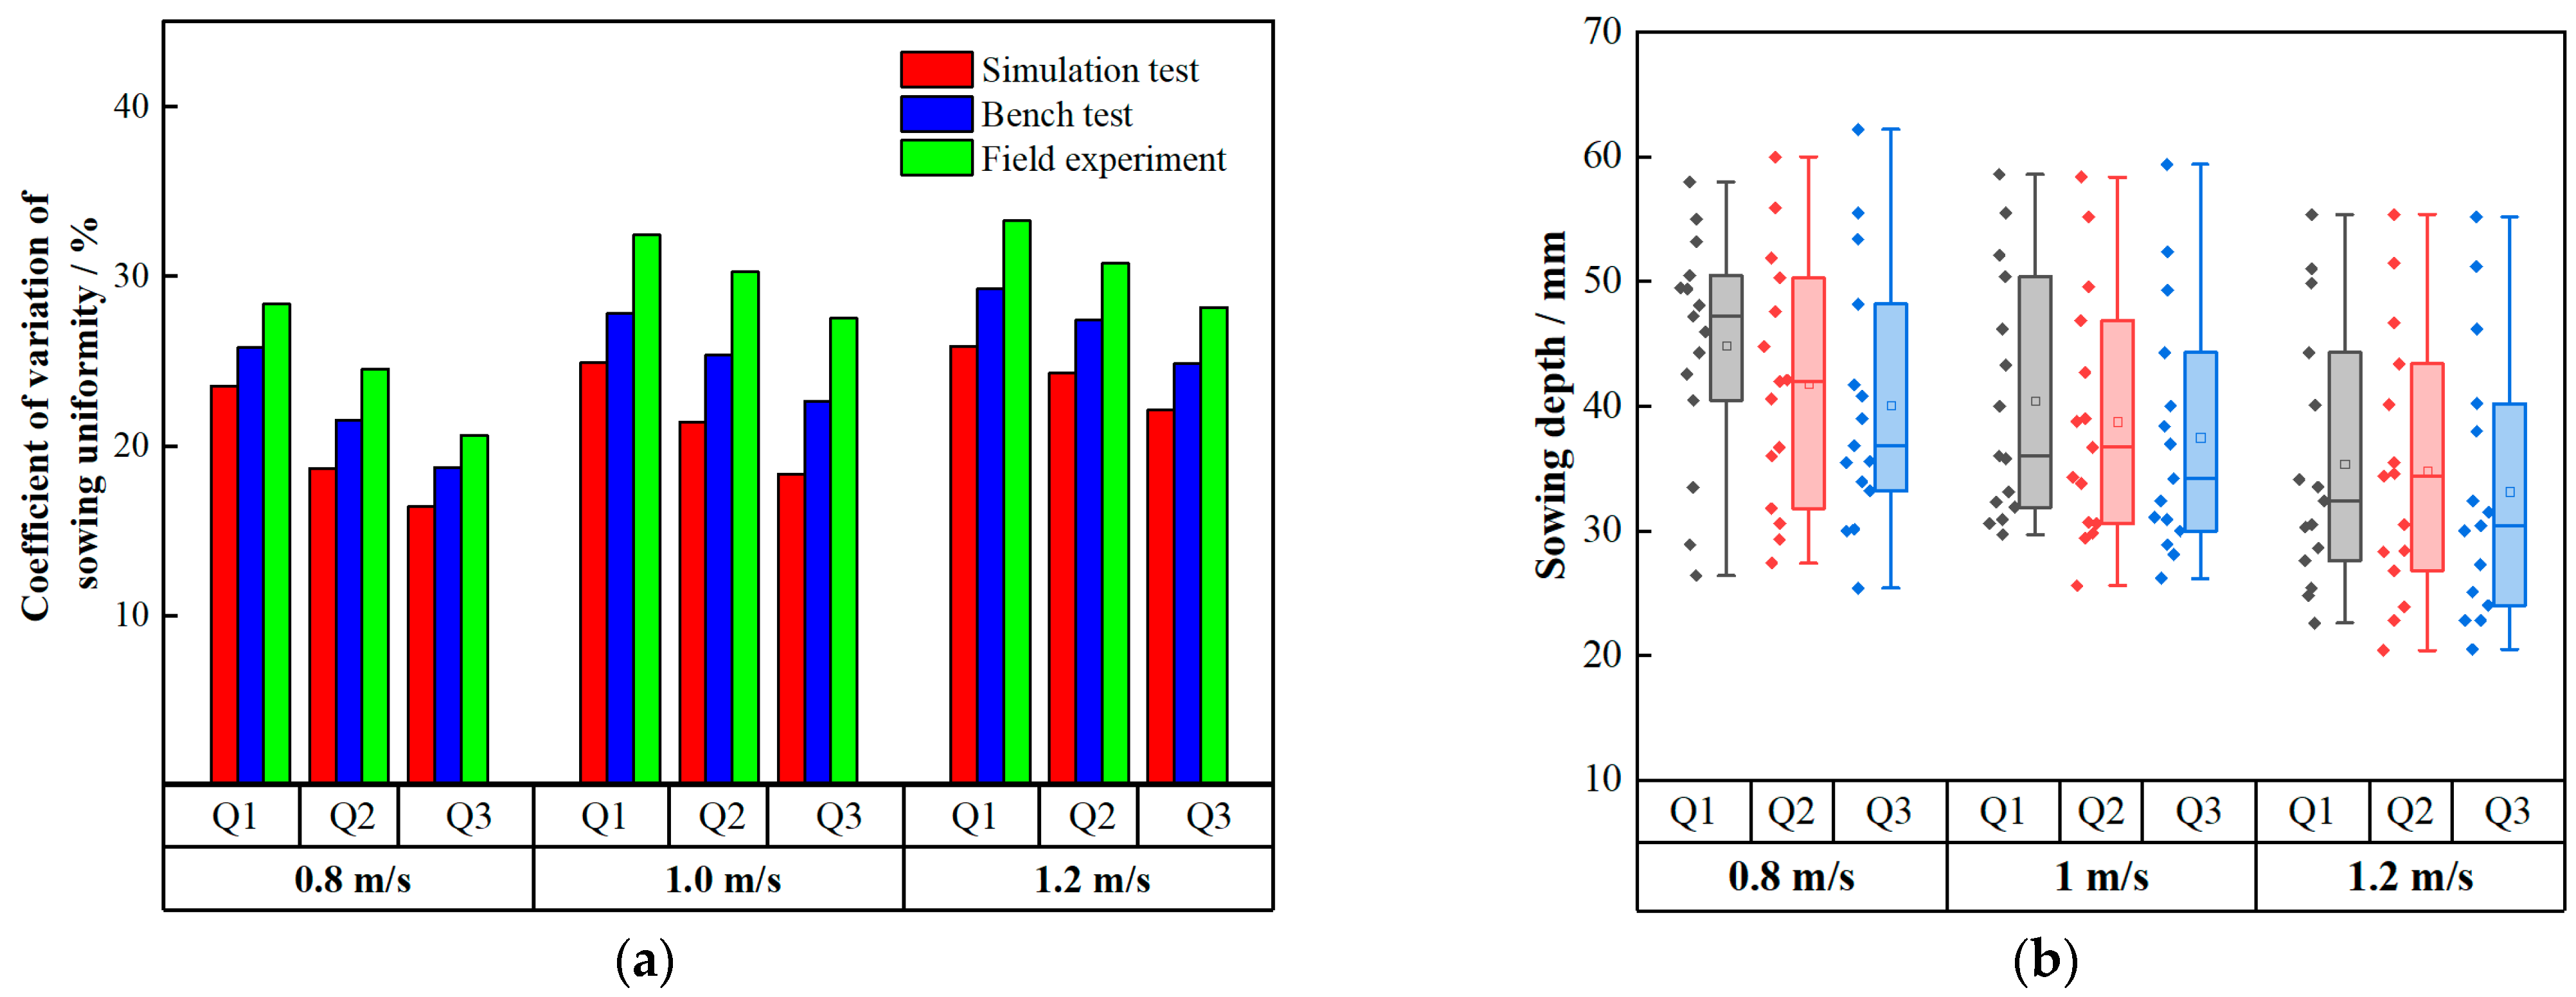
3.3. Results Analysis of Verification Tests
4. Discussions
5. Conclusions
- 1.
- Combined with agronomic standards, the structural design and theoretical analysis of the SDP were carried out. The key factors (chord length of ridge, installation inclination, ACT, span, and bottom curve radius) affecting CVLU value are identified.
- 2.
- Through simulation tests, six structures of SDP were compared, and the structure of S6 was determined to be the optimal structural model. The influence of key parameters on performance was analyzed. Four factors (chord length of ridge, installation inclination, span, and bottom curve radius) were determined as factors for a comprehensive optimization. In addition, the ACT was determined to be 13°, and the corresponding CVLU is 42.98%.
- 3.
- Through comprehensive optimization experiments, the influence of parameters on the CVLU is analyzed, and parameters are comprehensively optimized. The order of the main effect relationships of the four factors is A > C > B > D. The best parameter combination after optimization was obtained as the chord length of a ridge of 140 mm, installation inclination of 40°, span of 75 mm and` bottom curve radius of 50 mm. The corresponding theoretical CVLU value is 21.42%, and the corresponding field test value is 30.27%.
Author Contributions
Funding
Institutional Review Board Statement
Data Availability Statement
Conflicts of Interest
References
- Cao, W. Study on Mechanization Production Pattern and Efficiency of Rice-Wheat Double Cropping in Jiangsu Province. Ph.D. Thesis, China Agricultural University, Beijing, China, 2015. [Google Scholar]
- Singh, A.; Phogat, V.K.; Dahiya, R.; Batra, S.D. Impact of Long-Term Zero till Wheat on Soil Physical Properties and Wheat Productivity under Rice–Wheat Cropping System. Soil Tillage Res. 2014, 140, 98–105. [Google Scholar] [CrossRef]
- Ahmad, F.; Weimin, D.; Qishou, D.; Rehim, A.; Jabran, K. Comparative Performance of Various Disc-Type Furrow Openers in No-Till Paddy Field Conditions. Sustainability 2017, 9, 1143. [Google Scholar] [CrossRef]
- Ding, J.; Li, F.; Le, T.; Xu, D.; Zhu, M.; Li, C.; Zhu, X.; Guo, W. Tillage and Seeding Strategies for Wheat Optimizing Production in Harvested Rice Fields with High Soil Moisture. Sci. Rep. 2021, 11, 119. [Google Scholar] [CrossRef] [PubMed]
- He, J.; Li, H.; Chen, H.; Lu, C.; Wang, Q. Research Progress of Conservation Tillage Technology and Machine. Trans. Chin. Soc. Agric. Mach. 2018, 49, 1–19. [Google Scholar] [CrossRef]
- Wang, Y.; Li, H.; Hu, H.; He, J.; Wang, Q.; Lu, C.; Liu, P.; Yang, Q.; He, D.; Jiang, S. A Noncontact Self-Suction Wheat Shooting Device for Sustainable Agriculture: A Preliminary Research. Comput. Electron. Agric. 2022, 197, 106927. [Google Scholar] [CrossRef]
- Wang, Y.; Li, H.; He, J.; Wang, Q.; Lu, C.; Liu, P.; Yang, Q. Design and Experiment of Wheat Mechanical Shooting Seed-Metering Device. Trans. Chin. Soc. Agric. Mach. 2020, 51, 73–84. [Google Scholar] [CrossRef]
- Wang, Y.; Li, H.; He, J.; Wang, Q.; Lu, C.; Liu, P.; Yang, Q. Parameters Optimization and Experiment of Mechanical Wheat Shooting Seed-Metering Device. Trans. Chin. Soc. Agric. Eng. 2020, 36, 1–10. [Google Scholar] [CrossRef]
- Wang, C.; Li, H.; He, J.; Wang, Q.; Lu, C.; Yang, H. Optimization Design of a Pneumatic Wheat-Shooting Device Based on Numerical Simulation and Field Test in Rice–Wheat Rotation Areas. Agriculture 2022, 12, 56. [Google Scholar] [CrossRef]
- Wang, C.; Lu, C.; Li, H.; He, J.; Wang, Q.; Cheng, X. Preliminary Bench Experiment Study on Working Parameters of Pneumatic Seeding Mechanism for Wheat in Rice-Wheat Rotation Areas. Int. J. Agric. Biol. Eng. 2020, 13, 66–72. [Google Scholar] [CrossRef]
- Wang, C.; Li, H.; Wang, J.; He, J.; Wang, Q.; Lu, C. CFD Simulation and Optimization of a Pneumatic Wheat Seeding Device. IEEE Access 2020, 8, 214007–214018. [Google Scholar] [CrossRef]
- An, X.; Cheng, X.; Wang, X.; Han, Y.; Li, H.; Liu, L.; Liu, M.; Liu, M.; Zhang, X. Design and Experimental Testing of a Centrifugal Wheat Strip Seeding Device. Agriculture 2023, 13, 1883. [Google Scholar] [CrossRef]
- Wang, J.; Sun, W.; Simionescu, P.A.; Ju, Y. Optimization of the Fluted Force-Feed Seeder Meter with the Helical Roller Using the Discrete Element Method and Response Surface Analysis. Agriculture 2023, 13, 1400. [Google Scholar] [CrossRef]
- Li, C.; Tang, Y.; McHugh, A.D.; Wu, X.; Liu, M.; Li, M.; Xiong, T.; Ling, D.; Tang, Q.; Liao, M.; et al. Development and Performance Evaluation of a Wet-Resistant Strip-till Seeder for Sowing Wheat Following Rice. Biosyst. Eng. 2022, 220, 146–158. [Google Scholar] [CrossRef]
- Xi, X.; Gao, W.; Gu, C.; Shi, Y.; Han, L.; Zhang, Y.; Zhang, B.; Zhang, R. Optimisation of No-Tube Seeding and Its Application in Rice Planting. Biosyst. Eng. 2021, 210, 115–128. [Google Scholar] [CrossRef]
- Han, J.; Du, J.; Gu, X.; Liu, L.; Li, Z.; Liu, C. Design and test of the separate and combined double row wide strip seedguiding device for wheat. Trans. Chin. Soc. Agric. Eng. 2023, 39, 35–46. [Google Scholar] [CrossRef]
- Lei, X.; Liao, Y.; Liao, Q. Simulation of Seed Motion in Seed Feeding Device with DEM-CFD Coupling Approach for Rapeseed and Wheat. Comput. Electron. Agric. 2016, 131, 29–39. [Google Scholar] [CrossRef]
- Lei, X.; Liao, Y.; Zhang, Q.; Wang, L.; Liao, Q. Numerical Simulation of Seed Motion Characteristics of Distribution Head for Rapeseed and Wheat. Comput. Electron. Agric. 2018, 150, 98–109. [Google Scholar] [CrossRef]
- Tang, H.; Xu, F.; Xu, C.; Zhao, J.; Wang, Y.-J. The Influence of a Seed Drop Tube of the Inside-Filling Air-Blowing Precision Seed-Metering Device on Seeding Quality. Comput. Electron. Agric. 2023, 204, 107555. [Google Scholar] [CrossRef]
- Liu, C.; Wei, D.; Du, X.; Jiang, M.; Song, J.; Zhang, F. Design and Test of Wide Seedling Strip Wheat Precision Hook-hole Type Seed-metering Device. Trans. Chin. Soc. Agric. Mach. 2019, 50, 75–84. [Google Scholar]
- Jiang, M.; Liu, C.; Wei, D.; Du, X.; Cai, P.; Song, J. Design and test of wide seedling strip wheat precision planter. Trans. Chin. Soc. Agric. Mach. 2019, 50, 53–62. [Google Scholar] [CrossRef]
- Niu, Q.; Wang, Q.; Chen, L.; Li, H.; He, J.; Li, W. Design and Experiment on Straw Post-covering Wheat Planter. Trans. Chin. Soc. Agric. Mach. 2017, 48, 52–59. [Google Scholar]
- Hu, H.; Li, H.; Li, C.; Wang, Q.; He, J.; Li, W.; Zhang, X. Design and Experiment of Broad Width and Precision Minimal Tillage Wheat Planter in Rice Stubble Field. Trans. Chin. Soc. Agric. Eng. 2016, 32, 24–32. [Google Scholar] [CrossRef]
- Zhu, Q.; Wu, G.; Chen, L.; Zhao, C.; Meng, Z.; Shi, J. Structural design and optimization of seed separated plate of wheat wide-boundary sowing device. Trans. Chin. Soc. Agric. Eng. 2019, 35, 1–11. [Google Scholar] [CrossRef]
- Shi, Y.; Chu, J.; Yin, L.; He, M.; Deng, S.; Zhang, L.; Sun, X.; Tian, Q.; Dai, X. Wide-range sowing improving yield and nitrogen use efficiency of wheat sown at different dates. Trans. Chin. Soc. Agric. Eng. 2018, 34, 127–133. [Google Scholar] [CrossRef]
- Luo, w.; Gu, F.; Wu, F.; Xu, H.; Chen, Y.; Xu, H. Design and Experiment of Wheat Planter with Straw Crushing and Inter-Furrow Collecting Mulching under Full Amount Of Straw and Root Stubble Cropland. Trans. Chin. Soc. Agric. Mach. 2019, 50, 42–52. [Google Scholar] [CrossRef]
- Sun, K.; Yu, J.; Liang, L.; Wang, Y.; Yan, D.; Zhou, L.; Yu, Y. A DEM-Based General Modelling Method and Experimental Verification for Wheat Seeds. Powder Technol. 2022, 401, 117353. [Google Scholar] [CrossRef]
- Lu, C.; Gao, Z.; Li, H.; He, J.; Wang, Q.; Wei, X.; Wang, X.; Jiang, S.; Xu, J.; He, D. An Ellipsoid Modelling Method for Discrete Element Simulation of Wheat Seeds. Biosyst. Eng. 2023, 226, 1–15. [Google Scholar] [CrossRef]
- Liu, F.; Zhang, J.; Li, B.; Chen, J. Calibration of Parameters of Wheat Required in Discrete Element Method Simulation Based on Repose Angle of Particle Heap. Trans. Chin. Soc. Agric. Eng. 2016, 32, 247–253. [Google Scholar] [CrossRef]
- Lei, X. Design and Working Mechanism of Air-Assisted Centralized Metering Device for Rapeseed and Wheat. Ph.D. Thesis, Huazhong Agricultural University, Wuhan, China, 2017. [Google Scholar]


| Item | Wheat Particle | PLA | Soil Board |
|---|---|---|---|
| Density/(kg/m3) | 1350 | 1060 | 2650 |
| Shear modulus/Pa | 5.1 × 10⁷ | 8.9 × 10⁸ | 1.0 × 10⁶ |
| Poisson ratio | 0.29 | 0.4 | 0.3 |
| Rolling friction coefficient (Interaction with wheat) | 0.08 | 0.05 | 0.3 |
| Static friction coefficient (Interaction with wheat) | 0.58 | 0.4 | 0.58 |
| Restitution coefficient (Interaction with wheat) | 0.50 | 0.6 | 0.52 |
| Cross Section/Ridge | Line | Arc | Ant-Arc |
|---|---|---|---|
| Line | 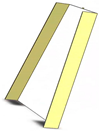 | 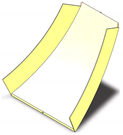 | 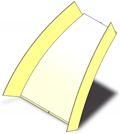 |
| S1 | S2 | S3 | |
| Arc | 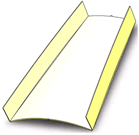 |  |  |
| S4 | S5 | S6 |
| Symbols | Parameters | Test Levels | ||||||
|---|---|---|---|---|---|---|---|---|
| Ridge parameters | A | The ridge length of the ridge line | mm | 50 | 75 | 100 | 125 | 150 |
| B | Installation inclination | ° | 20 | 25 | 30 | 35 | 40 | |
| C | The angle between chord and tangent of the end of ridgeline | ° | 5 | 10 | 15 | 20 | 25 | |
| Bottom parameters | D | Span | mm | 50 | 65 | 80 | 95 | 110 |
| E | Bottom transverse radius | mm | 50 | 80 | 110 | 140 | 170 | |
| Test Number | A/mm | B/° | D/mm | E/mm | Y/% |
|---|---|---|---|---|---|
| 1 | 75 | 36.5 | 98.75 | 110 | 42.18 |
| 2 | 75 | 29.5 | 76.25 | 110 | 56.67 |
| 3 | 100 | 33 | 87.5 | 90 | 39.04 |
| 4 | 50 | 33 | 87.5 | 90 | 51.65 |
| 5 | 100 | 33 | 87.5 | 90 | 35.91 |
| 6 | 75 | 36.5 | 76.25 | 70 | 42.51 |
| 7 | 100 | 26 | 87.5 | 90 | 46.93 |
| 8 | 125 | 36.5 | 76.25 | 110 | 37.38 |
| 9 | 125 | 36.5 | 98.75 | 70 | 32.72 |
| 10 | 100 | 33 | 65 | 90 | 50.63 |
| 11 | 125 | 36.5 | 98.75 | 110 | 33.32 |
| 12 | 75 | 36.5 | 98.75 | 70 | 40.8 |
| 13 | 75 | 36.5 | 76.25 | 110 | 50.96 |
| 14 | 100 | 33 | 87.5 | 90 | 35.4 |
| 15 | 75 | 29.5 | 76.25 | 70 | 48.5 |
| 16 | 100 | 33 | 87.5 | 90 | 38.83 |
| 17 | 125 | 29.5 | 76.25 | 70 | 43.87 |
| 18 | 100 | 33 | 87.5 | 90 | 37.73 |
| 19 | 75 | 29.5 | 98.75 | 110 | 39.87 |
| 20 | 150 | 33 | 87.5 | 90 | 40.85 |
| 21 | 100 | 33 | 87.5 | 50 | 31.94 |
| 22 | 100 | 33 | 87.5 | 130 | 42.78 |
| 23 | 100 | 40 | 87.5 | 90 | 33.36 |
| 24 | 75 | 29.5 | 98.75 | 70 | 39.32 |
| 25 | 125 | 29.5 | 76.25 | 110 | 45.44 |
| 26 | 100 | 33 | 110 | 90 | 42.59 |
| 27 | 125 | 29.5 | 98.75 | 110 | 39.26 |
| 28 | 125 | 29.5 | 98.75 | 70 | 37.11 |
| 29 | 100 | 33 | 87.5 | 90 | 37.72 |
| 30 | 125 | 36.5 | 76.25 | 70 | 32.89 |
| Source | Sum of Squares | df | Mean Square | F-Value | p-Value | Significance |
|---|---|---|---|---|---|---|
| Model | 1063.09 | 10 | 106.31 | 27.71 | <0.0001 | *** |
| A | 269.47 | 1 | 269.47 | 70.23 | <0.0001 | *** |
| B | 172.91 | 1 | 172.91 | 45.07 | <0.0001 | *** |
| D | 202.54 | 1 | 202.54 | 52.79 | <0.0001 | *** |
| E | 100.21 | 1 | 100.21 | 26.12 | <0.0001 | *** |
| AB | 28.78 | 1 | 28.78 | 7.50 | 0.0130 | ** |
| AD | 23.28 | 1 | 23.28 | 6.07 | 0.0235 | ** |
| BD | 36.60 | 1 | 36.60 | 9.54 | 0.0060 | *** |
| DE | 20.25 | 1 | 20.25 | 5.28 | 0.0331 | ** |
| A2 | 110.95 | 1 | 110.95 | 28.92 | <0.0001 | *** |
| D2 | 121.29 | 1 | 121.29 | 31.61 | <0.0001 | *** |
| Lack of Fit | 61.74 | 14 | 4.41 | 1.98 | 0.2328 | |
| Pure Error | 11.16 | 5 | 2.23 | |||
| Cor Total | 1135.99 | 29 |
Disclaimer/Publisher’s Note: The statements, opinions and data contained in all publications are solely those of the individual author(s) and contributor(s) and not of MDPI and/or the editor(s). MDPI and/or the editor(s) disclaim responsibility for any injury to people or property resulting from any ideas, methods, instructions or products referred to in the content. |
© 2023 by the authors. Licensee MDPI, Basel, Switzerland. This article is an open access article distributed under the terms and conditions of the Creative Commons Attribution (CC BY) license (https://creativecommons.org/licenses/by/4.0/).
Share and Cite
Luo, W.; Chen, X.; Qin, M.; Guo, K.; Ling, J.; Gu, F.; Hu, Z. Design and Experiment of Uniform Seed Device for Wide-Width Seeder of Wheat after Rice Stubble. Agriculture 2023, 13, 2173. https://doi.org/10.3390/agriculture13112173
Luo W, Chen X, Qin M, Guo K, Ling J, Gu F, Hu Z. Design and Experiment of Uniform Seed Device for Wide-Width Seeder of Wheat after Rice Stubble. Agriculture. 2023; 13(11):2173. https://doi.org/10.3390/agriculture13112173
Chicago/Turabian StyleLuo, Weiwen, Xulei Chen, Mingyang Qin, Kai Guo, Jie Ling, Fengwei Gu, and Zhichao Hu. 2023. "Design and Experiment of Uniform Seed Device for Wide-Width Seeder of Wheat after Rice Stubble" Agriculture 13, no. 11: 2173. https://doi.org/10.3390/agriculture13112173
APA StyleLuo, W., Chen, X., Qin, M., Guo, K., Ling, J., Gu, F., & Hu, Z. (2023). Design and Experiment of Uniform Seed Device for Wide-Width Seeder of Wheat after Rice Stubble. Agriculture, 13(11), 2173. https://doi.org/10.3390/agriculture13112173