Abstract
A seed-metering device is a key component for precision seeding and the core component of precision seed-metering devices. Nowadays, high-speed seeding is a trend in the development of seed-metering devices, but the filling performance of mechanical seed-metering devices decreases under the condition of high speed. Therefore, this paper explores a controllable method to improve the filling force of seeds, thereby increasing the limit operation speed of the existing mechanical seed-metering devices, so as to achieve high-speed seeding. The friction-filling method of friction vertical disc precision seed-metering devices was numerically simulated using the DEM. In this paper, the relationship between the relevant parameters and seed-filling force was confirmed via comparing theoretical formulas. The friction-filling method was studied via numerical simulation and experimental verification. This research demonstrated that during the process of friction filling, the pressure on the side wall of the tube increased with the e exponent with the change in the position of the particles. When the friction coefficient between the particles and the side wall is less than the friction coefficient between the particles, the e exponent increases. A surge occurs when the ratio of the square tube side length to the particle radius is .
1. Introduction
Providing more than 25% of the total protein for global food and animal feed, soybean is an important cash crop in China. In the foreseeable future, particularly in developing countries, the demand for soybeans is gradually increasing with rapid economic development, population growth and changes in dietary structure [1]. Among these countries, China is the world’s largest soybean consumer [2]; however, in recent years China has experienced a relative shortage in soybean supply, with a self-sufficiency rate of only about 13%. By 2020, China had purchased 100.3 metric tons (106 tons) of soybeans from the international market, which accounts for over 80% of domestic consumption and 61% of the global soybean trade [3]. To improve soybean self-sufficiency, the Chinese government has taken a series of measures to encourage farmers to expand their soybean planting areas [4]. With the implementation of a new-round soybean revitalization plan and the driving force from market demand, sown soybean areas are expected to expand further to an expected increase of a 9.69-million-acre (646,000-hectare) growing area of soybeans. And mechanized planting has become a development trend, because mechanized sowing, especially high-speed sowing, can effectively reduce labor intensity, greatly improve sowing efficiency and allow farmers to seize the farming season. The seed-metering device is the core component of seeding machinery. Compared with pneumatic seeders, mechanical seeders have a simpler structure, a lower price and easier maintenance [5], and they already have a certain market share in China, especially in farming-oriented rural areas. Unfortunately, the filling performance decreases and the leakage rate increases in high-speed operation, which makes it difficult to meet the requirements of precision seeding. In order to improve the seed-filling performance of the seed rower, Jia et al. designed a horizontal filling and agitating seed-metering device that consequently reduces the time required for seed filling by using horizontal open-type holes and a seed agitation device [6]. Cai et al. conducted a theoretical and experimental analysis of high-speed seed filling in a cotton precision hole seeder based on the stress of the seed set and the limited gear-shaped side space gap [7]. Based on the DEM, Li et al. numerically simulated the movement of seed particles in the filling process of a wheat pot-wheel variable seed feeder [8]. Wang et al. used EDEM to numerically simulate and verify the filling performance of a single ingot sugarcane seed-metering device [9]. Gao et al. found that inside the filling space of the device, a better filling capacity could be achieved by a better match between the particle velocity and the filling performance [10]. Wu et al. studied the unmeasurable seed motion characteristics by measuring the vibration characteristics of the seed discharge device based on DEM simulation, and determined the filling characteristics under vibration conditions via a bench test [11]. Lai et al. adopted EDEM software based on the discrete element method to conduct a simulation, calculation and analysis of the seed discharge performance of a seed discharge device under four different groove wheel speeds and six different mixing wheel speeds [12]. Liu et al. pointed out that when the suction hole is used for high-speed seeding, it is difficult to quickly and stably suck seeds, and a working negative pressure is required. A seed tray hole with a variable section structure was designed, and the groove depth with an auxiliary seed-filling function was optimized [13]. These studies provide feasible solutions for enhancing the seed-filling performance of seed-metering devices, but they mostly focus on the way of reducing seed filling that uses the frictional force of the mechanical seed rower discharge disc to make seeds flow and increase the seed-filling force. However, as the seed-filling force is difficult to measure, current research on this method is limited to theoretical derivation and physical verification.
In recent years, there have been a large number of successful cases combining DEM simulation studies with agricultural machinery design [14]. Han et al. conducted DEM research on the grain conveying part of the spiral section of the feed of a vertical rice mill [15]. Gao et al. used a coupled CFD-DEM to study a new quantitative seed feeding system with a feeding device and a venturi feeding tube. The flow behavior and air flow field of seed particles in the system were analyzed in detail [16]. Zhang et al. conducted DEM simulation on the critical height of the flow mechanism transition in a cone bin [17]. Tang et al. studied the movement of corn seeds in a seed drop tube based on a coupled DEM-CFD simulation [18]. Gao et al. studied a quantitative feeding device with a staggered symmetrical groove wheel by using the DEM [19]. Ren et al. coupled computational fluid dynamics (CFD) and the discrete element method (DEM) to simulate and analyze the hazelnut motion state, particle distribution and air flow field distribution of a pneumatic conveying device from inlet to outlet, and evaluate the cleaning performance from the perspective of the net fruit rate of hazelnuts inside the cleaning box [20]. Xiao et al. used DEM-CFD to analyze the effects of three types of seed guide tubes on the movement characteristics of seed particles in an oilseed seed drill [21]. Han et al. designed a screw-type soil separation mechanism to solve the problem of drain blockage and soil flatness reduction caused by soil accumulation during ditching with a ploughshare-type composite seeder. Based on the discrete element method, the screw-type soil separation mechanism of the composite seed-metering device was simulated and tested [22].
Compared with the traditional methods, numerical simulation has proven to be an effective tool for obtaining particle microscopic information in the study of particle systems. Cundall [23] and Strack proposed that the discrete element method (DEM) could provide detailed particle flow information on velocity, stress, torque, etc. at the microscopic level, especially for the progress made in particle flow. Information on contact force between seed particles and mechanical components, as well as the velocity and displacement of seed particle motion, is very important for analyzing the working performance of agricultural machinery and optimizing the components. And the discrete element method has become a common method for analyzing the contact action between seed particles and mechanical components [24]; it has been widely used in the field of agricultural engineering. To the knowledge of the executive author, there is no research on specific control parameters for the frictional seed-filling method.
Overall, this paper aims to address the problem that the filling performance of mechanical seed feeders decreases under high-speed conditions. A friction seed-filling method was proposed to control the filling force of seeds and improve the limit operation speed of an existing mechanical seed-metering device, so as to achieve high-speed seeding. In this paper, a seed simulation model was established, the tubular space of the seed-filling area was selected as the geometric simulation model, and a bench test was designed. The relationship between relevant parameters and seed-filling force was confirmed via comparing theoretical formulas. The friction-filling method was studied using numerical simulation and experimental verification, and the reliability of the model was verified. This research can allow us to obtain the optimal filling effect for a mechanical seed-metering device under high-speed conditions, so as to improve the working efficiency of the machine.
2. Seed-Metering Device Structure and Friction Seed Method Principle
A vertical disc device is a typical mechanical precision metering device with a simple structure and reliable working performance [25]. Figure 1 shows the main structure of the friction-type vertical disc precision seed-metering device. The device mainly consists of a seed inlet, frictional seed-metering disc (composed of a seed cell disc and an inner and outer friction ring fixed together), pressure plate, seed cleaning wire, seed guard plate, seed discharge shaft, etc.
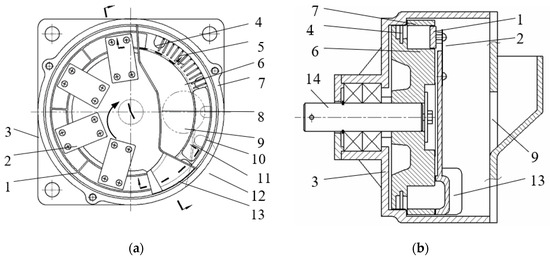
Figure 1.
Friction-type vertical plate precision seed-metering device. 1. Clamp plate. 2. Leaf spring. 3. Shell. 4. Friction seed tray. 5. Seed cleaning wire. 6. Internal friction ring on seed tray. 7. External friction ring on seed tray. 8. Septum. 9. Feed hole. 10. Seed guard plate. 11. Push wire. 12. Seed port. 13. Filling inlet. 14. Seeding shaft and assembly. (a) Front view (seed hole removed on right). (b) Side view (A-A direction view).
When sowing is taking place, seeds go through the seed inlet hole via the seed delivery tube and enter into the seed chamber, composed of seed rower shells and spacers. Located in the middle of the seed chamber, the seed inlet is restricted by its location, and the seeds in the seed chamber are not filled, thus avoiding the problem of excessive seeds inside the seed chamber. Consequently, the seeds can flow into and out of the seed-filling area smoothly, and meet the conditions for seed filling and seed cleaning.
The seeds inside the seed chamber flow into the seed-filling inlet via gravity first, and then the conical structure of the seed-filling inlet ensures a continuous flow of seeds into the seed-filling space. The seed-filling inlet, the four independently movable elastic pressure plates and the seed row disc (including the seed cell disc and the inner and outer friction rings) constitute the seed-filling space with a rectangular cross section. When the seed row disc rotates, the seeds flow because of the friction generated by the type of hole disc and the inner and outer friction rings on the seed group in the seed-filling space, resulting in less relative movement between the seed and the seed cell. If the seed flow is blocked, it is affected by the blocking pressure contrary to the seed flow, and the seed bulk is also subjected to normal pressure in the perpendicular direction to that of the seed flow, consequently providing the seed-filling force to the seed cell direction and increasing the ultimate filling speed of the seed cell. By studying the parameters of the pre-pressure on the pressure plate, spring stiffness and surface shape, it is possible to subject the seed flow to a constant blocking force and normal pressure of the pressure plate to ensure a steady seed-filling force and to avoid seed breakage.
The principle of the frictional seeding method is illustrated in Figure 2. The group of granules in the rectangular tubular space (seeding area) in Figure 2a is taken as the study object, ignoring gravity. Since the granules are relatively small, they are viewed as a continuum with a rectangular cross section so as to simplify the analysis process. Then the microsegment dx of the granule group is taken as the study object, and the flow direction along the granules is set as positive. The force analysis of the microsegment dx is shown in Figure 2b. Three sides of the granules in the rectangular tubular space—the top, bottom and front—are subjected to friction to the left while the back is subjected to friction to the right and the right ends are subjected to the forces of other granules.
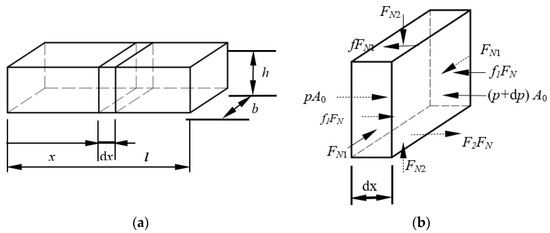
Figure 2.
Schematic diagram of friction seed-filling method. (a) Rectangular tubular space (seed-filling area). (b) Stress on microsegment of seed group.
The hydrostatic equation for the horizontal direction of the microsegment is as follows:
Among these terms, , , , p0 is the pressure on the section, A0 is the area of the section, b is the rectangular pipe section side length, is the normal force at the bottom of the rectangular tubular space (filling area) on the front and back of the microsegment of the seed group, is the normal forces on both sides of the rectangular tubular space (filling area) on the upper and lower segments of the seed group facing the particles, f is the dynamic friction factor between the particle body and the pressure plate on both sides of the mold hole, f1 is the dynamic friction factor between the particle and the friction element on both sides of the mold hole, f2 is the ratio of the pressure in other directions of the microsegment to the pressure in the left and right end faces and μ is the ratio of the pressure in other directions of the microsegment to the pressure in the left and right end faces.
Formula (2) is as follows:
where p0 represents a uniformly distributed initial pressure acting at the end face, x = 0, of the rectangular granule group. The magnitude of p0 is determined by the height, density, internal friction angle, friction angle between the seeds and the seed row seat, and the friction angle between the seeds and the spacer inside the seed row, which can be estimated according to the bulk theory deep bin model [26].
Equation (3) is integrated as follows:
where l0 is length of the seed bulk and x is the sectional position of a rectangular tubular space.
The pressure on each cross section of the seed population in the tubular space is obtained by taking the logarithm of both sides of Equation (3).
From Equation (4), it can be calculated that the pressure p of each section of the granule group in the rectangular tubular space increases exponentially with the position x of each section as well as the friction coefficient f between the granule and the side wall, which makes the pressure of the granule against the side wall greater than its own gravity, so that it can quickly enter between the seed clamping block and the seed pressure ring to complete the seed-filling process. At the same time, the seeds move together with the seed discharge disc, which reduces the relative speed between the seeds and the seed-metering disc so as to reduce the influence of the seed inertia force on the seed-filling performance.
3. Materials and Methods
3.1. Description of the Simulation System
3.1.1. Mechanical Contact Model
In order to simulate the effect of each parameter on the filling force in the frictional seeding method, this paper used a 3D DEM model based on the soft sphere model with no bonding force and no liquid bridge. In DEM simulations, properties of individual particles are considered to simulate the overall behavior of the whole system discretely. Each particle is tracked and its motion is governed by Newton’s second law [27].
Translation movement:
Rotational movement:
where and are the translational and angular velocities of particles at mass and rotational inertia respectively, is the number of particle–particle collisions, is the normal damping force, is the normal contact force and similarly, is the tangential damping force and is the tangential contact force. And the torque originates from two components, , tangential force, and , rolling friction.
In the EDEM model, the no-slip Hertz–Mindlin model is chosen to calculate the forces and moments between the particles. Hertz’s complete theory of normal contact and Mindlin’s tangential problem are the more detailed models used for collision simulations [28]. The formulas to calculate the normal total force, tangential total force, tangential torque and frictional torque can be found in Ref. To achieve brevity, they are not repeated here [29].
3.1.2. DEM Model of Particles and Geometry
As in many studies, irregular particles in DEM simulation are usually modeled via the application of the multi-sphere method, as in the modeling of wheat seeds by Lai et al. [30]. However, in simulations, grain crop seeds like soybeans are seen as a typical bulk granule material and most of them are simplified to a spherical or nearly spherical shape [31]. In this paper, soybean seeds are simplified to a circular sphere in order to study the general laws of frictional seed-filling methods, to facilitate the research into the effect of the ratio of particle radius to rectangular tubular space side length on filling forces and to shorten simulation time. The shape of soybeans is approximately ellipsoidal, but the sphericity is high, with 90% of the particles being approximately spherical. Therefore, round spheres can be used to simulate the shape of soybean particles, as shown in Figure 3. While other characteristics are the same as in previous studies [32], the simulation parameters related to the particle body and geometry are shown in Table 1 [33].
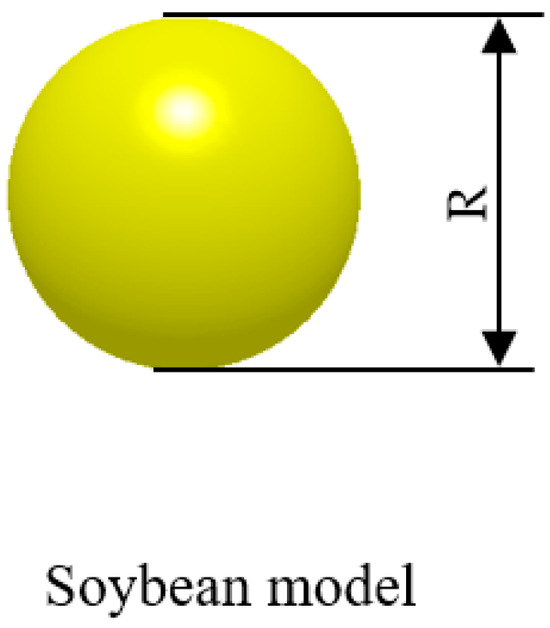
Figure 3.
Three-dimensional models of materials.

Table 1.
Physical parameters and their values in the simulations.
EDEM simulation of the friction charging method was performed after commercial EDEM 2.6 software was installed on an Intel Core i5 dual-core processor with 8 G RAM and a Win10 64-bit operating system.
The geometry model for EDEM simulation is shown in Figure 4, including four independent planes: the front, the back, the top and the bottom. The upper plane is installed with a channel to assist the granules in entering the rectangular tubular space, and the particle factory is built on the virtual plane at the topmost part of the channel to generate 1000 particles per second at random positions on the factory plane, and the channel has a certain height to provide a certain initial pressure when the granules are stacked to fill the whole geometry; the front plane is L-shaped, and the right baffle makes the granules’ motion obstructed, which provides a certain resistance. The upper, lower and rear planes are added to the moving plane model with the velocity direction horizontal to the right and the velocity size being 3 m/s. The particle radii were taken as 2, 2.25, 2.5, 2.75, 3, 3.25, 3.5, 3.75 and 4 mm, while the friction coefficients between the particles and the geometry were taken as 0.1, 0.2, 0.3, 0.4, 0.5, 0.6, 0.7, 0.8 and 0.9, respectively. These parameters of each level were paired for full-factor simulation experiments. A total of 150 mm was taken from the right side of the rectangular space and divided into 10 segments, with 10 grid bin groups inserted. After the macro stability of the particles in the tube lasted 3 s, the average value of the granule group was recorded using the grid bin group. As the internal force chain structure of the granule group is related to its formation process and particle positions are made randomly by the particle factory, the process was repeated three times and only the average of the three data was used for statistical analysis.
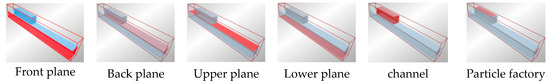
Figure 4.
Geometric model of DEM simulation.
3.2. Experimental Setup and Procedure
The experimental equipment is shown in Figure 5, including the bracket, sliding rail, slider, acrylic square tube, sensor, dynamic signal collector and laptop. Among these items, the acrylic square pipe was measured as follows: 1500 mm for the length of the bottom and back; 1470 mm for the length of the top; 25 mm for the width. When fixed together, it was installed on the slider and the slider could slide left and right on the side rail. After the 200 mm long front and 25 mm in wide slider was fixed on the bracket, 8 mm diameter round holes were drilled every 30 mm apart on its front from right to left, and a total of five circular holes were arranged for mounting the sensor probe for the installation of the sensor probe. The sensor was an XL1155-type resistance strain sensor produced by Qinhuangdao Xie’ll Technology Development Co., Ltd. (Qinhuangdao, China), with a sensitivity of 2 mV/V. It was fixed on the bracket with an 8 mm diameter probe and inserted into the square tube through the round hole on the acrylic square tube, which paralleled with the inner wall of the square tube for measuring the pressure of the particles inside the tube against the tube wall. The sensor was connected to the dynamic signal collector through the network cable, and the dynamic signal collector was a JM5937A-type dynamic signal collector produced by Yangzhou Jingming Technology Co., Ltd. (Yangzhou, China), with its sampling rate up to 100 KHz/CH. The collected signals were input into the laptop through USB2.0, and the data were analyzed using JMTEST dynamic signal testing and analysis software Ver8.2. In order to change the static friction coefficient with soybean seeds, the inner wall of the acrylic square tube was left untreated or treated with patterned paper or carved with patterns by a carving machine. The friction coefficients were 0.6, 0.7 and 0.8, respectively. The treated surface is shown in Figure 6. In order to make the experimental granules close to reality, Heihe43 soybean seeds were chosen for the experiment, and after the sorting machine sorted out the seeds with roundness within the range of 2~4 mm, a radius of 3.25 mm and 3.75 mm seeds were selected with the help of a perforated sieve as experimental materials. At the same time, in order to reduce the influence of vibration on the experimental results, the experiment involved using cold gel to bond the sensor to the experimental device to ensure that the force data from the sensor were more authentic.
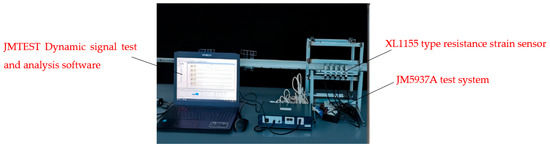
Figure 5.
Experimental equipment.
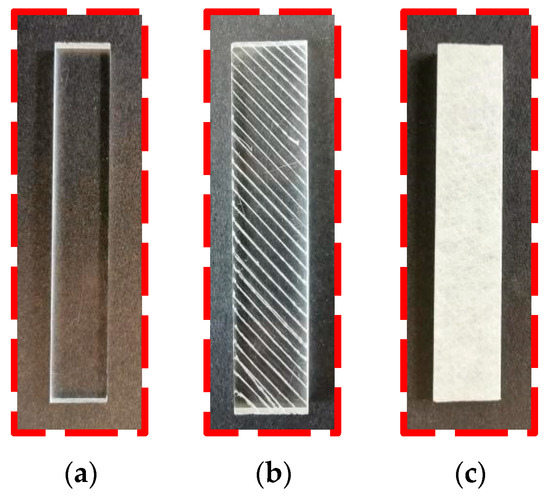
Figure 6.
Three different surface treatments of acrylic square pipe. (a) Pipe wall is not treated. (b) The wall of the pipe is carved. (c) Tube wall pasted with decorative paper.
The experiment involved first using 0.5 kg weights to calibrate the sensor. The slider and acrylic square tube, together with its three connected surfaces, were moved to the right side of the body and paralleled to the front plane. The gap formed by the shorter top in the square tube was filled with soybean seeds, then the slider and acrylic square tube with its three connected surfaces were moved to the rightmost side of the body. The measurement device was opened, then the slider square tube was pulled while it connected the three faces to the left. Continuous recording of the pressure was collected by the sensor. Two particle radii and three friction coefficients were tested for full-factor experiments, with each group repeated five times so that the average value of the pressure was collected by the sensor as an experimental datum.
4. Results and Discussion
4.1. Model Validation
The data analysis graph is shown in Figure 7, Figure 8 and Figure 9, and the experimental results are shown in Table 2. By substituting the data in Table 2 into Formula (4), it can be concluded that the pressure of the particle on the side wall increases with the displacement as an E-exponent; the friction coefficient between the particle and the side wall increases with the e exponent when the friction coefficient is less than the interparticle friction coefficient, and tends to be constant when the friction coefficient is greater than or equal to the interparticle friction coefficient. When the ratio of the rectangle side length to the radius of the particle is , the pressure value of the particle on the side wall of the rectangle surges. Therefore, the correctness and practicability of the theoretical analysis can be verified. Figure 8 and Figure 9 show the influence of the three selected factors on the experiment according to the data results in Table 2. The line in the figure has no actual meaning. By observing the data points, the experimental results can be compared with a certain section of the simulation results, and the simulation results are basically consistent with the experimental results. The “Location” in the figure below indicates the location of the particle in the tubular space.
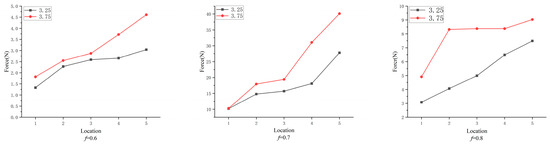
Figure 7.
The change in pressure on the particle with displacement under different friction coefficients and different width-to-diameter ratios.
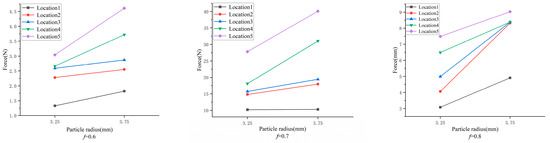
Figure 8.
The change in pressure on particle with radius under different displacements and friction coefficients.
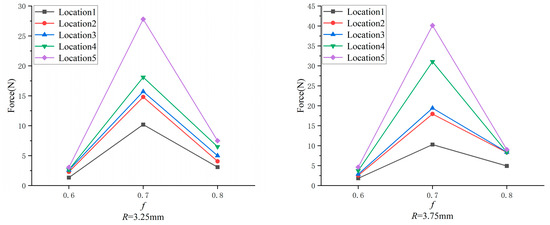
Figure 9.
The change in pressure on particles with friction coefficient under different displacements and radii.
Table 2.
Results of bench test.
4.2. Simulation Results and Analysis
In order to present the simulation results visually, some screenshots of the simulation experiments were made with different particles under different forces rendered in different colors, and the results are shown in Figure 10. It can be seen that the location, the friction coefficient between the granules and the side wall, and the particle radius all have certain effects on the granules.
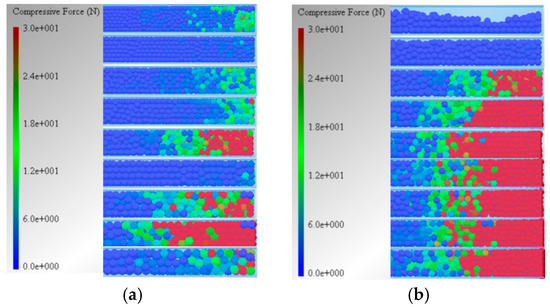
Figure 10.
Some simulation results. (a) Experimental results under different particle radii. (b) Experimental results of friction coefficient between different particles and geometry.
4.2.1. The Effect of Position on the Force on the Granules
The variation in the pressure on the granules and different width-to-diameter ratios change with displacement at different friction coefficients, as is shown in Figure 11. And it can be seen that when the friction coefficient is 0.1, the friction force cannot effectively drive the granules to fill the entire tubular space; that although the pressure on the granules slightly increases with displacement, there is no evident functional relationship between the two; and that when the friction coefficient is greater than or equal to 0.2 and less than 1, the pressure on the granules with displacement increases continuously and the speed at which it increases accelerates as well. The simulation data at f = 0.3 were fitted with the e-exponential form, and the fitting results are shown in Figure 12, which shows that the e-exponential form can be a good fit for the experimental data. This is consistent with the theoretical formula.
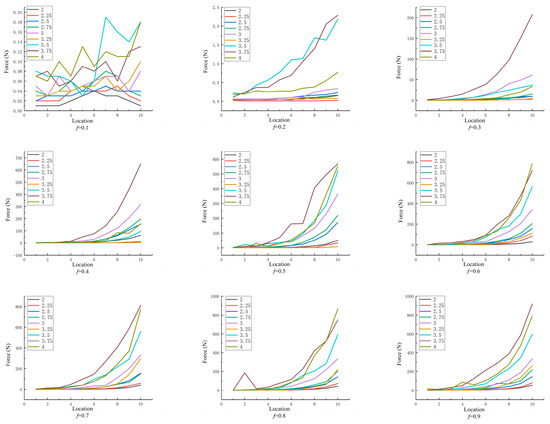
Figure 11.
The change in pressure on particles with displacement under different friction coefficients and width-to-diameter ratios.
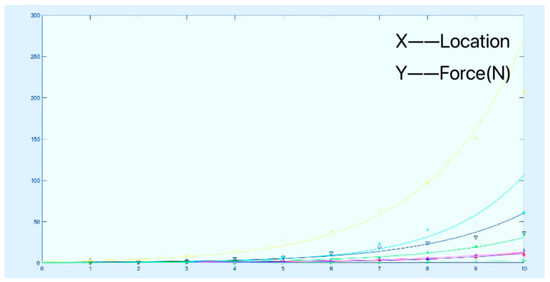
Figure 12.
When f = 0.3, the simulation data fit the results.
The simulation data when f = 0.3 were taken and fitted in the form of an e index. The fitting results are shown in Figure 12, and it can be seen that the e index can better fit the experimental data, which is consistent with the results derived from the theoretical formula.
4.2.2. Effect of Friction Coefficient on the Force on the Granules
Under different displacements and different width-to-diameter ratios, the pressure on the granules varies with the friction coefficient, as is shown in Figure 13. It can be seen that when the friction coefficient is smaller than that between the granules, the pressure on the granules increases with the rise in the friction coefficient, and the increase rate rises, which is consistent with the theoretical equation. When the friction coefficient is greater than that between the particles, the pressure on the granules changes little and fluctuates around a certain constant value. The reason for this is that when the friction coefficient between the side wall of the rectangular tubular space and the granules is greater than the interparticle friction coefficient, the relative sliding between the side wall and the contracting layer of granules reduces, and meanwhile the relative sliding between the granules in contact with the side wall and the inner layer of granules is greater. When the outer wall drives the motion of the contacting layer of particles, the inner layer of particles is only subjected to the friction of the outer layer of particles. As a result, if the friction coefficient continues to increase, the effect from the pressure of the granules is minimal, but there are still certain fluctuations, which is mainly due to the fact that the side wall cannot steadily maintain its contact with the contacting layer of the granules, so that this layer of the granules generates certain fluctuations and there is relative rolling between the side wall and the granules, which also contributes to the fluctuations in the pressure on the granules. As is shown in Figure 14, the friction coefficient between the geometry and particles is 0.7; the right side of the geometry is the moving side wall; when the side wall drives the granules to move, the speed of the contacting particles is obviously faster than that of the granules in other parts.
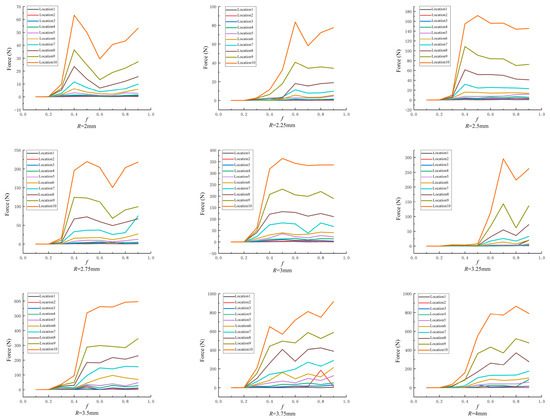
Figure 13.
The change in pressure on particles with friction coefficient under different displacements and width-to-diameter ratios.
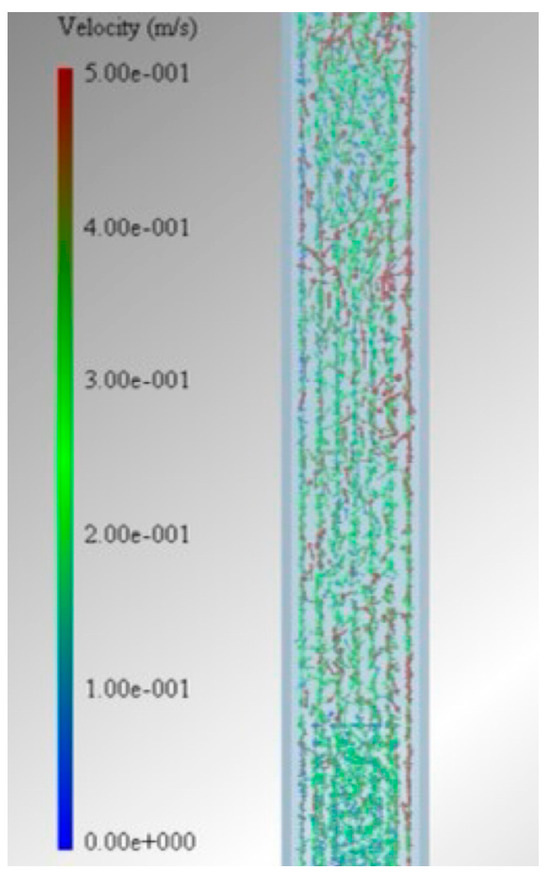
Figure 14.
Velocity diagram of particles at f = 0.7.
When the friction coefficient between the particle and the geometry is 0.7, the right side of the geometry is a moving side wall, and the side wall drives the particle to move, and the velocity of the particle in contact with it is greater than that of the particle in contact with the stationary side wall on the left side of the geometry, which is consistent with the above analysis.
4.2.3. Effect of Width-to-Diameter Ratio on the Force on the Granules
In order to avoid meaningless simulation experiments in which the radius of the particle and the edge length of the geometry section are changed at the same time and the experimental model scales up and down in equal proportions in the simulation process, the edge length of the geometry section and the particle radius were considered in the ratio of the geometry section’s edge length to particle radius d (referred to as the width-to-diameter ratio), as is shown in Figure 15. It can be seen that when the friction coefficient is 0.1, the particles cannot be effectively driven to fill the entire tubular space due to friction. Although the pressure on the particle increases with the particle radius, there is no obvious functional relationship between the two. When the friction coefficient is 0.2 to 1, the pressure on the granules increases when the width-to-diameter ratio reaches a certain value, and the analysis shows that the pressure increases at the point where the width-to-diameter ratio is (n + 2) to .
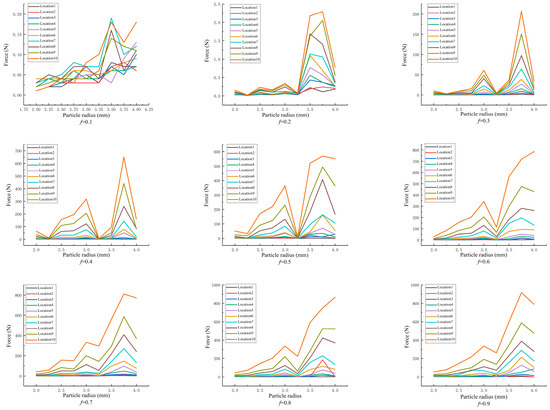
Figure 15.
The change in pressure on particles with width-to-diameter ratio under different displacements and friction coefficients.
The reason for this is that when the width-to-diameter ratio is (n + 2) to (n + 2) (n = 1, 2, 3…), the natural accumulation of granules in the rectangular tubular space can result in the formation of the accumulation state, as is shown in Figure 16. In this state, the gap between particles is the smallest. Any disturbance from the friction of the side wall increases the gap between the granules, resulting in the increased overall volume of the granule group and a surge in pressure on the granules. The principle is similar to the phenomena of granule extrusion and expansion.
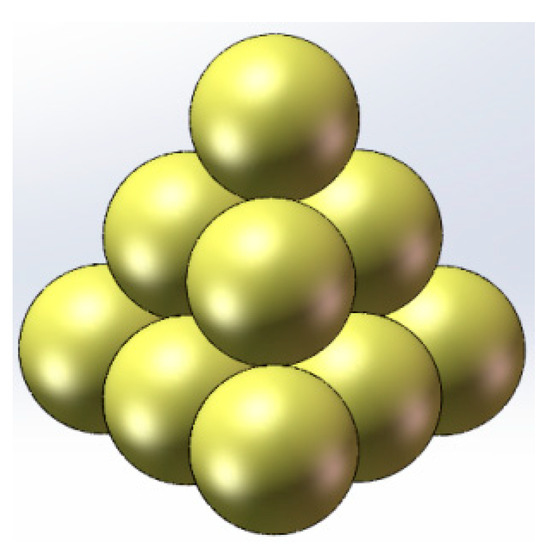
Figure 16.
Natural accumulation form of particles.
Figure 17 illustrates the distribution of particle porosity in the tubular space at rest and in motion when the radius of particles is 3.75 mm and 3.25 mm, respectively. It can be seen from the figure that when the width-to-diameter ratio is 3.75 mm, the porosity of particles in the tubular space is larger when the side wall is at rest, and it decreases when the side wall is in motion except in the rightmost area where the particles are under greater pressure. When the width-to-diameter ratio is 3.25 mm, the porosity of the granules in the tubular space is smaller on the outside and larger on the inside when the side wall is stationary, and it is larger on the outside and smaller on the inside when the side wall is moving, but the overall porosity value does not change much. These points are consistent with the analysis results.
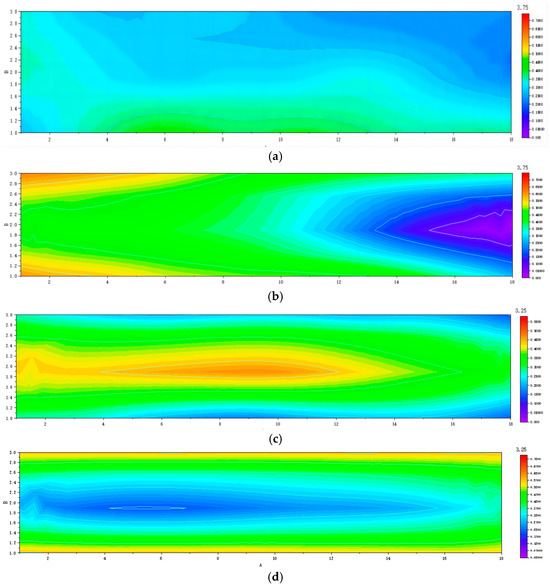
Figure 17.
Distribution nephogram of particle porosity in tubular space. (a) When the particle radius is 3.75 mm, the distribution of particle porosity in tubular space is under stationary state. (b) When the particle radius is 3.75 mm, the distribution of particle porosity in tubular space is under moving state. (c) When the particle radius is 3.25 mm, the distribution of particle porosity in tubular space is under stationary state. (d) When the particle radius is 3.25 mm, the distribution of particle porosity in tubular space is under moving state.
4.3. Discussion
- In this paper, the effects of different friction coefficients and different particle sizes on the particle-filling properties were verified via numerical analysis and experiments. The experimental results are basically consistent with the numerical simulation results, which verifies the correctness of the numerical simulation. In addition, the effects of different friction coefficients and particle sizes on the filling properties were also considered, which provides a theoretical basis for the optimization of the particle-filling process.
- However, there are some shortcomings in this study. First of all, only the seeds of one crop were selected for study in the experiment, and the seed-filling performance of other crops was not studied. Second, there may be some assumptions and simplifications in the numerical simulation, and the complexity of the actual situation may not be fully considered. Based on the results of this study, possible future research directions include the following: further study on the seed-filling performance of different crops via exploring the filling characteristics and optimization methods of different crops’ seeds; further improvement of the numerical simulation method via considering more practical factors and improving the accuracy of simulation results; and studying the flow and accumulation characteristics in the particle-filling process to provide more theoretical support for the design and optimization of particle-filling equipment.
5. Conclusions
A numerical simulation of the friction charging method was conducted, and the simulation results were used to verify and modify the original theoretical equation. And it was concluded that the pressure of the granules on the side wall increases e-exponentially with displacement; the friction coefficient between the granules and the side wall increases e-exponentially when the friction coefficient is smaller than the interparticle friction coefficient, and tends to be constant when the friction coefficient is greater than or equal to the interparticle friction coefficient; and the pressure value of the particle body on the rectangular side wall increases sharply when the ratio of the rectangular side length to the radius of the granules is . This study enabled deep understanding of how the mechanism of the friction coefficient and particle size affect the filling performance during the particle-filling process, and provided a theoretical basis for the design and optimization of particle-filling equipment. This study’s practical significance is that it can lead to improving the working efficiency and precision of particle-filling equipment, reducing the waste and loss of seeds and improving the benefits of agricultural production.
This validation experiment verified the correctness of numerical simulation results and further proved that DEM simulation is an effective method to study the motion of granules.
Author Contributions
Conceptualization, Y.W.; formal analysis, X.K.; investigation, X.K.; methodology, X.K.; project administration, W.J.; resources, W.J.; software, G.W.; supervision, Y.W.; validation, X.K.; writing—original draft, X.K.; writing—review and editing, Y.W. All authors have read and agreed to the published version of the manuscript.
Funding
The authors gratefully appreciate the financial supported by the earmarked fund for CARS (CARS-04).
Institutional Review Board Statement
Not applicable.
Informed Consent Statement
Not applicable.
Data Availability Statement
The data presented in this study are available on request from the corresponding author.
Conflicts of Interest
The authors declare no conflict of interest.
References
- Liu, Z.T.; Ying, H.; Chen, M.Y.; Bai, J.; Xue, Y.; Yin, Y.; Batchelor, W.D.; Yang, Y.; Bai, Z.; Du, M.; et al. Optimization of China’s maize and soy production can ensure feed sufficiency at lower nitrogen and carbon footprints. Nat. Food 2021, 2, 426–433. [Google Scholar] [CrossRef] [PubMed]
- Zhao, J.C.; Wang, Y.X.; Zhao, M.Y.; Wang, K.C.; Li, S.; Gao, Z.Z.; Shi, X.Y.; Chu, Q.Q. Prospects for soybean production increase by closing yield gaps in the Northeast Farming Region, China. Field Crops Res. 2023, 293, 108843. [Google Scholar] [CrossRef]
- FAOSTAT. FAO Statistical Database. 2022. Available online: https://www.fao.org/faostat (accessed on 1 July 2023).
- Wu, F.; Geng, Y.; Zhang, Y.Q.; Ji, C.X.; Chen, Y.F.; Sun, L.; Xie, W.; Ali, T.; Fujita, T. Assessing sustainability of soybean supply in China: Evidence from provincial production and trade data. J. Clean. Prod. 2020, 244, 119006. [Google Scholar] [CrossRef]
- Xiong, D.Y.; Wu, M.L.; Xie, W.; Liu, R.; Luo, H.F. Design and Experimental Study of the General Mechanical Pneumatic Combined Seed Metering Device. Appl. Sci. 2021, 11, 7223. [Google Scholar] [CrossRef]
- Jia, H.; Chen, Y.; Zhao, J.; Guo, M.; Huang, D.; Zhuang, J. Design and key parameter optimization of an agitated soybean seed metering device with horizontal seed filling. Int. J. Agric. Biol. Eng. 2018, 11, 76–87. [Google Scholar] [CrossRef]
- Cai, Y.Q.; Luo, X.; Hu, Z.B.; Li, J.W.; Guo, M.Y.; Wang, J. Theoretical and experimental analyses of high-speed seed filling in limited gear-shaped side space of cotton precision dibbler. Comput. Electron. Agric. 2022, 200, 107202. [Google Scholar] [CrossRef]
- Li, Z.D.; Zhong, J.Y.; Gu, X.; Zhang, H.; Chen, Y.X.; Wang, W.W.; Zhang, T.; Chen, L.Q. DEM Study of Seed Motion Model-Hole-Wheel Variable Seed Metering Device for Wheat. Agriculture 2022, 13, 23. [Google Scholar] [CrossRef]
- Wang, M.M.; Liu, Q.T.; Ou, Y.G.; Zou, X.P. Numerical Simulation and Verification of Seed-Filling Performance of Single-Bud Billet Sugarcane Seed-Metering Device Based on EDEM. Agriculture 2022, 12, 983. [Google Scholar] [CrossRef]
- Gao, X.J.; Cui, T.; Zhou, Z.Y.; Yu, Y.B.; Xu, Y.; Zhang, D.X.; Song, W. DEM study of particle motion in novel high-speed seed metering device. Adv. Powder Technol. 2021, 32, 1438–1449. [Google Scholar] [CrossRef]
- Wu, W.C.; Chang, C.; Li, T.; Hu, H.; Zhou, Z.; Yang, W.; Guo, J.; Zhu, P.; Li, J.; Hu, J.; et al. Seed-Filling Characteristics of a Centralized Seed-Metering Device for Rapeseed Caused by Vibration. Agriculture 2022, 12, 965. [Google Scholar] [CrossRef]
- Lai, Q.H.; Hua, Z.W.; Xing, J.L.; Ma, W. Simulation and verification for seed-filling performance of cell wheel precision seed metering device based on discrete element method. MATEC Web Conf. 2018, 169, 01035. [Google Scholar] [CrossRef][Green Version]
- Liu, R.; Liu, Z.; Zhao, J.; Lu, Q.; Liu, L.; Li, Y. Optimization and Experiment of a Disturbance-Assisted Seed Filling High-Speed Vacuum Seed-Metering Device Based on DEM-CFD. Agriculture 2022, 12, 1304. [Google Scholar] [CrossRef]
- Wang, Y.; Yu, J.Q.; Yu, Y.J.; Zhang, Q. Validation of a coupled model of discrete element method with multibody kinematics to simulate the screening process of a swing-bar sieve. Powder Technol. 2019, 346, 193–202. [Google Scholar] [CrossRef]
- Han, Y.; Jia, F.; Zeng, Y.; Jiang, L.; Zhang, Y.; Cao, B. DEM study of particle conveying in a feed screw section of vertical rice mill. Powder Technol. 2017, 311, 213–225. [Google Scholar] [CrossRef]
- Gao, X.J.; Zhou, Z.Y.; Xu, Y.; Yu, Y.; Su, Y.; Cui, T. Numerical simulation of particle motion characteristics in quantitative seed feeding system. Powder Technol. 2020, 367, 643–658. [Google Scholar] [CrossRef]
- Zhang, Y.X.; Jia, F.G.; Zeng, Y.; Han, Y.L.; Xiao, Y.W. DEM study in the critical height of flow mechanism transition in a conical silo. Powder Technol. 2018, 331, 98–106. [Google Scholar] [CrossRef]
- Tang, H.; Xu, F.D.; Xu, C.S.; Zhao, J.L.; Wang, W.J. The influence of a seed drop tube of the inside-filling air-blowing precision seed-metering device on seeding quality. Comput. Electron. Agric. 2023, 204, 107555. [Google Scholar] [CrossRef]
- Gao, X.; Xie, G.; Xu, Y.; Yu, Y.; Lai, Q. Application of a staggered symmetrical spiral groove wheel on a quantitative feeding device and investigation of particle motion characteristics based on DEM. Powder Technol. 2022, 407, 117650. [Google Scholar] [CrossRef]
- Ren, D.Z.; Yu, H.L.; Zhang, R.; Li, J.; Zhao, Y.; Liu, F.; Zhang, J.; Wang, W. Research and Experiments of Hazelnut Harvesting Machine Based on CFD-DEM Analysis. Agriculture 2022, 12, 2115. [Google Scholar] [CrossRef]
- Xiao, Y.; Ma, Z.; Wu, M.; Luo, H. Numerical Study of Pneumatic Conveying of Rapeseed through a Pipe Bend by DEM-CFD. Agriculture 2022, 12, 1845. [Google Scholar] [CrossRef]
- Han, L.; Yuan, W.; Yu, J.; Jin, J.; Xie, D.; Xi, X.; Zhang, Y.; Zhang, R. Simulation and Experiment of Spiral Soil Separation Mechanism of Compound Planter Based on Discrete Element Method (DEM). Agriculture 2022, 12, 511. [Google Scholar] [CrossRef]
- Cundall, P.A.; Strack, O.D. A discrete numerical model for granular assembles. Geotechnique 1979, 29, 47–65. [Google Scholar] [CrossRef]
- Dong, K.J.; Wang, B.; Yu, A.B. Modeling of Particle Flow and Sieving Behavior on a Vibrating Screen: From Discrete Particle Simulation to Process Performance Prediction. Ind. Eng. Chem. Res. 2013, 52, 11333–11343. [Google Scholar] [CrossRef]
- Wang, Y.C.; Qiu, L.C.; Zhang, W.J. Design and test of friction type vertical disc precision seed-metering device. Northeast Agric. Univ./Trans. Chin. Soc. Agric. Eng. 2012, 28, 22–26. [Google Scholar]
- Gao, Y.P. Design and Experiment of Clamping Corn Precision Seed Harvester. Master’s Thesis, Northeast Agricultural University, Harbin, China, 2021. [Google Scholar] [CrossRef]
- Han, Y.L.; Jia, F.G.; Li, G.R.; Liu, H.R.; Li, J.M.; Chen, P.Y. Numerical analysis of flow pattern transition in a conical silo with ellipsoid particles. Adv. Powder Technol. 2019, 30, 1870–1881. [Google Scholar] [CrossRef]
- Di Renzo, A.; Di Maio, F.P. Comparison of contact-force models for the simulation of collisions in DEM-based granular flow codes. Chem. Eng. Sci. 2003, 59, 525–541. [Google Scholar] [CrossRef]
- Liu, S.D.; Zhou, Z.Y.; Zou, R.P.; Pinson, D.; Yu, A.B. Flow characteristics and discharge rate of ellipsoidal particles in a flat bottom hopper. Powder Technol. 2014, 253, 70–79. [Google Scholar] [CrossRef]
- Lei, X.L.; Liao, Y.T.; Liao, Q.X. Simulation of seed motion in seed feeding device with DEM-CFD coupling approach for rapeseed and wheat. Comput. Electron. Agric. 2016, 131, 29–39. [Google Scholar] [CrossRef]
- Zeng, Z.W.; Ma, X.; Cao, X.L.; Li, Z.H.; Wang, X.C. Application status and prospect of discrete element method in agricultural engineering research. Nongye Jixie Xuebao/Trans. Chin. Soc. Agric. Eng. 2021, 52, 1–20. [Google Scholar]
- Xie, Z.Y.; Zhu, J.F. Simulation of screening process of vibrating screen of soybean combine harvester with discrete element method. Agric. Equip. Technol./Trans. Chin. Soc. Agric. Eng. 2021, 47, 45–47+50. [Google Scholar]
- Yan, D.X.; Yu, J.Q.; Wang, Y.; Zhou, L.; Yu, Y.J. A general modelling method for soybean seeds based on the discrete element method. Powder Technol. 2020, 372, 212–226. [Google Scholar] [CrossRef]


Disclaimer/Publisher’s Note: The statements, opinions and data contained in all publications are solely those of the individual author(s) and contributor(s) and not of MDPI and/or the editor(s). MDPI and/or the editor(s) disclaim responsibility for any injury to people or property resulting from any ideas, methods, instructions or products referred to in the content. |
© 2023 by the authors. Licensee MDPI, Basel, Switzerland. This article is an open access article distributed under the terms and conditions of the Creative Commons Attribution (CC BY) license (https://creativecommons.org/licenses/by/4.0/).